Abstract
Findings on risk detection for having metabolic syndrome (MetS) components, each of which may individually increase the risk of disease and mortality, are limited in young adults. In this study, we aimed to calculate the likelihood of having ≥1 MetS component in normoweight young adults using two different metabolic health criteria. We recruited 1182 normoweight young adults from the Taiwan Survey on the Prevalence of Hypertension, Hyperglycemia, and Hyperlipidemia and the National Health Interview Survey (aged 16–45 years, 39% male, body mass index = 18.5–22.99, all without MetS) and followed them for 5 years. Metabolic health criteria were derived from the Harmonized criteria (unhealthy if showing abnormality in one or two MetS components) and the triglyceride-glucose index (TyG-i; unhealthy if TyG-i was in the >75th percentile). Odds ratio (OR) and 95% confidence interval (CI) estimations for having ≥1 MetS component and for having each MetS component in 5 years were assessed using multivariable-adjusted logistic regression. We observed a significantly increased likelihood of the presence of ≥1 MetS component in the unhealthy group by using the Harmonized criteria and TyG-i (adjusted OR (aOR); 95%CI: 2.64; 2.02–3.45 and 2.1; 1.57–2.82, respectively). The areas under the receiver-operating characteristics curves were 0.679 and 0.652 for the final models using Harmonized and TyG-i criteria, respectively. These findings support the recommendation of treating any metabolic component abnormality, even in young adults without a MetS diagnosis.
1. Introduction
Maintaining metabolic measurements within the ideal range (e.g., ideal body weight and lipid profile) is critical to reduce the incident of cardiovascular disease (CVD) risk [1]. Metabolic syndrome (MetS) is a metabolic disorder cluster, which can be a risk factor for CVD and type 2 diabetes mellitus (T2DM), with insulin resistance as the hallmark. MetS prevalence is increasing, particularly in children and adolescents [2,3]. Of the many MetS diagnostic criteria, the Harmonized Criteria state that a diagnosis should be made in the presence of ≥3 of 5 components—namely elevated blood pressure (BP), elevated triglyceride (TG) level, elevated fasting plasma glucose (FPG) level, elevated waist circumference (WC), and reduced high-density lipoprotein cholesterol (HDL-C) level [4].
MetS diagnosis is the most widely used criterion to define metabolic health status [5,6,7,8]. Studies have combined body mass index (BMI) and metabolic health status to predict diseases such as hypertension [6], CVD [9], and T2DM [10]. TG–glucose index (TyG-i), the product of FPG and TG levels, has been found to be a possible insulin resistance marker in recent years [11,12,13]. TyG-i performance research for distinguishing metabolic health is also increasing [14,15], along with the investigation of its disease prediction performance for hypertension [16], T2DM [17,18], and major adverse cardiovascular events (MACEs) [19]. TyG-i requires only two simple laboratory parameters, which can be measured easily and economically [13].
In addition to MetS diagnosis, every MetS component can increase the all-cause and cardiovascular mortality risk [20]. The presence of 1 or 2 MetS components is also described as stage B in the MetS evolution, and medical treatment is recommended [21]. Individuals without MetS diagnosis but with one or two MetS components would possibly be categorized as healthy, and there may be a late detection. Thus, early identification of people with MetS risk is essential [22]. Moreover, in young adults, MetS prevalence is only 4.8–7%; however, one third of them have at least one MetS component [23]. Thus, compared with MetS diagnosis, detecting the presence of MetS components may be more essential.
Relevant studies on young adults remain limited, particularly in the Chinese population. Young adults are more likely to be in good health. The low absolute risk, calculated using the Systematic COronary Risk Evaluation system for CVD, may reveal a very high relative risk in young adults with a high level of risk factor, which requires intensive lifestyle advice [24]. Most rapid weight gain occurs at the age of 20–40 years [2], stressing the need for understanding metabolic health beyond the progressive body weight in the young population. Young adults have been neglected and have been assessed less for CVD risk [25].
The purpose of this study was to calculate the likelihood of having any MetS component, as defined by Harmonized Criteria [4], in normoweight young adults. Harmonized Criteria were refined from the National Cholesterol Education Program Adult Treatment Panel III definition by grading all the five components as equal, but suggesting a region-specific value for the WC cutoff [4]. This approach was selected as the most appropriate for our study to elucidate the metabolic health dynamic with less interference of BMI. We compared two metabolic health criteria for risk prediction, namely a scoring system based on Harmonized Criteria and TyG-i. Another study objective was to determine the prediction performance of both metabolic health criteria.
2. Materials and Methods
2.1. Study Population
This cohort study was conducted using two datasets: the Taiwan Survey on the Prevalence of Hypertension, Hyperglycemia, and Hyperlipidemia (TwSHHH) and the National Health Interview Survey (NHIS). The NHIS was conducted in 2001 using multistage stratified systematic sampling. The first TwSHHH was conducted in 2002 on NHIS participants. The combination of these two datasets served as our baseline data. The follow-up data were derived from the second TwSHHH in 2007. The inclusion criteria were BMI = 18.5–22.99 kg/m2 (normoweight) and age of 16–45 years. The BMI cutoff used was described as a public health action point in Asia [26]. The exclusion criteria were: prevalent MetS diagnosis as per Harmonized Criteria or selected noncommunicable diseases (NCDs; i.e., T2DM, hypertension, and/or hyperlipidemia at baseline, as diagnosed by a health professional and followed by medical treatment); erroneous and incomplete laboratory values; and loss to follow-up. From 3745 individuals aged 16–45 years, the final sample size selected was 1182 respondents (Figure 1). The TwSHHH was approved by the Institutional Review Board and Ethics Committee of the Bureau of Health Promotion, Department of Health (Taipei, Taiwan; approval number: N201704074). All TwSHHH and NHIS respondents signed an informed consent document before data collection.
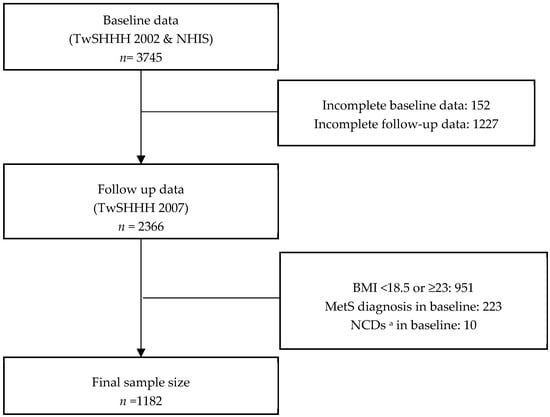
Figure 1.
Sample selection process from 2001 National Health Interview Survey (NHIS) and 2002 and 2007 Taiwan Survey on the Prevalence of Hypertension, Hyperglycemia, and Hyperlipidemia (TwSHHH) respondents. Abbreviations: n, number of respondents; MetS, metabolic syndrome. a Selected noncommunicable disease (i.e., hypertension, dyslipidemia, and type 2 diabetes mellitus (T2DM)).
2.2. MetS
A trained nurse performed the anthropometric measurements under the TwSHHH standardized protocol. BMI was calculated based on measured height and weight (in kg/m2). WC was measured to the closest centimeter. The detailed procedure, including biomarker sampling and analysis, was described previously [27]. MetS components were defined using Harmonized Criteria: (1) elevated WC (≥90 cm for Asian men or ≥80 cm for Asian women), (2) elevated TG level (≥150 mg/dL or receiving drug treatment), (3) reduced HDL-C level (≤40 mg/dL for men or ≤50 mg/dL for women, or receiving drug treatment), (4) elevated systolic/diastolic BP (≥130/85 mmHg or receiving drug treatment), and (5) elevated FPG level (≥100 mg/dL or receiving drug treatment) [4]. We included a person who reported taking hyperlipidemia drugs into both the elevated TG and reduced HDL-C groups.
In our study, we defined an individual as metabolically unhealthy if the respondent showed abnormality in 1 or 2 MetS components, according to Harmonized Criteria. The term unhealthy-Har was used in this study for consistency. The TyG-i was calculated as:
Natural logarithm (Ln) [fasting triglycerides (mg/dL) × fasting glucose (mg/dL)/2 [28].
In the TyG-i scoring system, metabolically unhealthy (unhealthy-TyG) was defined as a respondent with TyG-i ≥ 75th percentile (Q4).
2.3. Outcome
We determined the primary outcome as the presence of ≥1 MetS component in the follow-up. The secondary outcome was the presence of each MetS component in the follow-up.
2.4. Covariates
Age was categorized into three groups: 16–25, >25–35, and >35–45. For alcohol consumption, the products of alcohol frequency and alcohol amount were then categorized into low and high consumption and nonconsumption. Respondents reported positive current alcohol consumption; however, respondents reporting no data on alcohol frequency or consumption amount were categorized under “low-alcohol consumption” (n = 4). Fatty food consumption was assessed using the question, “How often do you eat fatty foods (e.g., fried vegetables, animal fat/skin, poultry fat/skin, fried meat/chicken, yolk, fried tofu, fried bean product/tofu, fried fish, lard, and oily sauce)?” The responses were rated on a 5-point scale and then summed up and divided into two categories by the median, namely, low and high fried-food consumption. Vegetable and fruit consumption were coded as daily and nondaily consumption of fruit and vegetables. Family disease history was based on the self-reported history of selected NCDs, namely T2DM, hypertension, heart disease, stroke, and dyslipidemia, in parents and siblings. The positive family disease history of each NCD was summed. Binary categories for smoking behavior (nonsmoker or smoker) and exercise status (routine exercise or no exercise) were applied. Total cholesterol (TC) level, baseline BMI, family disease history, and age were used as continuous covariates.
2.5. Statistical Analysis
Statistical analyses were performed using STATA software (version 14, StataCorp LLC: College Station, TX, USA). Sample characteristics are presented as proportions based on the metabolic health category. We used Student’s t test (or Wilcoxon rank-sum test for continuous variables) and χ2 (or Fisher exact test for dichotomous measures) to test for differences in baseline and follow-up characteristics between the groups.
We employed logistic regression by using the healthy category as the reference to calculate the odds ratios (ORs) and 95% confidence intervals (95% CIs) of having the outcomes. First, we calculated crude ORs and then developed a model adjusted for sex, age, baseline BMI, TC level, alcohol consumption, fatty food consumption, vegetable and fruit consumption, smoking habit, exercise, and family disease history. To determine the effect of sex and age, we performed sex and age-stratified analysis. To resolve our second research question, we calculated the area under the curve (AUC) of the receiver-operating characteristics (ROC) curve to compare the adjusted model using Harmonized Criteria and TyG-i with the main outcome (i.e., the risk of metabolic unhealthiness in 5 years defined as having ≥1 MetS component). To assess whether the model could improve our prediction, we also compared these criteria to baseline MetS components for the outcome predictions.
3. Results
3.1. Baseline and Follow-Up Characteristics
Our study sample comprised 1182 individuals, 468 (39.6%) of whom were male. Table 1 lists the age, lifestyle, family disease history, and biochemical measures of our sample population. No significant differences in alcohol, vegetable, fruit, fatty food consumption, or exercise were observed between the healthy and unhealthy groups based on Harmonized Criteria or the TyG-i. Both criteria presented significant differences in parent disease history. TyG-i also demonstrated significant differences in sex, smoking habit, sibling disease history, and age. In terms of biomarkers, both criteria demonstrated significant differences in MetS components between the metabolically healthy and unhealthy groups.

Table 1.
Baseline and follow-up characteristics.
3.2. Baseline Prevalence, Follow-Up Prevalence, Incidence, and Remission Rate for MetS Components
Approximately 30% of the study population had at least one MetS component at baseline; this value increased to 40% by 2007. A reduced HDL-C level was the most prevalent MetS component in 2002 (17.9%) and 2007 (21.2%). In the healthy individuals, the incidence and remission of metabolic unhealthiness, defined by having abnormal values in 1 or 2 MetS components, were 327 and 418 per 1000 people, respectively (Table 2). A reduced HDL level was the MetS component with the highest incidence (166 per 1000 people), whereas an elevated FPG level was the MetS component with the highest remission rate (829 per 1000 people).
Table 2.
Baseline prevalence, follow-up prevalence, incidence rate, and remission rate of MetS components, based on Harmonized Criteria.
3.3. Risk of Having ≥1 MetS Component
Table 3 presents the ORs of having ≥1 MetS component and of having each MetS component in metabolically unhealthy individuals based on both criteria (Harmonized Criteria and TyG-i). Compared with that observed for metabolically healthy individuals, the crude OR (cOR) for having ≥1 MetS component within 5 years increased for individuals classified as metabolically unhealthy based on Harmonized Criteria (cOR = 2.87, 95% CI = 2.22–3.71). Increased likelihood of having ≥1 MetS component was also noted if the individual was classified as metabolically unhealthy based on TyG-i (cOR = 2.32, 95% CI = 1.77–3.03; Table 3). The likelihood of having each MetS component also increased if individual was classified as unhealthy, with comparable values being observed between the two criteria.
Table 3.
Odd ratios of outcomes according to the Harmonized Criteria and TyG-i (with healthy individuals as the reference in each criterion).
In a multivariate model, we noted a significant increase in the likelihood of having ≥1 MetS component without much difference in the adjusted ORs (aORs) of Harmonized Criteria (aOR = 2.64, 95% CI = 2.02–3.45) and TyG-i (aOR = 2.11, 95% CI = 1.57–2.82). When an individual exhibited metabolic unhealthiness, the likelihood of having an elevated TG level (Harmonized Criteria [aOR = 3.01, 95% CI = 1.96 –4.61] and TyG-i [aOR = 5.64, 95% CI = 3.58–8.87]) and a reduced HDL level (Harmonized Criteria [aOR = 2.53, 95% CI = 1.85 –3.46] and TyG-i [aOR = 2.63, 95% CI = 1.85–3.74]) within 5-years increased significantly. Being unhealthy as per the TyG-i definition did not significantly increase the likelihood of having an elevated WC (aOR = 1.59, 95% CI = 0.99–2.56) or the likelihood of having an elevated BP (aOR = 1.45, 95% CI = 0.96–2.19). Both criteria indicated no significant increase in the likelihood of having an elevated FPG level in the adjusted models (Table 3).
In the sex- and age-stratified analyses, we used a multivariate-adjusted model to better understand the potential effect of sex and age group on the relationship between being metabolically unhealthy and the likelihood of possessing ≥1 MetS component (Table A1). Being metabolically unhealthy, as defined by Harmonized Criteria or TyG-i, increased the risk of having ≥1 MetS component and each MetS components in sex- and age-stratified analyses.
3.4. ROC Curves for the Risk of Having ≥1 MetS Component
For the Harmonized Criteria and TyG-i, the AUCs were 0.679 (95% CI = 0.648–0.710) and 0.652 (95% CI = 0.620–0.684), respectively, for the final model used to define metabolic health (Figure 2). A prediction model with an AUC value of 0.5 corresponds to random prediction. Higher AUC value indicates better prediction performance and the maximum AUC value is 1.0 [29]. The Harmonized Criteria exhibited significantly better results than did TyG-i in predicting the main outcome. They also demonstrated superior values to all components, whereas TyG-i was superior to only the elevated baseline FPG levels and elevated WC (Table 4).
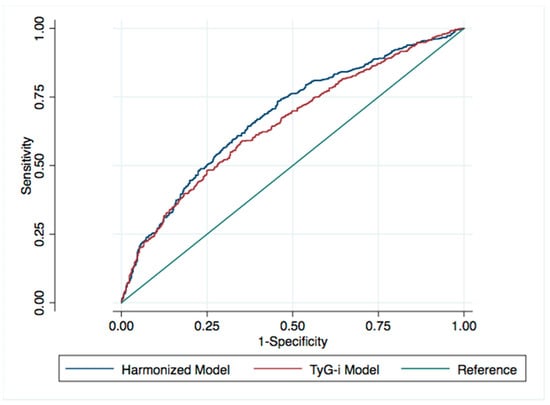
Figure 2.
ROC curve comparison for final models in normoweight young adults. Both models are adjusted for sex, age, baseline BMI, TC, alcohol consumption, fatty food consumption, vegetable and fruit consumption, smoking habit, exercise, and family disease history.
Table 4.
AUC comparison of models for 5-year risk of having ≥1 MetS component.
4. Discussion
In our normoweight young adult population study, being metabolically unhealthy, defined as either having ≥1 MetS component of the Harmonized Criteria or being in the top quartile of TyG-i, increased the likelihood of having ≥1 MetS component in 5 years of follow-up for both definitions, across the sex and age groups. We employed a stricter definition for metabolically unhealthy as being component-free, instead of diagnosis-free, per the Harmonized Criteria. Compared with the Harmonized Criteria-based model, the TyG-i-based model demonstrated lower prediction power.
Our study stressed that the findings were relevant to the youngest age group of 16–45 years, independent of several known risk factors for MetS components, such as age, TC level, BMI, lifestyle, and family disease history. Our results warrant that in this study, the presence of metabolic components drives the increase in the likelihood of having MetS components, rather than BMI. Moreover, this association is less likely to be driven by extreme values because in this study, we excluded individuals who had prevalent MetS diagnosis and NCDs.
The absence of a significant association between metabolic health status and having high WC in 5 years follow-up in age- and sex-stratified analyses was likely due to the association of BMI with WC. Moreover, follow-up WC was more related to baseline BMI and baseline WC (beta-coefficient = 2.72, 95% CI = 2.41–3.03 and beta-coefficient = 0.69, 95% CI = 0.64–0.74, respectively; all in continuous scale), indicating that higher BMI and WC increases the risk of having higher WC, despite implementing a stricter cutoff (because in Asian populations, BMI ≥ 23 is considered overweight). The wide probability range of ORs (i.e., 95% CI) in the likelihood of elevated FPG might be explained by the fact that in this population, the prevalences of this condition were low both at baseline and at follow-up. In Taiwan, T2DM incidence in 20–59-year-old individuals is less than half compared to that in 60–79-year-old individuals, for both sexes [30]. Elevated FPG levels are the least prevalent component of MetS in young adults [31]; their prevalence being even lower than that of the MetS diagnosis [23]. The insulin secretion begins to increase during the early insulin resistance development through β-cell compensation, such that FPG level is maintained at the normal level. The decompensated condition during exhaustion may trigger the elevation of FPG levels [32]. In our target population, young adults were most likely to maintain normal glucose metabolism during the compensated period, both at baseline and at the 5-year follow-up.
The Harmonized Criteria-based model performed significantly better than that based on TyG-i and also significantly better than each baseline MetS criterion. Simplifying the prediction by placing the individuals having 1 or 2 MetS components in the same group did not significantly affect the model performance (Table A2). This showed that the superiority of the model was not driven by a person having two components in the model as an extreme value. Although MetS is related to insulin resistance and TyG-i was shown to be highly predictive of current [12] and future [33] insulin resistance, the association of TyG-i with the study outcome was not stronger than that of MetS components. Martínez et al. [17] concluded that the TyG-i was significantly associated with a higher T2DM risk in a Caucasian adult population (mean age = 55 years). Although the maximum AUC in the current study was 0.679, it was the better than that of TyG-i or individual MetS components. Studies on MetS diagnosis prediction in the overweight individual have reported that prediction does not improve by combining all the MetS components compared to the combination of three components prediction [34]. Predicting MetS components remains challenging, particularly in young healthy people as represented by the non-MetS normoweight population in this study.
In Taiwan, MetS prevalence is approximately 15%; with age its prevalence increases—from 5.2% in those aged 20–29 years to 36.5% in those aged 70–79 years [27]. Moreover, it is higher among Taiwan metropolitan adults [35]. The risk of having MetS components in young adults is critical because they are soon to become middle-aged. In a study, middle-aged men with MetS diagnosis had increased risks of cardiovascular events and total death, regardless of their BMI status, over >30 years of follow-up [36]. If not overall MetS diagnosis, every individual MetS component can increase CVD risk [20]. The detrimental effect increases as the number of these components increases [20,37]. MetS also increases MACE risk and all-cause mortality in patients who undergo revascularization [38]. MetS progression status can also increase the risk of dementia [39].
Our finding supports the recommendation of administering treatment for MetS component abnormality, even if the person has not received a MetS diagnosis [21]. Thus, every health examination result in this age period, such as college admission- or job recruitment-related health check-ups, should be addressed appropriately. Health providers should be informed that no metabolic measurements should be underestimated, irrespective of age. Moreover, this study found that the remission of MetS components in 5 years following the usual care strategy is considerably high. Research analyzing remission in the absence of intervention remains rare [40]. Treating the risk factors should be beneficial because dietary intervention and usual care could lead to MetS remission in >50% of patients with MetS [40]. Because this study included only normoweight young adults, the dynamic interaction between their metabolic health and their MetS status throughout the individuals’ lifecycles requires a wider study because CVD is preventable [41] and every prevention effort is crucial [42].
To the best of our knowledge, this is the first study to investigate the risk of having MetS components in non-MetS normoweight Asian young adults. This study employed a representative sample of the Taiwanese population in 2002 and thus may represent well the normoweight population dynamic in Taiwan; this is because the young adult group, dominated by nonoverweight individuals [43], has increased, coinciding with the global trend [2]. We performed biomarker and anthropometric measurements to classify participants into specific metabolic health status categories. Previous studies have included unhealthy populations and/or demonstrated only the risk of mortality. Moreover, they have included participants with wider age distributions, not analyzed the effect on the age-stratified group, and not focused on young adults [19,44]. The inclusion of stricter metabolic health definitions and younger individuals in our study should aid in providing further insight into the treatment for the MetS-related preclinical condition. Predicting the treatable preclinical condition is essential to reduce the risk through many evidence-based interventions within a sufficient timespan. Risk prediction for objectively measurable outcomes would also make it easier for the health provider to implement risk communication strategies.
This study has several limitations. This study followed respondents for 5 years after the first TwSHHH in 2002; however, the actual length of the metabolic heath condition remained unknown. Moreover, we accommodated medication as a diagnosis criterion, and thus we did not control for medication use during the follow-up. Nevertheless, by excluding individuals taking medication at baseline and by using medication as an outcome criterion, the related interference could have been diminished. In Taiwan, young adults are less likely to take regular medication, such as that for hypertension (3% of 19–44-year old men and 8% of 19–44-year old women) [45]. Our study focused on young adults with normal weight and no MetS diagnosis. The generalizability of our findings may thus be limited, and our results might not be applicable to the general population. Finally, our study outcomes were inclusive for incident and prevalent cases. By using this approach, we demonstrated that the presence of a metabolic abnormality may increase the likelihood of having the same condition in a 5-year timespan.
5. Conclusions
Being metabolically unhealthy, based on either the Harmonized Criteria or TyG-i, is an independent risk factor for MetS component possession in non-MetS normoweight young adults. The MetS components provide adequate, relevant information about the adverse health effects of the condition, even with a current normal BMI; this information may aid patient management. Our findings support the recommendation of treating any metabolic component abnormality, even in young adults without a MetS diagnosis.
Author Contributions
Each participated sufficiently in the conception and design of the work, in the analysis of the data, writing, and editing of the manuscript. Conceptualization, B.S.B. and C.-H.B.; Data curation, Y.-C.F., K.-L.C. and C.-H.B.; Formal analysis, B.S.B., Y.-C.F., C.-C.C. and C.-H.B.; Funding acquisition, K.-L.C. and C.-H.B.; Investigation, B.S.B., Y.-C.F., C.-C.C., K.-L.C. and C.-H.B.; Methodology, B.S.B., C.-C.C. and C.-H.B.; Project administration, C.-H.B.; Resources, C.-H.B.; Software, B.S.B.; Supervision, C.-H.B.; Validation, Y.-C.F. and C.-H.B.; Visualization, B.S.B.; Writing—original draft, B.S.B., Y.-C.F. and C.-H.B.; Writing—review & editing, B.S.B., Y.-C.F., C.-C.C., K.-L.C. and C.-H.B.
Funding
This work was funded by the Health Promotion Administration, Ministry of Health and Welfare, Taiwan (grant no. D1060103) and the Ministry of Science and Technology of Taiwan (grant no. MOST-103-2314-B038-033-MY3). The APC was funded by Taipei Medical University
Conflicts of Interest
The authors declare no conflict of interest. The funders had no role in the design of the study; in the collection, analyses, or interpretation of data; in the writing of the manuscript, or in the decision to publish the results.
Appendix A
Table A1.
OR for outcome of having components, according to the Harmonized Criteria and the TyG index, in normoweight young adults (with healthy individuals as the reference in each criterion).
Table A1.
OR for outcome of having components, according to the Harmonized Criteria and the TyG index, in normoweight young adults (with healthy individuals as the reference in each criterion).
| aOR | 95%CI | aOR | 95%CI | aOR | 95%CI | ||
|---|---|---|---|---|---|---|---|
| Sex Stratification | |||||||
| ≥1 MetS | Elevated TG | Elevated BP | |||||
| Female | Harmonized | 2.78 | (1.96–3.95) z | 3.33 | (1.60–6.94) y | 3.8 | (1.93–7.49) z |
| TyG-I | 2.06 | (1.40–3.05) z | 9.97 | (4.36–22.80) z | 1.21 | (0.59–2.48) | |
| Male | Harmonized | 2.29 | (1.47–3.57) z | 2.95 | (1.72–5.05) z | 1.56 | (0.95–2.58) |
| TyG-I | 2.24 | (1.42–3.53) z | 4.53 | (2.58–7.94) z | 1.62 | (0.96–2.73) | |
| Elevated WC | Reduced HDL | Elevated FPG | |||||
| Female | Harmonized | 1.75 | (1.01–3.04) x | 2.53 | (1.75–3.65) z | 2.93 | (1.00–8.55) x |
| TyG-I | 1.38 | (0.75–2.53) | 2.88 | (1.89–4.40) z | 2.24 | (0.75–6.70) | |
| Male | Harmonized | 1.37 | (0.63–2.96) | 2.41 | (1.28–4.56) y | 1.86 | (0.51–6.80) |
| TyG-I | 2.03 | (0.91–4.53) | 2.31 | (1.18–4.54) x | 1.64 | (0.44–6.12) | |
| Age Stratification | |||||||
| ≥1 MetS | Elevated TG | Elevated BP | |||||
| 15–25 | Harmonized | 2.77 | (1.72–4.46) z | 4.92 | (1.88–12.92) y | 2 | (0.95–4.18) |
| TyG-I | 1.87 | (1.04–3.38) x | 6.14 | (2.31–16.33) z | 2.81 | (1.25–6.30) x | |
| >25–35 | Harmonized | 2.5 | (1.50–4.16) z | 4.24 | (1.95–9.22) z | 1.3 | (0.54–3.12) |
| TyG-I | 2.97 | (1.75–5.03) z | 6.28 | (2.81–14.03) z | 2.16 | (0.91–5.13) | |
| >35–45 | Harmonized | 2.73 | (1.74–4.27) z | 2.05 | (1.02–4.12) x | 2.69 | (1.48–4.91) y |
| TyG-I | 1.71 | (1.09–2.69) x | 5.39 | (2.54–11.43) z | 0.86 | (0.46–1.63) | |
| Elevated WC | Reduced HDL | Elevated FPG | |||||
| 15–25 | Harmonized | 1.65 | (0.78–3.48) | 2.53 | (1.44–4.47) y | - | - |
| TyG-I | 1.73 | (0.72–4.16) | 2.29 | (1.08–4.83) x | - | - | |
| >25–35 | Harmonized | 1.68 | (0.65–4.35) | 2.77 | (1.57–4.89) z | 1.68 | (0.38–7.45) |
| TyG-I | 1.34 | (0.51–3.50) | 3.28 | (1.80–5.96) z | 1.33 | (0.33–5.37) | |
| >35–45 | Harmonized | 1.58 | (0.76–3.26) | 2.87 | (1.65–4.97) z | 3.88 | (1.16–13.03) x |
| TyG-I | 1.72 | (0.80–3.66) | 2.64 | (1.47–4.74) y | 3.17 | (0.89–11.31) | |
aOR, adjusted odd ratio, adjusted for sex, age, baseline body mass index (BMI), total cholesterol (TC), alcohol consumption, fatty food consumption, vegetable and fruit consumption, smoking habit, exercise, and family disease history. MetS, metabolic syndrome; TG, triglyceride; TyG-i, TG–glucose index; BP, blood pressure; WC, waist circumference; HDL, high-density lipoprotein; FPG, fasting plasma glucose. x p < 0.05, y p < 0.01, z p < 0.001.
Table A2.
OR of outcome according to the number of components based on the Harmonized Criteria in normoweight young adults.
Table A2.
OR of outcome according to the number of components based on the Harmonized Criteria in normoweight young adults.
| Outcome | ||||||
|---|---|---|---|---|---|---|
| ≥1 MetS | Elevated TG | Elevated BP | Elevated WC | Reduced HDL | Elevated FPG | |
| MetS comp. | cOR 95%CI | cOR 95%CI | cOR 95%CI | cOR 95%CI | cOR 95%CI | cOR 95%CI |
| 1 Comp. | 2.69 | 2.56 | 1.89 | 1.59 | 2.51 | 1.07 |
| (2.04–3.55) z | (1.68–3.89) z | (1.27–2.81) y | (1.01–2.50) x | (1.84–3.43) z | (0.38–3.00) | |
| 2 Comp. | 3.77 | 5.29 | 4.1 | 3 | 3.48 | 8.95 |
| (2.25–6.34) z | (2.92–9.59) z | (2.32–7.27) z | (1.55–5.79) y | (2.07–5.85) z | (3.72–21.53) z | |
| aOR 95%CI | aOR 95%CI | aOR 95%CI | aOR 95%CI | aOR 95%CI | aOR 95%CI | |
| 1 Comp. | 2.56 | 2.69 | 1.78 | 1.41 | 2.28 | 0.97 |
| (1.92–3.42) z | (1.69–4.28) z | (1.16–2.72) y | (0.87–2.27) | (1.63–3.19) z | (0.33–2.87) | |
| 2 Comp. | 3.01 | 4.28 | 2.89 | 2.2 | 3.93 | 7.73 |
| (1.77–5.14) z | (2.17–8.45) z | (1.54–5.42) z | (1.08–4.46) x | (2.23–6.92) z | (2.96–20.19) z | |
Abbreviations, same as in Table A1. Comp., component. Adjusted for sex, age, baseline BMI, TC, alcohol consumption, fatty food consumption, vegetable and fruit consumption, smoking habit, exercise, and family disease history. x p < 0.05, y p < 0.01, z p < 0.001.
References
- Folsom, A.R.; Shah, A.M.; Lutsey, P.L.; Roetker, N.S.; Alonso, A.; Avery, C.L.; Miedema, M.D.; Konety, S.; Chang, P.P.; Solomon, S.D. American Heart Association’s Life’s Simple 7: Avoiding Heart Failure and Preserving Cardiac Structure and Function. Am. J. Med. 2015, 128, 970–976. [Google Scholar] [CrossRef] [PubMed]
- Ng, M.; Fleming, T.; Robinson, M.; Thomson, B.; Graetz, N.; Margono, C.; Mullany, E.C.; Biryukov, S.; Abbafati, C.; Abera, S.F.; et al. Global, regional, and national prevalence of overweight and obesity in children and adults during 1980–2013: A systematic analysis for the Global Burden of Disease Study 2013. Lancet 2014, 384, 766–781. [Google Scholar] [CrossRef]
- Poyrazoglu, S.; Bas, F.; Darendeliler, F. Metabolic syndrome in young people. Curr. Opin. Endocrinol. Diabetes Obes. 2014, 21, 56–63. [Google Scholar] [CrossRef]
- Alberti, K.G.M.M.; Eckel, R.H.; Grundy, S.M.; Zimmet, P.Z.; Cleeman, J.I.; Donato, K.A.; Fruchart, J.C.; James, W.P.T.; Loria, C.M.; Smith, S.C. Harmonizing the metabolic syndrome: A joint interim statement of the international diabetes federation task force on epidemiology and prevention; National heart, lung, and blood institute; American heart association; World heart federation; International. Circulation 2009, 120, 1640–1645. [Google Scholar] [CrossRef] [PubMed]
- Wildman, R.P. The Obese Without Cardiometabolic Risk Factor Clustering and the Normal Weight With Cardiometabolic Risk Factor Clustering. Arch. Intern. Med. 2008, 168, 1617. [Google Scholar] [CrossRef]
- Kuwabara, M.; Kuwabara, R.; Hisatome, I.; Niwa, K.; Roncal-Jimenez, C.A.; Bjornstad, P.; Andres-Hernando, A.; Sato, Y.; Jensen, T.; Garcia, G.; et al. “Metabolically Healthy” Obesity and Hyperuricemia Increase Risk for Hypertension and Diabetes: 5-year Japanese Cohort Study. Obesity 2017, 25, 1997–2008. [Google Scholar] [CrossRef]
- Zheng, R.; Zhou, D.; Zhu, Y. The long-term prognosis of cardiovascular disease and all-cause mortality for metabolically healthy obesity: A systematic review and meta-analysis. J. Epidemiol. Community Health 2016, 70, 1024–1031. [Google Scholar] [CrossRef] [PubMed]
- Hashimoto, Y.; Hamaguchi, M.; Tanaka, M.; Obora, A.; Kojima, T.; Fukui, M. Metabolically healthy obesity without fatty liver and risk of incident type 2 diabetes: A meta-analysis of prospective cohort studies. Obes. Res. Clin. Pract. 2018, 12, 4–15. [Google Scholar] [CrossRef]
- Mongraw-Chaffin, M.; Foster, M.C.; Anderson, C.A.M.; Burke, G.L.; Haq, N.; Kalyani, R.R.; Ouyang, P.; Sibley, C.T.; Tracy, R.; Woodward, M.; et al. Metabolically Healthy Obesity, Transition to Metabolic Syndrome, and Cardiovascular Risk. J. Am. Coll. Cardiol. 2018, 71, 1857–1865. [Google Scholar] [CrossRef]
- Soriguer, F.; Gutiérrez-Repiso, C.; Rubio-Martín, E.; García-Fuentes, E.; Almaraz, M.C.; Colomo, N.; De Antonio, I.E.; De Adana, M.S.R.; Chaves, F.J.; Morcillo, S.; et al. Metabolically healthy but obese, a matter of time? Findings from the prospective pizarra study. J. Clin. Endocrinol. Metab. 2013, 98, 2318–2325. [Google Scholar] [CrossRef]
- Lee, S.H.; Han, K.; Yang, H.K.; Kim, H.S.; Cho, J.H.; Kwon, H.S.; Park, Y.M.; Cha, B.Y.; Yoon, K.H. A novel criterion for identifying metabolically obese but normal weight individuals using the product of triglycerides and glucose. Nutr. Diabetes 2015, 5, e149. [Google Scholar] [CrossRef]
- Guerrero-Romero, F.; Villalobos-Molina, R.; Jiménez-Flores, J.R.; Simental-Mendia, L.E.; Méndez-Cruz, R.; Murguía-Romero, M.; Rodríguez-Morán, M. Fasting Triglycerides and Glucose Index as a Diagnostic Test for Insulin Resistance in Young Adults. Arch. Med. Res. 2016, 47, 382–387. [Google Scholar] [CrossRef]
- Khan, S.H.; Sobia, F.; Niazi, N.K.; Manzoor, S.M.; Fazal, N.; Ahmad, F. Metabolic clustering of risk factors: Evaluation of Triglyceride-glucose index (TyG index) for evaluation of insulin resistance. Diabetol. Metab. Syndr. 2018, 10, 1–8. [Google Scholar] [CrossRef]
- Yu, X.; Wang, L.; Zhang, W.; Ming, J.; Jia, A.; Xu, S.; Li, Q.; Ji, Q. Fasting triglycerides and glucose index is more suitable for the identification of metabolically unhealthy individuals in the Chinese adult population: A nationwide study. J. Diabetes Investig. 2018, 10–12. [Google Scholar] [CrossRef]
- Moon, S.; Park, J.S.; Ahn, Y. The Cut-off Values of Triglycerides and Glucose Index for Metabolic Syndrome in American and Korean Adolescents. J. Korean Med. Sci. 2017, 32, 427–433. [Google Scholar] [CrossRef]
- Zheng, R.; Mao, Y. Triglyceride and glucose (TyG) index as a predictor of incident hypertension: A 9-year longitudinal population-based study. Lipids Health Dis. 2017, 16, 1–7. [Google Scholar] [CrossRef]
- Martinez, J.A.; Navarro-González, D.; Fernández-Montero, A.; Sánchez-Íñigo, L.; Pastrana-Delgado, J. Triglyceride-glucose index (TyG index) in comparison with fasting plasma glucose improved diabetes prediction in patients with normal fasting glucose: The Vascular-Metabolic CUN cohort. Prev. Med. (Baltim.) 2016, 86, 99–105. [Google Scholar]
- Low, S.; Khoo, K.C.J.; Irwan, B.; Sum, C.F.; Subramaniam, T.; Lim, S.C.; Wong, T.K.M. The role of triglyceride glucose index in development of Type 2 diabetes mellitus. Diabetes Res. Clin. Pract. 2018, 143, 43–49. [Google Scholar] [CrossRef]
- Sánchez-Íñigo, L.; Navarro-González, D.; Fernández-Montero, A.; Pastrana-Delgado, J.; Martínez, J.A. The TyG index may predict the development of cardiovascular events. Eur. J. Clin. Investig. 2016, 46, 189–197. [Google Scholar] [CrossRef]
- Ho, J.S.; Cannaday, J.J.; Barlow, C.E.; Mitchell, T.L.; Cooper, K.H.; FitzGerald, S.J. Relation of the Number of Metabolic Syndrome Risk Factors With All-Cause and Cardiovascular Mortality. Am. J. Cardiol. 2008, 102, 689–692. [Google Scholar] [CrossRef]
- Sperling, L.S.; Mechanick, J.I.; Neeland, I.J.; Herrick, C.J.; Després, J.P.; Ndumele, C.E.; Vijayaraghavan, K.; Handelsman, Y.; Puckrein, G.A.; Araneta, M.R.G.; et al. The CardioMetabolic Health Alliance Working Toward a New Care Model for the Metabolic Syndrome. J. Am. Coll. Cardiol. 2015, 66, 1050–1067. [Google Scholar] [CrossRef]
- Hadjiyannakis, S. The metabolic syndrome in children and adolescents. Paediatr. Child Health (Oxf.) 2005, 10, 41–47. [Google Scholar] [CrossRef]
- Nolan, P.B.; Carrick-Ranson, G.; Stinear, J.W.; Reading, S.A.; Dalleck, L.C. Prevalence of metabolic syndrome and metabolic syndrome components in young adults: A pooled analysis. Prev. Med. Rep. 2017, 7, 211–215. [Google Scholar] [CrossRef]
- Piepoli, M.F.; Hoes, A.W.; Agewall, S.; Albus, C.; Brotons, C.; Catapano, A.L.; Cooney, M.T.; Corrà, U.; Cosyns, B.; Deaton, C.; et al. 2016 European Guidelines on cardiovascular disease prevention in clinical practice. Eur. Heart J. 2016, 37, 2315–2381. [Google Scholar] [CrossRef]
- Tran, D.M.T.; Zimmerman, L.M. Cardiovascular Risk Factors in Young Adults: A Literature Review. J. Cardiovasc. Nurs. 2015, 30, 298–310. [Google Scholar] [CrossRef]
- Barba, C.; Cavalli-Sforza, T.; Cutter, J.; Darnton-Hill, I.; Deurenberg, P.; Deurenberg-Yap, M.; Gill, T.; James, P.; Ko, G.; Nishida, C. Appropriate body-mass index for Asian populations and its implications for policy and intervention strategies. Lancet 2004, 363, 157–163. [Google Scholar]
- Hwang, L.C.; Bai, C.H.; Chen, C.J. Prevalence of obesity and metabolic syndrome in Taiwan. J. Formos. Med. Assoc. 2006, 105, 626–635. [Google Scholar] [CrossRef]
- Simental-Mendía, L.E.; Rodríguez-Morán, M.; Guerrero-Romero, F. The Product of Fasting Glucose and Triglycerides As Surrogate for Identifying Insulin Resistance in Apparently Healthy Subjects. Metab. Syndr. Relat. Disord. 2008, 6, 299–304. [Google Scholar] [CrossRef]
- Wu, Y.C.; Lee, W.C. Alternative performance measures for prediction models. PLoS ONE 2014, 9, e91249. [Google Scholar] [CrossRef]
- Jiang, Y.D.; Chang, C.H.; Tai, T.Y.; Chen, J.F.; Chuang, L.M. Incidence and prevalence rates of diabetes mellitus in Taiwan: Analysis of the 2000-2009 Nationwide Health Insurance database. J. Formos. Med. Assoc. 2012, 111, 599–604. [Google Scholar] [CrossRef]
- Einhorn, D.; Reaven, G.M.; Cobin, R.H.; Ford, E.; Ganda, O.P.; Handelsman, Y.; Hellman, R.; Jellinger, P.S.; Kendall, D.; Krauss, R.M.; et al. American College of Endocrinology position statement on the insulin resistance syndrome. Endocr. Pract. 2003, 9, 237–252. [Google Scholar]
- Sun, H.L.; Pei, D.; Lue, K.H.; Chen, Y.L. Uric acid levels can predict metabolic syndrome and hypertension in adolescents: A 10-year longitudinal study. PLoS ONE 2015, 10, 1–10. [Google Scholar] [CrossRef]
- Lee, S.H.; Yang, H.K.; Ha, H.S.; Lee, J.H.; Kwon, H.S.; Park, Y.M.; Yim, H.W.; Kang, M.I.; Lee, W.C.; Son, H.Y.; et al. Changes in metabolic health status over time and risk of developing type 2 diabetes a prospective cohort study. Medicine (USA) 2015, 94, 1–8. [Google Scholar]
- Hosseinpanah, F.; Nazeri, P.; Ghareh, S.; Tohidi, M.; Azizi, F. Predictors of the incident metabolic syndrome in healthy obese subjects: A decade of follow-up from the Tehran Lipid and Glucose Study. Eur. J. Clin. Nutr. 2014, 68, 295–299. [Google Scholar] [CrossRef][Green Version]
- Lin, C.C.; Liu, C.S.; Lai, M.M.; Li, C.I.; Chen, C.C.; Chang, P.C.; Lin, W.Y.; Lee, Y.D.; Lin, T.; Li, T.C. Metabolic syndrome in a Taiwanese metropolitan adult population. BMC Public Health 2007, 7, 1–5. [Google Scholar] [CrossRef]
- Ärnlöv, J.; Ingelsson, E.; Sundström, J.; Lind, L. Impact of body mass index and the metabolic syndrome on the risk of cardiovascular disease and death in middle-aged men. Circulation 2010, 121, 230–236. [Google Scholar] [CrossRef]
- Tsai, S.P.; Wen, C.P.; Chan, H.T.; Chiang, P.H.; Tsai, M.K.; Cheng, T.Y.D. The effects of pre-disease risk factors within metabolic syndrome on all-cause and cardiovascular disease mortality. Diabetes Res. Clin. Pract. 2008, 82, 148–156. [Google Scholar] [CrossRef]
- Tie, H.T.; Shi, R.; Li, Z.H.; Zhang, M.; Zhang, C.; Wu, Q.C. Risk of major adverse cardiovascular events in patients with metabolic syndrome after revascularization: A meta-analysis of eighteen cohorts with 18457 patients. Metabolism 2015, 64, 1224–1234. [Google Scholar] [CrossRef]
- Fan, Y.C.; Chou, C.C.; You, S.L.; Sun, C.A.; Chen, C.J.; Bai, C.H. Impact of Worsened Metabolic Syndrome on the Risk of Dementia: A Nationwide Cohort Study. J. Am. Heart Assoc. 2017, 6, e004749. [Google Scholar] [CrossRef]
- Den Engelsen, C.; Gorter, K.J.; Salomé, P.L.; Van Den Donk, M.; Rutten, G.E. Remission of screen-detected metabolic syndrome and its determinants: An observational study. BMC Public Health 2012, 12, 778. [Google Scholar] [CrossRef]
- Najam, O.; Ray, K.K. Where to now in cardiovascular disease prevention. Atherosclerosis 2016, 251, 483–489. [Google Scholar] [CrossRef]
- Lemieux, I. Metabolic Syndrome Diagnosis: The Sooner the Better. Metab. Syndr. Relat. Disord. 2018, 16, 205–207. [Google Scholar] [CrossRef]
- Yeh, C.J.; Chang, H.Y.; Pan, W.H. Time trend of obesity, the metabolic syndrome and related dietary pattern in Taiwan: From NAHSIT 1993–1996 to NAHSIT 2005–2008. Asia Pac. J. Clin. Nutr. 2011, 20, 292–300. [Google Scholar]
- Bradshaw, P.T.; Reynolds, K.R.; Wagenknecht, L.E.; Ndumele, C.E.; Stevens, J. Incidence of components of metabolic syndrome in the metabolically healthy obese over 9 years follow-up: The Atherosclerosis Risk in Communities study. Int. J. Obes. 2018, 42, 295–301. [Google Scholar] [CrossRef]
- Pan, W.H.; Chang, H.Y.; Yeh, W.Y.; Hsiao, S.Y.; Hung, Y.T. Prevalence, awareness, treatment and control of hypertension in Taiwan: Results of Nutrition and Health Survey in Taiwan (NAHSIT) 1993–1996. J. Hum. Hypertens. 2001, 15, 793–798. [Google Scholar] [CrossRef]
© 2019 by the authors. Licensee MDPI, Basel, Switzerland. This article is an open access article distributed under the terms and conditions of the Creative Commons Attribution (CC BY) license (http://creativecommons.org/licenses/by/4.0/).