Abstract
This study identifies the critical factors that affect motorcycle crash severity based on Korean motorcycle crash data in 2009. Motorcyclists, the environment, roadways, other vehicles involved in the crashes, and traffic flow characteristics were used as variables for identifying critical factors. Multivariable statistical methods were used to analyze the data, including categorical principal components analysis (CatPCA) and nonlinear canonical correlation analysis (NLCCA). The results indicate that the following factors are the most critical in increasing motorcycle crash severity: age (motorcyclists in their teens and over fifty years old), motorcycle speed over 30 km/h, speed over 50 km/h for other vehicles involved in the crash, crashes with heavy vehicles such as buses and trucks, crashes on roadways less than six meters wide, crashes at curved sections, crashes at basic roadway segments without any speed control facilities, and head-on crashes. These findings are expected to serve as a valuable reference for formulating remedial policy measures to decrease the severity of motorcycle crashes on roadways in the Seoul metropolitan area of South Korea.
1. Introduction
People in South Korea rarely use motorcycles as their main mode of transportation or as a mode of recreational travel. Instead, motorcycles are predominantly used for food and/or mail deliveries [1]. The majority of such motorcyclists are in their late teens and early twenties, and they are inexperienced in most cases. Motorcycle crashes account for 5% of the total traffic crashes in Korea, but death by motorcycle crash represents about 10% of the total deaths from traffic crashes [1]. Thus, evaluating the factors that affect the severity of motorcycle crashes is an important step towards developing effective policy measures and technologies to reduce the severity.
The main objective of this study is to review and evaluate the critical factors that affect motorcycle crash severity on roadways in the Seoul metropolitan area of South Korea. We also propose remedial policy measures to reduce motorcycle crash severity. The following factors related to motorcycle crashes were evaluated: crash characteristics, motorcyclist factors, characteristics of the other vehicles, and drivers involved in the crash, roadway factors, and environmental factors. These factors involve various types of measurement scales, such as nominal, ordinal, and interval scales, which makes the complexity and dimensionality of the combined dataset quite high.
Most previous studies on motorcycle crash severity have applied linear statistical methods, in which the results are invariant under any linear transformation of the variables [2]. However, nonlinear versions based on optimal scaling techniques have been developed for use with nominally scaled variables and ordinal variables. Therefore, this study applies two nonlinear optimal scaling methods to assign numerical quantifications to the categories of each variable. This allows standard procedures to be used to obtain a solution for the quantified variables. First, to reduce the original set of variables into smaller sets of uncorrelated components [3], categorical principal components analysis (CatPCA) was applied to extract the principal components of motorcycle crashes. Second, based on the CatPCA results, a nonlinear canonical correlation analysis (NLCCA) was performed to identify the relationship between the extracted principal components and crash severity. Interpretations and discussions of the results are presented, followed by a summary of key findings and recommendations.
2. Literature Review
2.1. Motorcycle Crash Analysis
There are various approaches to identify the relationships among motorcycle crash severity, the types and occurrence rates, and causal factors. These approaches have mainly dealt with seven issues: (1) helmet use, (2) driving under the influence (DUI), (3) inexperience and recklessness, (4) speeding, (5) road geometry, (6) weather condition, and (7) vehicle type.
Table 1 shows some examples with the methodologies used, and key findings. The methodologies include simple statistical methods such as descriptive statistics and Chi-square tests, as well as advanced statistical methods such as logit models, two-way fixed effects models, random-effects Poisson regression, ordered or proportional odds models, Cox models, and Bayesian approaches. These models are restricted in their ability to explain the joint relationship between multiple dependent variable sets and multiple independent variable sets. Moreover, the regression models (except for the Cox model) require assumptions about the underlying distribution for the observed dataset.

Table 1.
Example of recent motorcycle crash studies.
2.2. Nonlinear Optimal Scaling Method Applied to Transportation Fields
The causes of traffic crashes are generally classified into vehicle, driver (or human), and roadway factors, and each factor includes various types of variables such as numerical, ordinal, and nominal scales. Linear statistical methods, including regression, logit, discriminant analysis, and factor analysis, are limited to numerical variables and categorical variables of the dummy type. Moreover, the analysis of crash dataset needs to accommodate multiple dependent and independent variables. Canonical correlation analysis (CCA) deals with two variable sets (i.e., a dependent set and an independent set), but it only deals with scaled interval or dummy variables. This restriction can limit the usefulness of conventional CCA in investigations of traffic crash characteristics.
Nonlinear canonical correlation analysis (NLCCA) was developed to analyze the relationships among more than two sets of nominal or ordinal variables (more than one independent set and more than one dependent set). It is similar to CCA, but it quantifies (or rescales) the categories of these variables. As a result, nonlinear relationships among the variable sets can be analyzed, and the sets can be compared to an unknown compromise set defined by the object scores [25]. The results can then be interpreted easily using a graphical display. Graphical interpretation is a useful tool for exploring transportation data, which includes numerical, ordinal, and nominal types of data. Moreover, no probabilistic assumptions are made for the underlying distribution of the observed data.
In spite of such advantages, only a few studies have applied NLCCA to the transportation sector. Golob [2] used NLCCA to analyze the relationships between the activity patterns in home-based trip chains, and the characteristics of the people making the chained trips. Hensher and Golob [26] used a geometric perspective to describe the application of NLCCA in transportation research. Golob and Recker [27], and Golob et al. [28] used NLCCA to describe the relationships between crash characteristics and other crash causal factors. d’Ovidio et al. [29] applied CatPCA to choose principal components to investigate passenger satisfaction with the quality of public transportation services.
3. Methodology
3.1. Overview
Figure 1 presents the overall process used for this study. The first step is to arrange the dataset. This step includes the selection of recorded crash data and the definition of candidate variables for the analysis. Scholars in safety analysis are often faced with a large number of variables, and they wish to reduce them to a small number of composites with as little loss of information as possible. As a second step, a state-of-the-art computer program called CatPCA is used to reduce the different types of multivariate data. CatPCA is a good tool for analyzing complicated multivariate data, which consist of nominal, ordinal, and numerical variables [30]. In the third step, categorical variables of any noninterval variables obtained from CatPCA are optimally scaled by NLCCA, which is called the OVERALS algorithm. NLCCA is also used to explore the nonlinear relationships between various crash attributes and injury severity. Finally, interpretations and discussions are based on the NLCCA results.
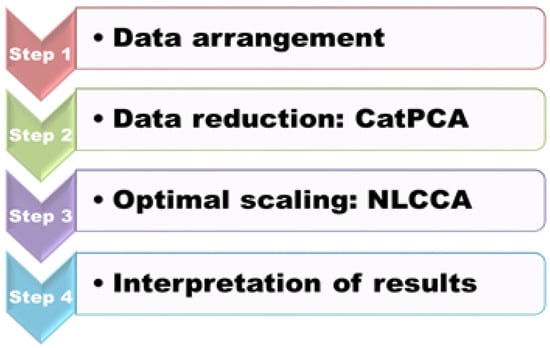
Figure 1.
Overall framework for traffic safety analysis.
3.2. Categorical Principal Component Analysis
Although principal component analysis (PCA) is considered to be an appropriate method to perform data reduction [31], it basically suffers from two limitations: the linear relationship assumption between variables, and the variable measurement assumption to be scaled at the numeric level. These assumptions are not justified in traffic safety analyses, which are associated with nonlinear relationships among variables, as well as with nominal and ordinal variables (e.g., [32,33,34]). Particularly, if this relationship is mis-specified, the results can be heavily biased [35]. However, nonlinear PCA can incorporate nominal and ordinal variables, and handle nonlinear relationships between variables [36]. CatPCA in SPSS (Statistical Package for the Social Sciences) provides these features.
In CatPCA, the optimal quantification process turns a qualitative nominal or ordinal variable into a quantitative numerical variable [3], and the resulting nonlinearly transformed variable can be represented as a vector in the space that is determined for the objects (or crashes in this study) [30]. Each variable is associated with a set of component loadings, one for each dimension. These loadings are correlations between the variables and the principal components, and they give coordinates for the variables to represent them as vectors in the principal component space [30]. Component loadings are comparable with factor loadings in a factor analysis. Specifically, they are equal to a Pearson correlation between the principal component, and a quantified variable if there is no missing observation.
In the graphical representation of the result (i.e., component loading plots), the graph is interpreted by using the four quadrants based on the origin (0,0). As indicated by Linting et al. [36], in the case of long vectors, the cosines of the angles between the vectors imply the correlations between the quantified variables. If associated component loadings of the variables are closely plotted within a quadrant, they are interpreted as principal components that positively affect each other. If the component loadings of a variable are within a diagonal quadrant, the variable is interpreted to be a negatively impacting factor. Such principal components increase the explanatory power of the variable, due to the increasing values of components loadings when they are far from the origin.
Given the number of dimensions in the analysis N, CatPCA maximizes the sum of the largest eigenvalues of the correlation matrix between variables transformed into ordinal or nominal scales. The overall goodness-of-fit measure is the sum of the eigenvalues, which is equal to the total variance accounted for (VAF). The VAF in each dimension for each variable is equal to the component loading squared. The component loading ranges between −1 and 1, and it is the correlation between the transformed variable and a principal component in a particular dimension [30]. Although there is no guideline for acceptable component loading values, Garson [37] suggested a minimum value of ±0.30. A more detailed explanation of CatPCA and its mathematical formulations can be found in the handbook by Meulman et al. [30].
3.3. Nonlinear Canonical Correlation Analysis
NLCCA was first developed by a doctoral student in the Department of Data Theory at the University of Leiden in the Netherlands [38] and it was documented by Gifi [39] and van der Burg and de Leeuw [40]. The objective of NLCCA is to find what is common between sets of variables. NLCCA is a form of homogeneity analysis with restrictions. Homogeneity analysis determines transformations of the categories of variables to maximize homogeneity, and it is the basic technique in the Gifi system of descriptive nonlinear multivariate analysis. The Gifi system is characterized by the optimal scaling of categorical variables, which is implemented by using alternating least squares (ALS). The ALS algorithm is known as the OVERALS algorithm [39,41]. Unlike traditional canonical correlation analysis, no assumptions are made about the variables’ distributions, nor are the variables’ presumed to be related in a linear way [42]. Moreover, the algorithm can handle more than two sets of variables. OVERALS is available in SPSS Categories 10.0 and later versions [43].
In this study, NLCCA starts with the results of CatPCA (i.e., identified principal components). A two-dimensional analysis method can be used to analyze the relationship between crash characteristics and each influencing factor. In this method, it is estimated that there is a correlation between orthogonal factors or factors in the same quadrant. In the case of crash severity, there is a correlation among the ordinal and orthogonal variables, which necessitates a two-dimensional analysis. OVERALS in SPSS can assess commonalities between different sets of variables of the same objects. By using this tool, relationships and similarities among and within the sets of variables are analyzed. The result can be evaluated by loss and fit measures [44,45]. The interpretation of which variables are related and to what extent is based on the centroid plots.
As for the loss and fit measures, the maximum value of the loss is between 0 and K in case of a K-dimensional solution [46]. The loss can be divided over dimensions, and one minus the loss per dimension corresponds to the eigenvalue, which ranges from 0 to 1. The eigenvalue corresponds to goodness-of-fit measures, and the sum of eigenvalues is called the total fit. Therefore, the fit is maximally equal to the number of dimensions, and the loss is equal to K minus the total fit. Generally, no absolute value can be given as to what fit is acceptable, although fit values under 0.5 are considered to be on the brink [47].
Centroid plots can be interpreted easily by using graphical methods such as component loading plots in CatPCA. These plots show how well variables separate groups of objects with centroids at the center of gravity of the objects. To understand the relationships between variables, matching clusters of categories in centroid plots need to be identified [25]. These plots are applied to better understand individual relationships among variables. The interpretation of these plots is similar to that of the component loadings in CatPCA. That is, the distance from the origin to each variable point approximates the importance of that variable. Thus, the most effective variables in relationships among variable sets are the ones that are positioned far away from the origin. Furthermore, close variables have more similarities than variables that are far apart in a quadrant. The correlation between two variables in the centroid plot can be interpreted by using the cosine of the angle between lines from the origin to each variable: (1) positive correlation if the angle is acute, (2) negative correlation if the angle is obtuse, and (3) no correlation for right angles [48].
4. Data Arrangement
The dataset was collected from the Traffic Accident Analysis System (TAAS) of the Korea Roadway Traffic Authority). The analysis was based on the 2009 data of motorcycle crashes in the Seoul metropolitan area. A total of 4685 motorcycle crashes occurred in this area during the analysis period. Of these, only 2593 cases were associated with motorcycle-to-vehicle crashes. Motorcycle crash data from TAAS includes crash characteristics, motorcyclist characteristics, vehicle driver characteristics, roadway characteristics, and environmental characteristics, as shown in Table 2, and data were composed of five sets with respect to the different characteristics, and each variable was categorized based on the original categories in the database.
Table 2.
Definition of variable sets.
- Set 1: Crash characteristics were divided into the crash severity of the motorcyclist, crash type, and crash location. According to the TAAS classification, the severity of crashes was categorized into four groups: ‘death’, ‘incapacitating injury’, ‘visible injury’, and ‘complaint of pain’. Crash type was classified into five groups: ‘head-on crash’, ‘crash while parking’, ‘rear-end crash’, ‘broadside crash’, and ‘other cases’. Lastly, crash locations were categorized into ‘intersections’, ‘basic roadway segments’, and ‘crosswalks’.
- Set 2: Environmental characteristics have a direct influence on crashes, particularly in the case of two-wheeled motorcycles. For example, a wet roadway surface often leads to slipping while turning and stopping. This study classifies environmental factors into three categories: ‘weather’, ‘season’, and ‘roadway surface condition’.
- Set 3: Motorcyclist characteristics can be divided using information about the motorcyclists and their motorcycling characteristics. Information about the motorcyclist included ‘age’, ‘gender’, and ‘job’, while motorcycling characteristics included ‘DUI’, ‘crash time’, and ‘crash speed (hereafter Speed1)’. Crash speed is recorded as crash information estimated through various sources such as closed-circuit television (CCTV) data, statements of crash-involved drivers, and witness in the vicinity of a crash, and engineering estimations of post-crash trajectories and skid marks at the scene [1]. The crash time was classified into ‘AM peak time’ (7:00 to 9:00), ‘midday time’ (9:00 to 17:00), ‘PM peak time’ (17:00 to 20:00), and ‘night time’ (20:00 to 7:00).
- Set 4: Characteristics regarding other crashing vehicles were categorized into driver factors, such as ‘gender’, ‘age’, and ‘DUI’, as well as vehicle factors, such as the ‘size of other drivers’ vehicle’ and ‘speed’.
- Set 5: Roadway characteristics include geometric factors such as horizontal and vertical alignment, median types, and the width of the roadway section. The factor of horizontal alignment was classified as ‘straight’ sections and ‘curved’ sections. Similarly, the vertical alignment factor is classified as ‘uphill’, ‘downhill’, and ‘flat’ sections. The type of median is categorized into three categories: ‘none’ (18.9%), ‘painted marking’ (70.3%), and ‘barrier’ (10.9%). Finally, the directional roadway width is classified as an ordinal variable measure.
5. Multivariate Statistical Analysis
5.1. Data Reduction by Categorical Principal Component Analysis
5.1.1. Selection of Principal Components
Table 3 summarizes the results of the data reduction by CatPCA. Component loading refers to the explanatory power, and the factors with high component loadings can be considered as a principal factor [3]. In this table, variables associated with the greatest component loading values are ‘weather’ and ‘road surface’, but the variables ‘season’ and ‘uphill’ have the lowest values. Based on the minimum component loading value by Garson [37], 11 principal components were selected.
Table 3.
Component loadings variable in CatPCA.
The intercorrelations of the variables were analyzed to identify multicollinearities between selected principal components. As a result, the variables ‘weather’ and ‘roadway surface condition’ had a comparatively high correlation value of 0.721, meaning that they are most likely collinear. Similarly, the correlation between the ‘night’ and ‘midday’ variables was 0.594. Because of this multicollinearity, the variables ‘weather’ and ‘midday’ were thus excluded from the analysis. Lastly, although the component loading for the variables ‘Speed2’, ‘horizontal alignment’, and ‘DUI1’ were low, they were included in the analysis due to their potential impacts on crash severity. As shown in Table 4, 11 principal components were selected as independent variables for NLCCA.
Table 4.
Selected principal components.
5.1.2. Component Loading Plot
Regardless of the principal component selection, the component loadings plots in Figure 2 are presented, to illustrate the relationship among the variables. This figure shows two-dimensional scatter plots organized as a 4 × 4 array. For example, the picture (Figure 2 (3)) in the lower left-hand corner of the figure is a scatter plot of objects and components loadings in the illustrated in dimension 1 and 4. In Figure 2 (1), the variables with greater component loading are ‘weather’ and ‘road surface conditions’ in the first quadrant, ‘speed1’ and ‘night’ in the second quadrant, and ‘job’ and ‘age1’ in the fourth quadrant. Since these pairs of variables are closely located, they are considered to be positively correlated. However, ‘speed1’ and ‘night’ and ‘age1’ and ‘job’ are negatively correlated because they are diagonally located with respect to the origin. Moreover, since ‘speed1’ and ‘night’ as well as ‘weather’ and ‘road surface conditions’ are perpendicularly located with respect to the origin, they are not correlated.
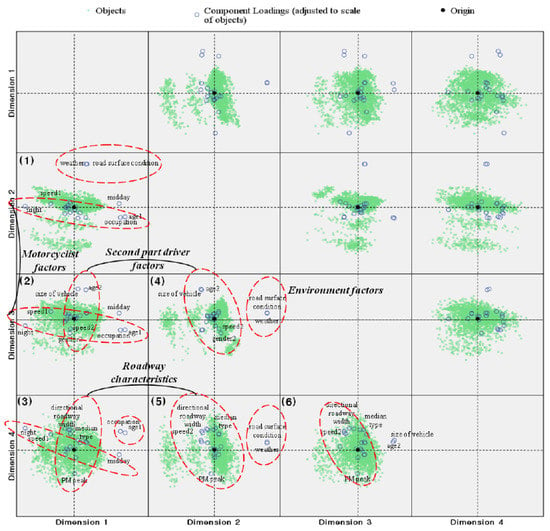
Figure 2.
Categorical principal component analysis of variables (variable principal normalization).
In Figure 2 (2), the variables associated with greater component loadings ‘age2’, ‘type of other vehicle’, and ‘midday’ are located in the north and the east areas of the first quadrant, respectively, while ‘speed1’, ‘gender2’ and ‘speed2’, and ‘age1’ and ‘job’ are located in the second, third, and fourth quadrants, respectively. This figure shows a different result from that of Figure 2 (2) in that it shows close correlations between ‘size of other vehicle’ and ‘age2’, as well as ‘gender2’ and ‘speed2’. Moreover, ‘size of other vehicle’ and ‘age2’, as well as ‘gender2’ and ‘speed2’ are negatively correlated. In Figure 2 (3), the variables associated with directional roadway width and median type are closely located in the second quadrant, and the variable ‘PM peak time’ is located in the fourth quadrant. These results indicate that directional roadway width and median type are positively correlated, and the PM peak time negatively impacts motorcycle crashes. Other results shown in Figure 2 (4), (5), and (6) can be interpreted similarly.
5.2. Optimal Scaling by Nonlinear Canonical Correlation Analysis
5.2.1. Loss and Fit Measures
NLCCA was used to analyze the selected independent variables that affect the severity of crashes. A two-dimensional analysis method was used to analyze the relationship between the crash characteristics and each influencing factor [3]. In this method, it is estimated that there is a correlation between orthogonal factors or factors in the same quadrant. Particularly, in the case of crash severity, there is a correlation among the ordinal and orthogonal variables, which necessitates a two-dimensional analysis. By applying OVERALS in IBM SPSS, the model fit of the two-dimensional NLCCA solution is obtained as follows. An actual fit value of 0.736 was calculated for variation, which is not very high, but it is over the brink. The average loss values for dimensions 1 and 2 were 0.616 and 0.647, respectively, which indicate that almost the same portion of variance was accounted for by each of the two dimensions. Lastly, the eigenvalue (1—mean loss of each dimension), which indicates the level of relationship shown by each dimension, is not very high (0.384 for dimension 1 and 0.353 for dimension 2). The following centroid plots show a more detailed interpretation of which variables are related, and to what extent.
5.2.2. Centroid Plot: Crash Characteristics and Crash Severity
The relationship between crash severity and crash characteristics is shown in Figure 3. The crash severity is plotted in the second and fourth quadrants. The severity increases from the second quadrant toward the north-west, and it decreases from the fourth quadrant to the south-east. However, since there is no crash severity variable in the first and third quadrants, variables in these quadrants are not correlated with crash severity. Based on this interpretation, ‘head-on crash’ and ‘basic roadway segment’ in the second quadrant are located near ‘incapacitating injury’. However, ‘other cases’ and ‘intersections’ are close to ‘visible injury’. Thus, the results suggest that variables associated with crash severity include ‘head-on crash’, ‘basic roadway segments’, ‘other cases’, and ‘intersections’. Moreover, since the variables of ‘crashes while parking’, ‘rear-end crashes’, ‘broadside crashes’, and ‘crosswalks’ are located in the first and third quadrants, they are not correlated with crash severity.
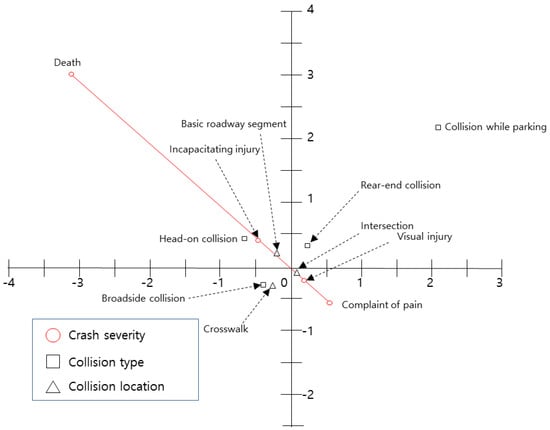
Figure 3.
Centroid plot for crash characteristics and crash severity variables.
5.2.3. Centroid Plot: Motorcyclist Characteristics and Crash Severity
Figure 4 shows the relationship between driver factors and crash severity. As shown in Figure 4a, the age of motorcyclists is correlated with crash severity. Particularly, since the age category ‘60s or more’ is located in the second quadrant and is plotted in the north-west area (the point representing incapacitating injury), crashes involving motorcyclists over the age of 60 may have increased the possibility of incapacitating injury or death. In addition, the variables ‘10s’ and ‘50s’ are in the second quadrant. Therefore, the results suggest that these two variables are also associated with incapacitating injury. On the other hand, ‘20s’, ‘30s’, and ‘40s’ have an influence on ‘complaint of pain’. A similar interpretation can be made for the other parts of Figure 4.
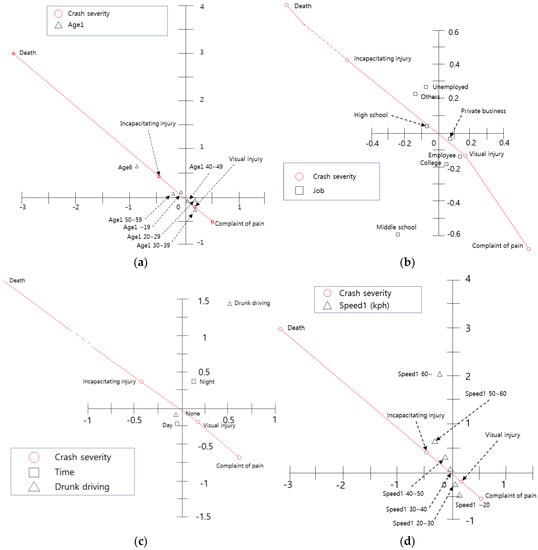
Figure 4.
Centroid plot for motorcyclist characteristics and crash severity variables: (a) Centroid plot for age and crash severity variables; (b) Centroid plot for occupation and crash severity variables; (c) Centroid plot for driver time and DUI and crash severity variables; (d) Centroid plot for driving speed and crash severity variables.
Figure 4b shows that ‘high school students’, ‘the unemployed’, and ‘others’ have high crash severity, and that ‘private business’, ‘college students’, and ‘employees’ have less crash severity. Figure 4c shows the relationship between ‘crash time’, ‘DUI’, and ‘crash severity’, which have a great influence on crash occurrence but not crash severity. Lastly, Figure 4d shows the relationship between crash severity and speed at the time of the crash. The results show that higher speeds bring about higher crash severity, particularly speeds over 30 km/h (incapacitating injury and/or death).
5.2.4. Centroid Plot: Characteristics Regarding Other Crashing Vehicles and Crash Severity
The relationship between the characteristics regarding other crashing vehicles and crash severity is shown in Figure 5. As shown in Figure 5a, the other driver’s age has little relationship with crash severity. However, the variable ‘20s’ is located in the second quadrant, and is thus correlated with ‘incapacitating injury’. As shown in Figure 5b, ‘speed over 50 km/h’ (spd2_5 and spd2_6) has a great influence on crash severity. Finally, Figure 5b shows the relationship between other vehicle’s type and crash severity. This figure suggests that crash severity (incapacitating injury and death) increases when larger vehicles such as ‘trucks’, ‘specially equipped vehicles’, or ‘buses’ are involved in motorcycle crashes.
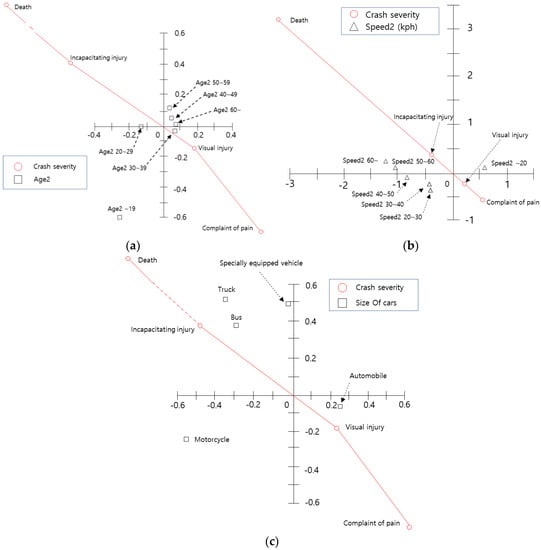
Figure 5.
Centroid plot for characteristics regarding other vehicles and crash severity variables: (a) Centroid plot for age and crash severity variables; (b) Centroid plot for speed and crash severity variables; (c) Centroid plot for size of vehicle and crash severity variables.
5.2.5. Centroid Plot: Environmental Characteristics and Crash Severity
The relationship between the roadway surface conditions and the crash severity is presented in Figure 6. Since the variable for normal surface conditions is located in the second quadrant, it is interpreted as a factor that increases crash severity. This result could be due to the fact that dry weather prevails all year round. However, its location is very close to the origin. Thus, this variable is not an effective one for crash severity. Slippery conditions increase the possibility of crashes due to the variable’s location, but they do not have a direct relationship with crash severity, due to the angle between the crash severity points and the variable location.
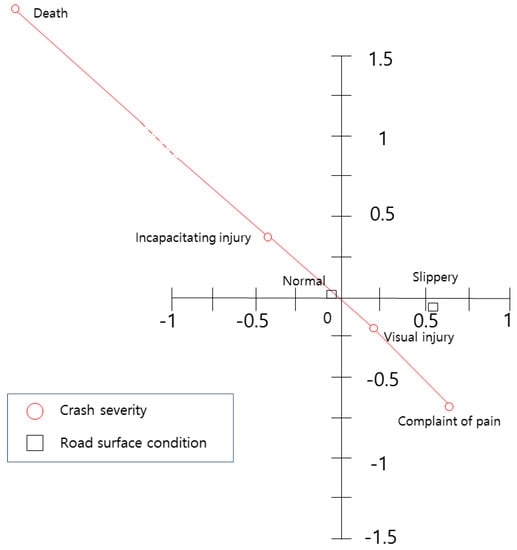
Figure 6.
Centroid plot for roadway surface condition and crash severity variables.
5.2.6. Centroid Plot: Roadway Characteristics and Crash Severity
The relationship between crash severity, roadway facilities, and geometry is shown in Figure 7. As shown in Figure 7a, since the variables related to ‘directional roadway width of less than 6 m’ are located in the second quadrant, they are correlated with ‘incapacitating injury’. Particularly, the variable ‘directional roadway width of less than 3 m’ is more correlated with ‘incapacitating injury’ than the other variable. In other words, the narrower the roadway, the greater the crash severity is. Figure 7b shows that the presence of a median barrier has no relationship with crash severity, and Figure 7c shows that curved sections have a significant impact on crash severity.
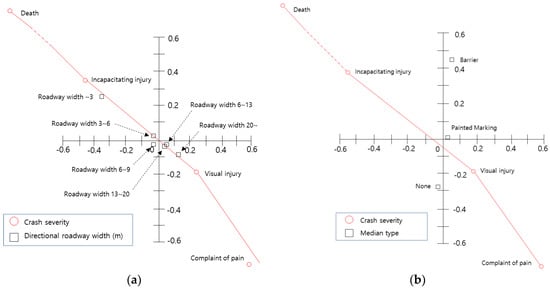
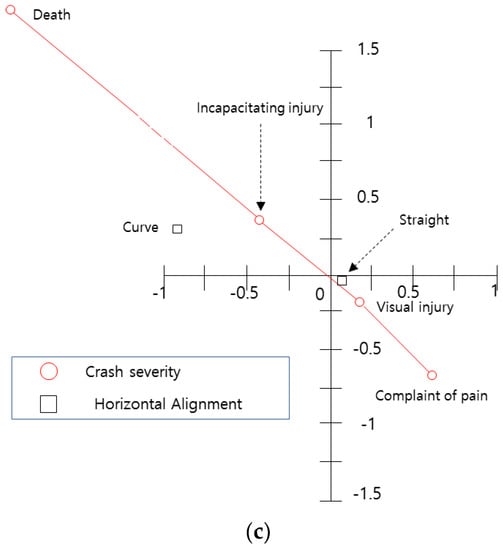
Figure 7.
Analysis of crash severity and roadway factor variables: (a) Centroid plot for directional roadway width and crash severity variables; (b) Centroid plot for median type and crash severity variables; (c) Centroid plot for horizontal alignment and crash severity variables.
6. Discussions
Severe motorcycle crashes that lead to serious injury or death incur high social cost. Thus, by identifying the factors that affect motorcycle crashes, appropriate policy measures can be instituted to minimize fatalities. The variables discussed in this study have a significant influence on motorcycle crash fatality, and they often interactively dictate the degree of crash severity. It is necessary to identify the most influential variables and to isolate them to help formulate legislative policies to reduce motorcycle crash severity. The most influential factors according to the NLCCA are shown in Table 5.
Table 5.
Variables of affecting crash severity increase.
The variables in Table 5 were in the second quadrant, where both death and incapacitating injury variables are located in the centroid plots. That is, there was a significant relationship between crash severity and these variables: head-on crash, crash at basic roadway segment, younger (under 20) or older (over 50) motorcyclists, motorcycle speed over 30 km/h, speed of the other crashing vehicle over 50 km/h, crashes with heavy vehicles such as trucks, buses, and specially equipped vehicles, narrow roadways (under 6 m), and crashes at curved segments. Overall, the results are consistent with those from prior studies. Savolainen and Mannering [21] and Pai and Saleh [49] indicated that head-on crashes tended to increase crash severity. Crashes that occurred at basic roadway segments also had an effect on severe injuries such as death and incapacitating injury, which is consistent with findings by Eystace et al. [50].
The relationship between crash severity and other variables including age, speed, vehicle type, and roadway width and alignment have been studied previously. The trends have similar patterns to the results from this study. For example, Baker et al. [51], Braddock et al. [52], and Lardelli-Claret et al. [15] emphasized the close relationship between young motorcyclists and high crash severity, while Kraus et al. [53], Lardelli-Claret et al. [15], NHTSA [54], Lin and Kraus [55], and Albalate and Fernández-Villadangos [56] reported that older motorcyclists (e.g., over 40, over 60, or over 75) are associated with much higher crash severity.
One of the most widely studied issues in crash severity analysis is the relationship between speed and crash severity. It is natural that higher crash speed is directly related to greater crash severity. Various studies on motorcycle crash severity analysis proved this relation (e.g., [1,15,50,57,58]). Moreover, motorcycle crashes with heavy vehicles contributed to higher crash severity, which also conforms to the previous studies (e.g., [1,18,58,59]). Lastly, crash severity is also high when the roadway is less than 6 m wide and is curved. These results are consistent with findings by Hague and Chin [20], and Albalate and Fernández-Villadangos [56], who indicated that crashes on single-lane roadways have higher severities. Similarly, Hague and Chin [20], Eustace et al. [50], and Chimba and Sando [58] reported that crashes on curved sections result in higher severity.
Based on the findings, the following remedial measures are suggested to reduce motorcycle crash severity. Firstly, a measure for maintaining reasonable speed that considers roadway conditions should be established. Currently, there are few warning signs for curved sections in the Seoul metropolitan area of South Korea. Thus, warning signs and speed limit signs should be installed at the entrances of curved sections. A plan is also needed to raise motorcyclists’ awareness of roadways that have fewer than two lanes and that are 6 m wide or less.
Secondly, there is a need for strong legal action against younger motorcyclists violating traffic laws. In addition, educational programs about the dangers of motorcycling are needed for older motorcyclists. For motorcyclists older than 50, educational programs about safe motorcycling would be very helpful and should be provided, because aging weakens cognitive control and reaction time. However, Matthews and Moran [60] reported that educational programs for younger motorcyclists did not have a significant impact on reducing reckless motorcycling habits. Guria and Leung [61] found the positive effect of enforcement and education through advertising campaigns. Therefore, such a complementary program for younger motorcyclists would be helpful for changing unsafe motorcycle habits.
7. Conclusions
This study identified the factors affecting the severity of motorcycle crashes occurring in the Seoul metropolitan area of South Korea during 2009. Remedial measures were suggested to reduce crash occurrence and severity. Since the collected crash data are associated with various types of measurement scales such as nominal, ordinal, and interval scales, we applied CatPCA and NLCCA. The results showed that the factors affecting the motorcycle crash severity included head-on crashes, crashes at basic roadway segment, crashes by younger (under 20) or older (over 50) motorcyclists, crashes with motorcycle speed over 30 km/h, crashes with the other crashing vehicle speed over 50 km/h, crashes with heavy vehicles, crashes on narrow roadways (under 6 m), and crashes on curved segments. These findings were all consistent with previous studies.
Since the major purpose of motorcycle trips in Seoul metropolitan area is the fast delivery of food and parcels, most motorcyclists are inexperienced, and young motorcyclists and motorcyclists are required to make fast delivery times [1]. Therefore, to develop more specified countermeasures for motorcycle safety, further analysis is required to identify the relationship between the crash severity and types of delivery for such foods and parcels. Further studies could be conducted with additional variables that can affect motorcycle crash severity. Examples include the usage of motorcycle protective clothing, congestion level, traffic volume at the crash moment, and displacement variables with respect to crashed motorcycles. Specifically, more accurate crash speed data available from vehicle state-of-the-art technologies, such as vehicle black boxes and event data recorders can be used [62,63,64]. Finally, the methods applied in this study show the relationships in relative scales based on graphical displays rather than parameter estimates. Visualizing the results from the methods can form a basis for an analysis on the interpretation of model parameters. Consequently, further studies could be done to develop parametric models based on nonlinear optimal scaling methods.
Author Contributions
Conceptualization, Y.C.; Methodology, Y.C.; Validation, Y.C. and T.S.; Formal Analysis, Y.C. and T.S.; Resources, Y.C.; Data Curation, Y.C. and T.S.; Writing—Original Draft Preparation, Y.C.; Writing—Review & Editing, Y.C.; Visualization, Y.C. and T.S.; Supervision, Y.C.; Funding Acquisition, Y.C.
Funding
This work was supported by the 2018 Yeungnam university research grant.
Conflicts of Interest
The authors declare no conflict of interest.
References
- Chung, Y.; Song, T.-J.; Yoon, B.-J. Injury severity in delivery-motorcycle to vehicle crashes in the Seoul metropolitan area. Accid. Anal. Prev. 2014, 62, 79–86. [Google Scholar] [CrossRef] [PubMed]
- Golob, T.F. A nonlinear canonical correlation analysis of weekly trip chaining behaviour. Transp. Res. 1986, 20, 385–399. [Google Scholar] [CrossRef]
- Meulman, J.J.; Heiser, W.J. SPSS Categories® 13.0; SPSS Inc.: Chicago, IL, USA, 2004. [Google Scholar]
- National Highway Traffic Safety Administration (NHTSA). Traffic Safety Facts 2005: A Compilation of Motor Vehicle Crash Data from the Fatality Analysis Reporting System and the General Estimates System; National Highway Traffic Safety Administration: Washington, DC, USA, 2007.
- Houston, D.J.; Richardson, L.E. Motorcylist fatality rates and mandatory helmet-use laws. Accid. Anal. Prev. 2008, 40, 200–208. [Google Scholar] [CrossRef] [PubMed]
- Cook, L.J.; Kerns, T.J.; Burch, C.A.; Thomas, A.; Bell, E. Motorcycle Helmet Use and Head and Facial Injuries: Crash Outcomes in Codes-Linked Data; National Highway Traffic Safety Administration (NHTSA): Washington, DC, USA, 2009.
- Cunto, F.J.C.; Ferreira, S. An analysis of the injury severity of motorcycle crashes in brazil using mixed ordered response models. J. Transp. Saf. Secur. 2017, 9, 33–46. [Google Scholar] [CrossRef]
- Kasantikul, V.; Ouellet, J.V.; Smith, T.; Sirathranont, J.; Panichabhongse, V. The role of alcohol in thailand motorcycle crashes. Accid. Anal. Prev. 2005, 37, 357–366. [Google Scholar] [CrossRef] [PubMed]
- Villaveces, A.; Cummings, P.; Koepsell, T.D.; Rivara, F.P.; Lumley, T.; Moffat, J. Association of alcohol-related laws with deaths due to motor vehicle and motorcycle crashes in the united states, 1980–1997. Am. J. Epidemiol. 2003, 157, 131–140. [Google Scholar] [CrossRef] [PubMed]
- Williams, A.F. Alcohol-impaired driving and its consequences in the united states: The past 25 years. J. Saf. Res. 2006, 37, 123–138. [Google Scholar] [CrossRef] [PubMed]
- Lin, M.-R.; Chang, S.-H.; Huang, W.; Hwang, H.-F.; Pai, L. Factors associated with severity of motorcycle injuries among young adult riders. Ann. Emerg. Med. 2003, 41, 783–791. [Google Scholar] [CrossRef] [PubMed]
- Oluwadiya, K.S.; Kolawole, I.K.; Adegbehingbe, O.O.; Olasinde, A.A.; Agodirin, O.; Uwaezuoke, S.C. Motorcycle crash characteristics in Nigeria: Implication for control. Accid. Anal. Prev. 2009, 41, 294–298. [Google Scholar] [CrossRef] [PubMed]
- Lin, M.-R.; Chang, S.-H.; Pai, L.; Keyl, P.M. A longitudinal study of risk factors for motorcycle crashes among junior college students in Taiwan. Accid. Anal. Prev. 2003, 35, 243–252. [Google Scholar] [CrossRef]
- Li, M.-D.; Doong, J.-L.; Huang, W.-S.; Lai, C.-H.; Jeng, M.-C. Survival hazards of road environment factors between motor-vehicles and motorcycles. Accid. Anal. Prev. 2009, 41, 938–947. [Google Scholar] [CrossRef] [PubMed]
- Lardelli-Claret, P.; Jimenez-Moleon, J.J.; Luna-del-Castillo, J.d.D.; Garcia-Martin, M.; Bueno-Cavanillas, A.; Galvez-Vargas, R. Driver dependent factors and the risk of causing a collision for two wheeled motor vehicles. Inj. Prev. 2005, 11, 225–231. [Google Scholar] [CrossRef] [PubMed]
- Christie, S.M.; Lyons, R.A.; Dunstan, F.D.; Jones, S.J. Are mobile speed cameras effective? A controlled before and after study. Inj. Prev. 2003, 9, 302–306. [Google Scholar] [CrossRef] [PubMed]
- Clarke, D.D.; Ward, P.; Bartle, C.; Truman, W. The role of motorcyclist and other driver behaviour in two types of serious accident in the UK. Accid. Anal. Prev. 2007, 39, 974–981. [Google Scholar] [CrossRef] [PubMed]
- Rifaat, S.M.; Tay, R.; de Barros, A. Severity of motorcycle crashes in Calgary. Accid. Anal. Prev. 2012, 49, 44–49. [Google Scholar] [CrossRef] [PubMed]
- Daniallo, A.; Gabler, H.C. Fatality risk in motorcyle collisions with roadside objects in the united states. Accid. Anal. Prev. 2011, 43, 1167–1170. [Google Scholar] [CrossRef] [PubMed]
- Haque, M.; Chin, H. Right-angle crash vulnerability of motorcycles at signalized intersections. Transp. Res. Rec. 2010, 2194, 82–90. [Google Scholar] [CrossRef]
- Savolainen, P.; Mannering, F. Probabilistic models of motorcyclists’ injury severities in single- and multi-vehicle crashes. Accid. Anal. Prev. 2007, 39, 955–963. [Google Scholar] [CrossRef] [PubMed]
- Shipp, E.M.; Wunderlich, R.; Perez, M.; Ko, M.; Pant, A.; Martin, M.; Chigoy, B.; Trueblood, A. Comprehensive Analysis of Motorcycle Crashes in Texas: A Multi-Year Snapshot; Texas A&M Transportation Institute: College Station, TX, USA, 2016. [Google Scholar]
- Cheng, W.; Gill, G.S.; Sakrani, T.; Dasu, M.; Zhou, J. Predicting motorcycle crash injury severity using weather data and alternative bayesian multivariate crash frequency models. Accid. Anal. Prev. 2017, 108, 172–180. [Google Scholar] [CrossRef] [PubMed]
- Blackman, R.A.; Haworth, N.L. Comparison of moped, scooter and motorcycle crash risk and crash severity. Accid. Anal. Prev. 2013, 57, 1–9. [Google Scholar] [CrossRef] [PubMed]
- Meulman, J.J.; Heiser, W.J. IBM Spss Categories 19; SPSS Inc.: Chicago, IL, USA, 2010. [Google Scholar]
- Hensher, D.A.; Golob, T.F. Searching for policy priorities in the formulation of a freight transport strategy: A canonical correlation analysis of freight industry attitudes. Transp. Res. 1999, 35, 241–267. [Google Scholar] [CrossRef]
- Golob, T.F.; Recker, W.W. A method for relating type of crash to traffic flow characteristics on urban freeways. Transp. Res. 2004, 38, 53–80. [Google Scholar] [CrossRef]
- Golob, T.F.; Recker, W.W.; Alvarez, V.M. Freeway safety as a function of traffic flow. Accid. Anal. Prev. 2004, 36, 933–946. [Google Scholar] [CrossRef] [PubMed]
- d’Ovidio, F.D.; Leogrnade, D.; Mancarella, R.; Viola, D. The quality of public transport services: A statistical analysis. Interdiscip. J. Res. Dev. 2014, 1, 96–104. [Google Scholar]
- Meulman, J.J.; Kooij, A.J.V.D.; Heiser, W.J. Principal components analysis with nonlinear optimal scaling transformations for ordinal and nominal data. In The Sage Handbook of Quantitative Methodology for the Social Sciences; Kaplan, D.W., Ed.; Sage Publications: Newbury Park, CA, USA, 2004; pp. 49–70. [Google Scholar]
- Fabrigar, L.R.; Wegener, D.T.; MacCallum, R.C.; Strahan, E.J. Evaluating the use of exploratory factor analysis in psychological research. Psychol. Methods 1999, 4, 272–299. [Google Scholar] [CrossRef]
- Hauer, E.; Council, F.; Mohammedshah, Y. Safety models for urban four-lane undivided road segments. Transp. Res. Rec. J. Transp. Res. Board 2004, 1897, 96–105. [Google Scholar] [CrossRef]
- Park, J.; Abdel-Aty, M. Assessing the safety effects of multiple roadside treatments using parametric and nonparametric approaches. Accid. Anal. Prev. 2015, 83, 203–213. [Google Scholar] [CrossRef] [PubMed]
- Park, B.-J.; Lord, D.; Wu, L. Finite mixture modeling approach for developing crash modification factors in highway safety analysis. Accid. Anal. Prev. 2016, 97, 274–287. [Google Scholar] [CrossRef] [PubMed]
- Wu, L.; Lord, D. Examining the influence of link function misspecification in conventional regression models for developing crash modification factors. Accid. Anal. Prev. 2017, 102, 123–135. [Google Scholar] [CrossRef] [PubMed]
- Linting, M.; Meulman, J.J.; Groenen, P.J.F.; van der Koojj, A.J. Nonlinear principal components analysis: Introduction and application. Psychol. Methods 2007, 12, 336–358. [Google Scholar] [CrossRef] [PubMed]
- Garson, D. Canonical Correlation; North Carolina State University: Raleigh, NC, USA, 2008. [Google Scholar]
- de Leeuw, J. Canonical Analysis of Categorical Data; University of Leiden: Leiden, The Netherlands, 1973. [Google Scholar]
- Gifi, A. Non-linear Multivariate Analysis; University of Leiden: Leiden, The Netherlands, 1981. [Google Scholar]
- van der Burg, E.; de Leeuw, J. Non-linear canonical correlation. Br. J. Math. Stat.Psychol. 1983, 36, 54–80. [Google Scholar] [CrossRef]
- Michailidis, G.; de Leeuw, J. The gifi system of descriptive multivariate analysis. Stat. Sci. 1998, 13, 307–336. [Google Scholar] [CrossRef]
- Johnson, R.A.; Wichern, D.W. Applied Multivariate Statistical Analysis; Pearson: London, UK, 2014. [Google Scholar]
- Meulman, J.J.; Heiser, W.J. Spss Categories® 10.0; SPSS Inc.: Chicago, IL, USA, 1999. [Google Scholar]
- van der Burg, E.; Dijksterhuis, G. Generalised canonical analysis of individual sensory profiles and instrumental data. In Data Handling in Science and Technology; Tormod, N., Einar, R., Eds.; Elsevier: Amsterdam, The Netherlands, 1996; pp. 221–258. [Google Scholar]
- Meulman, J. Optimal Scaling Methods for Multivariate Categorical Data Analysis; SPSS White Paper: Chicago, IL, USA, 1998. [Google Scholar]
- van der Burg, E.; de Leeuw, J.; Verdegaal, R.V. Non-Linear Canonical Correlation with M Sets of Variables; University of Leiden: Leiden, The Netherlands, 1984. [Google Scholar]
- van der Geest, V.; Blokland, A.; Bijleveld, C. Delinquent development in a sample of high-risk youth shape, content, and predictors of delinquent trajectories from age 12 to 32. J. Res. Crime Délinq. 2009, 46, 111–143. [Google Scholar] [CrossRef]
- Ter Braak, C.J.F. Interpreting canonical correlation analysis through biplots of structure correlations and weights. Psychometrika 1990, 55, 519–531. [Google Scholar] [CrossRef]
- Pai, C.-W.; Saleh, W. Exploring motorcyclist injury severity resulting from various crash configurations at t-junctions in the United Kingdom—An application of the ordered probit models. Traffic Inj. Prev. 2007, 8, 62–68. [Google Scholar] [CrossRef] [PubMed]
- Eustace, D.; Indupuru, V.K.; Hovey, P. Identification of risk factors associated with motorcycle-related fatalities in Ohio. J. Transp. Eng. 2011, 137, 474–480. [Google Scholar] [CrossRef]
- Baker, S.P.; O’Neill, B.; Ginsburg, M.J.; Li, G. The Injury Fact Book; Oxford University: New York, NY, USA, 1992. [Google Scholar]
- Braddock, M.; Schwartz, R.; Lapidus, G.; Banco, L.; Jacobs, L. A population-based study of motorcycle injury and costs. Ann. Emerg. Med. 1992, 21, 273–278. [Google Scholar] [CrossRef]
- Kraus, J.F.; Riggins, R.S.; Franti, C.E. Some epidemiologic features of motorcycle collision injuries. Factors associated with severity of injuries. AM. J. Epidemiol. 1975, 102, 99–109. [Google Scholar] [CrossRef] [PubMed]
- National Highway Traffic Safety Administration (NHTSA). Recent Trends in Fatal Motor-Cycle Crashes: An Update; National Highway Traffic Safety Administration: Washington, DC, USA, 2006.
- Lin, M.-R.; Kraus, J.F. Methodological issues in motorcycle injury epidemiology. Accid. Anal. Prev. 2008, 40, 1653–1660. [Google Scholar] [CrossRef] [PubMed]
- Albalate, D.; Fernández-Villadangos, L. Motorcycle injury severity in Barcelona: The role of vehicle type and congestion. Traffic Inj. Prev. 2010, 11, 623–631. [Google Scholar] [CrossRef] [PubMed]
- Shankar, V.; Mannering, F. An exploratory multinomial logit analysis of single-vehicle motorcycle accident severity. J. Saf. Res. 1996, 27, 183–194. [Google Scholar] [CrossRef]
- Chimba, D.; Sando, T. Multinomial probability assessment of motorcycle injury severities. Adv. Transp. Stud. 2010, 7, 73–80. [Google Scholar]
- Pai, C.-W.; Saleh, W. Modelling motorcyclist injury severity by various crash types at T-junctions in the UK. Saf. Sci. 2008, 46, 1234–1247. [Google Scholar] [CrossRef]
- Mattews, M.; Moran, A. Age difference in male drivers’ perception of accident risk: The role of perceived driving ability. Accid. Anal. Prev. 1986, 18, 299–313. [Google Scholar] [CrossRef]
- Guria, J.; Leung, J. An evaluation of a supplementary road safety package. Accid. Anal. Prev. 2004, 36, 893–904. [Google Scholar] [CrossRef] [PubMed]
- Chung, Y.; Chang, I. How accurate is accident data in road safety research? An application of vehicle black box data regarding pedestrian-to-taxi accidents in Korea. Accid. Anal. Prev. 2015, 84, 1–8. [Google Scholar] [CrossRef] [PubMed]
- Song, T.-J.; So, J.J.; Lee, J.; Williams, B.M. Exploring vehicle–pedestrian crash severity factors on the basis of in-car black box recording data. Transp. Res. Rec. J. Transp. Res. Board 2017, 2659, 148–154. [Google Scholar] [CrossRef]
- Chung, Y. Injury severity analysis in taxi-pedestrian crashes: An application of reconstructed crash data using a vehicle black box. Accid. Anal. Prev. 2018, 111, 345–353. [Google Scholar] [CrossRef] [PubMed]
© 2018 by the authors. Licensee MDPI, Basel, Switzerland. This article is an open access article distributed under the terms and conditions of the Creative Commons Attribution (CC BY) license (http://creativecommons.org/licenses/by/4.0/).