Abstract
Ten new epipolythiodioxopiperazine (ETP) alkaloids, named corallomycetellains A–J (1–10), along with one known analogue, haematocin (11), were isolated from the fungi Corallomycetella repens HDN23-0007. Their structures, including absolute configurations, were established by comprehensive spectroscopic data and electronic circular dichroism (ECD) calculations. Compounds 1–2 represent the first two examples of aranotin-type ETPs possessing an aromatic indole moiety. Compounds 2–4 all featured a unique C2-methyl disulfide substituent, whereas compound 4 additionally possessed a C2′-oxomethyl group. In in vitro cytotoxicity assays, compounds 7–10, which contained α–α′ polysulfide bridges, exhibited strong anticancer activity, with IC50 values ranging from 1.1 to 9.3 μM.
1. Introduction
Epipolythiodioxopiperazines (ETPs) represent a class of fungal secondary metabolites characterized by the presence of sulfur atoms within their diketopiperazine scaffold. The structural diversity of epipolythiodiketopiperazine (ETP) derivatives originates from the variability of diketopiperazine scaffolds, distinct patterns of sulfur atom linkage to the 2,5-diketopiperazine core, and extensive post-biosynthetic modifications. These compounds exhibit a wide range of biological activities, including antiviral (e.g., acetylaranotin) [1], antitumor (e.g., gliotoxin and chaetocin) [2,3,4,5], immunomodulatory (e.g., chetoseminudin A) [6], and antibacterial activities (e.g., sirodesmin PL) [7]. Critically, the biological activities of ETPs are primarily determined by the presence and spatial configuration of their characteristic disulfide bridges [8].
During our ongoing search for novel bioactive metabolites from marine-derived fungi [9,10], microbial fermentation extracts were initially analyzed by high-performance liquid chromatography–ultraviolet (HPLC–UV) profile. Among these, Corallomycetella repens HDN23-0007 was prioritized for further investigation due to its notably complex HPLC–UV profile, which displayed a high density of well-resolved, UV-absorbing peaks across a broad retention time range. A comprehensive analysis combining HPLC–UV profiling, liquid chromatography–mass spectrometry (LC–MS), and the Global Natural Products Social Molecular Networking (GNPS) platform (Figure 1) revealed the presence of potential epidithiodioxopiperazine (ETP) derivatives in its metabolome [11,12]. Subsequently, ten new epipolythiodioxopiperazine (ETP) alkaloids, named corallomycetellains A–J (1–10), along with one known analogue, haematocin (11), were isolated (Figure 2). Compounds 7–10 exhibited strong anticancer activity, with IC50 values ranging from 1.1 to 9.3 μM. In this paper, we describe their isolation, structural elucidation, and biological evaluation.
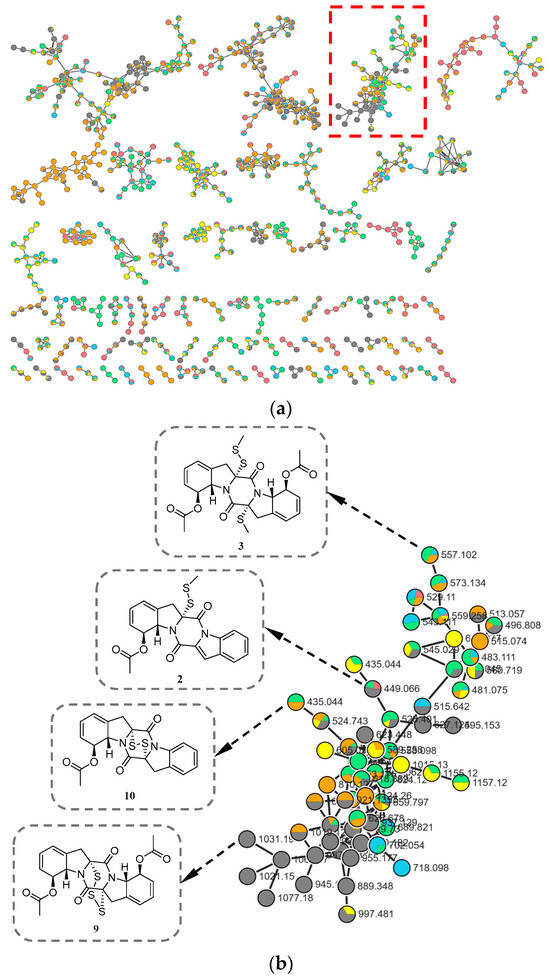
Figure 1.
(a) Molecular network of six subfractions (colors correspond to different subfractions) from Corallomycetella repens HDN23-0007; (b) Clusters corresponding to compounds of the ETP derivatives observed in the molecular network (red box in (a)).
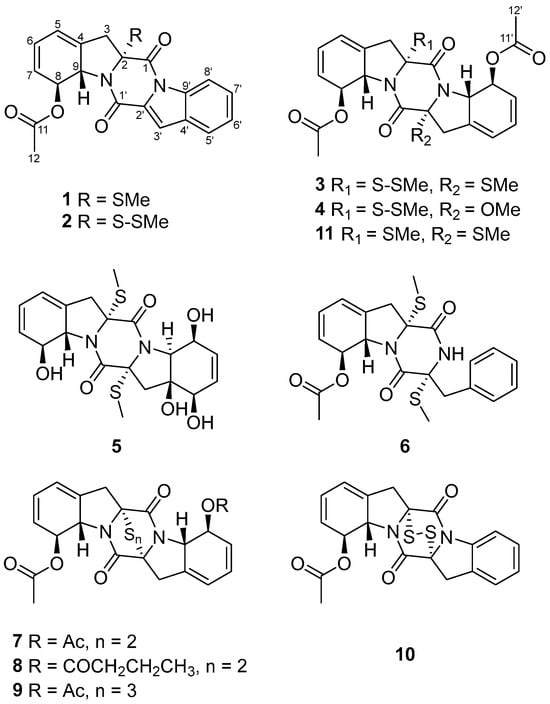
Figure 2.
Structures of compounds 1–11.
2. Results and Discussion
2.1. Structural Determination
Corallomycetellain A (1) was obtained as a light-yellow amorphous powder. Its molecular formula was determined to be C21H18N2O4S, based on the molecular ion at m/z 417.0880 [M + Na]+ observed in HRESIMS, indicating 14 degrees of unsaturation. The 1D NMR (Table 1) and HSQC spectra of 1 revealed the presence of one methylthio group (δC/H 13.1/2.09), one acetyl methyl group (δC/H 21.6/2.23), one methylene (δC/H 40.6/3.10), ten methines (one oxygenated (δC/H 74.9/6.31), one nitrogenated (δC/H 64.7/5.27), and eight olefinic ones (δC/H 115.0/7.45, δC/H 116.4/8.44, δC/H 120.6/6.03, δC/H 122.8/7.70, δC/H 125.3/6.03, δC/H 125.6/7.41, δC/H 128.2/7.54, δC/H 128.5/5.65)), one quaternary sp3 carbon (δC 76.4), four olefinic nonprotonated carbons (δC 128.9, 129.3, 133.9, 134.7), one ketone carbonyl (δC 171.4) and two amide carbonyls (δC 163.7, 155.7). Nine of the compound’s fourteen degrees of unsaturation were accounted for by the structural features identified so far, suggesting that compound 1 possessed a penta-cyclic core.

Table 1.
1H (500 MHz) and 13C (125 MHz) NMR data of 1–2 in CDCl3.
A series of the COSY correlations from H-6 (δH 6.03)/H-7 (δH 5.65) and H-8 (δH 6.31)/H-9 (δH 5.27) as well as the HMBC correlations from H-7 to C-5 (δC 120.6)/C-9 (δC 64.7), from H-9 to C-4 (δC 133.9) and from H2-3 to C-2 (δC 76.4)/C-4/C-5/C-9 indicated the presence of six membered rings combined with five membered rings in 1. (Figure 3). While the right series of the COSY correlations from H-5′ (δH 7.70)/H-6′ (δH 7.41) and H-7′ (δH 7.54)/H-8′ (δH 8.44) as well as the HMBC correlations from H-5′ to C-3′ (δC 115.0)/C-9′ (δC 134.7)/C-7′ (δC 128.2), from H-8′ to C-4′ (δC 129.3)/C-6′ (125.6) and from H-3′ (δH 7.45) to C-2′ (δC 128.9)/C-9′ revealed an extra six membered rings combined with five membered rings (Figure 3). Moreover, the compound was deduced to possess a 6-5-6-5-6 fused diketopiperazine (DKP) skeleton, based on the characteristic chemical shifts of the amide carbonyls (δC 163.7, C-1; δC 155.7, C-1′) and the molecular weight. Analysis of the NMR data (Table 1) for the left C-11 (δC 171.4) and C-12 (δC 21.6) of 1 and HMBC correlation from H-12 (δH 2.23) to C-11 indicated the presence of an acetyl group. Based on all relevant signals and chemical shifts, we hypothesized that the acetyl group can only form an ester bond with the oxygen at the C-8 (δC 74.9) position. Therefore, the planer structure of 1 with the presence of a 6/5/6/5/6 diketopiperazine skeleton was suggested, as shown in Figure 2.
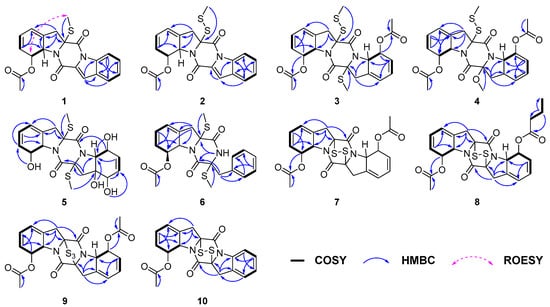
Figure 3.
Key COSY, HMBC and ROESY correlations of compounds 1–10.
The relative configurations of 1 were established as 2R*,8S*,9S* by the coupling constants analysis of H-8/H-9 (3JH-8, H-9 = 14.0 Hz) and the ROESY correlation between SMe-2 (δH 2.09) and H-8 (δH 6.31). To determine the absolute configurations of 1, ECD calculations were performed at the B3LYP/6-31+G(d) level. The tendencies of the experimental ECD spectrum were in reasonable agreement with the calculated one of (2R*,8S*,9S*)-1 (Figure 4), establishing the absolute configuration as 2R, 8S, 9S in 1.
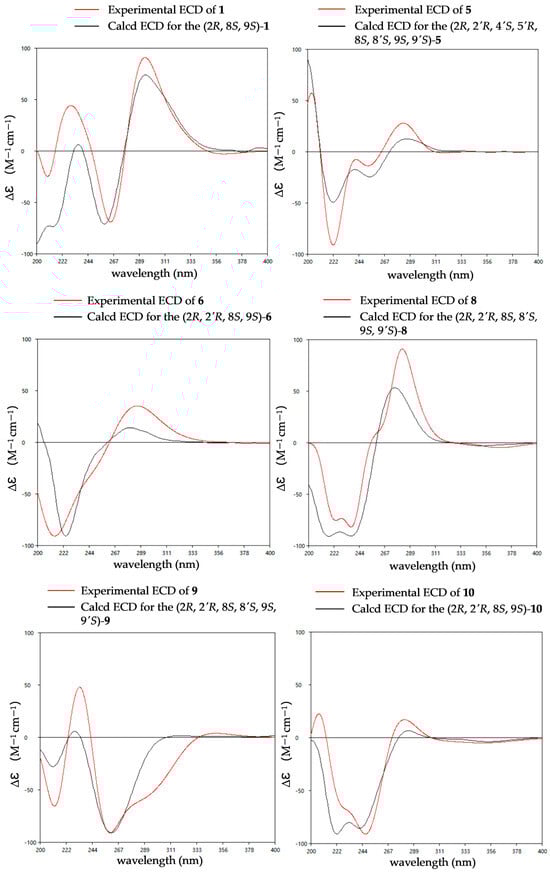
Figure 4.
Experimental and calculated ECD spectra of compounds 1, 5–6 and 8–10.
The molecular formula of corallomycetellain B (2), obtained as a light-yellow amorphous powder, was C21H18N2O4S2, deduced by HRESIMS. Comparison of 1H and 13C NMR spectra (Table 1) of 1 and 2 revealed that they shared the same 6/5/6/5/6 diketopiperazine skeleton with an aromatic indole moiety. The only difference was an existence of a disulfide bond in C-2 (δC 78.9) in 2 supported by the HRESIMS results and chemical shift differences of Me-R-2 in 1 and 2 (δC 13.1 in 1 while δC was 23.5 in 2).
The relative configurations of 2 were established in the same way as 1 by the coupling constants analysis of H-8/9 (3JH-8, H-9 = 14.0 Hz) and the comparison of 1D NMR data with 1 (Table 1). Consequently, the absolute configuration of 2 was determined as 2R, 8S, 9S, since the experimental ECD curves of 1 and 2 agreed perfectly (Figure 5). Reported ETPs typically feature a sulfur-bridged diketopiperazine core, frequently integrated with fused oxazine rings. In comparison, compounds 1–2 represent the first two examples of aranotin-type ETPs possessing a rare aromatic indole unit (Figure S2).
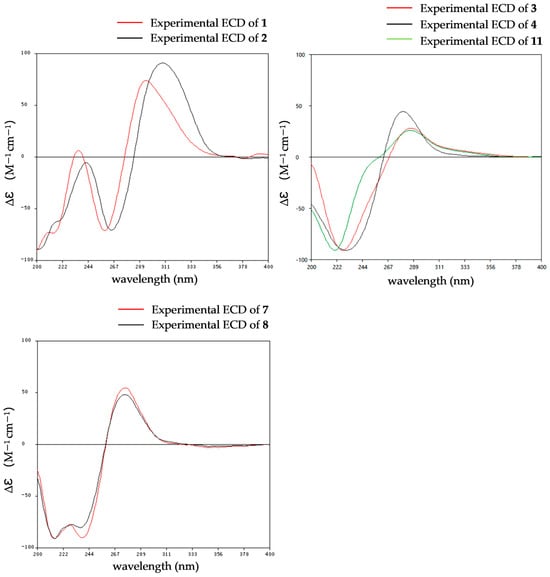
Figure 5.
Experimental ECD spectra of 1–4, 7–8 and 11.
Corallomycetellain C (3) and corallomycetellain D (4) were obtained as a light-yellow amorphous powders with the molecular formulae of C24H26N2O6S3 and C24H26N2O7S2, deduced by HRESIMS, respectively. Analysis of the 1H and 13C NMR data of 3 with those of haematocin (11) [13] indicated that 3 has the same skeleton as 11 (Table 2). The difference in mass of 32 Da between 3 and 11 indicated an addition of a sulfur atom in 3, which is supported by the HRESIMS analysis. The HMBC correlation from S-SMe-2 (δH 23.8) to C-2 (δC 77.4), along with the differences in chemical shifts of C-2 and S-SMe-2 (δC 74.2 and δC 14.5 in 11 [13], compared to δC 77.4 and δC 23.8 in 3), revealed the presence of a disulfide bond at C-2 in 3 (Figure 3). Compound 4 had a methoxy group instead of a methylthio group in C-2′, which was supported by chemical shifts of OMe-2′ (δC 53.3 and δH 3.50) and C-2′ (δC 95.4) as well as an HMBC correlation from OMe-2′ to C-2′ (Figure 3).
Table 2.
1H and 13C NMR data of 3–4 in CDCl3.
The relative configurations of 3–4 were established by 1H-1H coupling constants and ROESY data, and the comparison of 1D NMR data with haematocin (11). The coupling constants between H-8/8′ and H-9/9′ were more than 14.0 Hz, which revealed trans relationships of H-8/H-9 and H-8′/H-9′. The ROESY correlations from H-3a/3′a (δH 2.89) to H-9/9′ (δH 5.19), from H-3b (δH 3.69) to S-SMe-2 (δH 2.47) and from H-3′b (δH 3.00) to SMe-2′ (δH 2.23) indicated that S-SMe-2/SMe-2′ and H-9/9′ were located on the opposite side of the pyrrole ring (Figure 6). Therefore, the relative configuration of 3 was suggested. According to the ROESY correlations from H-3a (δH 2.89) to H-9 (δH 5.16), from H-3b (δH 3.67) to S-SMe-2 (δH 2.51), from H-8 (δH 5.86) to OMe-2′ (δH 3.50) (Figure 6) and the coupling constants analysis of H-8′/9′ (3JH-8′, H-9′ = 14.0 Hz), the relative configurations of 4 were established to be the same as 3. The experimental ECD curves for 3–4 and haematocin (11) agreed perfectly (Figure 5), which demonstrated that their absolute configurations were 2R,2′R,8S,8′S,9S,9′S.
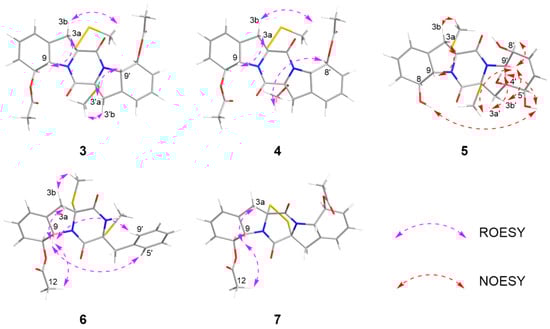
Figure 6.
NOESY and ROESY correlations of 3–7.
Corallomycetellain E (5), obtained as yellow oil, had a molecular formula of C20H24N2O6S2 deduced by an HRESIMS peak at m/z 453.1139 [M + H]+. Comparison of 1H and 13C NMR data of 5 (Table 3) to those of rostratazine B [14] revealed that 5 shared the same skeleton with rostratazine B. The difference was the replacement of a hydroxyl group at C-4′ (δC 69.8) in 5, supported by the HMBC correlation from OH-4′ (δH 5.32) to C-9′ (δC 68.2) (Figure 3). Therefore, the planer structure of 5 was proposed.
Table 3.
1H (500 MHz) and 13C (125 MHz) NMR data of 5 in DMSO-d6.
The relative configuration of compound 5 was assigned based on NOESY data and coupling constant analysis. For the left moiety, the relative configuration of 2R*,8S*,9S* was determined from the following key observations: NOE correlations between H-3a (δH 2.88) and H-9 (δH 4.78), and between H-3b (δH 3.08) and SMe-2 (δH 2.16), together with a large coupling constant between H-8 and H-9 (3JH-8, H-9 = 13.0 Hz) (Figure 6). For the right moiety, a cis relationship between H-8′ and H-9′ was indicated by their smaller coupling constant (3JH-8′, H-9′ = 9.6 Hz). Furthermore, the relative configuration was confirmed by a network of NOE correlations: H-3′a (δH 2.92)/OH-4′ (δH 5.32), OH-4′ (δH 5.32)/OH-5′ (δH 4.88), OH-5′ (δH 4.88)/OH-8 (δH 5.27), H-3′b (δH 2.50)/H-9′ (δH 3.96), H-9′ (δH 3.96)/SMe-2′ (δH 2.13) (Figure 6). Therefore, the relative configurations of 5 were proposed as 2R*,2′R*,4′S*,5′R*,8S*,8′S*,9S*,9′S*. Consequently, the absolute configurations of 5 were determined as 2R,2′R,4′S,5′R,8S,8′S,9S,9′S by comparing the experimental electronic circular dichroism (ECD) curve with the calculated one (Figure 4).
Corallomycetellain F (6) was isolated as colorless oil with a molecular formula of C22H24N2O4S2 deduced by a HRESIMS peak at m/z 467.1070 [M + Na]+. Comparison of the 1H and 13C NMR data (Table 4) to those of phomazine B revealed that 6 shared the same skeleton with phomazine B [15]. The difference was the replacement of an acetoxyl group at C-6 (δC 74.9) in 6, supported by the HMBC correlation from H-12 (δH 2.19) to C-11 (δC 171.1) (Figure 3).
Table 4.
1H (500 MHz) and 13C (125 MHz) NMR data of 6 in CDCl3.
The relative configuration of 6 was established by 1H-1H coupling constants and ROESY data. The large J value (14.3 Hz) between H-9 (δH 4.90) and H-8 (δH 6.22) indicated the trans-orientations of H-8 and H-9, which was further supported by the observed ROE correlation between H-9 and H-12 (δH 2.19). In addition, ROESY correlations between H-9 and H-3a (δH 1.56), between H-9 and H-5′/8′ (δH 7.15) and between SMe-2 (δH 2.26) and H-3b (δH 2.58) (Figure 6) allowed the assignment of the two thiomethyl groups as cis to each other and both trans relative to H-9. Hence, the relative of 6 was assigned as 2R*,2′R*,8S*,9S*. To determine the absolute configuration of 6, ECD calculations were performed at the B3LYP/6-31+G(d) level. The overall pattern of the experimental ECD spectrum was in reasonable agreement with the calculated one of (2R,2′R,8S,9S)-6, indicating the absolute configuration of C-2, C-2′, C-8 and C-9 in 6 as 2R,2′R,8S,9S (Figure 4).
Corallomycetellains G–I (7–9), isolated as white powder, have the molecular formulae of C22H20N2O6S2, C24H24N2O6S2 and C22H20N2O6S3, respectively, deduced by HRESIMS. The 1H and 13C NMR spectra of compound 7 revealed 10 proton signals and 11 carbon signals, precisely half of the total counts indicated by their molecular formulae. This observation suggests that 7 possesses a symmetrical structure. Comparative analysis of 1H and 13C NMR data (Table 2 and Table 5) of 7 and 3 confirmed that both share an identical 6/5/6/5/6 diketopiperazine core. The structural distinction was the presence of an additional disulfide bridge between C-2 and C-2′ in 7. The planar structure of 7 was further elucidated based on 2D NMR correlations. Key COSY correlations were observed between H-6 (δH 5.98) and H-7 (δH 5.55) and between H-8 (δH 6.04) and H-9 (δH 4.98). Additionally, HMBC correlations from H-3 to C-1 (δC 162.8), C-2 (δC 78.2), C-4 (δC 132.3), C-5 (δC 119.8) and C-9 (δC 64.3); from H-7 to C-5 and C-9; from H-6 to C-8 (δC 74.1); and from both H-8 and H-12 (δH 2.15) to C-11 (δC 170.6) collectively supported the proposed connectivity, as illustrated in Figure 3.
Table 5.
1H (600 MHz) and 13C (150 MHz) NMR data of 7 (CDCl3) and 8 (CD3OD).
The key structural difference between 7 and 8 was the presence of a butanoyl group at C-8′ (δC 74.3) in 8 instead of an acetoxy group in 7, which was supported by the HMBC correlations from H-13′ (δH 1.66) to C-12′ (δC 35.9), C-11′ (δC 173.3) and C-14′ (δC 132.1) (Figure 3). In contrast to 7, compound 9 was proposed to feature a trisulfide bridge. This inference was supported by HRESIMS data and by the distinct chemical shifts of C-2 and C-2′ in 9 (δC 78.2 and δC 82.4, respectively) compared to those in 7 (both δC 78.2).
Corallomycetellain G (7) was first isolated in 2001 from the fermentation broth filtrate of Rhizostilbella sp. [16] However, the relative configurations were not confirmed. Here, we determined the relative configurations of 7 based on the analysis of the coupling constants between H-8/8′ and H-9/9′ (3JH-8/8′, H-9/9′ = 13.2 Hz) as well as the ROESY correlations between H-3a (δH 3.70) and H-9 (δH 4.98) and between H-9 (δH 4.98) and H-12 (δH 2.15) (Figure 6). Comparison of 1D and 2D NMR spectra between 7 and 8–9 indicated the same relative configurations of them, supported by the coupling constants and chemical shifts (Table 5 and Table 6).
Table 6.
1H (600 MHz) and 13C (150 MHz) NMR data of 9–10 (in CDCl3).
The comparison of the ECD curve of 7 [(218 (negative), 239 (negative), 276 (positive) and 359 nm (negative)] with those of emethallcin E [17] [(217 (negative), 237 (negative), 273 (positive), and 328 nm (negative)] confirmed that they had the same configuration around the epidithiodioxopiperazine ring. Therefore, the absolute configuration of 7 was determined as 2R,2′R,8S,8′S,9S,9′S. Based on the highly similar ECD spectra, the absolute configurations of 8 were proposed to be the same as those of 7 (Figure 5), which was further supported by computational calculations (Figure 4). The absolute configuration of 9 was determined as 2R,2′R,8S,8′S,9S,9′S by comparison of its experimental ECD spectrum with the calculated ones (Figure 4).
Corallomycetellain J (10) was obtained as a light-yellow amorphous powder with a molecular formula of C20H16N2O4S2 deduced by an HRESIMS peak at m/z 435.0432 [M + Na]+. The 1H and 13C NMR data of 10 revealed that 10 was similar to deoxyapoaranotin [18] (Table 6). The obvious difference was the presence of a 1,3-cyclohexadiene skeleton in ring A, supported by HMBC correlations from H-6 (δH 6.01) to C-4 (δC 132.1) and C-8 (δC 74.2) and from H-7 (δH 5.58) to C-5 (δC 120.0) and C-9 (δC 64.6), as well as a COSY correlation between H-8 (δH 6.14) and H-9 (δH 5.05) (Figure 3).
The coupling constants between H-8 and H-9 (3JH-8, H-9 = 18.0 Hz) indicated the transorientation of H-8 and H-9. Comparison of the 1D NMR data for 10 with those of 7 (Table 5 and Table 6), particularly for positions C-1 through C-9 and C-1′ through C-3′, confirmed that they had the same configuration around the epidithiodioxopiperazine ring. Accordingly, the relative configurations of 10 were proposed as 2R*,2′R*,8S*,9S*. Comparing the ECD curve with the calculated ones (Figure 4), the absolute configuration of 10 was determined as 2R,2′R,8S,9S.
2.2. Biological Assays
The cytotoxicity of compounds 1–10 was evaluated against a panel of human cancer cell lines, including chronic myeloid leukemia (K562), pancreatic adenocarcinoma (ASPC-1 and MIA-PACA-2), small cell lung cancer (NCI-H446 and NCI-H446/EP) and pancreatic cancer (MIA-PACA-2 and MIA-PACA-2AR) as well as the human hepatocyte cell line (L-02) (Table 7). Compounds 7–10 possessed an α–α′ polysulfide bridge and exhibited strong anticancer activity with IC50 values ranging from 1.1 to 9.3 μM. Structure–activity relationship (SAR) analysis revealed that Compounds 7–8 and 10, bearing a disulfide bridge, and compound 9, containing a trisulfide bridge between C-2 and C-2′, showed stronger activity (IC50 = 1.1–5.2 μM) than 3 (IC50 = 25.8–27.0 μM), suggesting the crucial role of the α–α’ polysulfide linkage in cytotoxic potency. Among them, compound 10 exhibited the most potent activity, particularly against ASPC-1 and NCI-H446/EP cell lines (IC50 = 1.5–2.3 μM), surpassing the reference drug Doxorubicin (IC50 = 5.9–11.3 μM). Other compounds exhibited no inhibitory activity against the tested cancer cell lines.
Table 7.
Cytotoxicity against six cancer cell lines of 3 and 7–10 (IC50, μM).
3. Materials and Methods
3.1. General Experimental Procedures
Optical rotations were measured with a JASCO P-1020 digital polarimeter (JASCO Corporation, Tokyo, Japan). UV spectra were recorded on a Hitachi 5430 spectrophotometer (Hitachi Ltd., Tokyo, Japan). ECD spectra were measured on a JASCO J-715 (JASCO Corporation, Tokyo, Japan). NMR spectra were collected on Bruker AVANCE NEO 400 MHz spectrometer (Bruker, Karlsruhe, Germany), Agilent 500 MHz DD2 spectrometers (Agilent Technologies, Palo Alto, CA, USA) and a JNM-ECZ600R/S1 (JEOL Ltd., Tokyo, Japan). HRESIMS data were measured on a Thermo Scientific LTQ Orbitrap XL mass spectrometer (Thermo Fisher Scientific, Waltham, MA, USA). Sephadex LH-20 (Amersham Biosciences, Piscataway, NJ, USA) and silica gel (Qingdao Marine Chemical Factory, Qingdao, China) were used as stationary phases in column chromatography (CC). Semipreparative HPLC was performed on an ODS column (YMC-Pack ODS-A, YMC Co., Ltd., Fukuchiyama, Kyoto, Japan).
3.2. Fungal Material
Marine sediment collected from the Yellow River estuary, China (coordinates: 37°57′43″ N, 119°15′55″ E) in July 2023 was pretreated by ultrasonication for one minute. After suspending and diluting with seawater, the sediment was spread on three types of culture medium: PDA (Potato Dextrose Agar) medium, Rose Bengal medium and Sabouraud Dextrose Agar medium and cultured at 28 °C and 15 °C, respectively. The fungal strain HDN23-0007 was isolated from Rose Bengal medium at 28 °C and identified as Corallomycetella repens based on sequencing of the ITS region (GenBank No. PV628721) with 100% similarity. It was deposited at Key Laboratory of Marine Drugs, the Ministry of Education of China, School of Medicine and Pharmacy, Ocean University of China, Qingdao, People’s Republic of China.
3.3. Fermentation and Extraction
The fungal Corallomycetella repens HDN23-0007 was cultured in 1000 mL Erlenmeyer flasks containing 300 mL of malt culture medium (yeast extract 0.4%, malt extract 1%, glucose 0.4%) dissolved in naturally collected seawater (Huiquan Bay, Yellow Sea, Qiangdao, China). Fifty flasks were cultured under static conditions at 28 °C for 30 days. After 30 days of cultivation, the whole broth (15 L) was filtered and separated into supernatant and mycelia. The former was extracted three times with EtOAc, while the latter was extracted three times with methanol. All extracts were combined and evaporated under reduced pressure to give a crude extract (14.0 g).
3.4. Isolation and Purification
The crude extract was chromatographed over ODS, eluting with mixtures of MeOH/H2O to obtain five fractions (Fr.1 to Fr.5). Fr.1 and Fr.2 were separated on the Sephadex LH-20 column with MeOH to obtain Fr.1.1 and Fr.2.1. Fr.1.1 was further purified by semipreparative HPLC (20% ACN/H2O) to yield compound 5 (tR = 9.8 min, 3.0 mg). Fr.2.1 was further separated by semipreparative HPLC (58% MeOH/H2O) to obtain Fr.2.1.1 and Fr.2.1.2. Fr.2.1.1 was further purified by semipreparative HPLC (62% ACN/H2O) to yield compound 3 (tR = 10.5 min 6.0 mg). Fr.2.1.2 was further purified by semipreparative HPLC (50% ACN/H2O) to yield compound 4 (tR = 15.0 min 3.0 mg).
Fr.3 was separated by semipreparative HPLC (58% MeOH/H2O) to obtain Fr.3.1 and Fr.3.2. Fr.3.1 was further purified by semipreparative HPLC (64% ACN/H2O), semipreparative HPLC (60% ACN/H2O) and semipreparative HPLC (52% ACN/H2O), respectively, to yield compounds 7 (tR = 8.1 min 6.0 mg), 11 (tR = 10.0 min 8.5 mg), 6 (tR = 11.0 min 3.0 mg). Fr.3.2 was further purified by semipreparative HPLC (52% ACN/H2O) to yield compound 9 (tR = 10.5 min 6.0 mg).
Fr.4 was separated by semipreparative HPLC (60% MeOH/H2O) to obtain Fr.4.1 and Fr.4.2. Fr.4.1 was further purified by semipreparative HPLC (52% ACN/H2O) to yield compound 1 (tR = 13.8 min 2.5 mg). Fr.4.2 was further purified by semipreparative HPLC (58% ACN/H2O) to yield compound 10 (tR = 11.2 min 3.0 mg). Fr.5 was separated by semipreparative HPLC (58% MeOH/H2O) to obtain Fr.5.1 and Fr.5.2. Fr.5.1 was further purified by semipreparative HPLC (64% ACN/H2O) to yield compound 8 (tR = 9.8 min 3.0 mg). Fr.5.2 was further purified by semipreparative HPLC (62% ACN/H2O) to yield compound 2 (tR = 12.0 min 3.0 mg).
Corallomycetellain A (1): light-yellow amorphous powder; + 86.0 (c 0.5 mg/mL, MeOH); UV (MeOH) λmax: 249 nm; ECD (MeOH) λmax 217 (−), 259 (−), 293 (+) nm; 1H and 13C NMR data, Table 1; HRESIMS m/z 417.0880 [M + Na]+ (calcd. for C21H18N2O4SNa, 417.0885).
Corallomycetellain B (2): light-yellow amorphous powder; + 41.6 (c 0.5 mg/mL, MeOH); UV (MeOH) λmax: 253 nm; ECD (MeOH) λmax 221 (−), 266 (−), 308 (+) nm; 1H and 13C NMR data, Table 1; HRESIMS m/z 449.0589 [M + Na]+ (calcd. for C21H18N2O4S2Na, 449.0606).
Corallomycetellain C (3): light-yellow amorphous powder; − 36.0 (c 0.25 mg/mL, MeOH); UV (MeOH) λmax: 264 nm; ECD (MeOH) λmax 227 (−), 285 (+) nm; 1H and 13C NMR data, Table 2; HRESIMS m/z 557.0835 [M + Na]+ (calcd. for C24H26N2O6S3Na, 557.0851).
Corallomycetellain D (4): light-yellow amorphous powder; − 48.0 (c 0.25 mg/mL, MeOH); UV (MeOH) λmax: 263 nm; ECD (MeOH) λmax 230 (−), 279 (+) nm; 1H and 13C NMR data, Table 2; HRESIMS m/z 541.1078 [M + Na]+ (calcd. for C24H26N2O7S2Na, 541.1079).
Corallomycetellain E (5): yellow oil; [α] − 1.5 (c 0.5 mg/mL, MeOH); UV (MeOH) λmax: 211, 264 nm; ECD (MeOH) λmax 222 (−), 256 (−), 285 (+) nm; 1H and 13C NMR data, Table 3; HRESIMS m/z 453.1139 [M + H]+ (calcd. for C20H25N2O6S2, 453.1154).
Corallomycetellain F (6): colorless oil; [α] + 144.0 (c 0.5 mg/mL, MeOH); UV (MeOH) λmax: 216, 264 nm; ECD (MeOH) λmax 226 (−), 280 (+) nm; 1H and 13C NMR data, Table 4; HRESIMS m/z 467.1070 [M + Na]+ (calcd. for C21H18N2O4SNa, 467.1075).
Corallomycetellain G (7): white powder; [α] − 113.6 (c 0.5 mg/mL, MeOH); UV (MeOH) λmax: 265 nm; ECD (MeOH) λmax 218 (−), 239 (−), 276 (+) 356 (−) nm. 1H and 13C NMR data, Table 5; HRESIMS m/z 495.0655 [M + Na]+ (calcd. for C22H20N2O6S2Na, 495.0660).
Corallomycetellain H (8): white powder; [α] − 102.0 (c 0.5 mg/mL, MeOH); UV (MeOH) λmax: 264 nm; ECD (MeOH) λmax 218 (−), 238 (−), 276 (+) 356 (−) nm; 1H and 13C NMR data, Table 5; HRESIMS m/z 523.0594 [M + Na]+ (calcd. for C24H24N2O6S2Na, 523.0973).
Corallomycetellain I (9): white powder; [α] − 312.3 (c 0.3 mg/mL, MeOH); UV (MeOH) λmax: 268 nm; ECD (MeOH) λmax 211 (−), 230 (+), 261 (−) nm; 1H and 13C NMR data, Table 6; HRESIMS m/z 527.0389 [M + Na]+ (calcd. for C22H20N2O6S3Na, 527.0381).
Corallomycetellain J (10): white powder; [α] − 314.8 (c 0.5 mg/mL, MeOH); UV (MeOH) λmax: 212, 262 nm; ECD (MeOH) λmax 221 (−), 242 (−), 285 (+) nm; 1H and 13C NMR data, Table 6; HRESIMS m/z 435.0432 [M + Na]+ (calcd. for C20H16N2O4S2Na, 435.0449).
Haematocin (11): white powder; ECD (MeOH) λmax 219 (−), 285 (+) nm; 1H and 13C NMR data, Figures S91 and S92.
3.5. LC–MS/MS and Molecular Networking Analysis
Liquid chromatography–tandem mass spectrometry (LC–MS/MS) analyses were performed on a Dionex Ultimate 3000 UHPLC system (Thermo Scientific) coupled to a Q Exactive hybrid quadrupole-Orbitrap mass spectrometer (Thermo Scientific). Electrospray ionization was operated in negative-ion mode. The mobile phase comprised 0.1% (v/v) formic acid in ultrapure water (solvent A) and HPLC-grade acetonitrile (solvent B). The gradient was 0–1 min, 10% B; 1–23 min, linear increase to 100% B; 100% B held until 26 min; 26–30 min, return to 10% B and re-equilibration. The flow rate was 0.25 mL/min and the injection volume was 3 µL.
All MS/MS data were converted to mzXML format files by MSConvert software (v3.0.20169, ProteoWizard, Palo Alto, CA, USA). WinSCP as an FTP client was used to upload mzXML format files to GNPS for analysis. The desired files or entire folders were then assigned to different analysis groups (from G1 to G6). The molecular network was constructed using the GNPS data analysis workflow and algorithms. The network visualizations were completed through Cytoscape (v3.10.3; National Resource for Network Biology, San Diego, CA, USA).
3.6. ECD Calculations
Conformational searches were performed using the systematic protocol in Spartan’ 14 [19] with the Merck Molecular Force Field (MMFF). Each MMFF minimum was re-optimized at the B3LYP/6-31+G(d) level of density functional theory using Gaussian09 (D.01, Gaussian, Inc., Wallingford, CT, USA) [20] Optimizations were initiated from multiple starting conformers, and vibrational frequency analyses confirmed that all stationary points are true minima. For each configurational ensemble, the lowest energy conformers with Boltzmann populations > 5% were retained. Excited-state properties for these conformers were computed with time-dependent DFT (TD-DFT) for twenty singlet excited states; solvation in methanol was treated with the polarizable continuum model (PCM). ECD spectra were simulated with SpecDis [21]; each transition was convoluted with a Gaussian band shape (0.26 eV FWHM), and an overall blue or red shift was applied to match the experimental spectra.
3.7. In Vitro Cytotoxicity Assays
The cytotoxicity of compounds 1–10 against K562 cells was evaluated using the MTT assay, while their effects on a panel of adherent cell lines (L-02, ASPC-1, NCI-H446, NCI-H446/EP, MIA-PACA-2, and MIA-PACA-2AR) were assessed using the SRB assay. Doxorubicin was used as the positive control in all assays. The half-maximal inhibitory concentration (IC50) values were calculated by fitting the dose–response curves obtained after 72 h of continuous drug exposure. Data were presented as the mean from three independent experiments. The detailed methodologies for biological testing have been described in previous reports [22,23].
4. Conclusions
Ten new epipolythiodioxopiperazine (ETP) alkaloids, namely corallomycetellains A–J (1–10) and one known compound haematocin (11) were isolated from the marine sediment-derived fungi Corallomycetella repens HDN23-0007. Their structures, including absolute configurations, were elucidated by NMR, MS spectroscopic data and electronic circular dichroism (ECD) calculations. Among them, corallomycetellains A (1) and B (2) are the first reported aranotin-type ETPs containing aromatic indole moieties. In bioassays, corallomycetellains G–J (7–10), contained α–α′ polysulfide bridges, exhibited strong anticancer activity, with IC50 values ranging from 1.1 to 9.3 μM. Among them, corallomycetellain J (10) exhibited the most potent activity, particularly against ASPC-1 and NCI-H446/EP cell lines (IC50 = 1.5–2.3 μM), surpassing the reference drug Doxorubicin (IC50 = 5.9–11.3 μM). Overall, this study expands the chemical diversity of marine fungal metabolites and provides promising leads for the development of novel anticancer agents. It is worth noting that the ETP alkaloids, characterized by their sulfur bridges, often exhibit significant cytotoxicity. The potent activity observed in compounds 7–10 likely stems from the reactive polysulfide linkage, which can engage in redox cycling or cross-link with critical cellular thiols. While these effects contribute to their strong inhibitory impact on cancer cells, the potential for non-specific toxicity towards normal cells remains a challenge for their clinical translation. In terms of anti-angiogenesis, ETP-type molecules are known to disrupt the interaction between the transcription factor HIF-1α and its coactivator p300 by targeting the zinc-binding CH1 domain, suggesting that they could potentially inhibit tumor vascularization. Therefore, to mitigate these risks, future studies should focus on structural optimization, such as the development of prodrugs or targeted delivery systems to enhance tumor specificity.
Supplementary Materials
The following supporting information can be downloaded at https://www.mdpi.com/article/10.3390/md24020062/s1, Figure S1: The pictures of sediment sample and Corallomycetella repens HDN23-0007; Figure S2: The structure of 1 and 2, known aranotin-type ETPs and analogue; Figures S3–S89: The HRESIMS, 1D, 2D NMR, UV and CD spectra of compounds 1–10; Figures S90–S93: The 1D NMR, CD and UPLC-MS spectra of 11; Figures S94–S103: HPLC purity chromatogram of compounds 1–10; Figure S104: Isolation of compounds from the extract of fungus HDN23-0007; Figure S105: Comparative HPLC analysis of corallomycetellains A–J (1–10) and ITS (Internal Transcribed Spacer) sequence data of the strain Corallomycetella repens HDN23-0007.
Author Contributions
The contributions of the respective authors are as follows: C.Z. and L.Z. drafted the work and performed isolation and structural elucidation of the extract. S.Z. and W.W. performed isolation and scale-up fermentation of the strain. Biological evaluations were performed by X.Z., Q.C. and T.Z. checked the whole procedures of this work. D.L. and M.H. designed the project and contributed to the critical reading of the manuscript. All authors have read and agreed to the published version of the manuscript.
Funding
This work was supported by the National Natural Science Foundation of China (82473837), the Fundamental Research Funds for the Central Universities (202372009 and 202572006), the National Key R&D Program of China (2024YFC2816004), the Qingdao Marine Science and Technology Center (2022QNLM030003-1), the Key R&D Program of Hainan Province (ZDYF2023SHFZ144), the Science and Technology Project of Qingdao Shinan District (2023-2-022-YY) and the Taishan Scholar Distinguished Expert Program in Shandong Province (tstp20240504).
Institutional Review Board Statement
Not applicable.
Data Availability Statement
The original contributions presented in this study are included in the article/Supplementary Materials. Further inquiries can be directed to the corresponding authors.
Conflicts of Interest
The authors declare no conflicts of interest.
References
- Murdock, K.C. Antiviral agents. Chemical modifications of a disulfide antibiotic, acetylaranotin. J. Med. Chem. 1974, 17, 827–835. [Google Scholar] [CrossRef] [PubMed]
- Cole, R.J.; Cox, R.H. Handbook of Toxic Fungal Metabolites; Academic Press: Cambridge, MA, USA, 1981. [Google Scholar]
- Kweon, Y.O.; Paik, Y.H.; Schnabl, B.; Qian, T.; Lemasters, J.J.; Brenner, D.A. Gliotoxin-mediated apoptosis of activated human hepatic stellate cells. J. Hepatol. 2003, 39, 38–46. [Google Scholar] [CrossRef] [PubMed]
- Isham, C.R.; Tibodeau, J.D.; Jin, W.; Xu, R.; Timm, M.M.; Bible, K.C. Chaetocin: A promising new antimyeloma agent with in vitro and in vivo activity mediated via imposition of oxidative stress. Blood 2007, 109, 2579–2588. [Google Scholar] [CrossRef] [PubMed]
- Cherblanc, F.L.; Chapman, K.L.; Brown, R.; Fuchter, M.J. Chaetocin is a nonspecific inhibitor of histone lysine methyltransferases. Nat. Chem. Biol. 2013, 9, 136–137. [Google Scholar] [CrossRef] [PubMed]
- Fujimoto, H.; Sumino, M.; Okuyama, E.; Ishibashi, M.; Ishibashi, M. Immunomodulatory Constituents from an Ascomycete, Chaetomium seminudum. J. Nat. Prod. 2004, 67, 3, 526. [Google Scholar] [CrossRef][Green Version]
- Elliott, C.E.; Gardiner, D.M.; Thomas, G.; Cozijnsen, A.; Van den Wounga, A.; Howlett, B.J. Production of the toxin sirodesmin PL by Leptosphaeria maculans during infection of Brassica napus. Mol. Plant Pathol. 2007, 8, 791–802. [Google Scholar] [CrossRef] [PubMed]
- Chai, C.L.L.; Waring, P. Redox sensitive epidithiodioxopiperazines in biological mechanisms of toxicity. Redox Rep. 2000, 5, 257–264. [Google Scholar] [CrossRef] [PubMed]
- Wang, Q.; Zhang, K.; Wang, W.; Zhang, G.; Zhu, T.; Che, Q.; Gu, Q.; Li, D. Amphiepicoccins A–J: Epipolythiodioxopiperazines from the Fish Gill-Derived Fungus Epicoccum nigrum HDN17-88. J. Nat. Prod. 2020, 83, 8–13. [Google Scholar] [CrossRef] [PubMed]
- Zhu, M.; Zhang, X.; Feng, H.; Dai, J.; Li, J.; Che, Q.; Gu, Q.; Zhu, T.; Li, D. Penicisulfuranols A–F, Alkaloids from the Mangrove Endophytic Fungus Penicillium janthinellum HDN13-309. J. Nat. Prod. 2017, 80, 71–75. [Google Scholar] [CrossRef] [PubMed]
- Kang, K.B.; Park, E.J.; da Silva, R.R.; Kim, H.W.; Dorrestein, P.C.; Sung, S.H. Targeted Isolation of Neuroprotective Dicoumaroyl Neolignans and Lignans from Sageretia theezans Using in Silico Molecular Networking. J. Nat. Prod. 2018, 81, 1819–1828. [Google Scholar] [CrossRef] [PubMed]
- Wang, M.; Carver, J.J.; Phelan, V.V.; Sanchez, L.M.; Garg, N.; Peng, Y.; Nguyen, D.D.; Watrous, J.; Kapono, C.A.; Luzzatto-Knaan, T.; et al. Sharing and community curation of mass spectrometry data with Global Natural Products Social Molecular Networking. Nat. Biotechnol. 2016, 34, 828–837. [Google Scholar] [CrossRef] [PubMed]
- Suzuki, Y.; Takahashi, H.; Esumi, Y.; Arie, T.; Morita, T.; Koshino, H.; Uzawa, J.; Uramoto, M.; Yamaguchi, I. Haematocin, a new antifungal diketopiperazine produced by Nectria haematococca Berk. et Br. (880701a-1) causing nectria blight disease on ornamental plants. J. Antibiot. 2000, 53, 45–49. [Google Scholar] [CrossRef] [PubMed]
- Centko, R.M.; Ratnaweera, P.B.; Tysoe, C.R.; Withers, S.G.; De Silva, E.D.; Andersen, R. Alpha-glucosidase and alpha-amylase inhibiting thiodiketopiperazines from the endophytic fungus Setosphaeria rostrata isolated from the medicinal plant Costus speciosus in Sri Lanka. Phytochem. Lett. 2017, 22, 76–80. [Google Scholar] [CrossRef]
- Kong, F.; Wang, Y.; Liu, P.; Dong, T.; Zhu, W. Thiodiketopiperazines from the marine-derived fungus Phoma sp. OUCMDZ-1847. J. Nat. Prod. 2014, 77, 132–137. [Google Scholar] [CrossRef] [PubMed]
- Taniguchi, M.; Watanabe, M.; Komiya, M.; Yokoi, T. New Dioxopiperazine Derivatives for Control of Helicobacter pylori. Patent JP2001011075A, 16 January 2001. [Google Scholar]
- Kawahara, N.; Nozawa, K.; Yamazaki, M.; Nakajima, S.; Kawai, K. Novel epidithiodioxopiperazines, emethallicins E and F, from Emericella heterothallica. Heterocycles 1990, 30, 507–515. [Google Scholar]
- Choi, E.J.; Park, J.S.; Kim, Y.J.; Jung, J.H.; Lee, J.K.; Kwon, H.C.; Yang, H.O. Apoptosis-inducing effect of diketopiperazine disulfides produced by Aspergillus sp. KMD 901 isolated from marine sediment on HCT116 colon cancer cell lines. J. Appl. Microbiol. 2011, 110, 304–313. [Google Scholar] [CrossRef] [PubMed]
- Spartan’14; Wavefunction Inc.: Irvine, CA, USA, 2013.
- Frisch, M.J.; Trucks, G.W.; Schlegel, H.B.; Scuseria, G.E.; Robb, M.A.; Cheeseman, J.R.; Scalmani, G.; Barone, V.; Mennucci, B.; Petersson, G.A.; et al. Gaussian 09, Revision A.1; Gaussian, Inc.: Wallingford, CT, USA, 2009. [Google Scholar]
- Bruhn, T.; Hemberger, Y.; Schaumloffel, A.; Bringmann, G. SpecDis, Version 1.53; University of Wuerzburg: Wuerzburg, Germany, 2011. [Google Scholar]
- Du, L.; Feng, T.; Zhao, B.Y.; Li, D.H.; Cai, S.X.; Zhu, T.J.; Wang, F.P.; Xiao, X.; Gu, Q.Q. Alkaloids from a deep ocean sediment-derived fungus Penicillium sp. and their antitumor activities. J. Antibiot. 2010, 63, 165–170. [Google Scholar] [CrossRef] [PubMed]
- Mosmann, T. Rapid colorimetric assay for cellular growth and survival: Application to proliferation and cytotoxicity assays. J. Immunol. Methods 1983, 65, 55–63. [Google Scholar] [CrossRef] [PubMed]


Disclaimer/Publisher’s Note: The statements, opinions and data contained in all publications are solely those of the individual author(s) and contributor(s) and not of MDPI and/or the editor(s). MDPI and/or the editor(s) disclaim responsibility for any injury to people or property resulting from any ideas, methods, instructions or products referred to in the content. |
© 2026 by the authors. Licensee MDPI, Basel, Switzerland. This article is an open access article distributed under the terms and conditions of the Creative Commons Attribution (CC BY) license.