

Computed Tomography Angiography-Guided Study of the Superficial Femoral Artery Course in the Thigh and the Identification of Dangerous Zones for Lateral Femoral Surgical Approaches


Abstract
1. Introduction
2. Materials and Methods
2.1. Study Design
2.2. Patient Selection
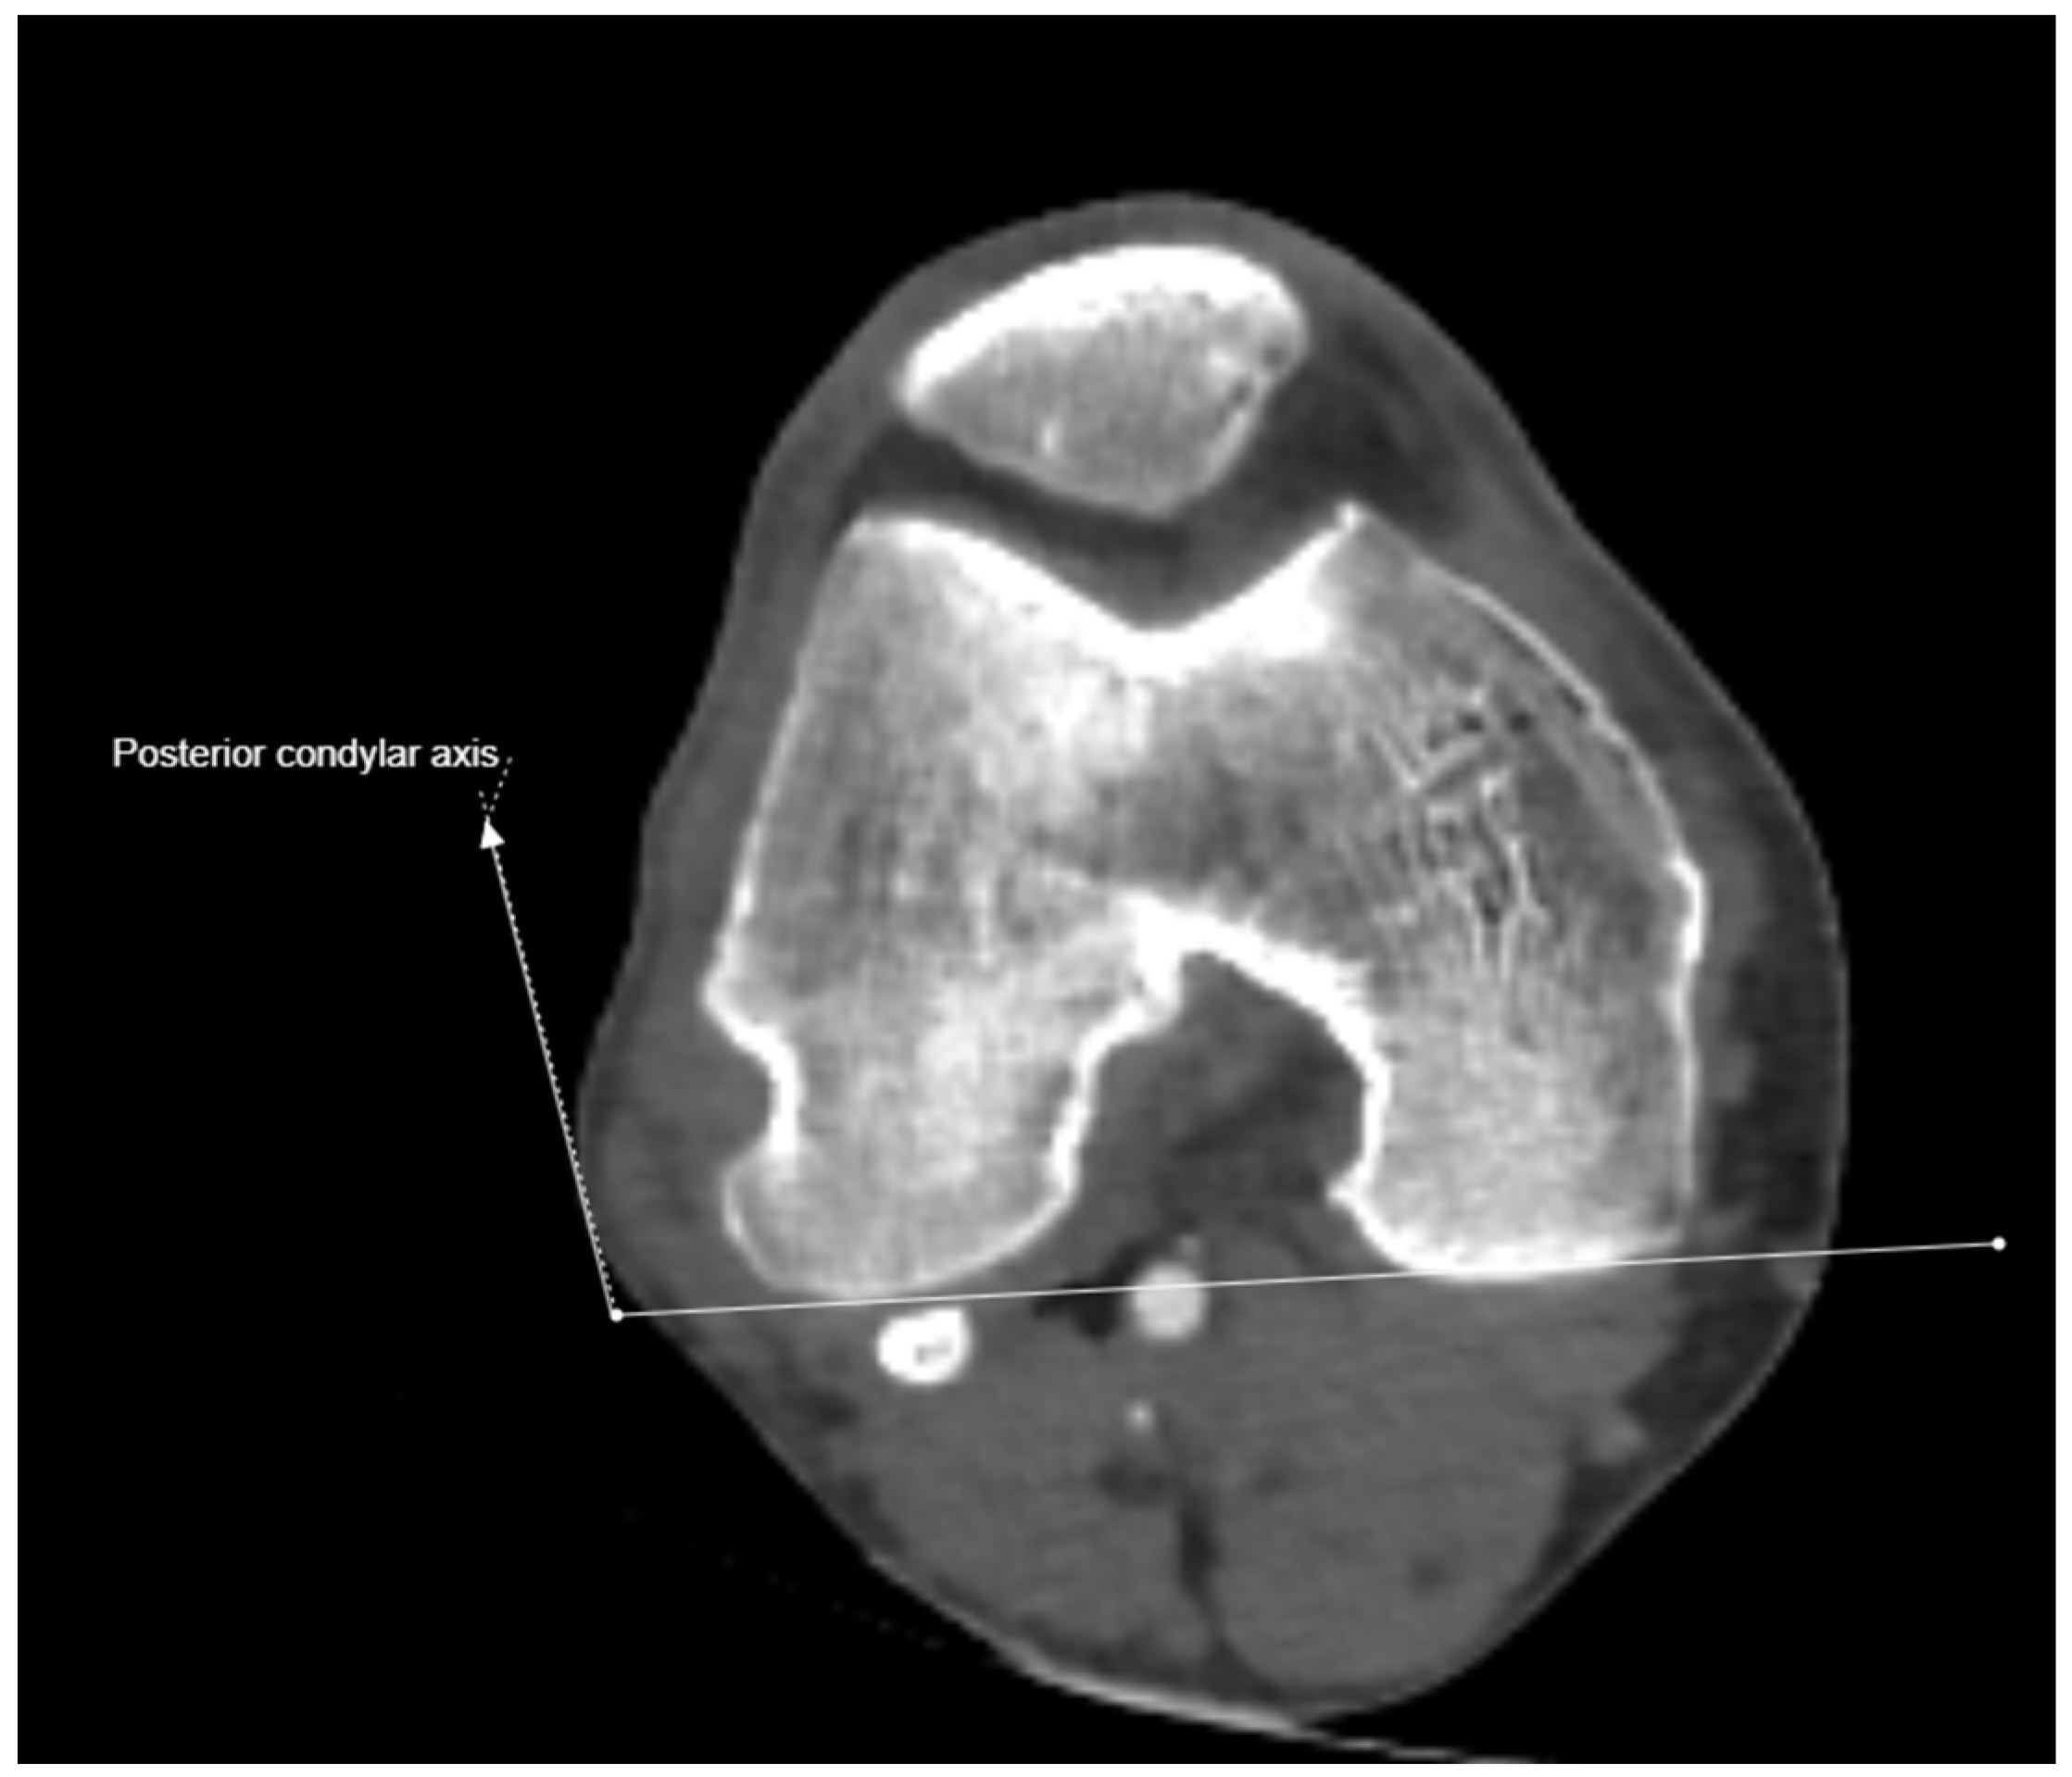
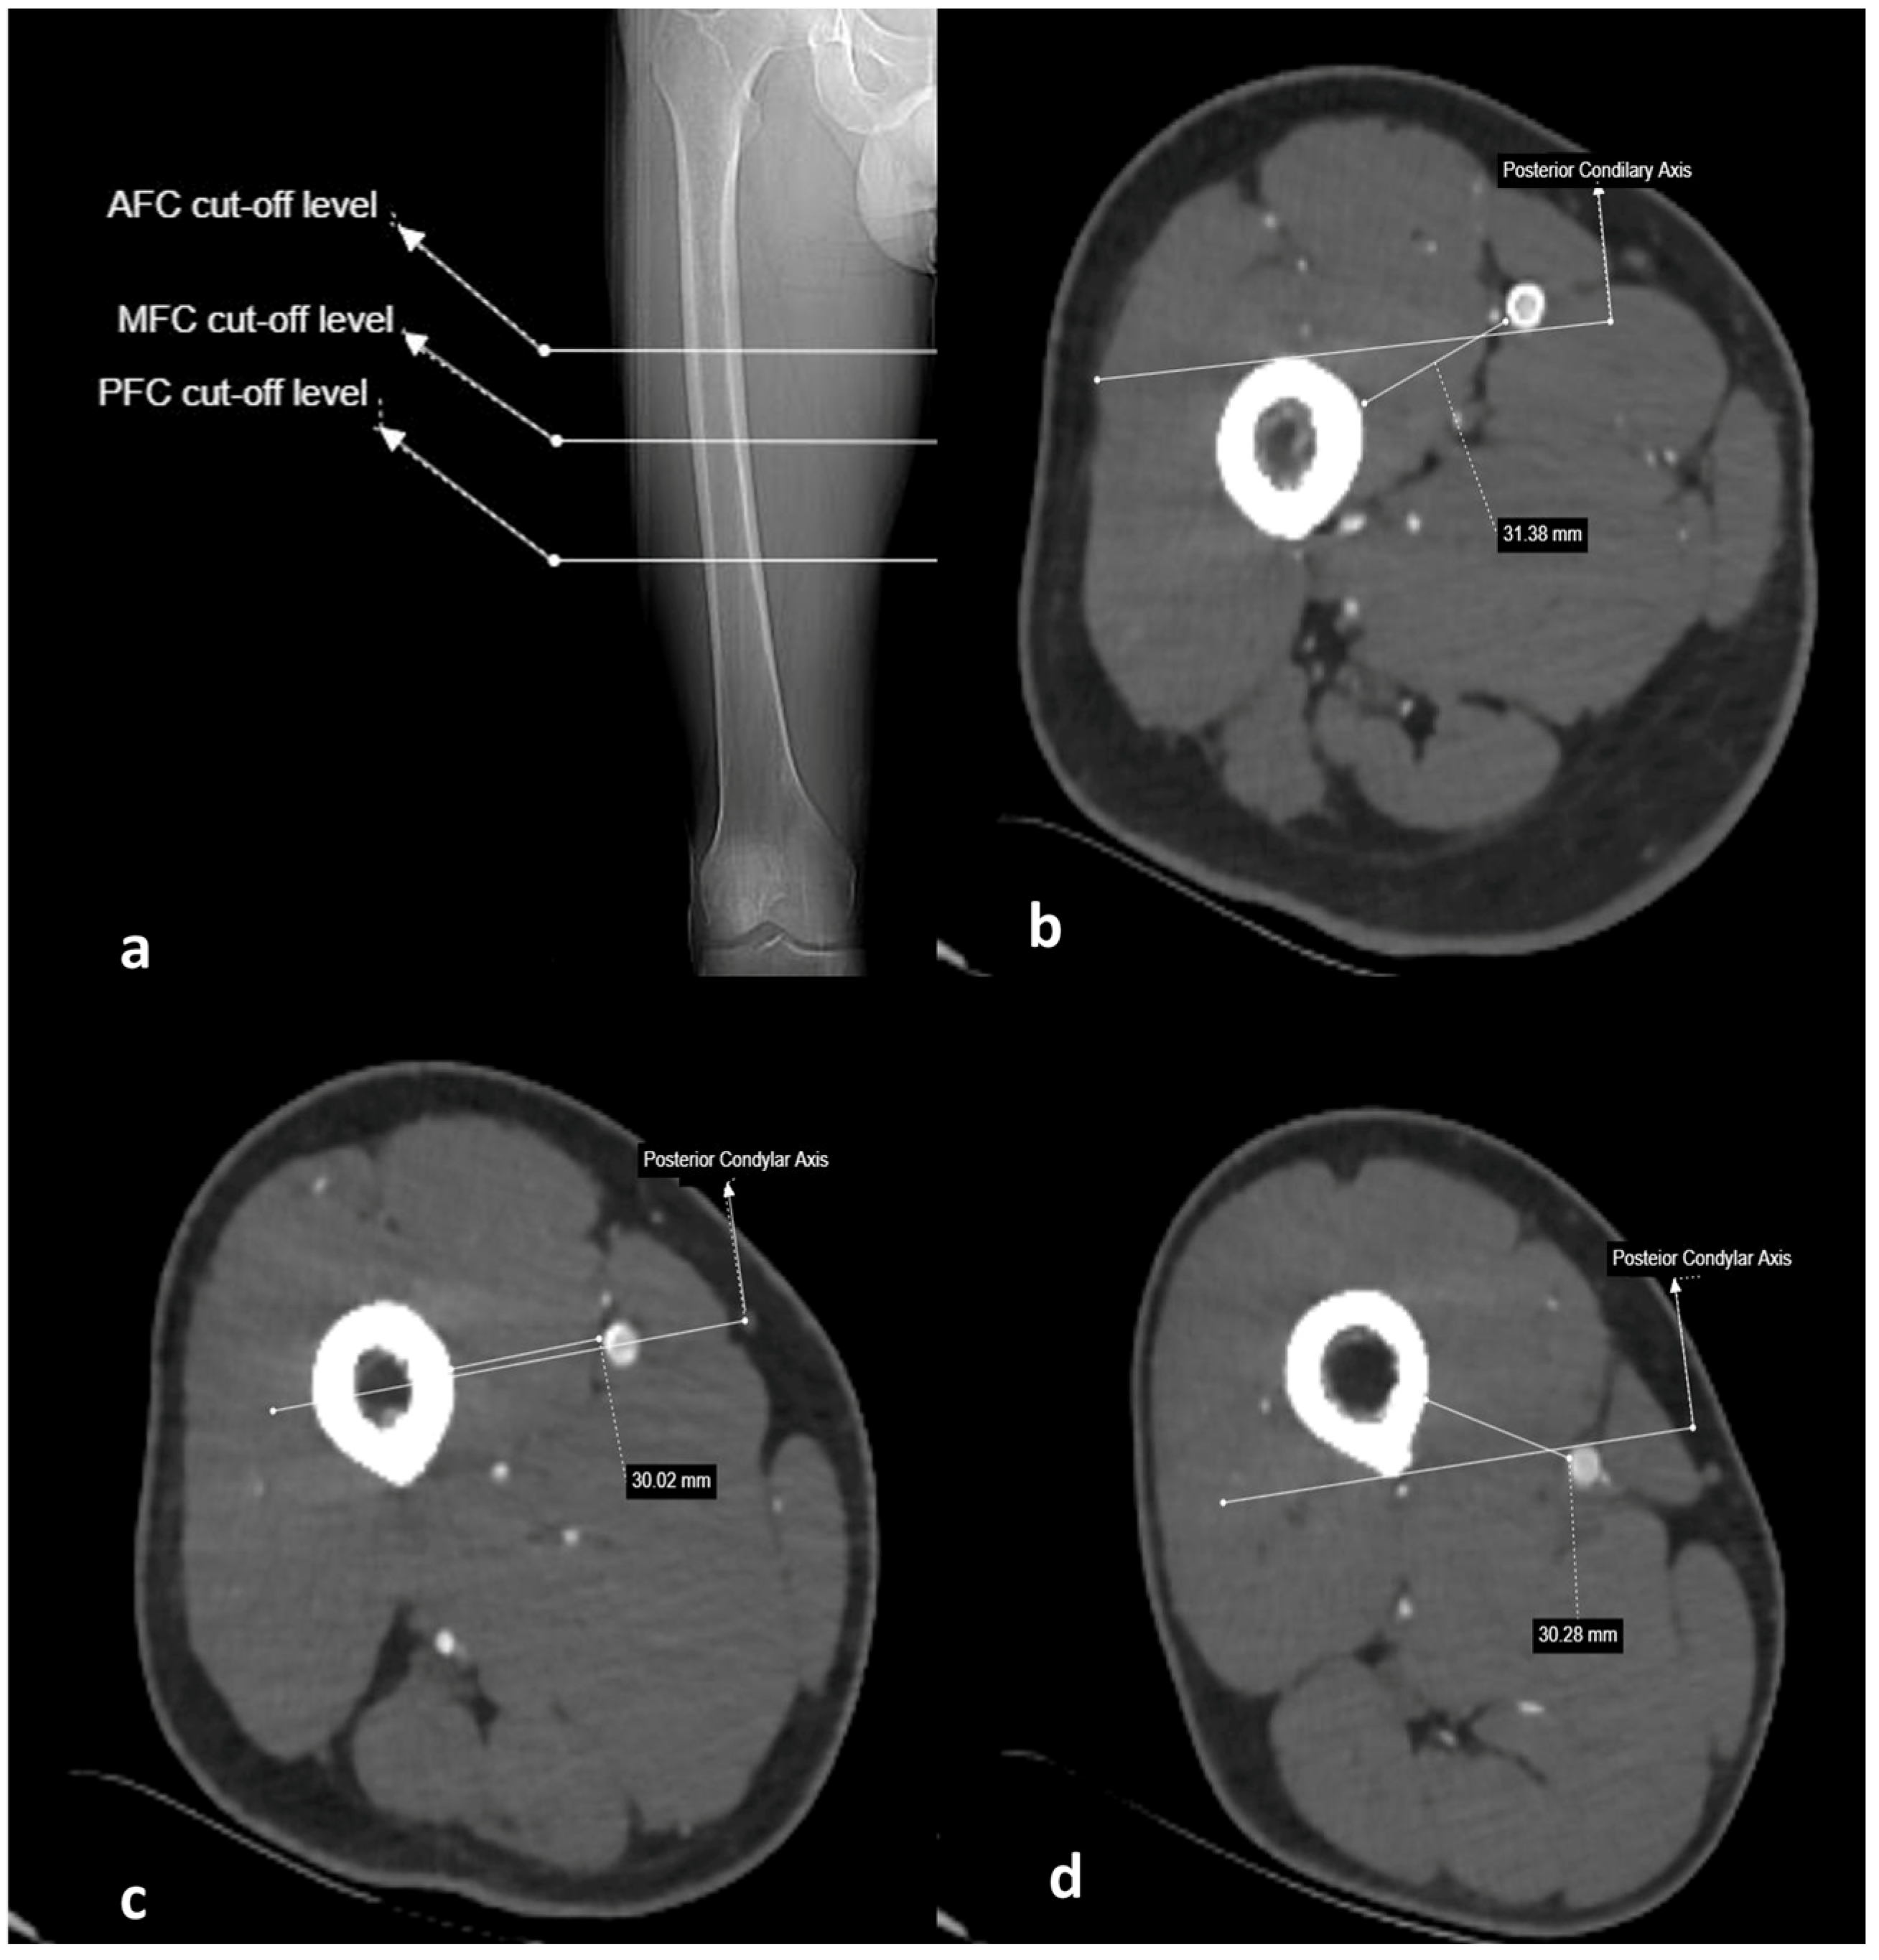
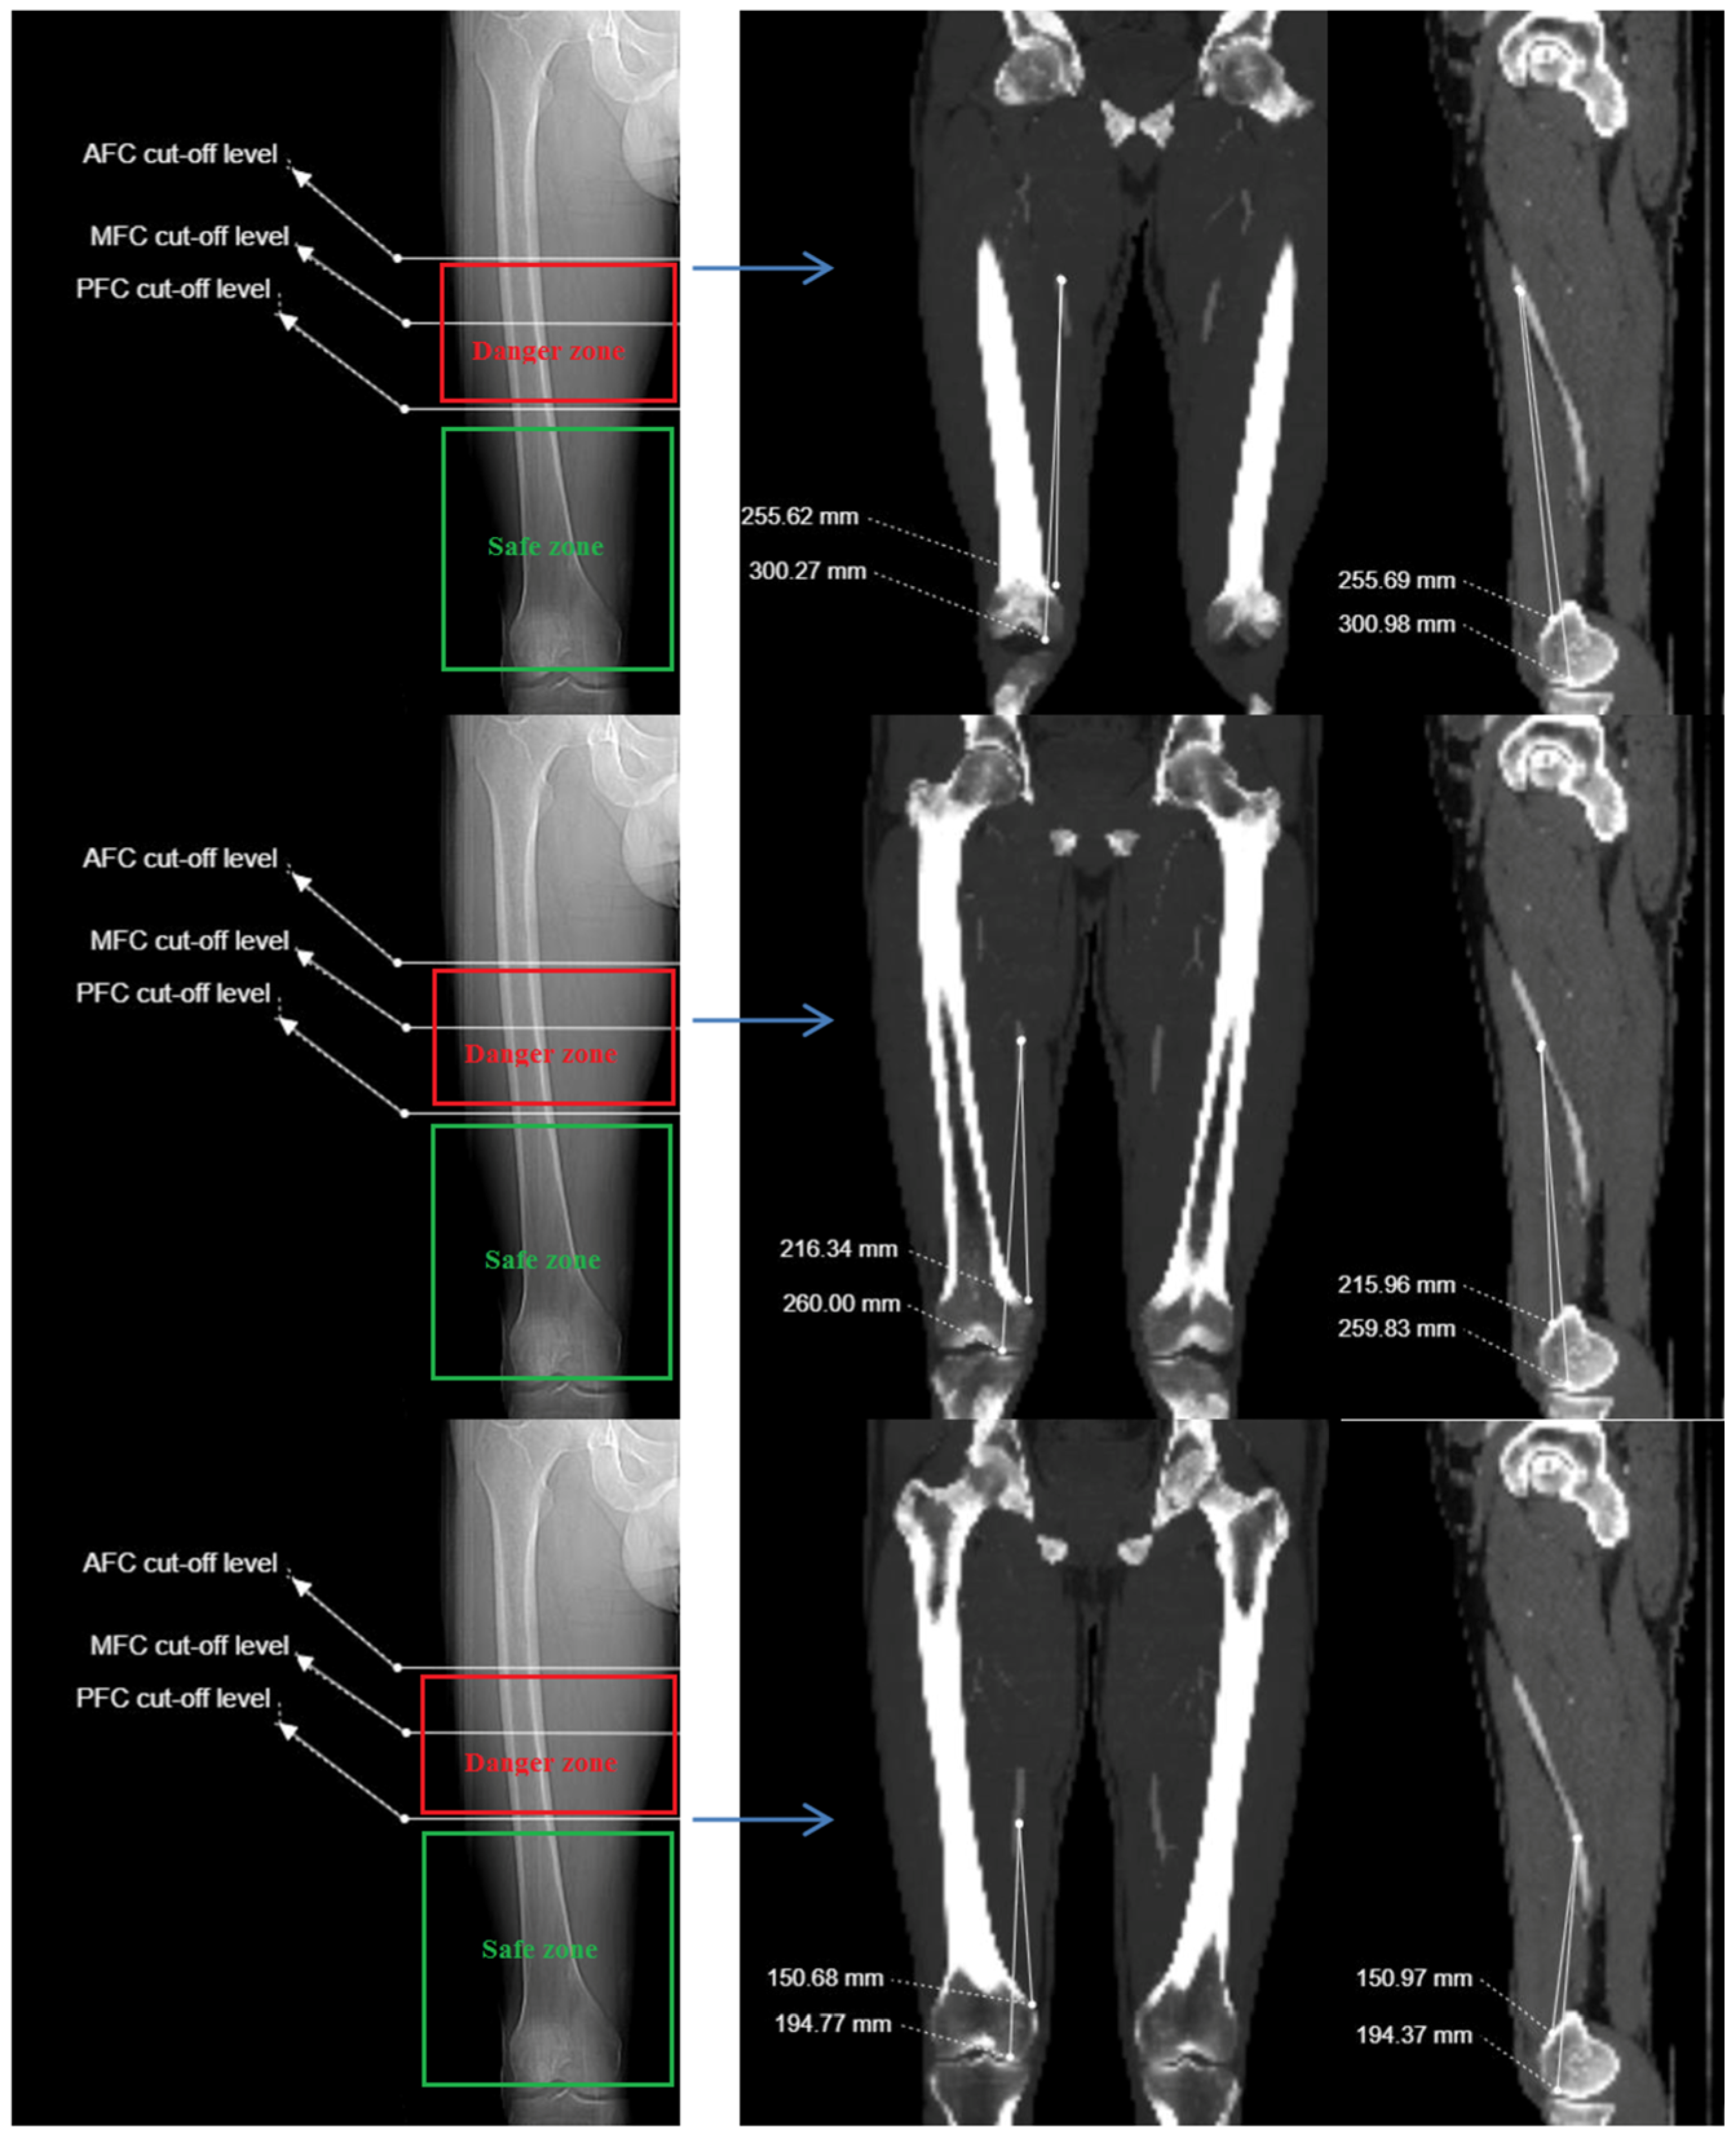
2.3. Imaging and Measurement Methods
2.4. Statistical Analysis
3. Results
4. Discussion
5. Conclusions
Supplementary Materials
Author Contributions
Funding
Institutional Review Board Statement
Informed Consent Statement
Data Availability Statement
Conflicts of Interest
Abbreviations
| AFC | Anterior femoral cortex |
| AT | Adductor tubercle |
| CT | Computed tomography |
| CTA | Computed tomography angiography |
| DFA | Deep femoral artery |
| DMC | Distal medial condylar plateau |
| FA | Femoral artery |
| GT | Greater trochanter |
| MFC | Medial femoral cortex |
| MIPO | Minimally invasive plate osteosynthesis |
| NA | Not applicable |
| PFC | Posterior femoral cortex |
| SD | Standard deviation |
| SFA | Superficial femoral artery |
References
- Schulte, E.; Schumacher, U. Arterial Supply to the Thigh. In Thieme Atlas of Anatomy: General Anatomy and Musculoskeletal System, 1st ed.; Lawrence, M., Lamperti, E.D., Eds.; Thieme: New York, NY, USA, 2006; pp. 489–490. [Google Scholar]
- Maslow, J.I.; Collinge, C.A. Course of the Femoral Artery in the Mid- and Distal Thigh and Implications for Medial Approaches to the Distal Femur: A CT Angiography Study. J. Am. Acad. Orthop. Surg. 2019, 27, e659–e663. [Google Scholar] [CrossRef] [PubMed]
- Grimaldi, M.; Courvoisier, A.; Tonetti, J.; Vouaillat, H.; Merloz, P. Superficial femoral artery injury resulting from intertrochanteric hip fracture fixation by a locked intramedullary nail. Orthop. Traumatol. Surg. Res. 2009, 95, 380–382. [Google Scholar] [CrossRef] [PubMed]
- Eslami, M.H.; Silvia, B.A. Endovascular repair of femoral artery pseudoaneurysm after orthopedic surgery with balloon-expandable covered stents. Vasc. Endovascular Surg. 2008, 42, 176–179. [Google Scholar] [CrossRef] [PubMed]
- Tiwary, S.K.; Kumar, S.; Khanna, R.; Khanna, A.K. Iatrogenic femoral artery aneurysms in orthopaedic practice. ANZ J. Surg. 2007, 77, 899–901. [Google Scholar] [CrossRef]
- Handolin, L.; Pajarinen, J.; Tulikoura, I. Injury to the deep femoral artery during proximal locking of a distal femoral nail—A report of 2 cases. Acta Orthop. Scand. 2003, 74, 111–113. [Google Scholar] [CrossRef]
- Mehta, V.; Finn, H.A. Femoral artery and vein injury after cerclage wiring of the femur: A case report. J. Arthroplast. 2005, 20, 811–814. [Google Scholar] [CrossRef]
- Aleto, T.; Ritter, M.A.; Berend, M.E. Case report: Superficial femoral artery injury resulting from cerclage wiring during revision THA. Clin. Orthop. Relat. Res. 2008, 466, 749–753. [Google Scholar] [CrossRef]
- Paul, M.A.; Patka, P.; van Heuzen, E.P.; Koomen, A.R.; Rauwerda, J. Vascular injury from external fixation: Case reports. J. Trauma. 1992, 33, 917–920. [Google Scholar] [CrossRef]
- Ha, Y.C.; Luminita, S.; Cho, S.H.; Choi, J.Y.; Koo, K.H. Laceration of femoral vessels by an avulsion fracture fragment of the lesser trochanter after bipolar hemiarthroplasty. J. Arthroplasty 2005, 20, 680–683. [Google Scholar] [CrossRef]
- DeCasas, R.; Lázaro, F.J.; García-Rayo, M.R.; Arias, J. Arteriovenous fistula after interlocking nailing of the femur: A case report. J. Trauma 1995, 38, 303–304. [Google Scholar] [CrossRef]
- Yang, K.H.; Park, H.W.; Park, S.J. Pseudoaneurysm of the superficial femoral artery after closed hip nailing with a Gamma nail: Report of a case. J. Orthop. Trauma 2002, 16, 124–127. [Google Scholar] [CrossRef] [PubMed]
- Yang, K.H.; Yoon, C.S.; Park, H.W.; Won, J.H.; Park, S.J. Position of the superficial femoral artery in closed hip nailing. Arch. Orthop. Trauma Surg. 2004, 124, 169–172. [Google Scholar] [CrossRef] [PubMed]
- Kapoor, R.; Adhikary, S.D.; Siefring, C.; McQuillan, P.M. The saphenous nerve and its relationship to the nerve to the vastus medialis in and around the adductor canal: An anatomical study. Acta Anaesthesiol. Scand. 2012, 56, 365–367. [Google Scholar] [CrossRef] [PubMed]
- Kwon, J.Y.; Johnson, C.E.; Appleton, P.; Rodriguez, E.K. Lateral femoral traction pin entry: Risk to the femoral artery and other medial neurovascular structures. J. Orthop. Surg. Res. 2010, 5, 4. [Google Scholar] [CrossRef]
- Han, C.D.; Lee, Y.H.; Yang, K.H.; Yang, I.H.; Lee, W.S.; Park, Y.J.; Suh, J.S.; Park, K.K. Relationship between distal screws and femoral arteries in closed hip nailing on computed tomography angiography. Arch. Orthop. Trauma Surg. 2013, 133, 361–366. [Google Scholar] [CrossRef]
- Mahmoud, S.S.S.; Ahmed, B.; Hamid, K.; Milburn, S.; Baker, P. Identification of the medial femoral safe zone for drilling during dynamic hip screw side plate fixation: A CT angiogram tracing of the profunda femoris artery. Injury 2019, 50, 720–726. [Google Scholar] [CrossRef]
- Narulla, R.S.; Kanawati, A.J. Safe zone for the superficial femoral artery demonstrated on computed tomography angiography. Injury 2016, 47, 748–751. [Google Scholar] [CrossRef]
- Kazemi, S.M.; Keyhani, S.; Sadighi, M.; Hosseininejad, S.M. Navigation of femoral and popliteal artery around the knee with CT angiography: Implications for surgical interventions. Surg. Radiol. Anat. 2023, 45, 1515–1523. [Google Scholar] [CrossRef]
- Asano, Y.; Yamauchi, D.; Gonoji, Y. Evaluation of the positional relationship between femoral arteries and distal screws in the proximal femoral intramedullary nail for preventing iatrogenic vascular injury. Injury 2020, 51, 384–388. [Google Scholar] [CrossRef]
- Kim, J.J.; Oh, H.K.; Bae, J.Y.; Kim, J.W. Radiological assessment of the safe zone for medial minimally invasive plate osteosynthesis in the distal femur with computed tomography angiography. Injury 2014, 45, 1964–1969. [Google Scholar] [CrossRef]
- Jiamton, C.; Apivatthakakul, T. The safety and feasibility of minimally invasive plate osteosynthesis (MIPO) on the medial side of the femur: A cadaveric injection study. Injury 2015, 46, 2170–2176. [Google Scholar] [CrossRef] [PubMed]
- Yilmaz, M.; Aydin, M.; Ersin, M.; Ekinci, M. Safe and dangerous zones for the superficial femoral artery in femoral surgery. Acta Orthop. Belg. 2022, 88, 441–446. [Google Scholar] [CrossRef] [PubMed]
- Apivatthakakul, T.; Siripipattanamongkol, P.; Oh, C.W.; Sananpanich, K.; Phornphutkul, C. Safe zones and a tecnical guide for cerclage wiring of the femur: A computed topographic angiogram (CTA) study. Arch. Orthop. Trauma Surg. 2018, 138, 43–50. [Google Scholar] [CrossRef] [PubMed]
- Carvajal Alba, J.; Constantinescu, D.S.; Lopez, J.D.; Lepkowsky, E.R.; Hernandez, V.H.; Jose, J. Safe Zones and Trajectory of Femoral Pin Placement in Robotic Total Knee Arthroplasty. Arthroplast. Today 2023, 23, 101186. [Google Scholar] [CrossRef]


| Variable | Female (N: 70) Mean ± SD Min–Max | Male (N: 90) Mean ± SD Min–Max | p-Value |
|---|---|---|---|
| Age (year) | 58.48 ± 13.73 (20.0–81.0) | 59.24 ± 13.72 (25.0–88.0) | 0.729 * |
| Femoral head–neck angle (degree) | 21.21 ± 8.97 (3.2–39.1) | 20.99 ± 8.94 (1.4–39.6) | 0.878 * |
| Anteversion angle (degree) | 14.75 ± 6.56 (1.0–27.9) | 15.07 ± 6.92 (0.8–33.3) | 0.769 * |
| Angle of the SFA to the condylar line at the level of the AFC (degree) | 15.66 ± 4.25 (4.2–32.5) | 17.14 ± 5.10 (1.7–40.5) | 0.349 * |
| Angle of the SFA to the condylar line at the level of the PFC (degree) | −35.33 ± 10.16 (−55.7–−10.3) | −37.55 ± 12.09 (−79.2–−18.0) | 0.219 * |
| Anatomical Reference Level | Distance to AT (mm) Mean ± SD | Distance to Distal Medial Condyle (mm) Mean ± SD | Distance to Femoral Cortex (mm) Mean ± SD | Angle Relative to Condyles Line (Degree) Mean ± SD |
|---|---|---|---|---|
| Anterior femoral cortex | 223.01 ± 27.38 (156.3–293.8) | 265.04 ± 28.21 (207.0–334.5) | 27.20 ± 5.32 (15.1–40.4) | 16.49 ± 9.94 (−9.7–40.5) |
| Midsagittal femoral cortex | 180.78 ± 26.83 (107.1–246.3) | 222.40 ± 27.65 (156.1–292.6) | 25.22 ± 5.52 (11.5–58.2) | NA |
| Posterior femoral cortex | 128.01 ± 29.59 (54.1–200.1) | 170.13 ± 29.96 (93.9–241.7) | 22.93 ± 6.04 (7.6–38.0) | −36.58 ± 11.30 (−79.2–−10.3) |
| Distance (mm) | Distance (mm) | |||||
|---|---|---|---|---|---|---|
| Anatomical Reference | Female (N: 70) Mean ± SD Min–Max | Male (N: 90) Mean ± SD Min–Max | p-Value | Left Side (N: 80) Mean ± SD Min–Max | Right Side (N: 80) Mean ± SD Min–Max | p-Value |
| GT to AT distance | 353.09 ± 22.35 (314.1–400.9) | 393.05 ± 18.76 (347.6–443.1) | 0.000 * | 376.02 ± 28.54 (314.1–441.1) | 375.11 ± 28.53 (316.2–443.1) | 0.841 * |
| GT to DMC distance | 392.83 ± 22.48 (351.0–440.0) | 435.81 ± 19.53 (394.6–485.4) | 0.000 * | 417.75 ± 30.28 (351.0–485.4) | 416.26 ± 29.56 (353.0–480.1) | 0.754 * |
| Distance between SFA and AT at level of AFC | 214.25 ± 25.93 (167.7–286.7) | 229.83 ± 26.65 (156.3–293.8) | 0.000 * | 220.72 ± 28.32 (156.3–282.3) | 225.3 ± 26.38 (177.4–293.8) | 0.291 * |
| Distance between SFA and DMC at level of AFC | 253.99 ± 26.11 (207.1–333.1) | 272.59 ± 26.31 (207.5–330.7) | 0.000 * | 262.45 ± 28.77 (207.0–322.9) | 266.45 ± 26.68 (214.8–333.1) | 0.363 * |
| Distance between SFA and AT at level of MFC | 177.31 ± 25.83 (134.9–246.3) | 183.49 ± 27.41 (107.1–238.4) | 0.146 * | 179.56 ± 28.35 (107.1–239.0) | 182.01 ± 25.33 (136.3–246.3) | 0.567 * |
| Distance between SFA and DMC at level of MFC | 216.37 ± 26.7 (167.4–292.6) | 227.09 ± 27.62 (156.1–280.7) | 0.014 * | 221.26 ± 29.09 (156.1–280.7) | 223.54 ± 26.28 (174.1–292.6) | 0.604 * |
| Distance between SFA and AT at level of PFC | 129.21 ± 29.28 (66.0- 200.0) | 127.08 ± 29.96 (54.1–182.7) | 0.653 * | 126.12 ± 30.55 (66.0–198.8) | 129.9 ± 28.66 (54.1–200.1) | 0.422 * |
| Distance between SFA and DMC at level of PFC | 168.56 ± 29.67 (102.0–241.7) | 171.36 ± 30.29 (93.9–229.2) | 0.559 * | 168.37 ± 31.08 (102.0–234.6) | 171.90 ± 28.89 (93.9–241.7) | 0.458 * |
| Distance of SFA to femoral cortex at level of AFC | 24.86 ± 4.24 (15.1–33.2) | 29.03 ± 5.38 (16.0–40.4) | 0.000 * | 26.36 ± 5.35 (15.1–38.5) | 28.05 ± 5.18 (16.6–40.4) | 0.045 * |
| Distance of SFA to femoral cortex at level of MFC | 22.84 ± 4.51 (14.0–33.1) | 27.07 ± 5.55 (11.5–38.2) | 0.000 * | 24.02 ± 5.47 (11.5–38.2) | 26.42 ± 5.33 (13.6–37.8) | 0.006 * |
| Distance of SFA to femoral cortex at level of PFC | 21.92 ± 5.01 (11.3–32.1) | 23.73 ± 6.66 (7.6–38.1) | 0.051 * | 22.07 ± 5.86 (10.5–35.5) | 23.80 ± 6.13 (7.6–38.1) | 0.070 * |
| SFA length between AFC and PFC levels | 85.04 ± 18.80 (55.4–152.1) | 102.74 ± 15.84 (61.1–145.0) | 0.000 * | 94.59 ± 19.29 (55.4–152.1) | 95.40 ± 19.36 (57.4–143.9) | 0.790 * |
| Left Side (N: 80) | Right Side (N: 80) | |||||
|---|---|---|---|---|---|---|
| Anatomical Reference | Female (N: 35) Mean ± SD Min–Max | Male (N: 45) Mean ± SD Min–Max | p-Value | Female (N: 35) Mean ± SD Min–Max | Male (N: 45) Mean ± SD Min–Max | p-Value |
| GT to AT distance | 353.53 ± 21.98 (314.1–400.9) | 393.51 ± 19.33 (347.6–441.1) | 0.000 * | 352.64 ± 23.03 (316.2–400.9) | 392.82 ± 18.52 (355.4–443.1) | 0.000 * |
| GT to DMC distance | 393.29 ± 22.86 (351.0–440.0) | 436.78 ± 19.90 (394.8–485.4) | 0.000 * | 392.32 ± 22.42 (353.0–436.2) | 435.17 ± 19.42 (394.6–480.1) | 0.000 * |
| Distance between SFA and AT the level of AFC | 210.98 ± 23.69 (167.7–269.1) | 228.29 ± 29.54 (156.3–282.3) | 0.005 * | 217.51 ± 27.95 (177.4–286.7) | 231.07 ± 23.85 (182.9–293.8) | 0.022 * |
| Distance between SFA and DMC at level of AFC | 250.74 ± 24.18 (207.0–310.1) | 271.56 ± 28.99 (207.5–322.9) | 0.001 * | 257.24 ± 27.87 (214.8–333.1) | 273.42 ± 23.85 (232.0–330.0) | 0.007 * |
| Distance between SFA and AT at level of MFC | 176.05 ± 25.50 (134.9–239.0) | 182.29 ± 30.39 (107.1–234.8) | 0.321 * | 178.56 ± 26.47 (136.3–246.3) | 185.42 ± 24.12 (136.4–238.4) | 0.292 * |
| Distance between SFA and DMC at level of MFC | 214.34 ± 26.58 (167.4–279.8) | 226.64 ± 30.10 (156.1–280.7) | 0.056 * | 218.40 ± 27.05 (174.1–292.6) | 228.43 ± 24.79 (176.2–279.3) | 0.127 * |
| Distance between SFA and AT at level of PFC | 126.11 ± 30.52 (66.0- 198.8) | 126.14 ± 30.94 (69.9–179.0) | 0.997 * | 132.30 ± 28.08 (69.0–200.1) | 128.65 ± 29.30 (54.1–182.7) | 0.509 * |
| Distance between SFA and DMC at level of PFC | 165.47 ± 31.01 (102.0–234.6) | 170.62 ± 31.30 (107.8–229.0) | 0.456 * | 171.64 ± 28.39 (106.0–241.7) | 173.01 ± 29.27 (93.9–229.2) | 0.945 * |
| Distance of SFA to femoral cortex at level of AFC | 23.79 ± 4.32 (15.1–33.2) | 28.37 ± 5.26 (16.0–38.5) | 0.000 * | 25.92 ± 3.94 (16.6–32.9) | 29.87 ± 5.41 (21.5–40.4) | 0.001 * |
| Distance of SFA to femoral cortex at level of MFC | 21.46 ± 4.39 (14.0–33.1) | 26.01 ± 5.44 (11.5–38.2) | 0.000 * | 24.23 ± 4.24 (16.0–33.7) | 28.23 ± 5.53 (13.6–37.8) | 0.001 * |
| Distance of SFA to femoral cortex at level of PFC | 20.91 ± 5.25 (12.5–32.1) | 22.97 ± 6.21 (10.5–35.5) | 0.113 * | 22.92 ± 4.59 (11.3–31.2) | 24.46 ± 7.15 (7.6–38.0) | 0.236 * |
| SFA length between AFC and PFC levels | 85.87 ± 21.11 (55.4–152.1) | 102.15 ± 13.79 (71.2–145.0) | 0.000 * | 85.20 ± 16.47 (57.4–127.2) | 102.41 ± 16.88 (61.1–136.4) | 0.000 * |
| Ratio | Female (N: 70) Mean ± SD Min–Max | Male (N: 90) Mean ± SD Min–Max | p-Value | Left Side (N: 80) Mean ± SD Min–Max | Right Side (N: 80) Mean ± SD Min–Max | p-Value |
|---|---|---|---|---|---|---|
| Ratio 1 | 0.60 ± 0.05 (0.49–0.77) | 0.58 ± 0.06 (0.40–0.78) | 0.021 * | 0.58 ± 0.06 (0.40–0.78) | 0.60 ± 0.05 (0.46–0.77) | 0.158 * |
| Ratio 2 | 0.64 ± 0.05 (0.55–0.79) | 0.62 ± 0.05 (0.48–0.81) | 0.014 * | 0.62 ± 0.05 (0.48–0.81) | 0.64 ± 0.05 (0.52–0.79) | 0.169 * |
| Ratio 3 | 0.50 ± 0.05 (0.40–0.68) | 0.46 ± 0.06 (0.28–0.68) | 0.000 * | 0.47 ± 0.06 (0.28–0.68) | 0.48 ± 0.05 (0.36–0.68) | 0.463 * |
| Ratio 4 | 0.55 ± 0.05 (0.45–0.72) | 0.52 ± 0.05 (0.36–0.71) | 0.001 * | 0.53 ± 0.06 (0.36–0.71) | 0.53 ± 0.05 (0.42–0.72) | 0.426 * |
| Ratio 5 | 0.36 ± 0.07 (0.17–0.57) | 0.32 ± 0.07 (0.14–0.51) | 0.000 * | 0.33 ± 0.07 (0.17–0.55) | 0.34 ± 0.07 (0.14–0.57) | 0.383 * |
| Ratio 6 | 0.42 ± 0.07 (0.24–061) | 0.39 ± 0.06 (0.23–0.58) | 0.001 * | 0.40 ± 0.07 (0.24–059) | 0.41 ± 0.06 (0.23–0.61) | 0.381 * |
| Ratio 7 | 0.24 ± 0.04 (0.16–0.39) | 0.26 ± 0.04 (0.15–0.38) | 0.004 * | 0.25 ± 0.04 (0.16–0.39) | 0.25 ± 0.04 (0.15–0.38) | 0.711 * |
| GT to AT Distance (374.9 ± 30.2 mm) | GT to DMC Distance (417.0 ± 29.8 mm) | |||||
|---|---|---|---|---|---|---|
| n | Distance (mm) | Pearson r | p | Pearson r | p | |
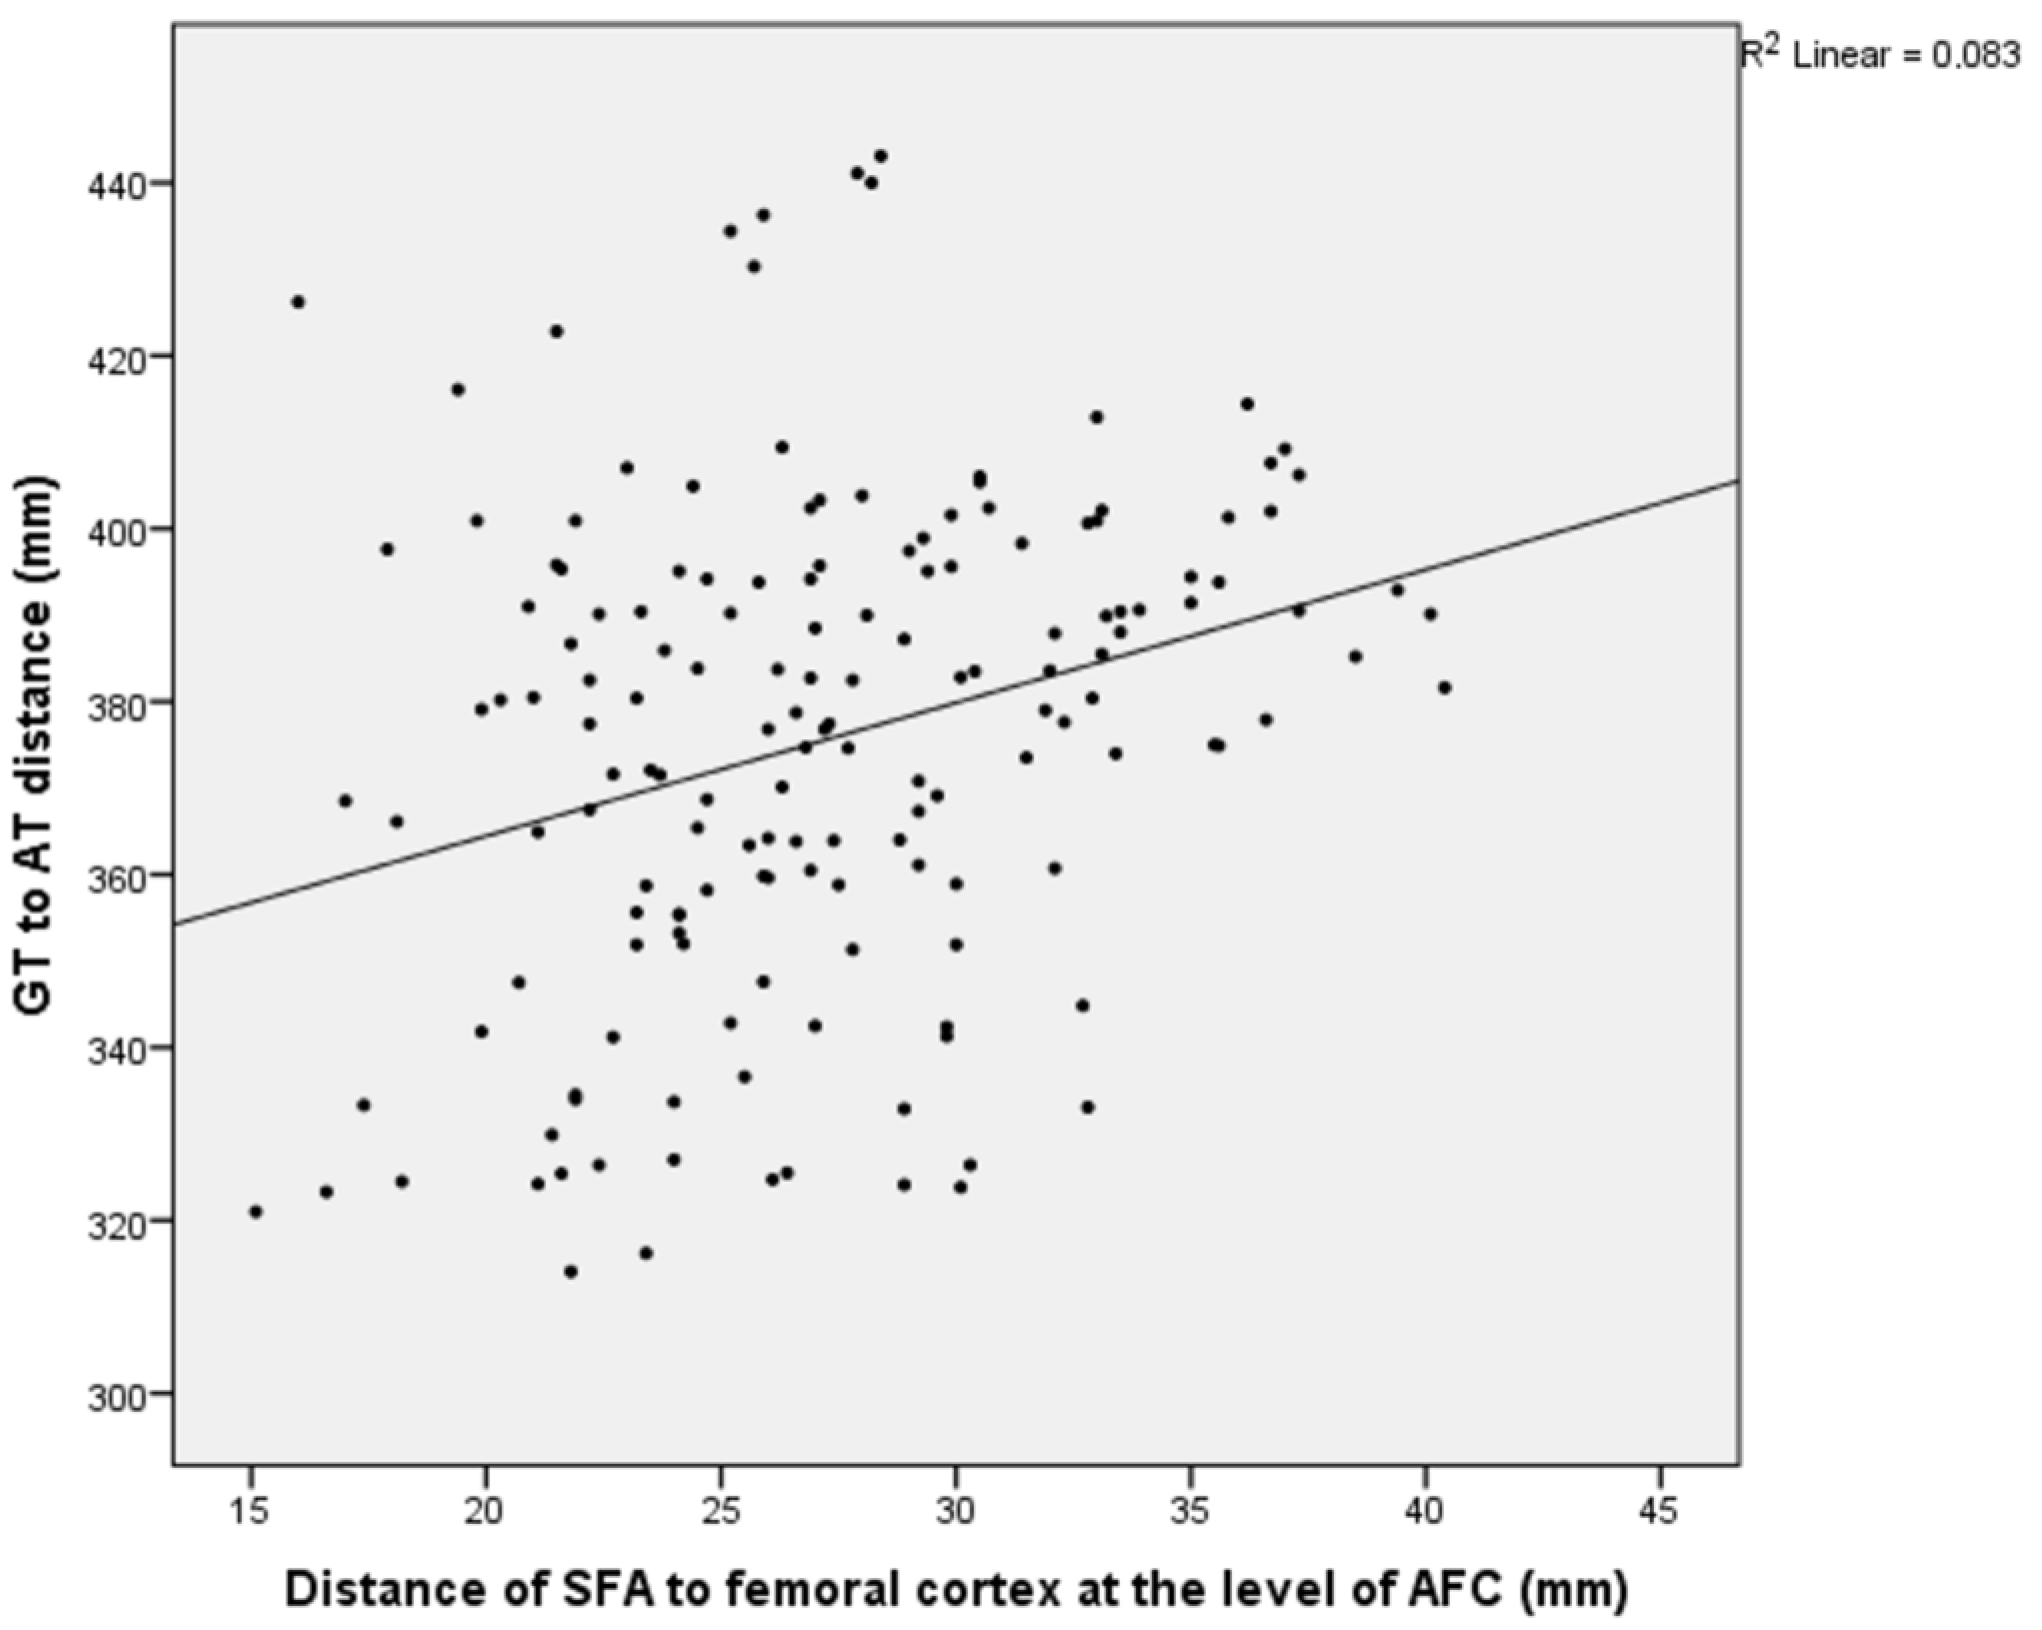
| Distance of SFA to femoral cortex at level of AFC | 160 | 27.2 ± 5.3 | 0.288 ** | 0.000 | 0.276 ** | 0.000 |
| Distance of SFA to femoral cortex at level of MFC | 160 | 25.2 ± 5.5 | 0.344 ** | 0.000 | 0.348 ** | 0.000 |
| Distance of SFA to femoral cortex at level of PFC | 160 | 22.9 ± 6.0 | 0.294 ** | 0.000 | 0.304 ** | 0.000 |
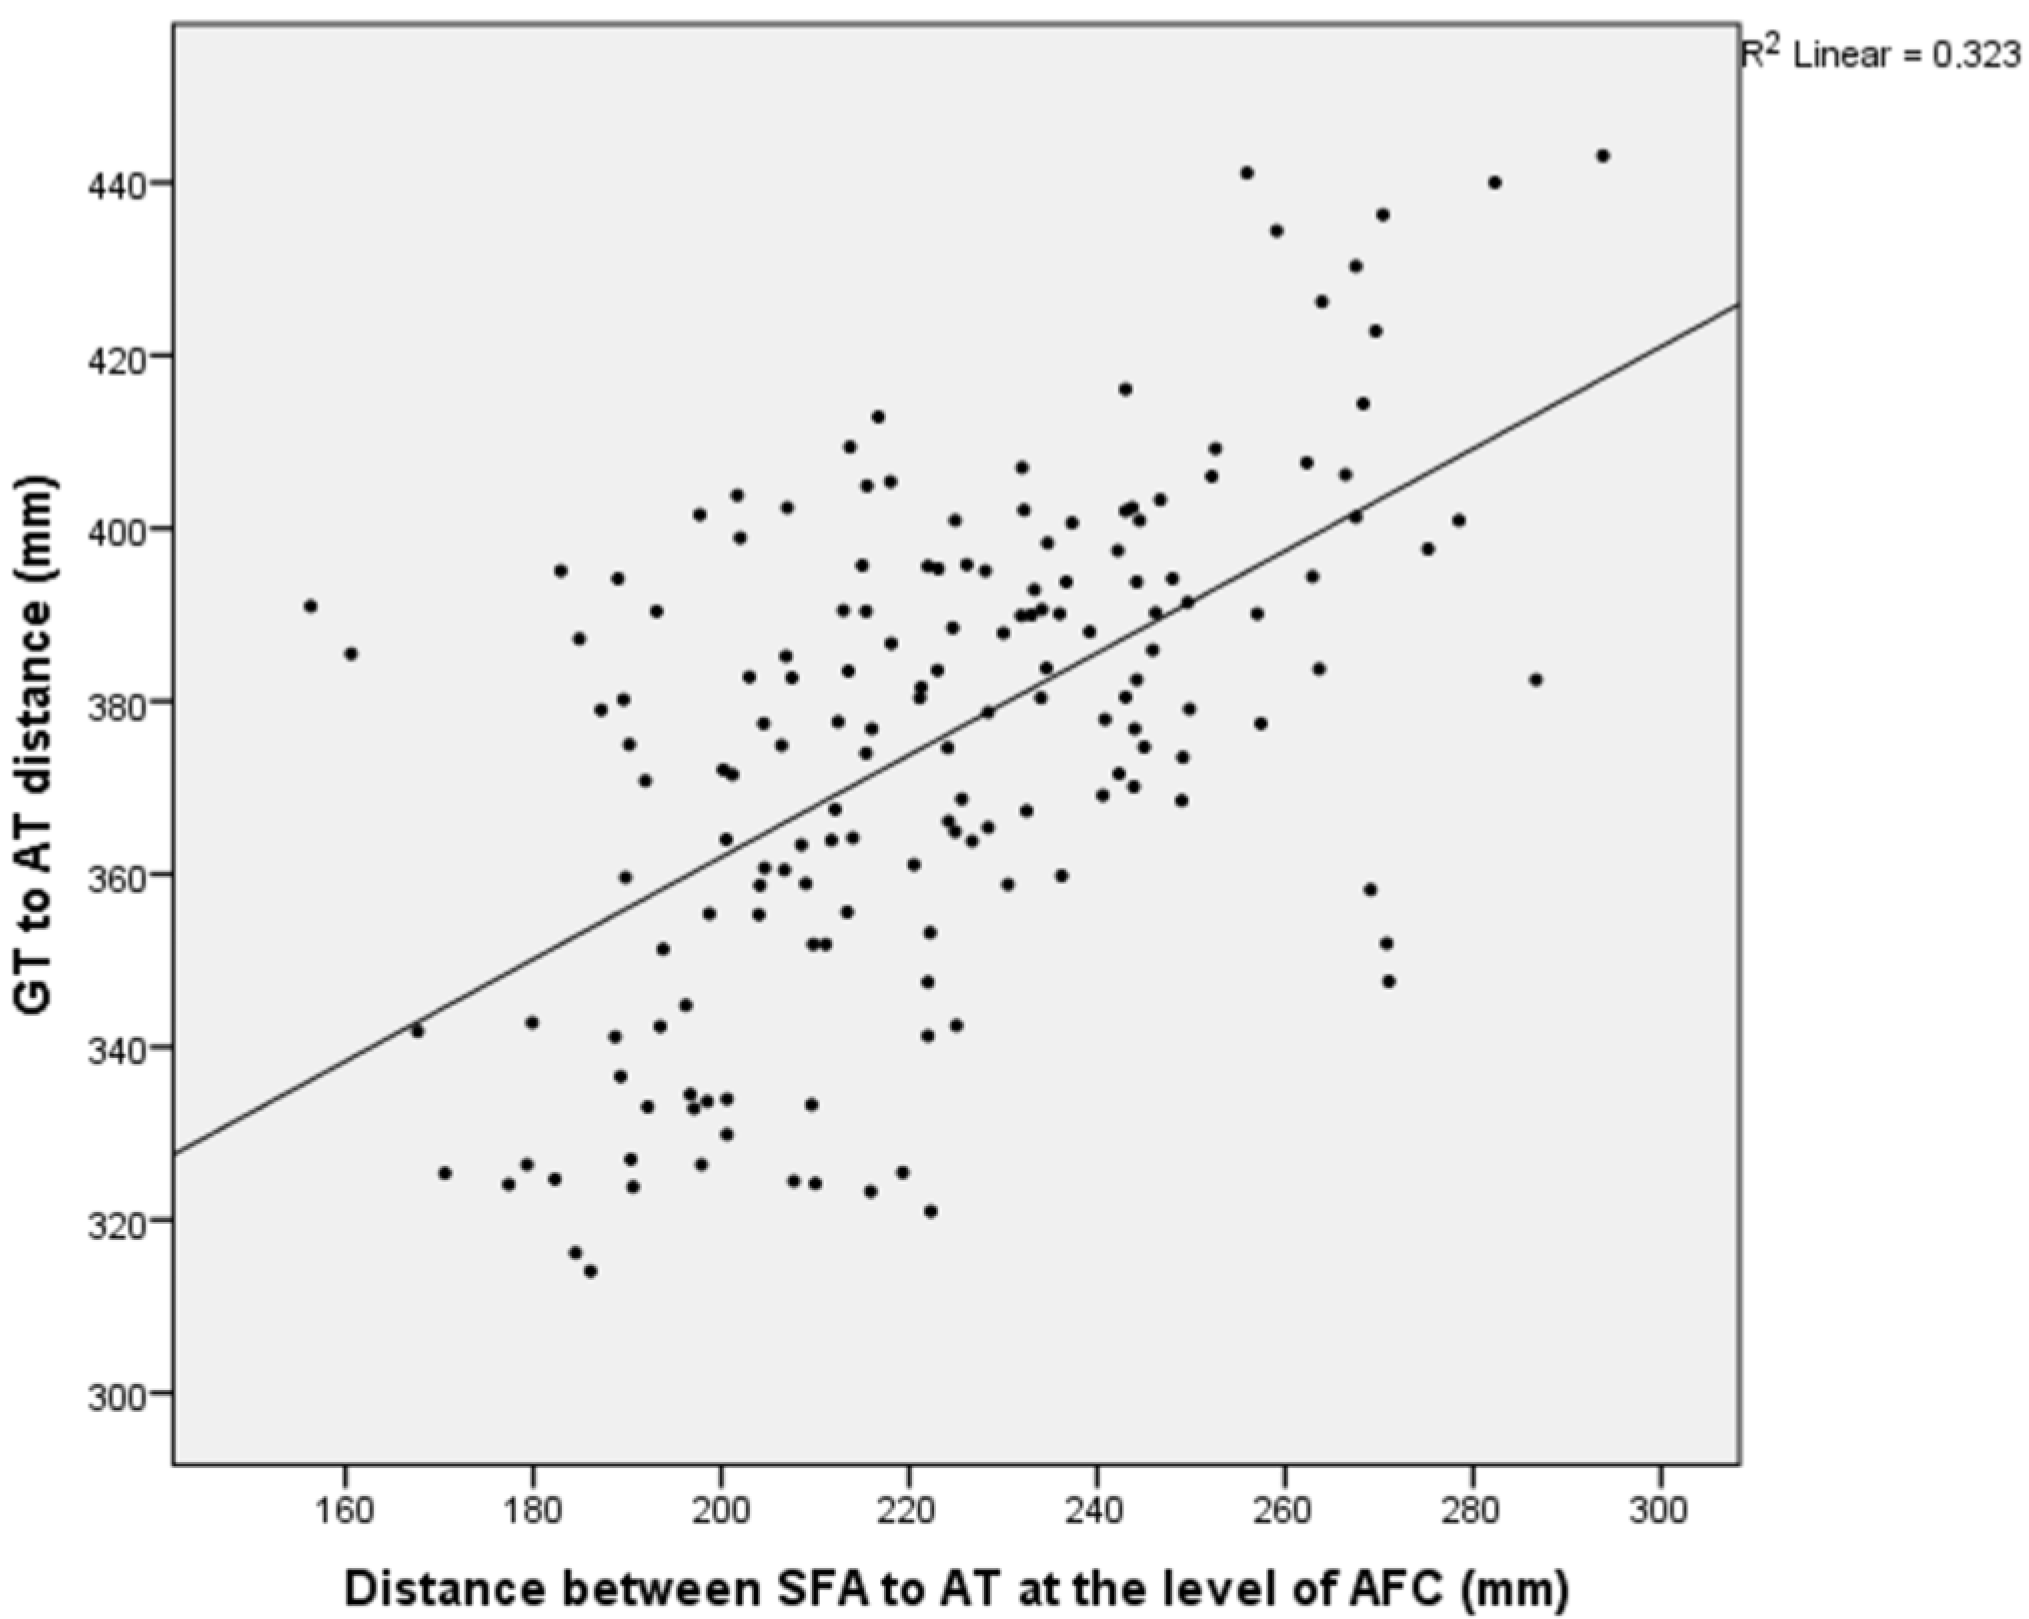
| Distance between SFA and AT at level of AFC | 160 | 223.0 ± 27.3 | 0.568 ** | 0.000 | 0.535 ** | 0.000 |
| Distance between SFA and AT at level of MFC | 160 | 180.7 ± 26.8 | 0.464 ** | 0.000 | 0.437 ** | 0.000 |
| Distance between SFA and AT at level of PFC | 160 | 128.0 ± 29.5 | 0.244 ** | 0.000 | 0.217 ** | 0.000 |
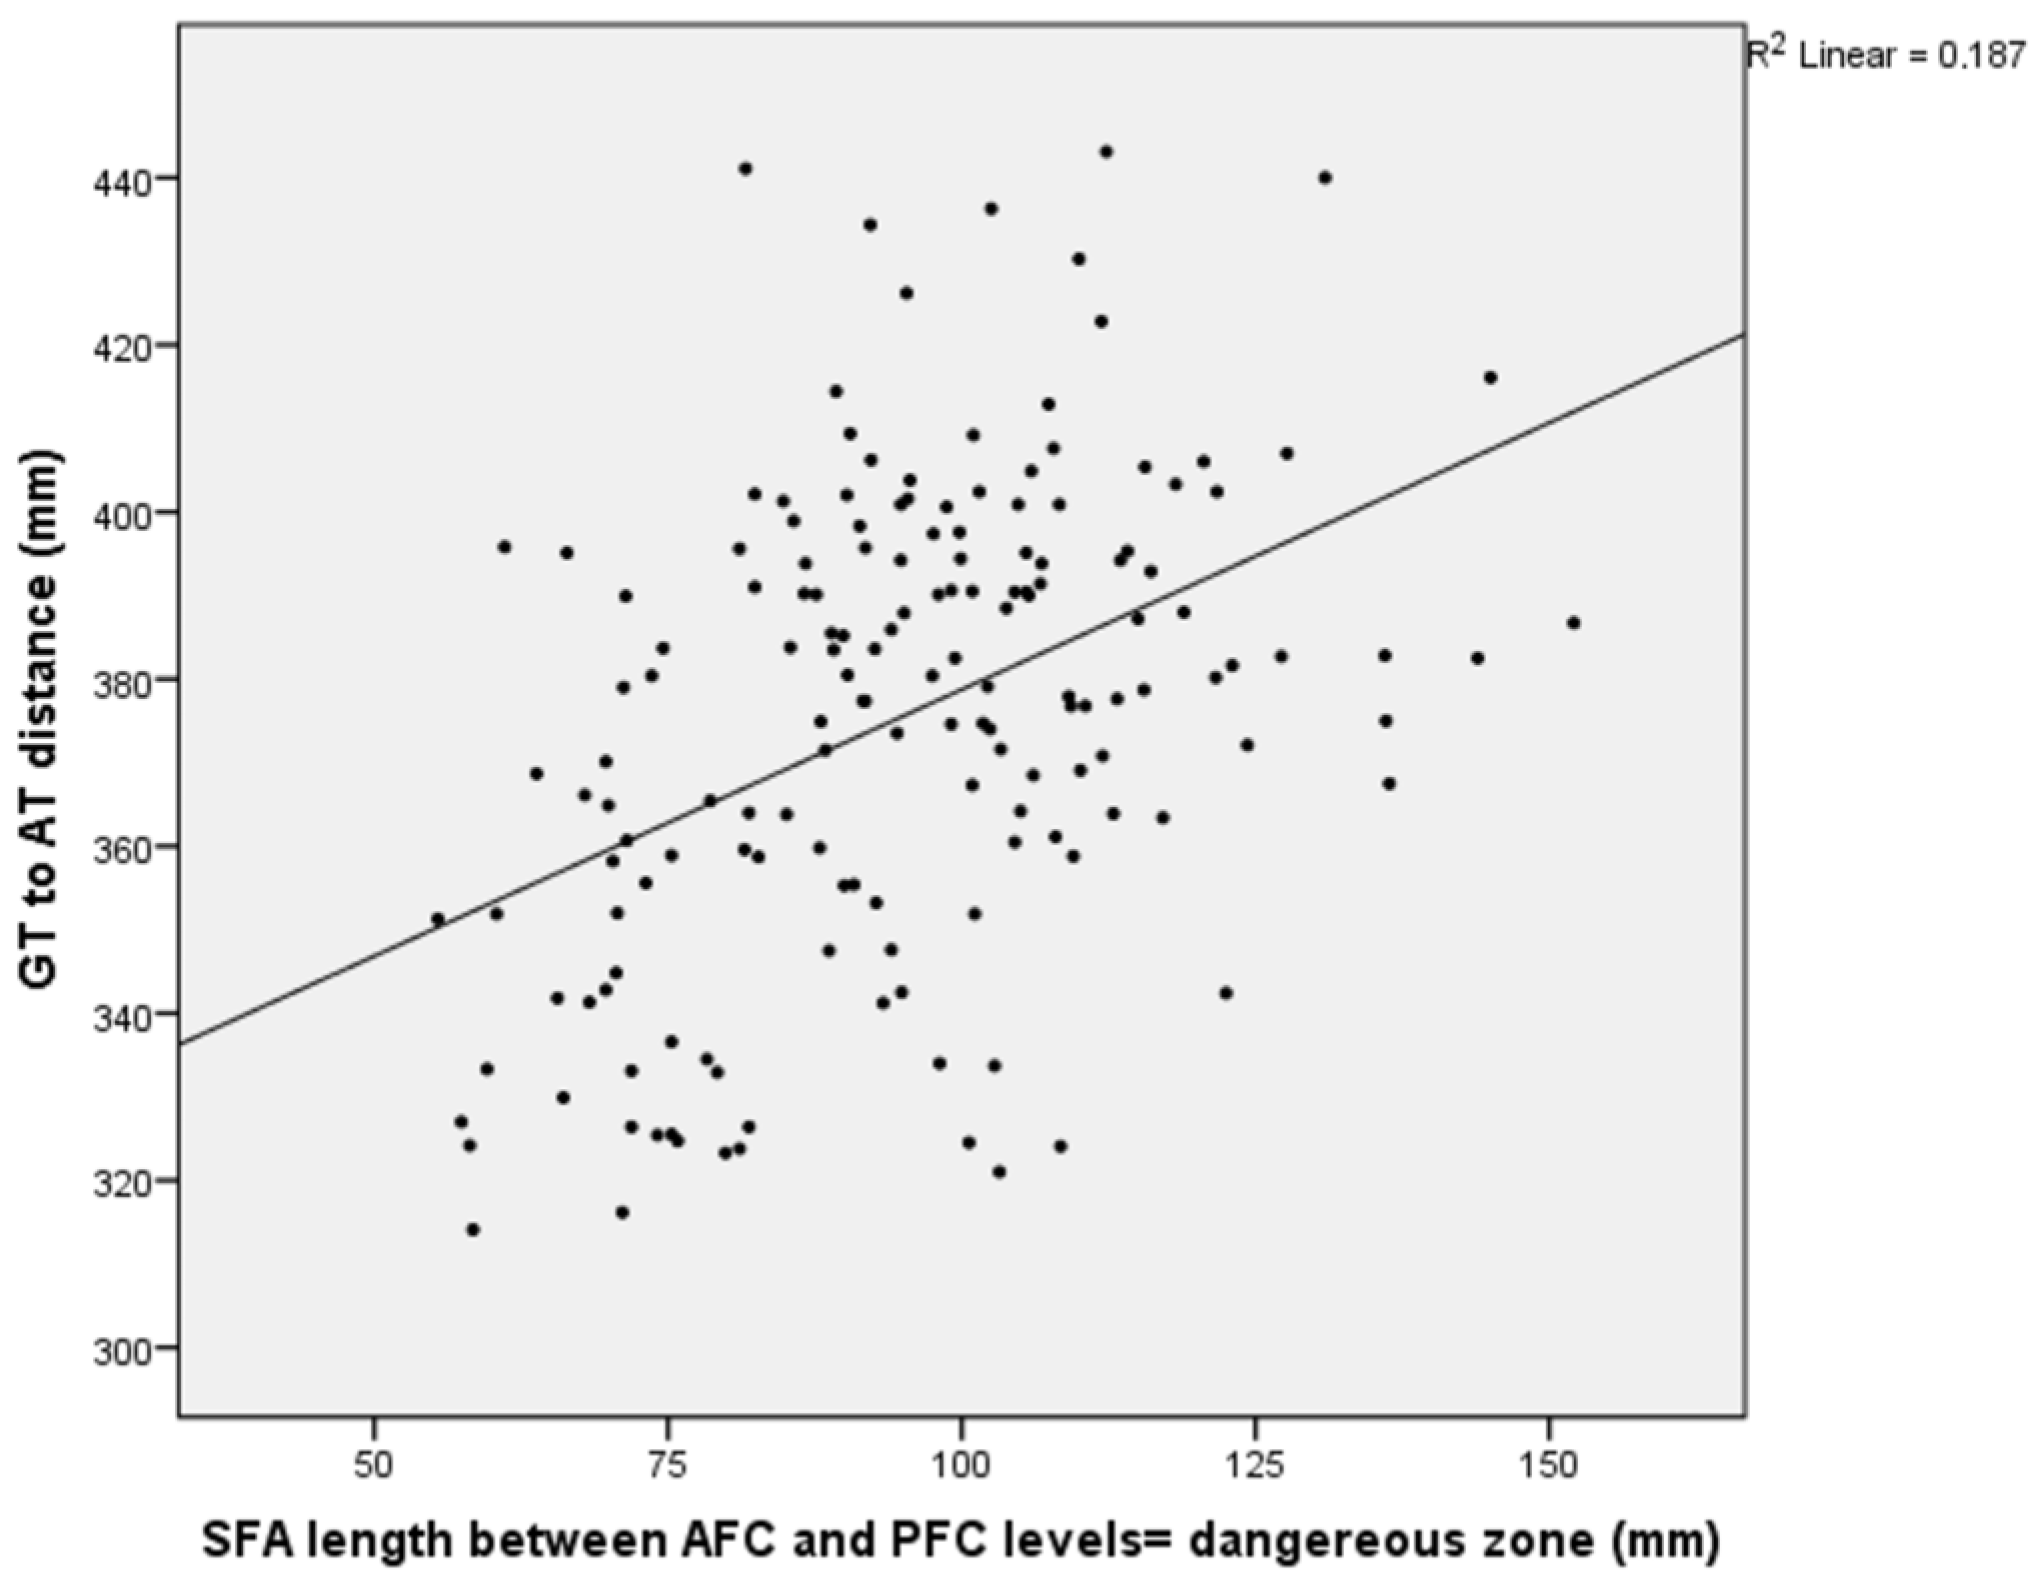
| SFA length between AFC and PFC levels | 160 | 94.9 ± 19.2 | 0.432 ** | 0.000 | 0.426 ** | 0.000 |
Disclaimer/Publisher’s Note: The statements, opinions and data contained in all publications are solely those of the individual author(s) and contributor(s) and not of MDPI and/or the editor(s). MDPI and/or the editor(s) disclaim responsibility for any injury to people or property resulting from any ideas, methods, instructions or products referred to in the content. |
© 2025 by the authors. Published by MDPI on behalf of the Lithuanian University of Health Sciences. Licensee MDPI, Basel, Switzerland. This article is an open access article distributed under the terms and conditions of the Creative Commons Attribution (CC BY) license (https://creativecommons.org/licenses/by/4.0/).
Share and Cite
Mertsoy, Y.; Kavak, Ş.; Şenol, A. Computed Tomography Angiography-Guided Study of the Superficial Femoral Artery Course in the Thigh and the Identification of Dangerous Zones for Lateral Femoral Surgical Approaches. Medicina 2025, 61, 441. https://doi.org/10.3390/medicina61030441
Mertsoy Y, Kavak Ş, Şenol A. Computed Tomography Angiography-Guided Study of the Superficial Femoral Artery Course in the Thigh and the Identification of Dangerous Zones for Lateral Femoral Surgical Approaches. Medicina. 2025; 61(3):441. https://doi.org/10.3390/medicina61030441
Chicago/Turabian StyleMertsoy, Yılmaz, Şeyhmus Kavak, and Ayhan Şenol. 2025. "Computed Tomography Angiography-Guided Study of the Superficial Femoral Artery Course in the Thigh and the Identification of Dangerous Zones for Lateral Femoral Surgical Approaches" Medicina 61, no. 3: 441. https://doi.org/10.3390/medicina61030441
APA StyleMertsoy, Y., Kavak, Ş., & Şenol, A. (2025). Computed Tomography Angiography-Guided Study of the Superficial Femoral Artery Course in the Thigh and the Identification of Dangerous Zones for Lateral Femoral Surgical Approaches. Medicina, 61(3), 441. https://doi.org/10.3390/medicina61030441