Abstract
Brown coal remains an important energy source in Europe, including countries such as Germany, Poland, the Czech Republic, and Greece. Open-pit mines disturb the environment in terms of air quality, hydrology, and chemical and biological transformations in rivers receiving mine waters. In the present study, we assessed the impact of mine waters from four brown coal open-pit mines on the contamination of river sediments. Chemical analysis included the quantification of 62 elements, including heavy metals (HMs) and rare earth elements (REEs). The contamination of sediments by HMs was evaluated using the contamination factor (CF), the pollution load index (PLI), and the Nemerow multi-factor index (PI). The potential toxic effects of HMs on aquatic organisms were assessed using the potential ecological risk index (PERI). Detailed analysis of chondrite-standardized concentrations of REEs was performed to describe the effects of mine water on their pattern in sediments. Cluster analysis (CA) and principal component analysis (PCA) were employed to divide study sites into groups and to evaluate the combined effect of sediment texture and site location on HMs and REEs in sediments. The study showed that after mine water discharge, there is a decrease in HM and REE concentrations in sediments. The decrease in each element’s concentration in sites located 100 m downstream of the discharge was caused by washing out of the finest fractions of sediments by mine waters.
1. Introduction
The energy system in Poland is based on fossil fuels, mainly black and brown coal [1,2]. There is pressure from most EU member states to revise the EU policy for more ambitious goals, especially in relation to energy produced from coal. The December 2015 Paris agreement entails the need to reduce greenhouse gas emissions and intensify development of low-carbon technologies [3]. The current unstable situation additionally causes problems with energy supply, and to some extent, prolongation of lignite excavation can be considered by several countries. Brown coal is excavated by opencast mining, which causes changes in the surrounding environment. The negative factors include occupation of large areas of land, large-scale transformations of the landscape, permanent and temporary exclusions from agricultural and forestry land use, land transformation and morphological changes, changes in underground and surface water, and the impact on air quality [4,5]. The transformation of water conditions within the range of influence of a cone of depression results in a decline in agricultural productivity [6]. The range and spatial extent of these changes depend on the mining technology and hydrogeological structure of the area where mining is carried out. Opencast lignite mining requires dewatering of the rock mass [7]. The effect of this activity is a change in hydrodynamic conditions and the formation of a cone of depression. In the river basins located within the range of the dewatering field, a reduction in water discharge in watercourses and a lowering of water levels in lakes are observed. On the other hand, water from the deep drainage of lignite open-pit mines is collected by a network of pipelines and ditches and is then discharged into watercourses, causing an increase in discharge and changes in water quality parameters [8]. Additionally, different elements are released into the waters. The quality of water from rock mass dewatering varies between regions [9]. In most cases, waters from rock mass dewatering do not require treatment [10]. In general, waters from deep-seated drainage had good quality in terms of transparency, salinity, and presence of heavy metals [8]. Moreover, the trophic parameters (soluble reactive phosphates, total phosphorus, and nitrates) are greater in samples representing subsurface drainage, whereas values of alkalinity, pH reaction, and conductivity are higher in surface drainage [11]. Staniszewski and Jusik [12] found that the impact of lignite mine water discharge on river water quality was negligible in respect to pH reaction, conductivity, total phosphorus, and nitrates. The situation regarding surface drainage was different. Water from atmospheric precipitation and residual water after collection from an open pit usually require treatment [13,14]. Mine water quality reflects the cumulative effect of many different chemical and physical processes. Firstly, water flows through different geological formations, and secondly, inside the pit, various processes take place, such as dissolution, erosion, weathering, pollutant diffusion, and dilution [15]. Tiwari et al. [14] reported higher seasonal variations in opencast mine water than in the case of deep drainage. Mining can affect water quality in three main ways: discharge of low-quality mine waters (usually saline) into rivers, the release of large amounts of suspended solids and toxic metals, and the presence of other pollutants due to accelerated weathering of previously stable minerals [16]. Brown coal mine waters require a reduction in suspended solids and sulfate concentrations, as well as, in some cases, the stabilization of pH reactions. Mine waters from surface drainage are characterized by highly variable physical and chemical composition. They generally have a significant content of suspended solids, high turbidity, and variable color. Their treatment is conducted in settling ponds, the effectiveness of which can be improved by the presence of aquatic vegetation (as a plant filter).
According to Downing [17], mine waters will be one of the top ten future world problems in limnology, together with eutrophication, the presence of invasive species, the impact of agriculture, climate change, and other factors. Results of studies carried out on coal and metal ore mining by scientists from different countries and continents confirm this opinion [18,19].
Mine water can be associated with various contaminants, including heavy metals [16,20,21]. Tiwari et al. [14] stated that the quality of the surface, as well as deep drainage, may be adversely affected by high metal concentrations. Heavy metal contamination caused by mining activities is a considerable challenge to the global mining industry. Heavy metals entering the environment may pose serious threats to aquatic plants or animals, as well as to human health [22]. Pollution from mining and related industrial activities is now, to some extent, mitigated through the application of clean technologies and environmental protection measures. Mahato et al. [23] analyzed the concentrations of heavy metals in mine water with a view to its possible use for drinking and domestic purposes. In particular, mine waters can be further exploited, especially in water-scarce areas. Metals are released into the water as dissolved ions and then partially absorbed and deposited in sediments [24]. Filgueiras et al. [25] found that 99% of heavy metals are stored in sediments, whereas far less than 1% remain in dissolved form in water. Sediments are thought to be the primary sinks for heavy metals released into the aquatic environment. Metals can be further released from bottom sediments back into the water or directly affect aquatic biota in the bottom sediment zone [24,26,27]. As a result of open-pit lignite mining in the northeastern region of Germany, large amounts of iron, sulfate, trace metals, and aluminum are introduced into small streams that discharge into the River Spree [28]. This analysis showed a sediment impact range of at least ~90 km downstream of the mining area.
Recent research on the impact of brown coal mine waters on rivers has focused primarily on hydrological aspects and water quality changes and extensively on aquatic plants’ response to mine waters; however, studies on sediments have been limited [5,7,8,9,11,12,14,16,21,23,28]. Changes in metal concentrations in sediments can provide an in-depth description of the cumulative response of a river ecosystem to the impact of industrial wastewater discharge and may offer the opportunity to propose mitigation solutions in the future. Hence, we decided to investigate changes in the most important sediment characteristics in watercourses as a result of the long-term impact of mine water discharge to evaluate significant accumulation of heavy metals and REEs in river sediments and to propose prevention methods during brown coal excavation and after closing of mines. The objective of the presented research was to analyze levels of sediment toxicity of rivers affected by brown coal mine waters due to their significance for the aquatic ecosystem under mining pressure. Problems with heavy metals are not only an important scientific and practical issue in the case of brown coal mining; they have also been reported in the case of hard coal, diamond, and salt mines [29,30,31].
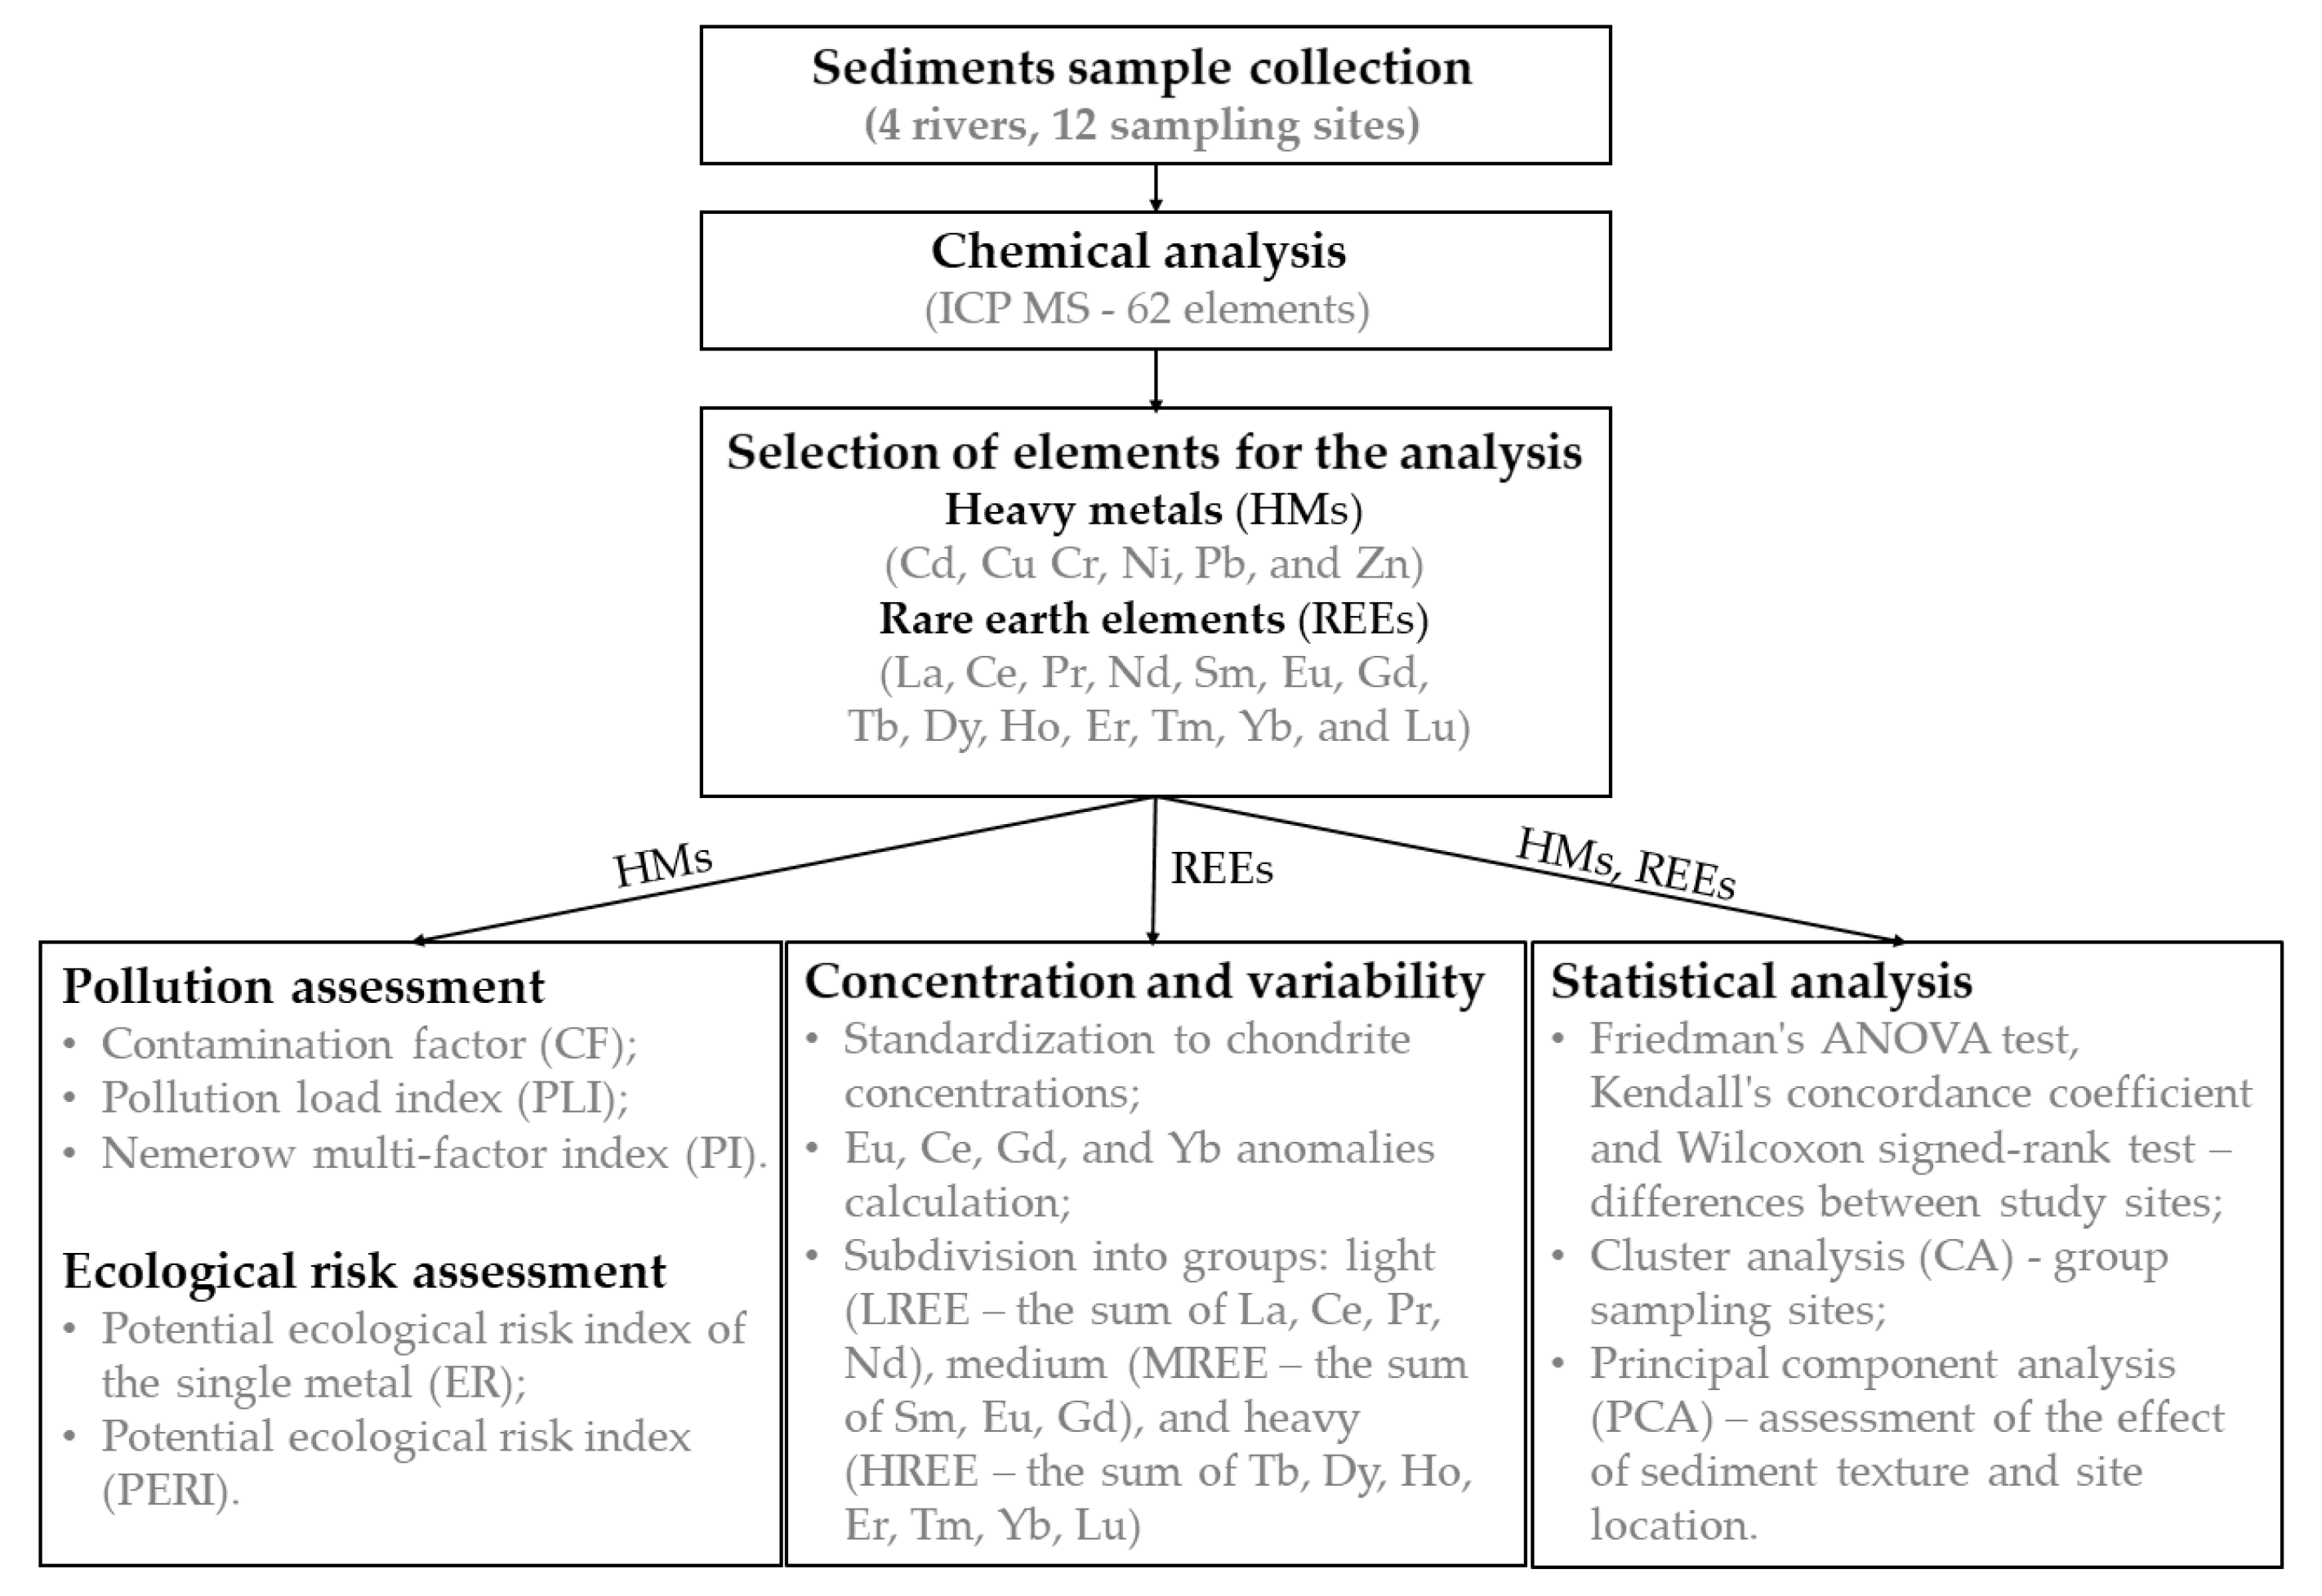
The assessment of heavy metal contents in bottom sediments of rivers receiving mine waters is hardly studied. In this study, we aimed to (1) determine the heavy metal (HM) and rare earth element (REE) concentrations in bottom sediments of rivers receiving mine waters, (2) assess the contamination of river bottom sediments with HMs, (3) assess the ecotoxicity of HMs deposited in sediments, and (4) identify factors that contribute to the accumulation of analyzed elements in sediments. The study included four river sections receiving water from dewatering of the Tomisławice, Lubstów, Drzewce, and Bełchatów open-pit mines located in central Poland. The next stages of the study to achieve the stated objectives are shown in Figure 1.
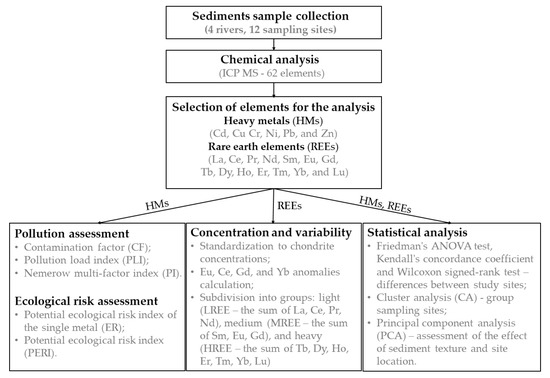
Figure 1.
Flow chart of research methodology.
2. Materials and Methods
2.1. Study Site
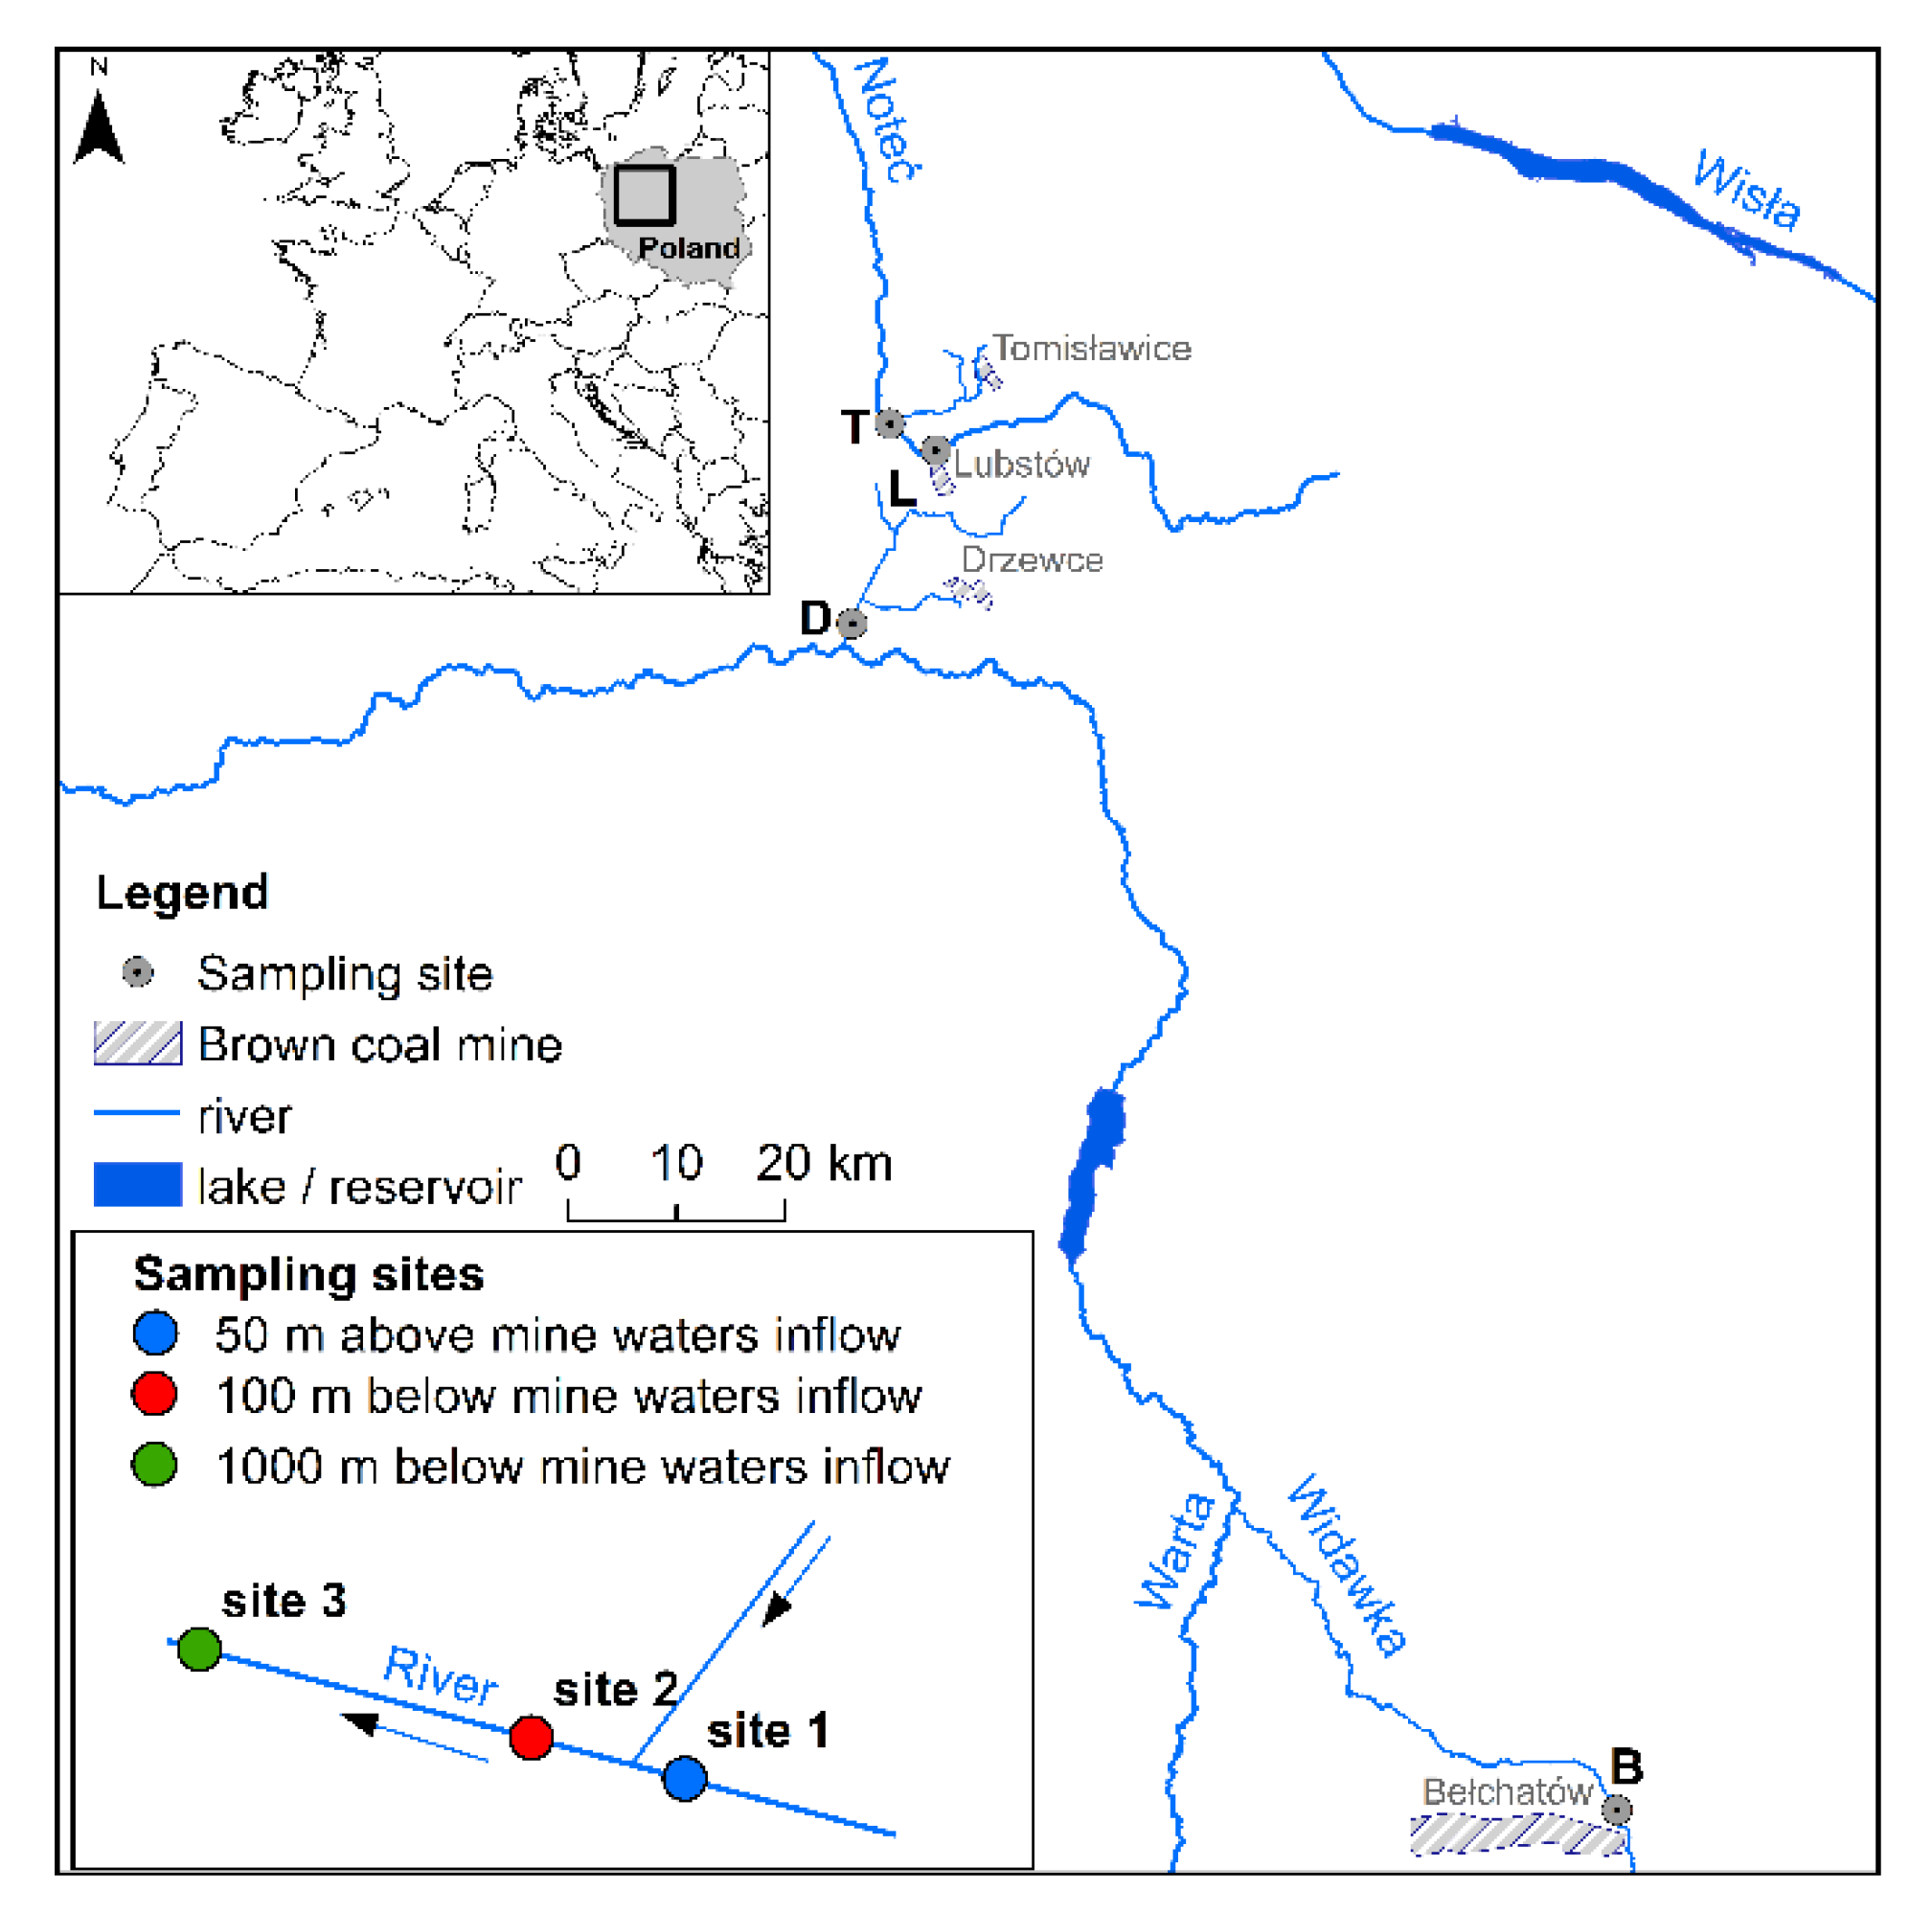
Studies were conducted on four river sections with three study sites each (Figure 2). Rivers were recipients of mine waters from the following open-pit mines: Tomisławice and Lubstów (Noteć River), Drzewce (Grójecki Channel), and Bełchatów (Widawka River). Different types of lignite mine waters were surveyed, including mixed mine waters with domination of surface drainage (Tomisławice, Bełchatów), mixed drainage (Drzewce), and deep drainage (Lubstów). The Tomisławice, Lubstów (Kujawskie Lakeland), and Drzewce (Kłodawa Upland) sites are located in central Poland, whereas Bełchatów is located more southerly, in the region of Szczerców Valley [32]. Widawka river had the longest period of contact with mining; excavation of brown coal in Bełchatów pit mine started in 1980; in Drzewce, in 2005; in Tomisławice, in 2011; and Lubstów mine was functioning from 1982 to 2009. All mentioned mesoregions are characterized by low annual precipitation below 550 mm [33].
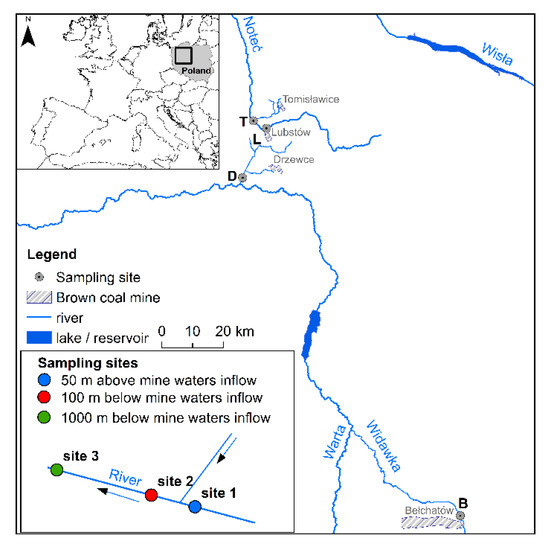
Figure 2.
Study site location.
2.2. Sample Collection
Studies on trace elements in sediments of rivers affected by brown coal mine waters were carried out in 2014 (except Bełchatów, which was surveyed in 2012) to evaluate the impact of mining on rivers. The following study sites were analyzed: Noteć River (Tomisławice and Lubstów open-pit mines), Widawka River (Bełchatów open-pit mine), Grójecki Channel (Drzewce open-pit mine). Sediment samples were gathered in each river at three sites: site 1, 50 m upstream of the mine water discharge; site 2, 100 m downstream of the discharge; and site 3, 1 km downstream of the discharge. The survey point labels were established by combining the first letter of the open-pit mine name and the site number according to the description above. The following codes were established for the individual mines: Tomisławice, T1, T2, and T3; Lubstów, L1, L2, and L3; Drzewce, D1, D2, and D3; and Bełchatów, B1, B2, and B3. Sites B3, D3, L3, and T3 were situated below the complete mixing zone of the river and mine waters. Samples of the bottom substrate used for laboratory analyses at each site were average bulk samples from three subsamples taken from the middle of the watercourse and at one-third of the distance from left and right banks, collecting sediment material from a 5 cm deep layer.
2.3. Chemical Analysis
Before analyses, all samples were dried to air-dry mass and then prepared by grinding compacted parts of sediments. Sixty-two elements were determined from aqua regia extracts obtained after 16 h extraction. A PlasmaQuant MS Q inductively coupled plasma mass spectrometer (Analytik Jena, Jena, Germany) was used for determination of selected elements. The following common conditions were used: plasma gas flow, 9.0 L min−1; nebulizer gas flow, 1.05 L min−1; auxiliary gas flow, 1.5 L min−1; radiofrequency (RF) power, 1.35 kW; signal measured in 5 replicates (20 scans each). The isobaric interference was reduced using an integrated collision reaction cell (iCRC) working sequentially in three modes: without addition of gases, with helium as the collision gas, and with hydrogen as the reaction gas. The uncertainty for the analytical procedure (including the sample preparation step) was 20%. The limits of detection were determined in blank multiple measurements (3-sigma criteria) and varied from 0.001 mg kg−1 (Yb) to 0.206 mg kg−1 (Cu). Accuracy was controlled by reference materials analysis (CRM NCSDC (73349), bush branches and leaves; CRM 2709, soil; CRM S-1, loess soil; CRM 667, estuarine sediments (International Atomic Energy Agency (IAEA), Vienna, Austria), and the recovery (80–120%) was acceptable for most of the determined elements. For non-certified elements, the recovery in the standard addition method was defined.
2.4. Data Analysis
Values of representative concentrations were calculated for analyzed elements separately for each of four mines: Bełchatów (B), Drzewce (D), Lubstów (L), and Tomisławice (T). Due to the very large set of studied parameters, it was decided to pay special attention to HMs (Cd, Cu Cr, Ni, Pb, and Zn) and REEs (La, Ce, Pr, Nd, Sm, Eu, Gd, Tb, Dy, Ho, Er, Tm, Yb, and Lu) concentrations, which are most frequently described in the literature. In addition, for the first time, REE analysis was performed within the impact zone of lignite mine dewatering water discharges.
2.5. Heavy Metal Pollution and Potential Ecotoxicological Risk Assessment
Sediment contamination by heavy metals and the degree of ecological risk were evaluated based on individual and complex indices. As an individual index, the contamination factor (CF) [34] was used, whereas as complex indices, the pollution load index (PLI) [35] and Nemerow multi-factor index (PI) [36,37] were used. Assessment of the ecotoxicological impact was carried out based on the potential ecological risk index of the single metal (ER) [38], and for a complex view, the potential ecological risk index (PERI) [38] was calculated. Detailed formulae used to calculate the indices and the threshold values used to assess the degree of bottom sediment pollution with heavy metals and the potential ecotoxic effect are presented in Table S1. These indices are widely used by scientists around the world in geochemical studies of bottom sediments. Their popularity results from the fact that, besides the possibility of assessing the level of bottom sediment contamination with heavy metals in a uniform way worldwide, they allow for consideration of the specificity of a given area by using geochemical background values. The geochemical background values were based on those reported by Bojakowska and Sokołowska [39]. The following geochemical background values were adopted in this study: Cd, 0.5 mg kg−1; Cu, 6 mg kg−1; Cr, 5 mg kg−1; Ni, 5 mg kg−1; Pb, 10 mg kg−1; and Zn, 48 mg kg−1.
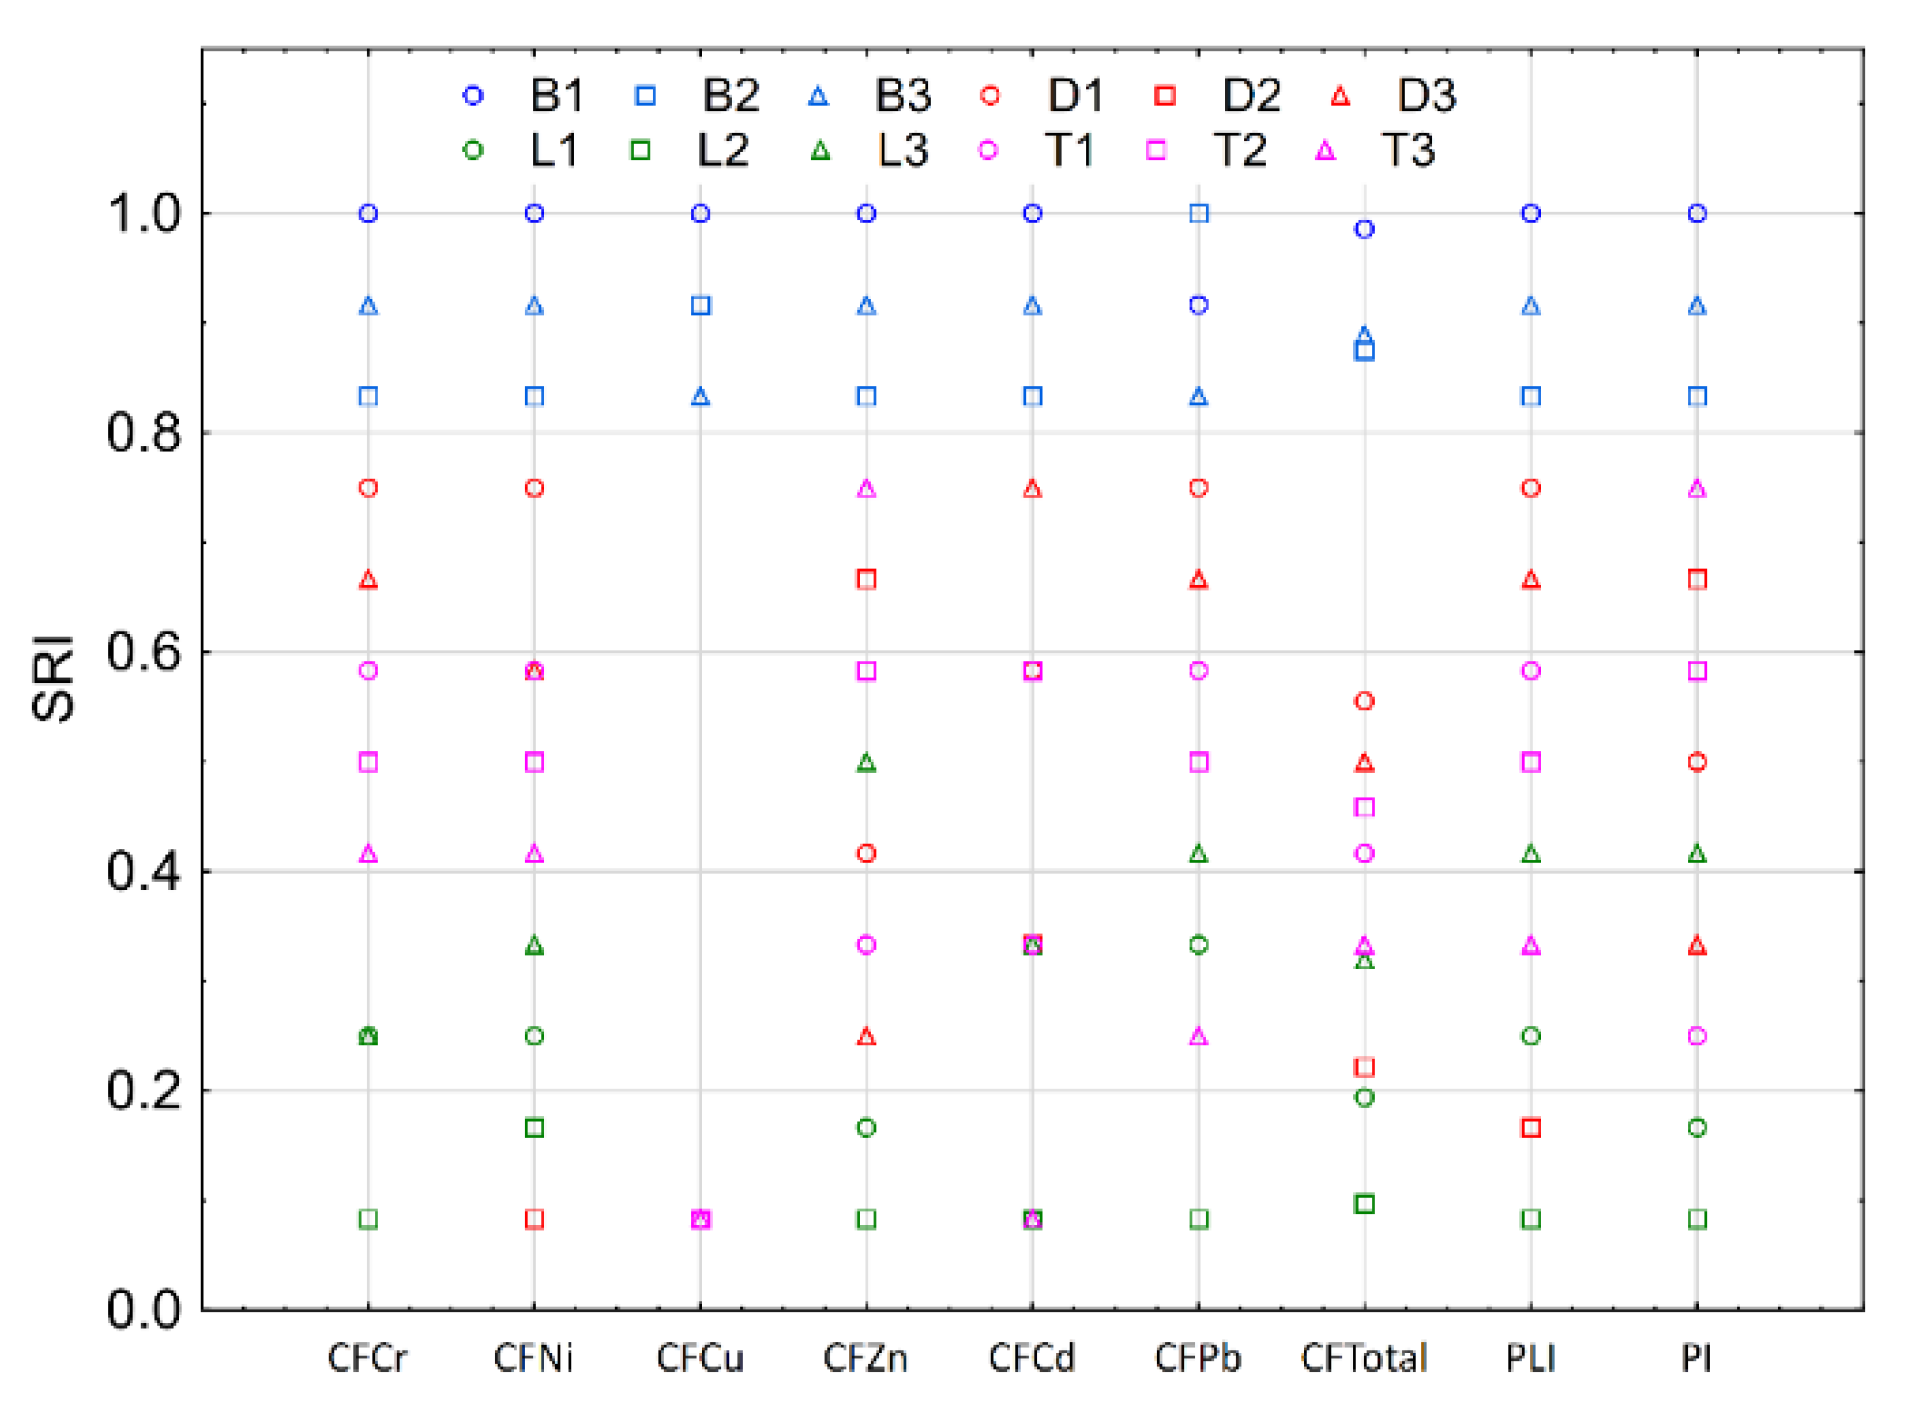
Due to the various ranges of index values, the site rank index (SRI) was used to visually present the results in one figure. The SRI was developed by Omwene et al. [40]. SRI values are calculated using the following formula:
where Ri is the pollution/ecotoxic effect rank of the site with the i-th metal in ascending order, n is the number of analyzed metals(loids), and S represents the number of sampling sites. The SRI values provide a better understanding of pollution status with metals at a given site and eliminate arbitrary pollution classifications. For this reason, SRI application has become more frequent in the analysis of water, soil, and bottom sediment pollution [41,42].
2.6. Rare Earth Element Concentration and Variability
To determine the enrichment of bottom sediments with REEs, their concentrations were standardized in relation to the average concentrations of REEs in chondrite [43]. To calculate Eu, Ce, Gd, and Yb anomalies, the formulae proposed by Bau and Dulski [44], de Baar et al. [45], Sholkovitz [46], and Benabdelkader et al. [47] were used. Anomalies in REE concentration enable identification of potential sources of pollution and the influence of natural processes on their concentration [48]. In the last stage, the REE values were calculated for three groups: light (LREE: the sum of La, Ce, Pr, and Nd concentrations), medium (MREE: the sum of Sm, Eu, and Gd concentrations), and heavy (HREE: the sum of Tb, Dy, Ho, Er, Tm, Yb, and Lu concentrations).
2.7. Statistical Analysis
Statistical analysis included a comparison of element concentrations in river sections located next to studied mines and between sites within a given mine. The analysis was undertaken to determine whether there were any significant differences between mines and sites, considering all the elements analyzed. For this purpose, Friedman’s ANOVA test and Kendall’s concordance coefficient were used, and Wilcoxon’s paired pairs test was applied to compare the bottom sediments of the rivers in the mine reach and the sites.
Cluster analysis (CA) was applied to group sampling sites in clusters based on similarities and dissimilarities between metal(loid) concentrations. CA was performed using squared Euclidean distances as a measure of similarity, and Ward’s method was used to obtain dendrograms [49]. The next stage of statistical analysis involved detrended correspondence analysis (DCA). The obtained gradients of the first axis of DCA were shorter than 3.0 SD, which indicates linear distribution. Ter Braak and Smilauer [50] suggested that in such cases, principal component analysis (PCA) is recommended for further data analysis. PCA is an ordination method that allows for the interpretation of complex correlations between the analyzed HMs and REEs and environmental factors. The following environmental factors were considered in two groups: type of sediments (M, mineral; M/O, mineral organic), location of study sites according to the discharge of mine waters (1, 50 m upstream of discharge; 2, 100 m downstream of discharge; 3, 1000 m downstream of mine water discharge). Prior to PCA analysis, the results were ranked within each analyzed location, with a value of 1 assigned for the point with the highest concentration of the element analyzed, 0.66 for the point with an intermediate concentration, and 0.33 for the point with the lowest concentration.
The number of significant principal components was selected based on a Kaiser criterion of eigenvalues higher than 1. Apart from this, it was assumed that when factor loadings between the concentrations of selected HMs and REEs and principal components are 0.75–1.00, 0.50–0.75, and 0.30–0.50, they are strongly, moderately, and weakly correlated, respectively [51]. Prior to PCA analysis, concentrations of HMs and REEs were centered by log-ratio transformation. CA and PCA were conducted using Statistica 13.1 and Canoco 5.0, respectively.
3. Results
Analysis of the content of all studied elements in river bottom sediments revealed significant differences between river sites located near each lignite mine. The highest concentrations of the analyzed elements were found in the bottom sediments of the Widawka River, and the lowest concentrations were found in in bottom sediments of the Noteć river at sites affected by the Lubstów coal mine. Concentrations of elements in sediments of the Noteć River sites near Tomisławice mine and the sediments of the Grójecki Channel (Drzewce open-pit mine) were at similar levels. The final concentrations of the analyzed elements in the river sites can be ordered as follows: B > D = T > L. Analysis of the concentration of elements at all sites determined that they can be ordered as follows: B1 > B3 > B2; D1 > D3 > D2; L1 = L3 > L2; T1 = T3 > T2.
In the case of the Widawka and Grójecki Channel river sites, affected by Bełchatów and Drzewce mines, respectively, the highest concentrations were observed at sites located 50 m upstream of the mine water discharge, and the lowest concentrations were observed 100 m downstream of the mine water discharge. At the last site located 1000 m downstream of the discharge, concentrations were at an intermediate level. In the case of the Noteć River, the situation was similar in both studied sites. The concentrations at sites 1 and 3 were similar. The decrease in element concentrations in sites located 100 m downstream of the discharge was caused by washing out of the finest fractions of sediments by the kinetic energy of mine waters. Change of granulometric composition caused a decrease in the active surface of sediment particles and, at the same time, reduced the possibility of particular elements bonding. Similar concentrations at sites L1 and L3, as well as T1 and T3, confirmed the lack of impact of studied mine water discharge on the chemistry of river bottom sediments, as well as the lack of impact of studied mine water discharge on the chemistry of river bottom sediments and the lack of impact of water discharge on the course of fluvial processes, i.e., washing out of finer fractions and their transport downstream.
To estimate the degree of contamination of river sediments, the indices CF, PLI, and PI were calculated for the parameters Cd, Cu Cr, Ni, Pb, and Zn (Table 1).

Table 1.
State of river sediment contamination according to Cd, Cu Cr, Ni, Pb, and Zn and potential ecotoxicological impacts.
Values of studied CF indices varied from 0.02 to 14.09. In 54 cases (out of 72 analyzed, i.e., 12 measurement sites and 6 HMs), CF index values were below 1. These values occurred mainly in sites located downstream of Drzewce, Lubstów, and Tomisławice mines. Only in the case of Zn were concentrations slightly higher than 1, observed at sites D2, T2, and T3, which indicates low contamination of river sediments. Another situation was observed in sites situated near Bełchatów pit mine, where only in three cases were CF index values below 1. In 10 cases, CF index values ranged from 1 to 3, indicating moderate contamination of sediments. In the case of zinc, the CF index values at sites B1 and B3 were 5.48 and 4.10, respectively, confirming considerable contamination. For nickel, the CF index values were 14.09 at site B1 and 9.93 at site B3. In both cases, CF index values indicated very high contamination. In Bełchatów open-pit mine, the mine water discharge caused washing of river bottom sediments from a site located 100 m downstream of the discharge. The values of CF indices at site B2 for the elements Cr, Ni, Cu, Zn, and Cd were 3.5, 2.9, 1.7, 2.5, and 5.6 times lower than in site B1, respectively. The CF values for lead were an exception, as they were similar at all surveyed sites affected by Bełchatów mine. This indicates low contamination of bottom sediments by the elements mentioned above. These results were confirmed by the calculated PLI and PI index values. PLI index values above 1 were obtained only for sites B1, B2, and B3. This indicates contamination of bottom sediments of Widawka river. At other sites, PLI values ranged from 0.06 to 0.22, which indicate low contamination of bottom sediments. Similar results were obtained by analyzing PI index values. At six sites—D1, D3, L1, L2, L3, and T1—the PI values were lower than 1, which indicates a lack of contamination of bottom sediments by studied elements. At sites D2, T2, and T3, the limit value of 1 was slightly exceeded and ranged from 1.04 to 1.06. At sites located in Widawka River, the PI values ranged from 3.70 to 10.49, indicating strong contamination of sediments at sites B1, B3 and moderate contamination at site B2. The results of CF, PLI, and PI index calculations presented in Figure 3 were obtained by calculating the SRI index value. The presented results show that most studied sites contaminated by HMS were bottom sediments of Widawka River, where the highest SRI values were found. In the case of the rest of the sites, calculated SRI values placed them in a slightly different order in relation to both the mines and the river site location.
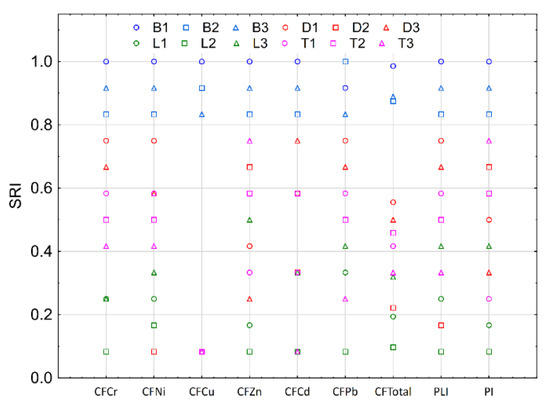
Figure 3.
SRI values for indices of river bottom contamination.
Considering the potential ecological risk index, ER, for Cd, Cu Cr, Ni, Pb, and Zn, the calculations showed that the potential impact of the presence of HMs in sediments on aquatic organisms was generally negligible (Table 1). Out of 72 calculated ER indices, in 70 cases, the values were below 40, and according to the adopted scale (Table S1), the toxic impact was low. For concentrations of Ni found at sites B1 and B3, the ER index values were 70 and 50, respectively, indicating a moderate potentially toxic impact. Considering the results of the PERI index, which presents the averaged impact for all HMs, the potential ecological impact was at a low level, and the PERI index ranged from 2 to 142.
The average REE concentrations were as follows: Ce > La > Nd > Pr > Sm > Gd > Dy > Er > Yb > Eu > Ho > Tb > Tm > Lu, from 7.3 to 0.024 μg kg−1 for Ce and Lu, respectively. The average ΣREE in the sediments was 18 μg kg−1 and varied between 4.4 μg kg−1 and 45 μg kg−1 at sites D2 and B1, respectively. Based on ΣREE, the sites can be ranked as follows: B1 > B3 > D1 > T3 > B2 > L1 > T2 > T1 > D3 > L3 > L2 > D2.
Considering the sum of REE levels in LREE, MREE, and HREE groups, the highest concentrations occurred in the LREE group and ranged from 3.9 to 38 at studied sites, whereas the sums of MREE and HREE concentrations were similar, with a slight predominance of MREEs. Among the analyzed REEs, the average concentration of Ce was 7.3 μg kg−1; in the case of MREE, Sm concentrations averaged 0.65 μg kg−1; and for HREE, concentrations of Dy averaged 0.45 μg kg−1.
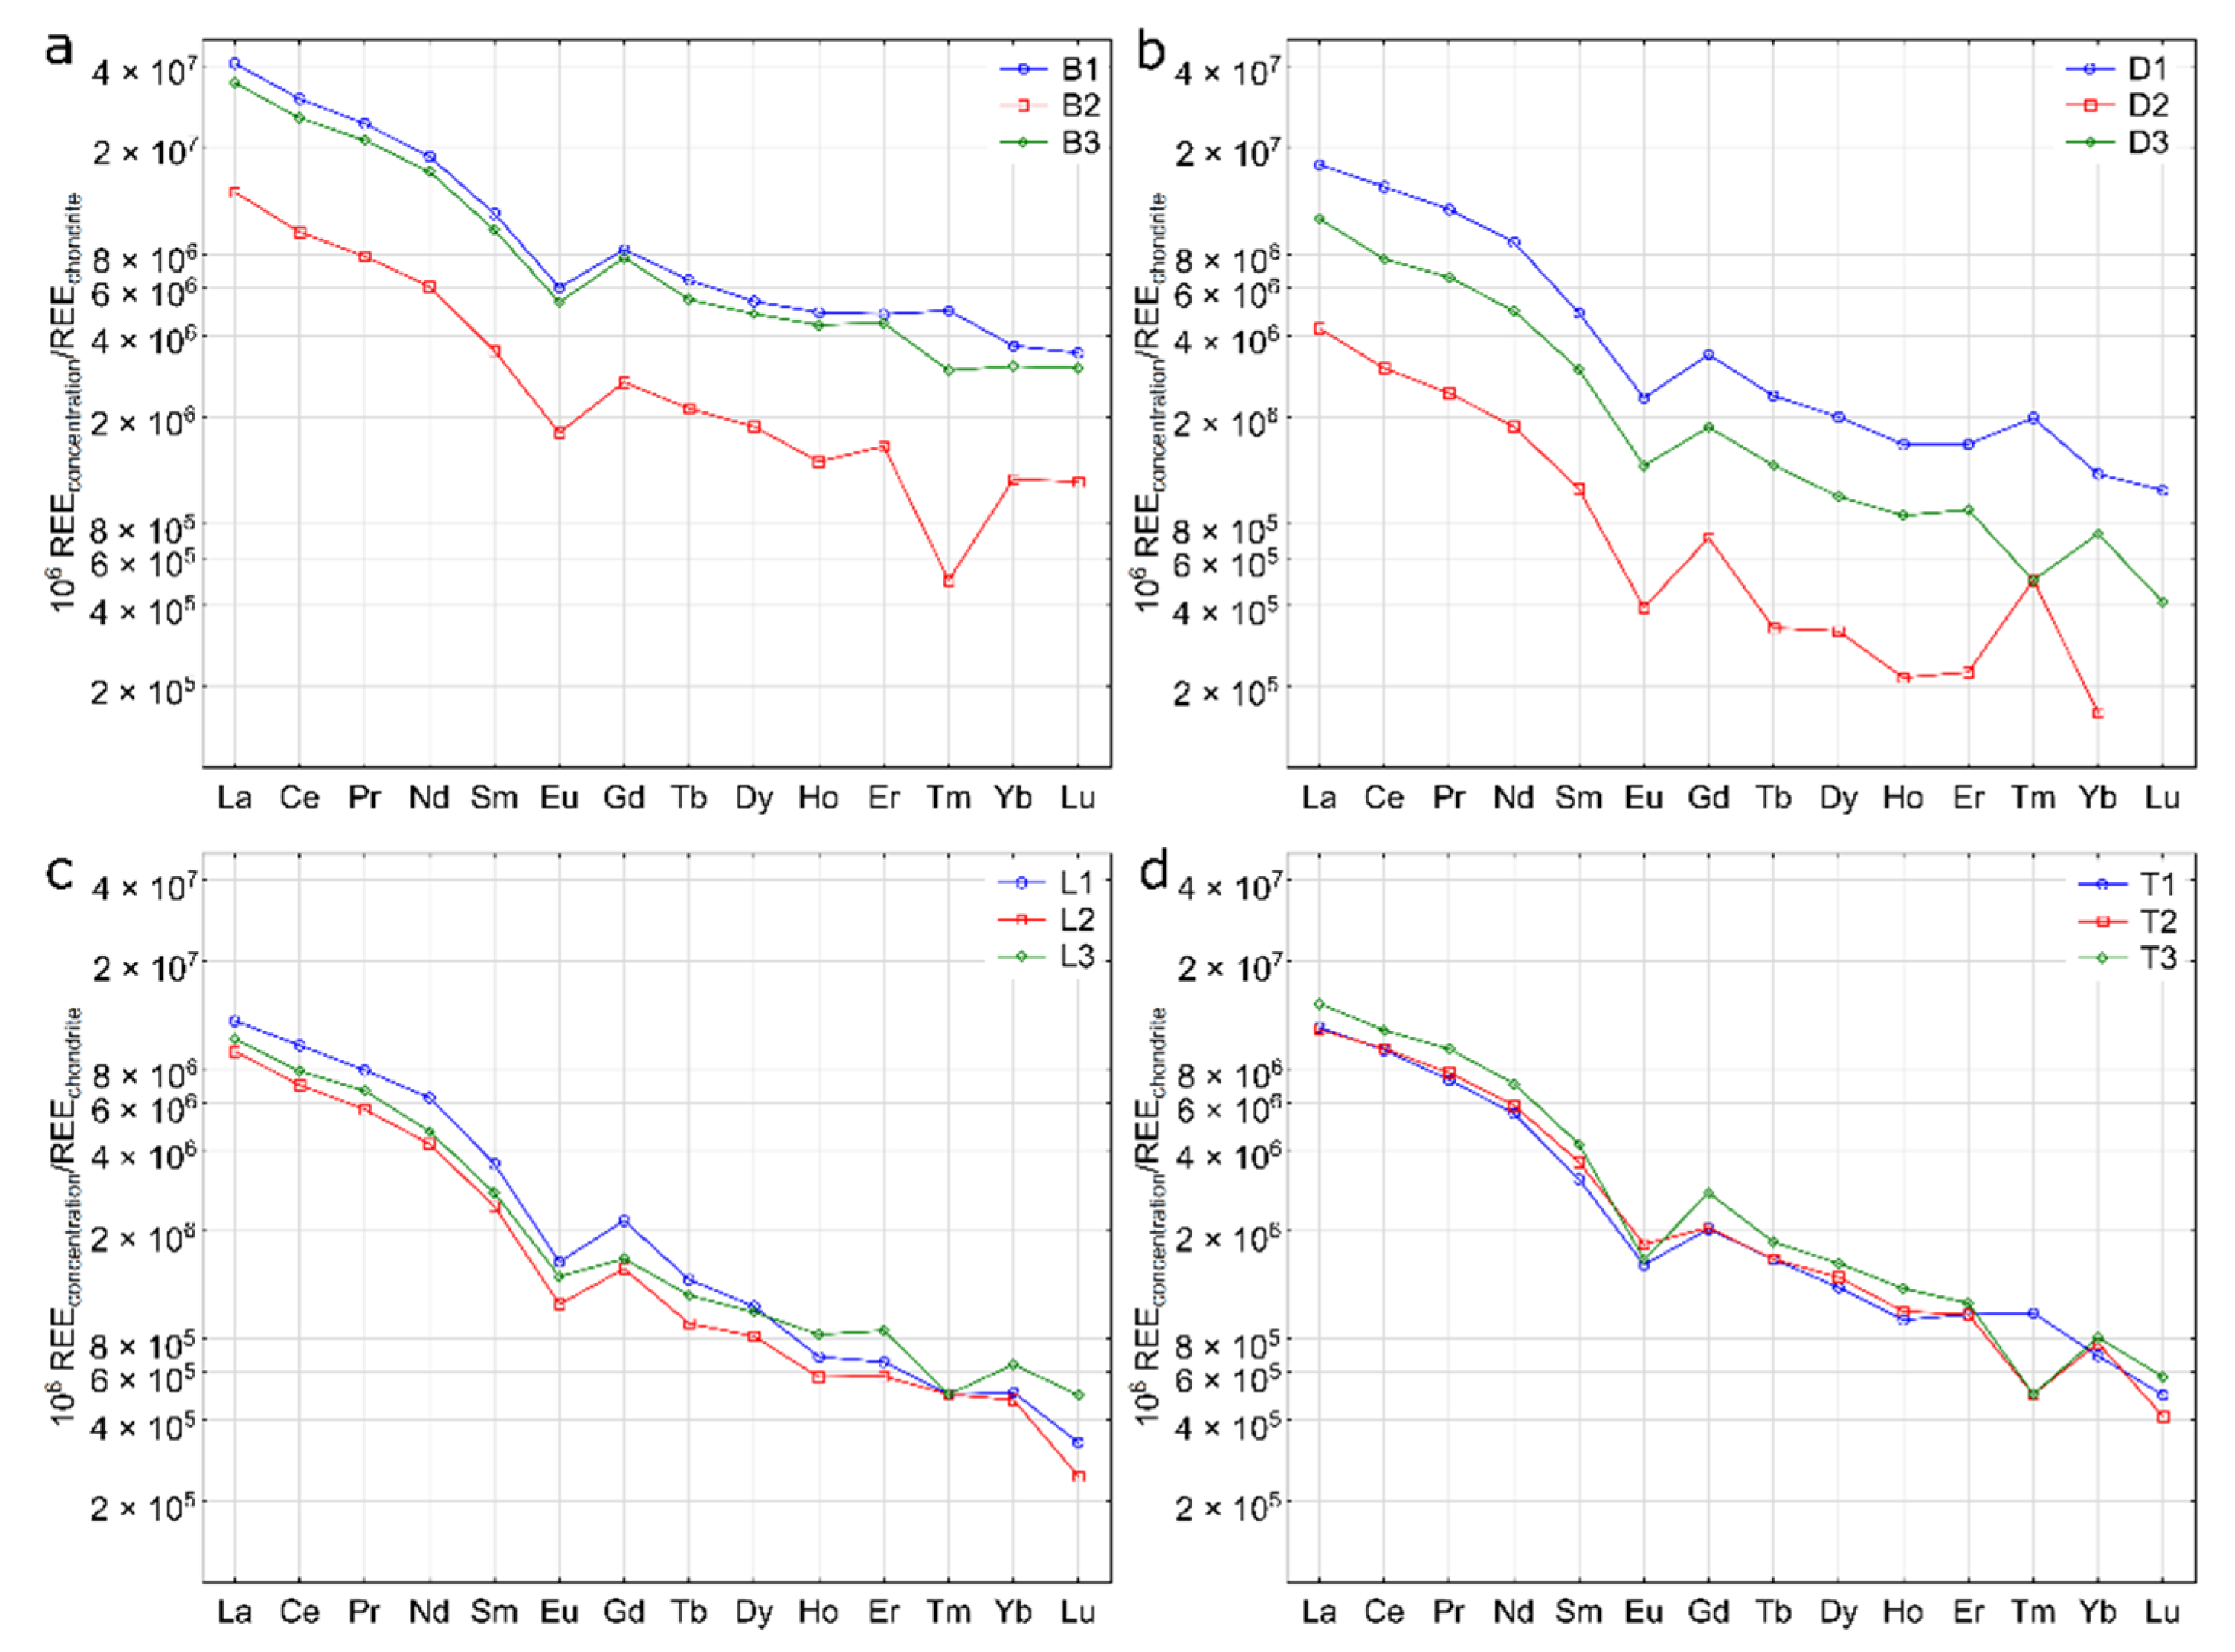
Analyzed REE concentrations were normalized using the chondrite reference values (Figure 4). The highest REE values were found in the bottom sediments of Widawka River at sites B1 and B3, situated 50 m upstream and 1000 m downstream of the mine water discharge from Bełchatów pit mine. The lowest values were recorded at site D2, situated 100 m downstream of the mine water discharge from Drzewce pit mine. In the case of sites from Widawka River and Grójecki Channel, the concentrations observed 100 m downstream of the mine water discharge were significantly higher than those recorded at other sites. However, the bottom sediments at sites B1 and B3 had similar REE concentrations, whereas at site D1, the values were higher than those recorded at site D3. This confirms the greater range of the Drzewce open-pit mine impact on the process of grain separation of bedload in the river sediments of Grójecki Channel.
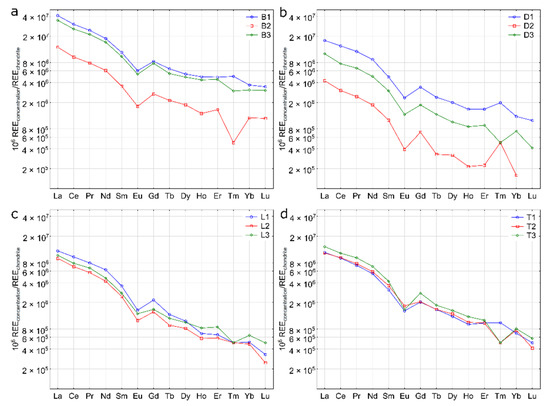
Figure 4.
Normalized REE patterns using chondrite as a normalizer for bottom sediments of rivers located within the range of the: (a) Belchatow; (b) Drzewce; (c) Lubstów; and (d) Tomislawice mines.
In the River Noteć near Lubstów pit mine, similar relationships were observed as in the case of the Bełchatów and Drzewce lignite open-pit mines. However, differences in concentrations between individual sites located on the Noteć River were lower. Another situation was observed in sediments of the Noteć River affected by the Tomisławice pit mine. In this case, REE concentrations were similar and generally followed the order T1 > T2 > T3, except for Eu, Tm, and Lu.
The (La/Yb)n ratio varied between 11.15 and 26.63. The lowest values of (La/Yb)n were observed at sites downstream of mine water discharge from Bełchatów pit mine. The obtained values were very similar, ranging from 11.15 to 11.60. The remaining sites showed large variation in (La/Yb)n ratios, with the highest values in the case of sites located within the reach of the Drzewce pit mine. The (La/Sm)n and (Sm/Yb)n ratios ranged from three to more than seven times lower than the (La/Yb)n ratios. The (La/Sm)n ratios had the lowest variation, ranging from 3.10 to 3.94, whereas the (Sm/Yb)n ratios ranged from 3.10 to 7.03. A negative Eu anomaly was observed in all cases, whereas Ce and Gd anomalies were not identified.
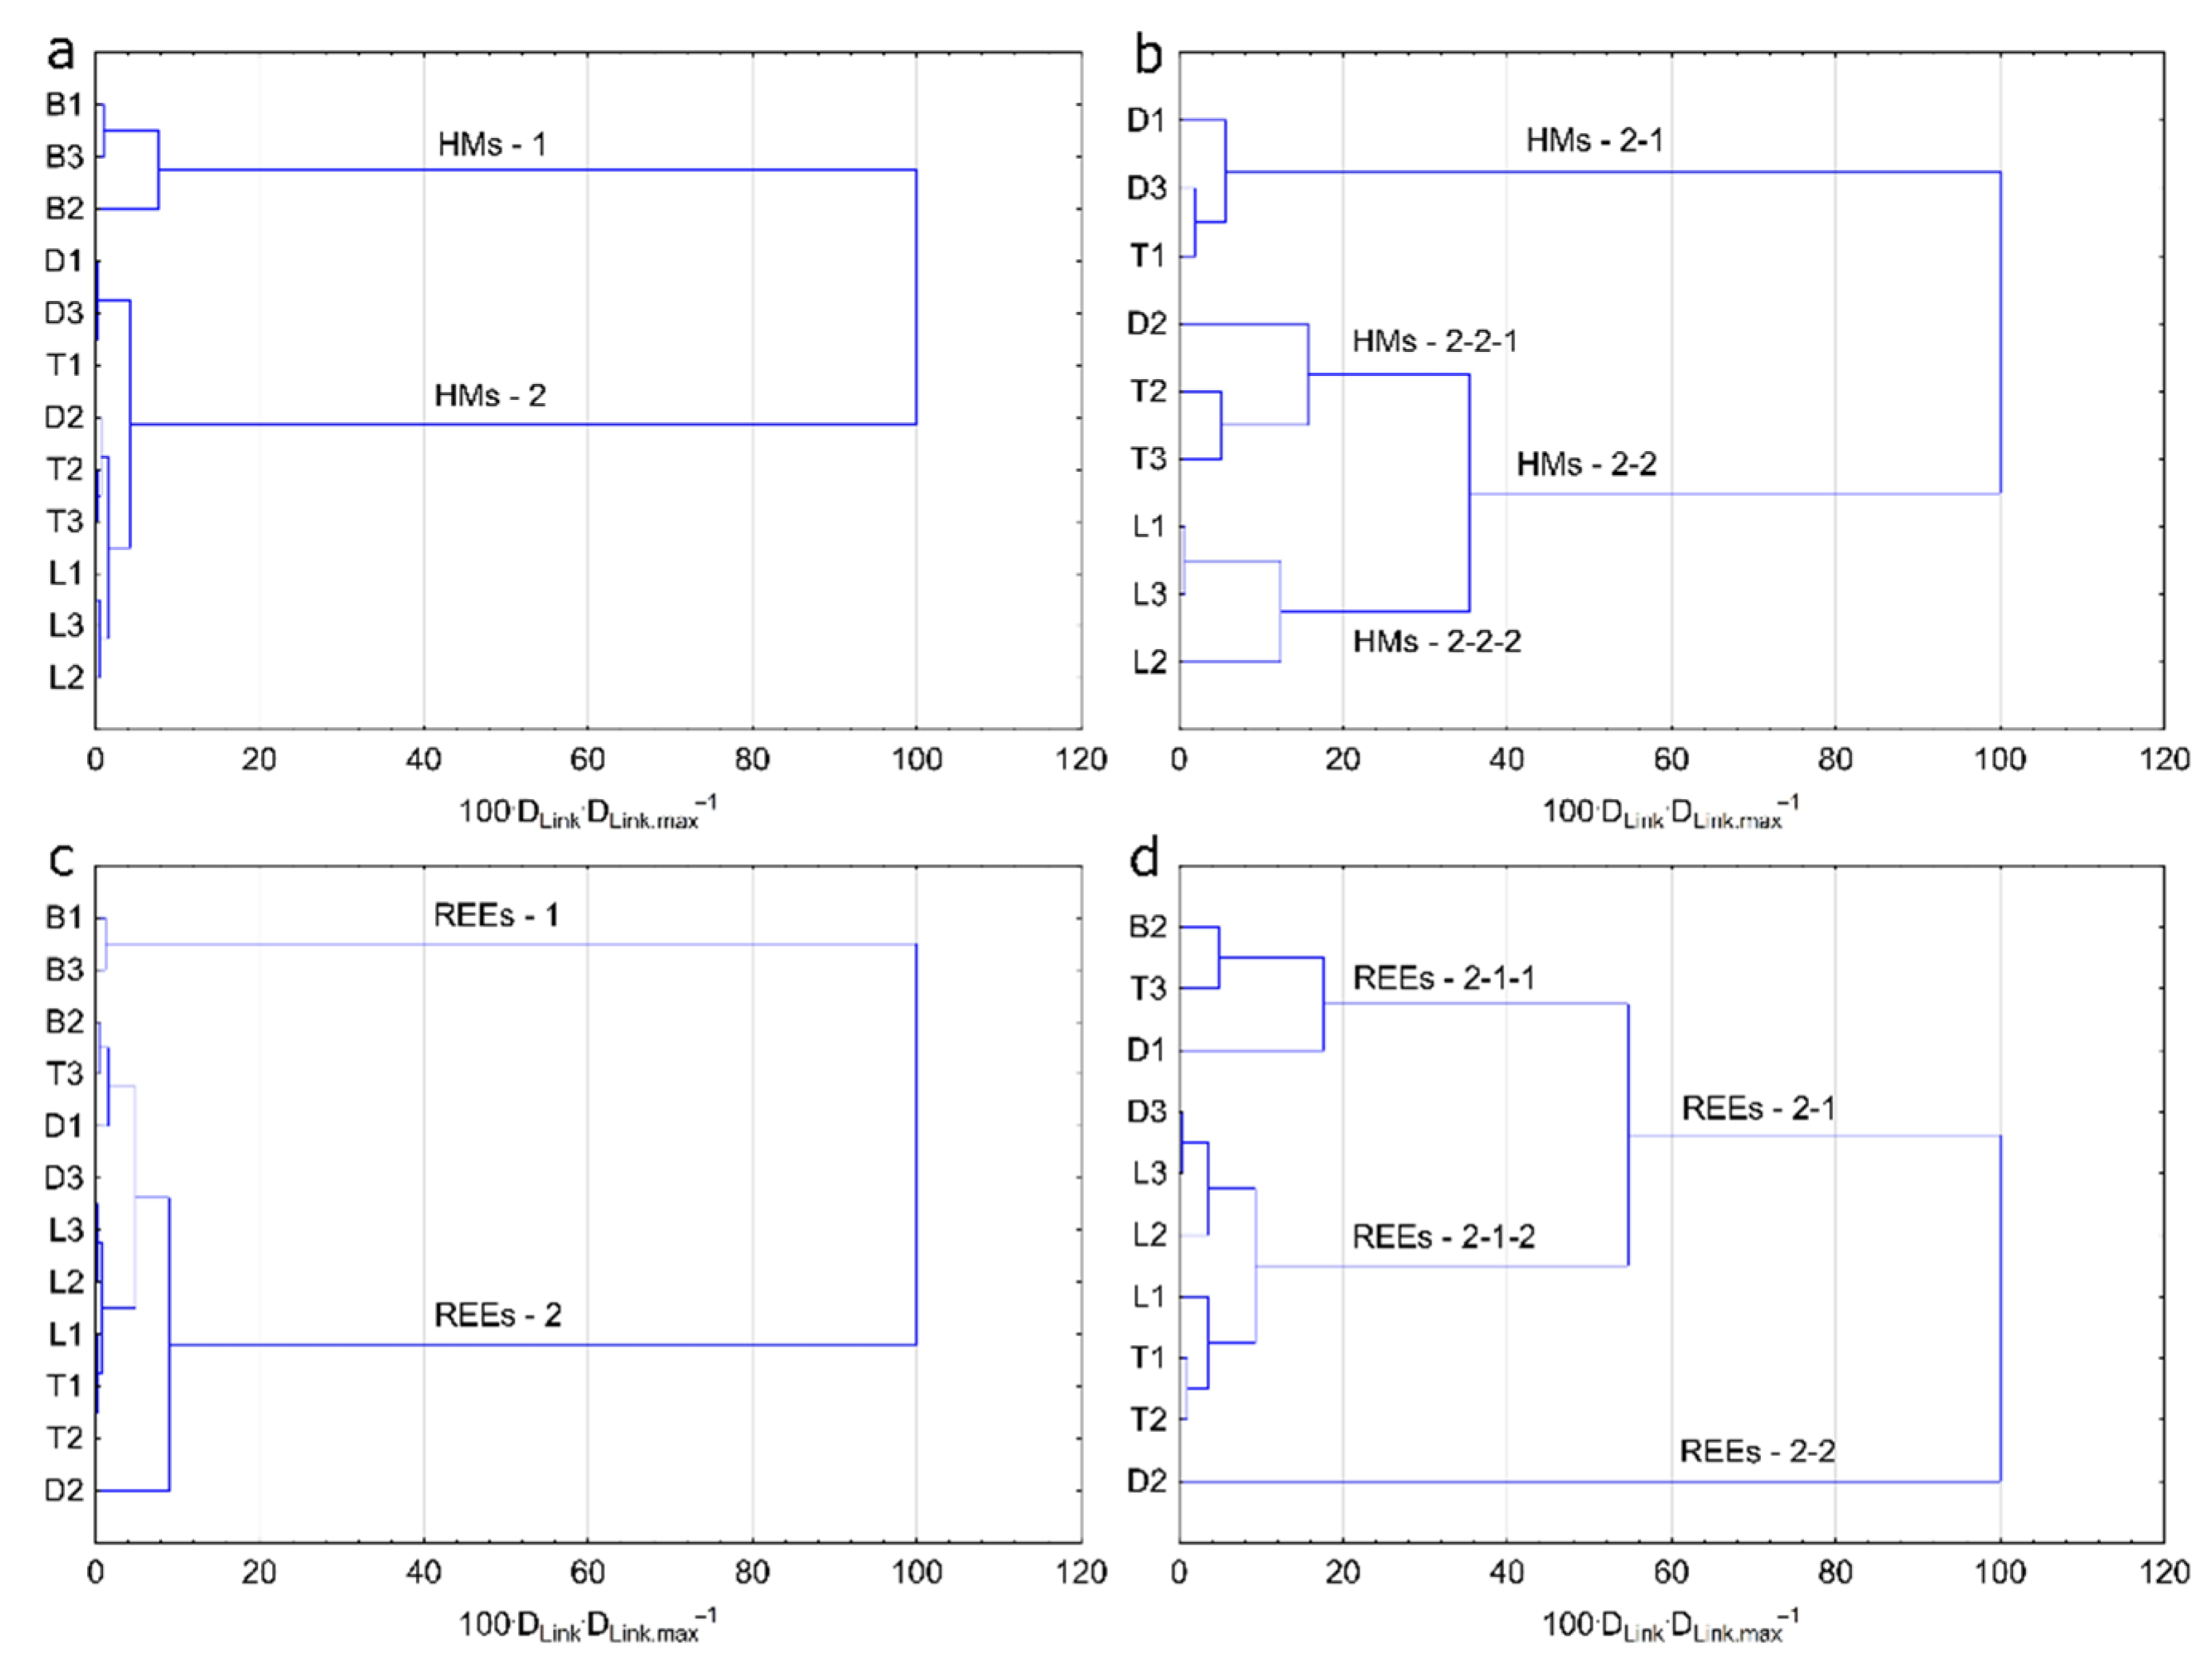
Cluster analysis was conducted in two variations for HM and REE contents in sediments. Based on the content of HMs in river sediments, sites were divided into two main groups. The first group included sites located on the Widawka River (Bełchatów open-pit mine) (Figure 4a), and the highest HM concentrations were observed at the sites mentioned above. Within the second group, two subgroups were distinguished (Figure 5b). The first subgroup (2-1) included sites D1, D3, and T1, in which HM concentrations were higher than in the subgroup (2-2). The highest similarity in terms of HM concentrations was observed in sediments of sites located on Noteć River near Lubstów mine (L1, L2, L3).
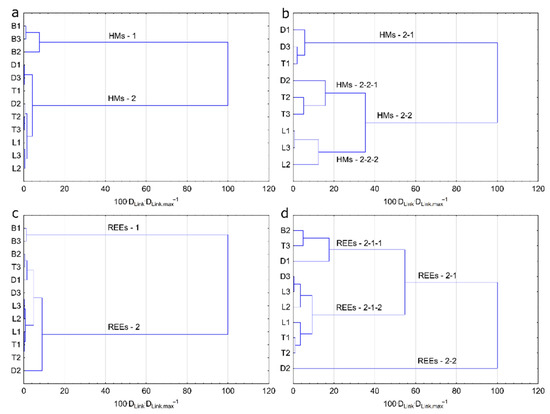
Figure 5.
Division of study sites in terms of HM and REE content into: (a,c) groups and (b,d) subgroups.
According to REE concentrations in sediments, the studied sites were divided into two groups (Figure 5c). In this case, different results were obtained than for HMs. The first group (1) includes two sites located on the Widawka River (B1 and B3), characterized by the highest concentration of REEs. There were ten sites in the second group, which was divided into two subgroups (2-1 and 2-2). Subgroup 2-2 includes only site B2, where concentrations were the lowest (100 m downstream of the Bełchatów mine discharge). Moreover, the chondrite-normalized graph differs from that of the other surveyed sites. Therefore, subgroup 2-1 was divided into two parts that were similar in both concentration and pattern.
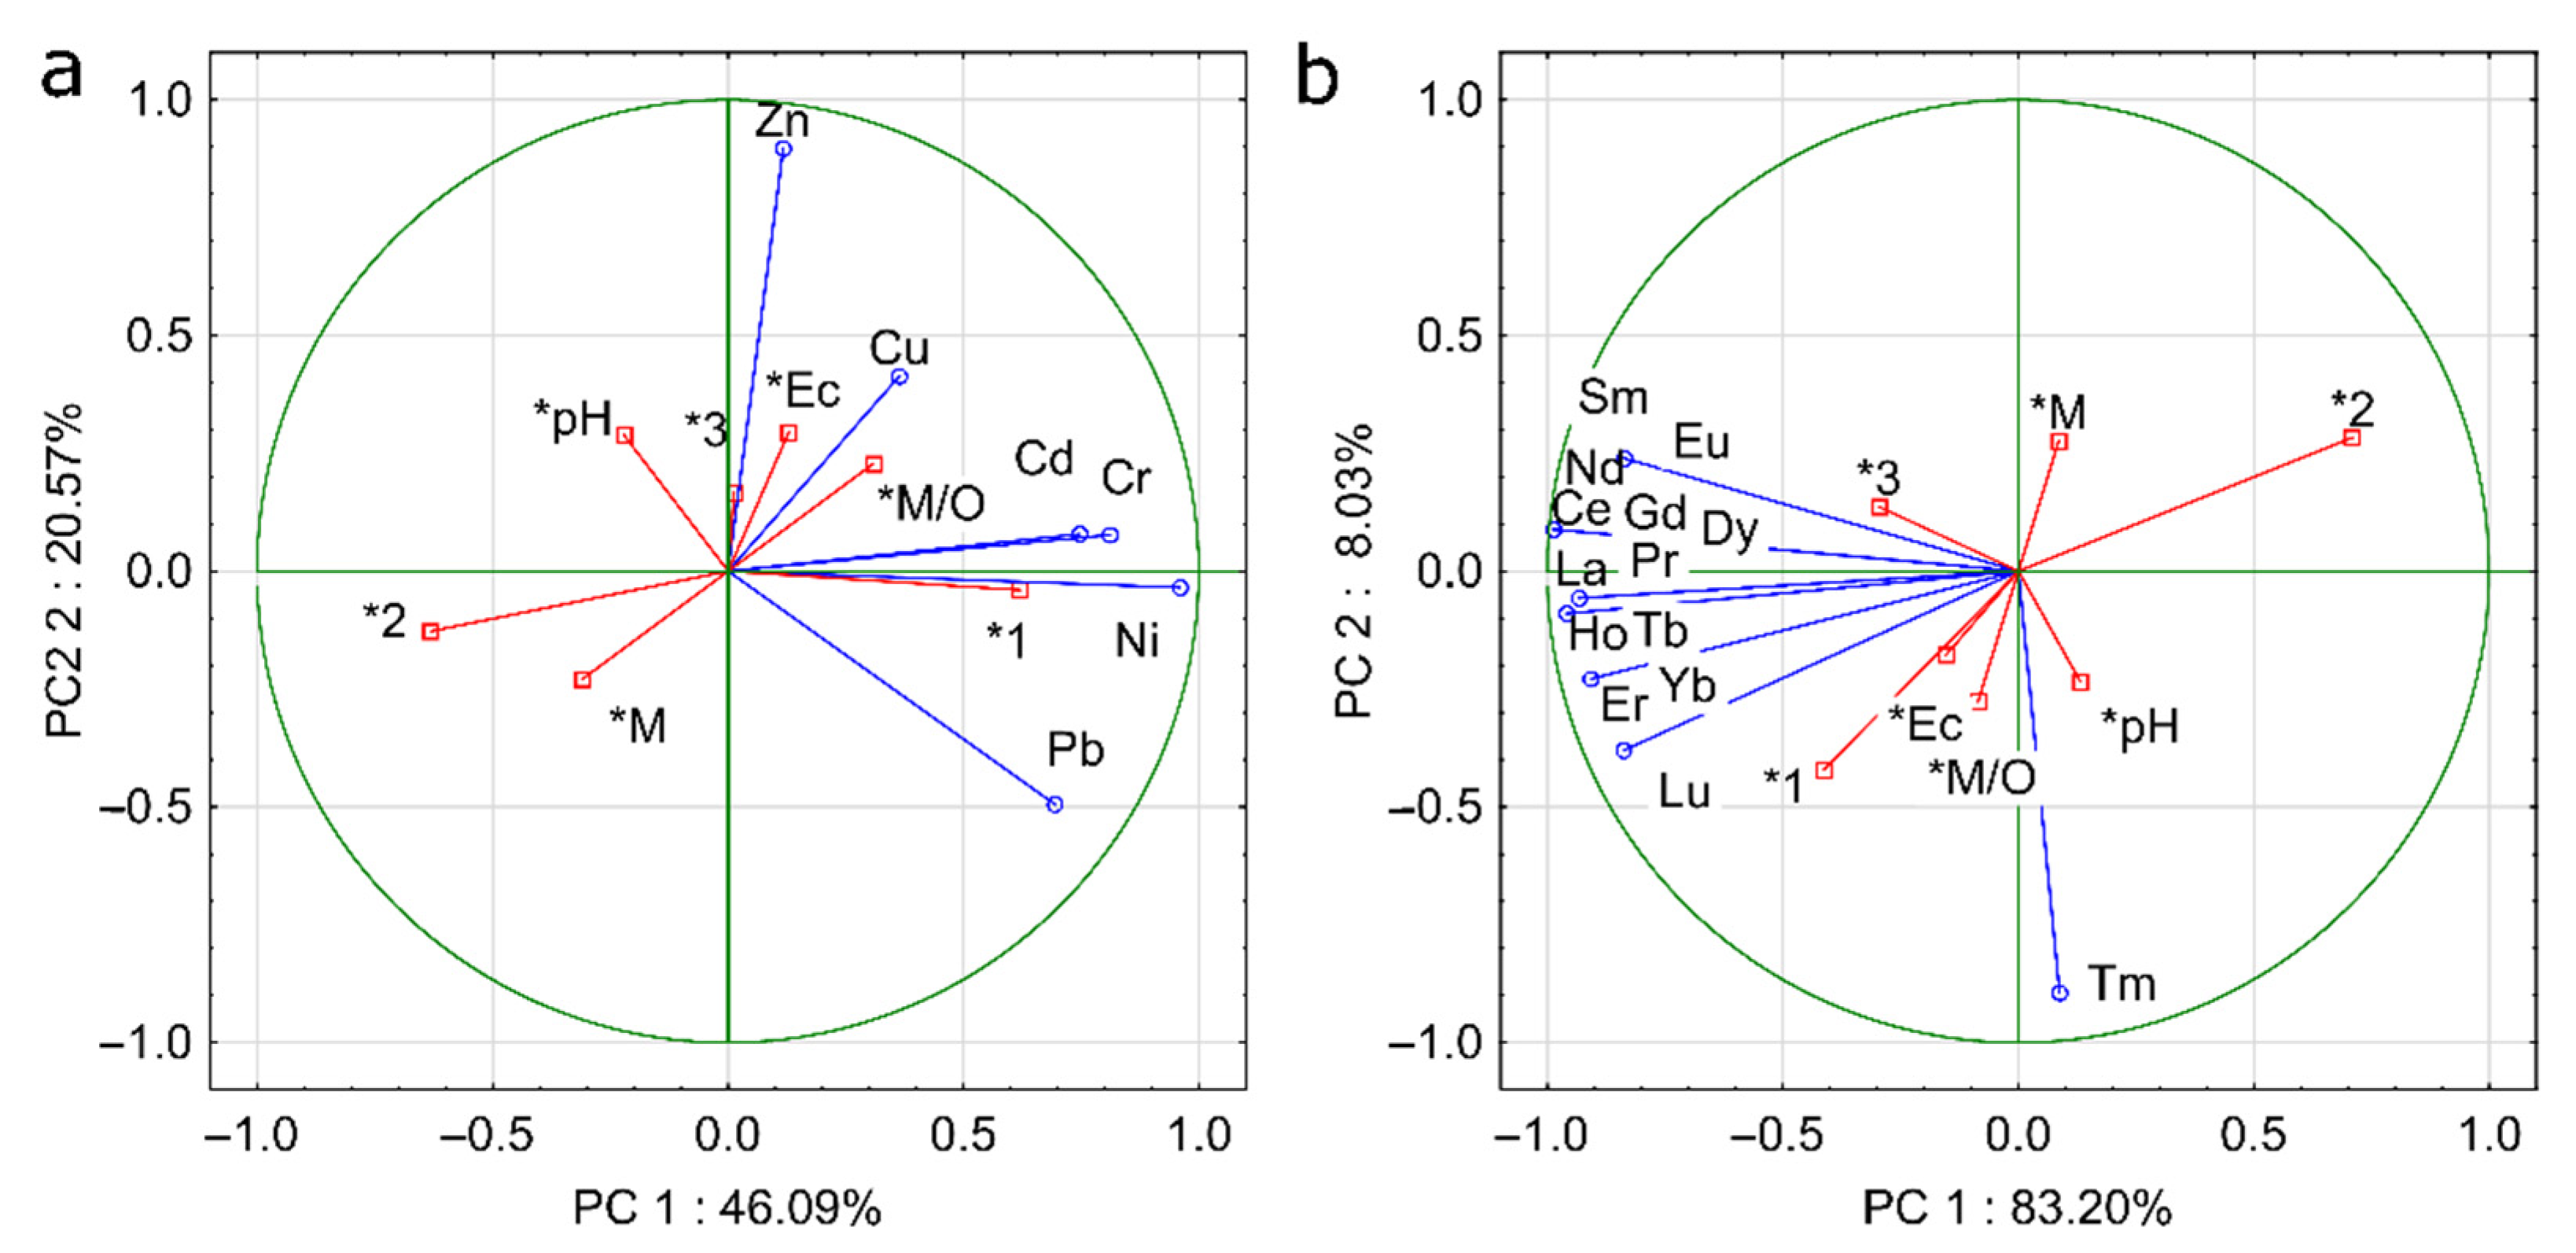
PCA-based HM and REE data transformation using centered log-ratio transformation (clr) enabled, in both cases, identification of two factors with eigenvalues higher than 1. The HMs and REEs explain 66.65% and 91.23% of internal variability, respectively (Figure 6a and Figure 6b).
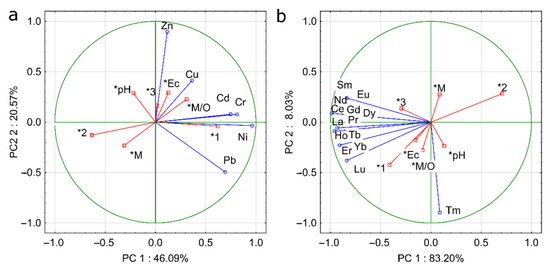
Figure 6.
Results of PCA analysis for (a) HMs and (b) REEs (M/O, mineral/organic sediments; M, mineral sediments, pH value; EC, electric conductivity; 1, site located 50 m upstream of discharge, 2, site 100 m downstream of discharge; 3, site 1 km downstream of discharge.
Analysis of data from all four sections showed a relationship between the location of the studied sites and the distance from mine water discharge. The highest concentrations were observed mostly upstream of the mine water discharge, whereas the lowest concentrations were found 100 m downstream of the discharge. Medium values were observed at sites located 1000 m downstream of the discharge. In the case of HM and REE concentrations, PCA analysis showed a lack of relationship between environmental factors (sediment texture, EC, and pH). However, a very strong correlation was found between the REE values. The only element whose concentrations differed between samples was Tm. Less significant correlations were found between the HM values, and they had higher concentrations in sediments characterized by mineral-organic structure.
4. Discussion
Mine waters may contain various pollutants, including heavy metals [7,16,52]. The chemistry of water from rock mass dewatering varies from region to region [9,53]. Additionally, previous results show that anthropogenic lakes formed after open-pit brown coal mine deactivation have elevated concentrations of HMs [54,55].
Concentrations of heavy metals in the studied sediments were not the highest observed in surface waters in Poland [8], but there was an increased level of ions in the total concentration in river sediments 1 km downstream of mine water discharge. The results of our research show that in all studied cases, sites located 100 m downstream of mine water discharge had the lowest concentration of all analyzed elements in sediments. This confirms earlier studies [8] wherein the same trend was observed due to the impact of kinetic energy of discharge from pit mines. Increasing discharge can flush small grain-sized particles downstream [56]. Small grain-sized particles play a role in causing high metal concentrations due to the large external surface area of such grains. In contrast, the highest concentrations of heavy metals were recorded upstream of the mine water discharge or were similar upstream and downstream of the mine water discharge. However, the results most often show that elevated metal and metalloid concentrations in rivers and sediments are observed in the areas downstream of the mine [57]. Studies conducted on rivers upstream of retention reservoirs indicate that a decrease in flow velocity results in accumulation of fine sediment fractions and organic matter fractions and thus an increase in HM concentrations [58]. Additionally, similar relationships are observed in retention reservoirs, where the distribution of HM concentrations is influenced by the kinetic energy of the discharge, which affects the sorting of sediment within the reservoir [59,60]. Furthermore, natural reservoirs alter flow conditions and thus the transport of HMs in the river [61].
Another important factor affecting the distribution of elements in sediments is aeration, especially in the case of deoxygenated mine waters from deep drainage, as in the case of Lubstów mine. During contact with river waters, chemical processes occur, which are much stronger during turbulent mixing. As a result of such processes, iron oxide (Fe2O3) is present in sediments [62]. Another metal with similar characteristics is manganese, which is present in sediments as the inorganic compound manganese dioxide (MnO2). Only in the case of Lubstów open-pit mine, it was observed that concentrations of Fe and Mn (1256.72 mg Fe kg−1, 30.301 mg Mn kg−1) at the site located 100 m downstream of discharge were higher than at sites located 50 m upstream of mine water discharge (1136.425 mg Fe kg−1, 21.381 mg Mn kg−1). This can be explained by the type of brown coal mine waters discharged to the river.
Among the important sources of metals in lignite mine waters after standard treatment in settling ponds are total suspended solids and total dissolved solids, impacting effluent color, among other things [11]. Both reduced during treatment, but turbidity of mixed mine waters and especially mine waters from surface drainage was visible during field studies, affecting several aspects of river habitat, including physicochemical characteristics of waters and sediments or aquatic plant species composition [8,11]. Some plants may be eliminated from the list of macrophyte species due to limitation of light penetration in deeper parts of water [12]. This is not a desirable situation, considering plants’ role as a natural barrier able to accumulate some soluble elements, including heavy metals, in their biomass [63]. Khan et al. [64] reported elevated concentrations of HMs in untreated wastewater discharged from mine pits in the case of Cr, Co, and Hg. It was found that lead, zinc, cadmium, and copper concentrations in mine waters were within the limits for irrigation in all surveyed samples. The authors emphasized that elevated concentrations of toxic metals, such as chromium, cobalt, and mercury, can accumulate in the environment, leading to serious health hazards in local ecosystems.
Only in the case of the Widawka River were the HM concentrations at a high level, which indicates sediment pollution mainly caused by industrial activity. Human pressure on watercourses in this region, including Widawka River, has been observed by other authors in the case of both biological and hydrological changes [65,66,67]. Water discharge from the dewatering of Bełchatów opencast mine positively influenced the lowering of sediment pollution. This reaction was most pronounced immediately downstream of the discharge, although the effect was also evident at the site located 1000 m downstream of the mine discharge. However, even in this case, the PLI values exceeded 2, which indicates the contamination of bottom sediments by HMs. Studies of the largest rivers in Poland show considerable variation in bottom sediment pollution [68,69]. PLI index values within the Warta River (the third longest river in Poland) in 2016 and 2017 varied from 0.25 to 16.93. However, within the Vistula and Oder rivers, the two largest rivers in Poland, PLI index values indicate bottom sediment pollution. Within the rivers, there is relatively large variation in HM content, which indicates the influence of point sources and fluvial processes that affect the transport of HMs along the river course. Many rivers of different geographical location and different levels of heavy metal pollution have been studied using the PLI index. For instance, the PLI for the Ona River (Nigeria) varied from 0.00033 to 0.05; for the Kunda River (India), varied from 0.41 to 0.63; and for the Euphrates river (Iraq), varied from 0.45 to 1.15; thus, the mentioned rivers were not affected by mining activities and showed, for the most part, a lack of heavy metal contamination, except one site located on the Euphrates [70,71,72]. Rivers affected by mining had PLI index values varying from 0.06 (Lubstów mine, Noteć River) to 3.25 (Bełchatów mine, Widawka River). In general, only at sites located on Widawka river were the PLI values higher than 1, including 50 m upstream of the mine water discharge. ER and PERI index values indicate the very low toxic effect of HMs accumulated in river sediments. Only in the Widawka river is a toxic impact from Ni possible at sites upstream and downstream of the mine water discharge. In contrast, this impact is not the result of mine water discharge. This river is located in an industrial area (including mining activities and water uptake by electric power plant) with a long-term impact of cone of depression [73]. The PERI index calculated for the studied river sites confirmed the observations and showed that only in the case of Widawka River (sites B1 and B3) was the index higher than 100, thus indicating moderate ecological risk (Table 1). The other studied sites, including site B2 (100 m downstream of Bełchatów mine discharge) were classified as a low ecological risk of pollution and varied from 2.4 (Noteć River, site L2) to 51.8 (Widawka River, site B2). For comparison, in the Xihe River (China), located in the industrial area of the Huhne River tributary, at most sites, the PERI index was classified as very high ecological risk (PERI > 400) [74]. In Poland, for comparison, toxic risk index values in the Vistula, Odra and Warta rivers indicate differential effects of HMs accumulated in sediments on aquatic organisms, ranging from low toxic risk to very high toxic risk.
The analysis of REE concentrations showed a very similar pattern to that of HMs. In general, their concentrations upstream and downstream of the mine water discharge were at similar levels, and the lowest concentrations were found downstream of the mine water discharge. The highest concentrations of REE were observed at Bełchatów (B1, B3), Drzewce (D1) and Tomisławice (T3) site, and dominant elements were cesium, lanthanum, and neodymium. The lowest ΣREE values were found at sites located 100 m downstream of discharge: L2 (Lubstów, mine waters from deep drainage) and D2 (Drzewce). In addition, the discharge of mine water does not affect the pattern of individual REEs. The study indicated the occurrence of only Eu anomaly. Additionally, studies of bottom sediments of Lake Wadąg and tributary rivers indicate the presence of a negative Eu anomaly [48]. Large Eu anomalies indicate that the surface sediments are in an oxidizing environment [75]. Slightly different behavior of REEs has been observed in lakes. In lakes located in Bory Tucholskie National Park, a negative Eu anomaly and a positive Gd anomaly were identified in most lakes, with a negative anomaly of Yb and Tm in single lakes [76]. CA analysis showed that sites located on the Widawka River were outliers relative to the other sites in terms of HMs and REEs. At the other sites, HM concentrations were at similar levels within each river section, whereas in terms of REE concentrations, site variation was greater within even the designated river sections. PCA analysis confirms that mine water discharge affects the reduction in HM and REE concentrations downstream of the discharge.
5. Conclusions
The main conclusions derived from the conducted studies are as follows:
- Mine water discharge can modify concentrations of heavy metals and rare earth elements in sediments, causing a decrease in concentration at sites located close to the mine and an increase concentrations at sites located downstream of the full mixing zone;
- The main factor reducing the concentrations of heavy metals and rare earth elements in sediments is the kinetic energy of the water, which causes the washing away of the fine particles and organic matter;
- Mine water discharges do not change the pattern of individual rare earth elements in sediments;
- Studied sites located downstream of discharge showed a lack of ecological risk according to the presence of metals, except Widawka River, where risk was also observed upstream of mine water discharge;
- Mine waters from surface drainage should be kept longer in settling ponds to reduce total suspended solids with HMs and REEs bonded to them. This requires the creation of settling ponds with increased volume to increase retention time of mine waters;
- The length of full mixing should be limited to enhance river self-purification after the inflow of mine waters to the watercourse.
Supplementary Materials
The following supporting information can be downloaded at: https://www.mdpi.com/article/10.3390/en15082828/s1, Table S1. The classes of pollution and potential ecological risk.
Author Contributions
Conceptualization, M.S. and R.S.; methodology, M.S., R.S. and P.N.; software, M.S.; validation, M.S., R.S. and P.N.; formal analysis, M.S., R.S., P.N. and T.S.; investigation, R.S. and T.S.; resources, M.S., R.S. and P.N.; data curation, M.S.; writing—original draft preparation, M.S.; writing—review and editing, R.S.; visualization, M.S.; supervision, R.S. and M.S.; project administration, R.S. and M.S.; funding acquisition, R.S., M.S. and P.N. All authors have read and agreed to the published version of the manuscript.
Funding
This research was funded by the Polish Ministry of Science and Higher Education, 506.868.06.00/UPP. The publication was financed within the framework of the Ministry of Science and Higher Education program as “Regional Initiative Excellence” in from 2019 to 2022, Project No. 005/RID/2018/19. Studies of the Widawka River were financed by the National Science Centre in Poland (NCN) according to decision DEC-2011/01/B/ ST10/00513 (2011-13).
Institutional Review Board Statement
Not applicable.
Informed Consent Statement
Not applicable.
Conflicts of Interest
The authors declare no conflict of interest.
References
- Kasztelewicz, Z. Lignite deposits in Poland and perspectives of their utilization. Polityka Energetyczna-Energy Policy J. 2008, 11, 181–200. [Google Scholar]
- Kasztelewicz, Z.; Tajduś, A.; Cała, M.; Ptak, M.; Sikora, M. Strategic conditions for the future of brown coal mining in Poland. Energy Policy J. 2018, 21, 155–178. [Google Scholar] [CrossRef]
- Kasztelewicz, Z.; Tajduś, A.; Słomka, T. Lignite is the fuel of the future or the past. Napedy Sterow. 2017, 7, 88–104. [Google Scholar]
- Kasztelewicz, Z.; Zajączkowski, M. Impact of lignite mining on its surroundings. Energy Policy J. 2010, 13, 227–243. [Google Scholar]
- Przybyłek, J. Current problems of the lignite opencast mines dewatering in the Wielkopolska region. Górnictwo Odkryw. 2018, 59, 5–14. [Google Scholar]
- Pepliński, B.; Czubak, W. The influence of opencast lignite mining dehydration on plant production—A methodological study. Energies 2021, 14, 1917. [Google Scholar] [CrossRef]
- Singh, R.N.; Atkins, A.S.; Pathan, A.G. Determination of ground water quality associated with lignite mining in arid climate. Int. J. Min. Environ. Issues 2010, 1, 65–78. [Google Scholar]
- Staniszewski, R. Heavy Metals in Waters and Sediments of Rivers Affected by Brown Coal Mine Waters. Pol. J. Environ. Stud. 2014, 23, 2217–2222. [Google Scholar] [CrossRef]
- Muthangya, M.; Samoei, D. Status of water quality in the coal rich Mui Basin on Kitui county, Kenya. ARPN J. Earth Sci. 2012, 1, 48–51. [Google Scholar]
- Dulewski, J.; Walter, A. Mine waters management in lignite mines on the background of the whole mining sector. WUG 2007, 6, 5–10. [Google Scholar]
- Staniszewski, R.; Cais-Sokolińska, D.; Kaczyński, Ł.K.; Bielska, P. Use of Bioluminescence for Monitoring Brown Coal Mine Waters from Deep and Surface Drainage. Energies 2021, 14, 3558. [Google Scholar] [CrossRef]
- Staniszewski, R.; Jusik, S. Impact of mine waters discharge from open-pit lignite mine on river water quality. Rocz. Ochr. Srodowiska 2013, 15, 2652–2665. [Google Scholar]
- Tiwari, A.K.; Singh, P.K.; Mahato, M.K. Environmental geochemistry and a quality assessment of mine water of the West Bokaro coalfield, India. Mine Water Environ. 2016, 35, 525–535. [Google Scholar] [CrossRef]
- Tiwari, A.K.; Singh, P.K.; Mahato, M.K. Assessment of metal contamination in the mine water of the West Bokaro Coalfield, India. Mine Water Environ. 2017, 36, 532–541. [Google Scholar] [CrossRef]
- Vasileiou, E.; Perraki, M.; Dmitrakopulos, D. Using leaching tests to investigate mine water contamination. The case study of Open South Lignite Field, Western Macedonia, Greece. FOG-Freib. Online Geosci. 2015, 40, 1–8. [Google Scholar]
- Younger, P.L.; Wolkersdorfer, C. Mining impacts on the fresh water environment: Technical and managerial guidelines for catchment scale management. Mine Water Environ. 2004, 23, 2–80. [Google Scholar] [CrossRef]
- Downing, J. Limnology and oceanography: Two estranged twins reuniting by global change. Inland Waters 2014, 4, 215–232. [Google Scholar] [CrossRef]
- Hancock, S.; Wolkersdorfer, C. Renewed demands for mine water management. Mine Water Environ. 2012, 31, 143–158. [Google Scholar] [CrossRef]
- Skousen, J.G.; Ziemkiewicz, P.F.; McDonald, J.L. Acid mine drainage formation, control and treatment: Approaches and strategies. Extr. Ind. Soc. 2019, 6, 241–249. [Google Scholar] [CrossRef]
- Singh, A.K.; Mahato, M.K.; Neogi, B.; Singh, K.K. Quality assessment of mine water in the Raniganj coalfield area, India. Mine Water Environ. 2010, 29, 248–262. [Google Scholar] [CrossRef]
- Singh, A.K.; Mahato, M.K.; Neogi, B.; Tewary, B.K.; Sinha, A. Environmental geochemistry and quality assessment of mine water of Jharia coalfield, India. Environ. Earth Sci. 2012, 65, 49–65. [Google Scholar] [CrossRef]
- Gao, J.Q.; Yu, Y.; Wang, D.H.; Wang, W.; Wang, C.H.; Dai, H.Z.; Xue-Feng, H.; Cen, K. Effects of lithium resource exploitation on surface water at Jiajika mine, China. Environ. Monit. Assess. 2021, 193, 1–16. [Google Scholar] [CrossRef]
- Mahato, M.K.; Singh, G.; Singh, P.K.; Singh, A.K.; Tiwari, A.K. Assessment of mine water quality using heavy metal pollution index in a coal mining area of Damodar River Basin, India. Bull. Environ. Contam. Toxicol. 2017, 99, 54–61. [Google Scholar] [CrossRef]
- Karina, S.; Suhermi, R.; Alesyah, M.; Octavina, C.; Ulfah, M. Analysis of heavy metals in fluvial sediments affected by coal spill waters in Lampuuk Beach, Aceh Province, Indonesia. IOP Conf. Ser. Earth Environ. Sci. 2019, 348, 012085. [Google Scholar] [CrossRef]
- Filgueiras, A.V.; Lavilla, I.; Bendicho, C. Evaluation of distribution, mobility and binding behaviour of heavy metals in surficial sediments of Louro River (Galicia, Spain) using chemometric analysis: A case study. Sci. Total Environ. 2004, 330, 115–129. [Google Scholar] [CrossRef]
- Joksimovic, D.; Tomic, I.; Stankovic, A.R.; Jovic, M.; Stankovic, S. Trace metal concentrations in Mediterranean blue mussel and surface sediments and evaluation of the mussels quality and possible risks of high human consumption. Food Chem. 2011, 127, 632–637. [Google Scholar] [CrossRef]
- Luoma, S.N.; Bryan, G.W. A statistical assessment of the form of trace metals in oxidized estuarine sediments employing chemical extractants. Sci. Total Environ. 1981, 17, 165–196. [Google Scholar] [CrossRef]
- Friedland, G.; Grüneberg, B.; Hupfer, M. Geochemical signatures of lignite mining products in sediments downstream a fluvial-lacustrine system. Sci. Total Environ. 2021, 760, 143942. [Google Scholar] [CrossRef]
- Miller, V.S.; Naeth, M.A.; Wilkinson, S.R. Micro topography, organic amendments and an erosion control product for reclamation of waste materials at an arctic diamond mine. Ecol. Eng. 2021, 172, 106399. [Google Scholar] [CrossRef]
- Policht-Latawiec, A.; Kapica, A. Influence of Hard Coal Mine on Water Quality in the Vistula River. Rocz. Ochr. Srodowiska 2013, 15, 2640–2651. [Google Scholar]
- Pietrzyk-Sokulska, E.; Uberman, R.; Kulczycka, J. The impact of mining on the environment in Poland–Myths and reality. Gospod. Surowcami Miner. 2015, 31, 45–64. [Google Scholar] [CrossRef]
- Kondracki, J. Regional Geography of Poland; PWN: Warsaw, Poland, 2013; p. 444. [Google Scholar]
- Ziernicka-Wojtaszek, A.; Kopcińska, J. Variation in atmospheric precipitation in Poland in the years 2001–2018. Atmosphere 2020, 11, 794. [Google Scholar] [CrossRef]
- Martin, J.M.; Meybeck, M. Elemental mass-balance of material carried by major world rivers. Mar. Chem. 1979, 7, 173–206. [Google Scholar] [CrossRef]
- Tomlinson, D.L.; Wilson, J.G.; Harris, C.R.; Jeffrey, D.W. Problems in the assessment of heavy-metal levels in estuaries and the formation of a pollution index. Helgoländer Meeresunters. 1980, 33, 566–575. [Google Scholar] [CrossRef]
- Nemerow, N.L. Stream, Lake, Estuary, and Ocean Pollution; Van Nostrand Reinhold: New York, NY, USA, 1991. [Google Scholar]
- Yan, N.; Liu, W.; Xie, H.; Gao, L.; Han, Y.; Wang, M.; Li, H. Distribution and assessment of heavy metals in the surface sediment of Yellow River, China. J. Environ. Sci. 2016, 39, 45–51. [Google Scholar] [CrossRef]
- Hakanson, L. An ecological risk index for aquatic pollution control: A sediment ecological approach. Water Res. 1980, 14, 975–1001. [Google Scholar] [CrossRef]
- Bojakowska, I.; Sokołowska, G. Geochemical quality classes of aquatic sediments. Prz. Geol. 1998, 46, 49–54. [Google Scholar]
- Omwene, P.I.; Öncel, M.S.; Çelen, M.; Kobya, M. Heavy metal pollution and spatial distribution in surface sediments of Mustafakemalpaşa stream located in the world’s largest borate basin (Turkey). Chemosphere 2018, 208, 782–792. [Google Scholar] [CrossRef]
- Zhang, H.; Zeng, H.; Jiang, Y.; Xie, Z.; Xu, X.; Ding, M.; Wang, P. Using the compound system to synthetically evaluate the enrichment of heavy metal (loid) s in a subtropical basin, China. Environ. Pollut. 2020, 256, 113396. [Google Scholar] [CrossRef]
- Custodio, M.; Fow, A.; Chanamé, F.; Orellana-Mendoza, E.; Peñaloza, R.; Alvarado, J.C.; Cano, D.; Pizarro, S. Ecological Risk Due to Heavy Metal Contamination in Sediment and Water of Natural Wetlands with Tourist Influence in the Central Region of Peru. Water 2021, 13, 2256. [Google Scholar] [CrossRef]
- Nakamura, N. Determination of REE, Ba, Fe, Mg, Na and K in carbonaceous and ordinary chondrites. Geochim. Cosmochim. Acta 1974, 38, 757–775. [Google Scholar] [CrossRef]
- Bau, M.; Dulski, P. Anthropogenic origin of positive gadolinium anomalies in river waters. Earth Planet. Sci. Lett. 1996, 143, 245–255. [Google Scholar] [CrossRef]
- de Baar, H.J.; German, C.R.; Elderfield, H.; Van Gaans, P. Rare earth element distributions in anoxic waters of the Cariaco Trench. Geochim. Cosmochim. Acta 1988, 52, 1203–1219. [Google Scholar] [CrossRef]
- Sholkovitz, E.R. The aquatic chemistry of rare earth elements in rivers and estuaries. Aquat. Geochem. 1995, 1, 1–34. [Google Scholar] [CrossRef]
- Benabdelkader, A.; Taleb, A.; Probst, J.L.; Belaidi, N.; Probst, A. Origin, distribution, and behaviour of rare earth elements in river bed sediments from a carbonate semi-arid basin (Tafna River, Algeria). Appl. Geochem. 2019, 106, 96–111. [Google Scholar] [CrossRef]
- Sojka, M.; Siepak, M.; Pietrewicz, K. Concentration of rare earth elements in surface water and bottom sediments in lake Wadąg, Poland. J. Elem. 2019, 24, 125–140. [Google Scholar]
- Li, S.; Zhang, Q. Spatial characterization of dissolved trace elements and heavy metals in the upper Han River (China) using multivariate statistical techniques. J. Hazard. Mater. 2010, 176, 579–588. [Google Scholar] [CrossRef]
- Ter Braak, C.; Smilauer, P. CANOCO Reference Manual and User’s Guide to Canoco for Windows. Software for Canonical Community Ordination, version 4.5; Canoco: Ithaca, NY, USA, 2002. [Google Scholar]
- Liu, C.W.; Lin, K.H.; Kuo, Y.M. Application of factor analysis in the assessment of groundwater quality in a blackfoot disease area in Taiwan. Sci. Total Environ. 2003, 313, 77–89. [Google Scholar] [CrossRef]
- Singh, A.K.; Mahato, M.K.; Neogi, B.; Mondal, G.C.; Singh, T.B. Hydrogeochemistry, elemental flux, and quality assessment of mine water in the Pootkee-Balihari mining area, Jharia coalfield, India. Mine Water Environ. 2011, 30, 197. [Google Scholar] [CrossRef]
- Wolkersdorfer, C.; Mugova, E. Effects of Mining on Surface Water. In Encyclopedia of Inland Waters, 2nd ed.; Elsevier: Amsterdam, The Netherlands, 2021. [Google Scholar]
- Samecka-Cymerman, A.; Kempers, A.J. Concentrations of heavy metals and plant nutrients in water, sediments and aquatic macrophytes of anthropogenic lakes (former open cut brown coal mines) differ in stage of acidification. Sci. Total Environ. 2001, 281, 87–98. [Google Scholar] [CrossRef]
- Moschini-Carlos, V.; Pompêo, M.L.M.; Lobo, F.D.L.; Meirelles, S.T. Impact of coal mining on water quality of three artificial lakes in Morozini River Basin (Treviso, Santa Catarina State, Brazil). Acta Limnol. Bras. 2011, 23, 271–281. [Google Scholar] [CrossRef]
- Frankowski, M.; Sobczyński, T.; Zioła, A. The effect of grain size structure on the content of heavy metals in alluvial sediments of the Odra River. Pol. J. Environ. Stud. 2005, 14, 81–86. [Google Scholar]
- Bianchini, F.; Pascali, G.; Campo, A.; Orecchio, S.; Bonsignore, R.; Blandino, P.; Pietrini, P. Elemental contamination of an open-pit mining area in the Peruvian Andes. Int. J. Environ. Sci. Technol. 2015, 12, 1065–1074. [Google Scholar] [CrossRef]
- Sojka, M.; Siepak, M.; Jaskuła, J.; Wicher-Dysarz, J. Heavy Metal Transport in a River-Reservoir System: A Case Study from Central Poland. Pol. J. Environ. Stud. 2018, 27, 1725–1734. [Google Scholar] [CrossRef]
- Sojka, M.; Siepak, M.; Gnojska, E. Assessment of heavy metal concentration in bottom sediments of Stare Miasto pre-dam reservoir on the Powa River. Rocz. Ochr. Srodowiska 2013, 15, 1916–1928. [Google Scholar]
- Sojka, M.; Jaskuła, J.; Siepak, M. Heavy metals in bottom sediments of reservoirs in the lowland area of western Poland: Concentrations, distribution, sources and ecological risk. Water 2018, 11, 56. [Google Scholar] [CrossRef]
- Frankowski, M.; Sojka, M.; Zioła-Frankowska, A.; Siepak, M.; Murat-Błażejewska, S. Distribution of heavy metals in the Mała Wełna River system (western Poland). Oceanol. Hydrobiol. Stud. 2009, 38, 51–61. [Google Scholar] [CrossRef]
- Staniszewski, R.; Diatta, J.B.; Andrzejewska, B. Impact of lignite mine waters from deep seated drainage on water quality of the Noteć River. J. Elem. 2014, 19, 749–758. [Google Scholar] [CrossRef]
- Samecka-Cymerman, A.; Kempers, A.J. Heavy metals in aquatic macrophytes from two small rivers polluted by urban, agricultural and textile industry sewages SW Poland. Arch. Environ. Contam. Toxicol. 2007, 53, 198–206. [Google Scholar] [CrossRef]
- Khan, R.; Israili, S.H.; Ahmad, H.; Mohan, A. Heavy Metal Pollution Assessment in Surface Water Bodies and its Suitability for Irrigation around the Neyevli Lignite Mines and Associated Industrial Complex, Tamil Nadu, India. Mine Water Environ. 2005, 24, 155–161. [Google Scholar] [CrossRef]
- Kruk, A. Long-term changes in fish assemblages of the Widawka and Grabia Rivers (Poland): Pattern recognition with a Kohonen artificial neural network. Ann. Limnol.-Int. J. Limnol. 2007, 43, 253–269. [Google Scholar] [CrossRef][Green Version]
- Sojka, M. Directions and Extent of Flows Changes in Warta River Basin (Poland) in the Context of the Efficiency of Run-of-River Hydropower Plants and the Perspectives for Their Future Development. Energies 2022, 15, 439. [Google Scholar] [CrossRef]
- Sojka, M.; Siepak, M.; Zioła, A.; Frankowski, M.; Murat-Błażejewska, S.; Siepak, J. Application of multivariate statistical techniques to evaluation of water quality in the Mała Wełna River (Western Poland). Environ. Monit. Assess. 2008, 147, 159–170. [Google Scholar] [CrossRef]
- Jaskuła, J.; Sojka, M.; Fiedler, M.; Wróżyński, R. Analysis of spatial variability of river bottom sediment pollution with heavy metals and assessment of potential ecological hazard for the Warta river, Poland. Minerals 2021, 11, 327. [Google Scholar] [CrossRef]
- Jaskuła, J.; Sojka, M. Assessment of spatial distribution of sediment contamination with heavy metals in the two biggest rivers in Poland. Catena 2022, 211, 105959. [Google Scholar] [CrossRef]
- Salah, E.; Zaidan, T.; Al-Rawi, A. Assessment of Heavy Metals Pollution in the Sediments of Euphrates River, Iraq. J. Water Resour. Prot. 2012, 4, 1009–1023. [Google Scholar] [CrossRef]
- Andem, A.B.; Okorafor, K.A.; Oku, E.E.; Ugwumba, A.A. Evaluation and Characterization of Trace Metals Contamination in the Surface Sediment Using Pollution Load Index (PLI) and Geo-Accumulation Index (Igeo) of Ona River, Western Nigeria. Int. J. Sci. Technol. Res. 2015, 4, 29–34. [Google Scholar]
- Shrivastava, V. Geochemical Assessment of Heavy Metal Pollution and Toxicity of Kunda River Sediment at Khargone District, Madhya Pradesh, India. Int. J. Eng. Res. Technol. 2014, 3, 329–333. [Google Scholar]
- Wachowiak, G.; Galiniak, G.; Jończyk, W.; Martyniak, R. Evaluation of the outflow changes in Widawka River catchment in the hydrological year 2010 under the impact of a mining and energetic investments in Bełchatów area. Górnictwo Geoinżynieria 2011, 35, 381–395. [Google Scholar]
- Liu, D.; Wang, J.; Yu, H.; Gao, H.; Xu, W. Evaluating ecological risks and tracking potential factors influencing heavy metals in sediments in an urban river. Environ. Sci. Eur. 2021, 33, 42. [Google Scholar] [CrossRef]
- Ganai, J.A.; Rashid, S.A. Rare earth element geochemistry of the Permo-Carboniferous clastic sedimentary rocks from the Spiti Region, Tethys Himalaya: Significance of Eu and Ce anomalies. Chin. J. Geochem. 2015, 34, 252–264. [Google Scholar] [CrossRef]
- Sojka, M.; Choiński, A.; Ptak, M.; Siepak, M. Causes of variations of trace and rare earth elements concentration in lakes bottom sediments in the Bory Tucholskie National Park, Poland. Sci. Rep. 2021, 11, 1–18. [Google Scholar] [CrossRef] [PubMed]
Publisher’s Note: MDPI stays neutral with regard to jurisdictional claims in published maps and institutional affiliations. |
© 2022 by the authors. Licensee MDPI, Basel, Switzerland. This article is an open access article distributed under the terms and conditions of the Creative Commons Attribution (CC BY) license (https://creativecommons.org/licenses/by/4.0/).

