

Proof-of-Concept Analysis of B Cell Receptor Repertoire in COVID-19 Patients Undergoing ECMO by Single-Cell V(D)J and Gene Expression Sequencing
 , , , , and
Abstract
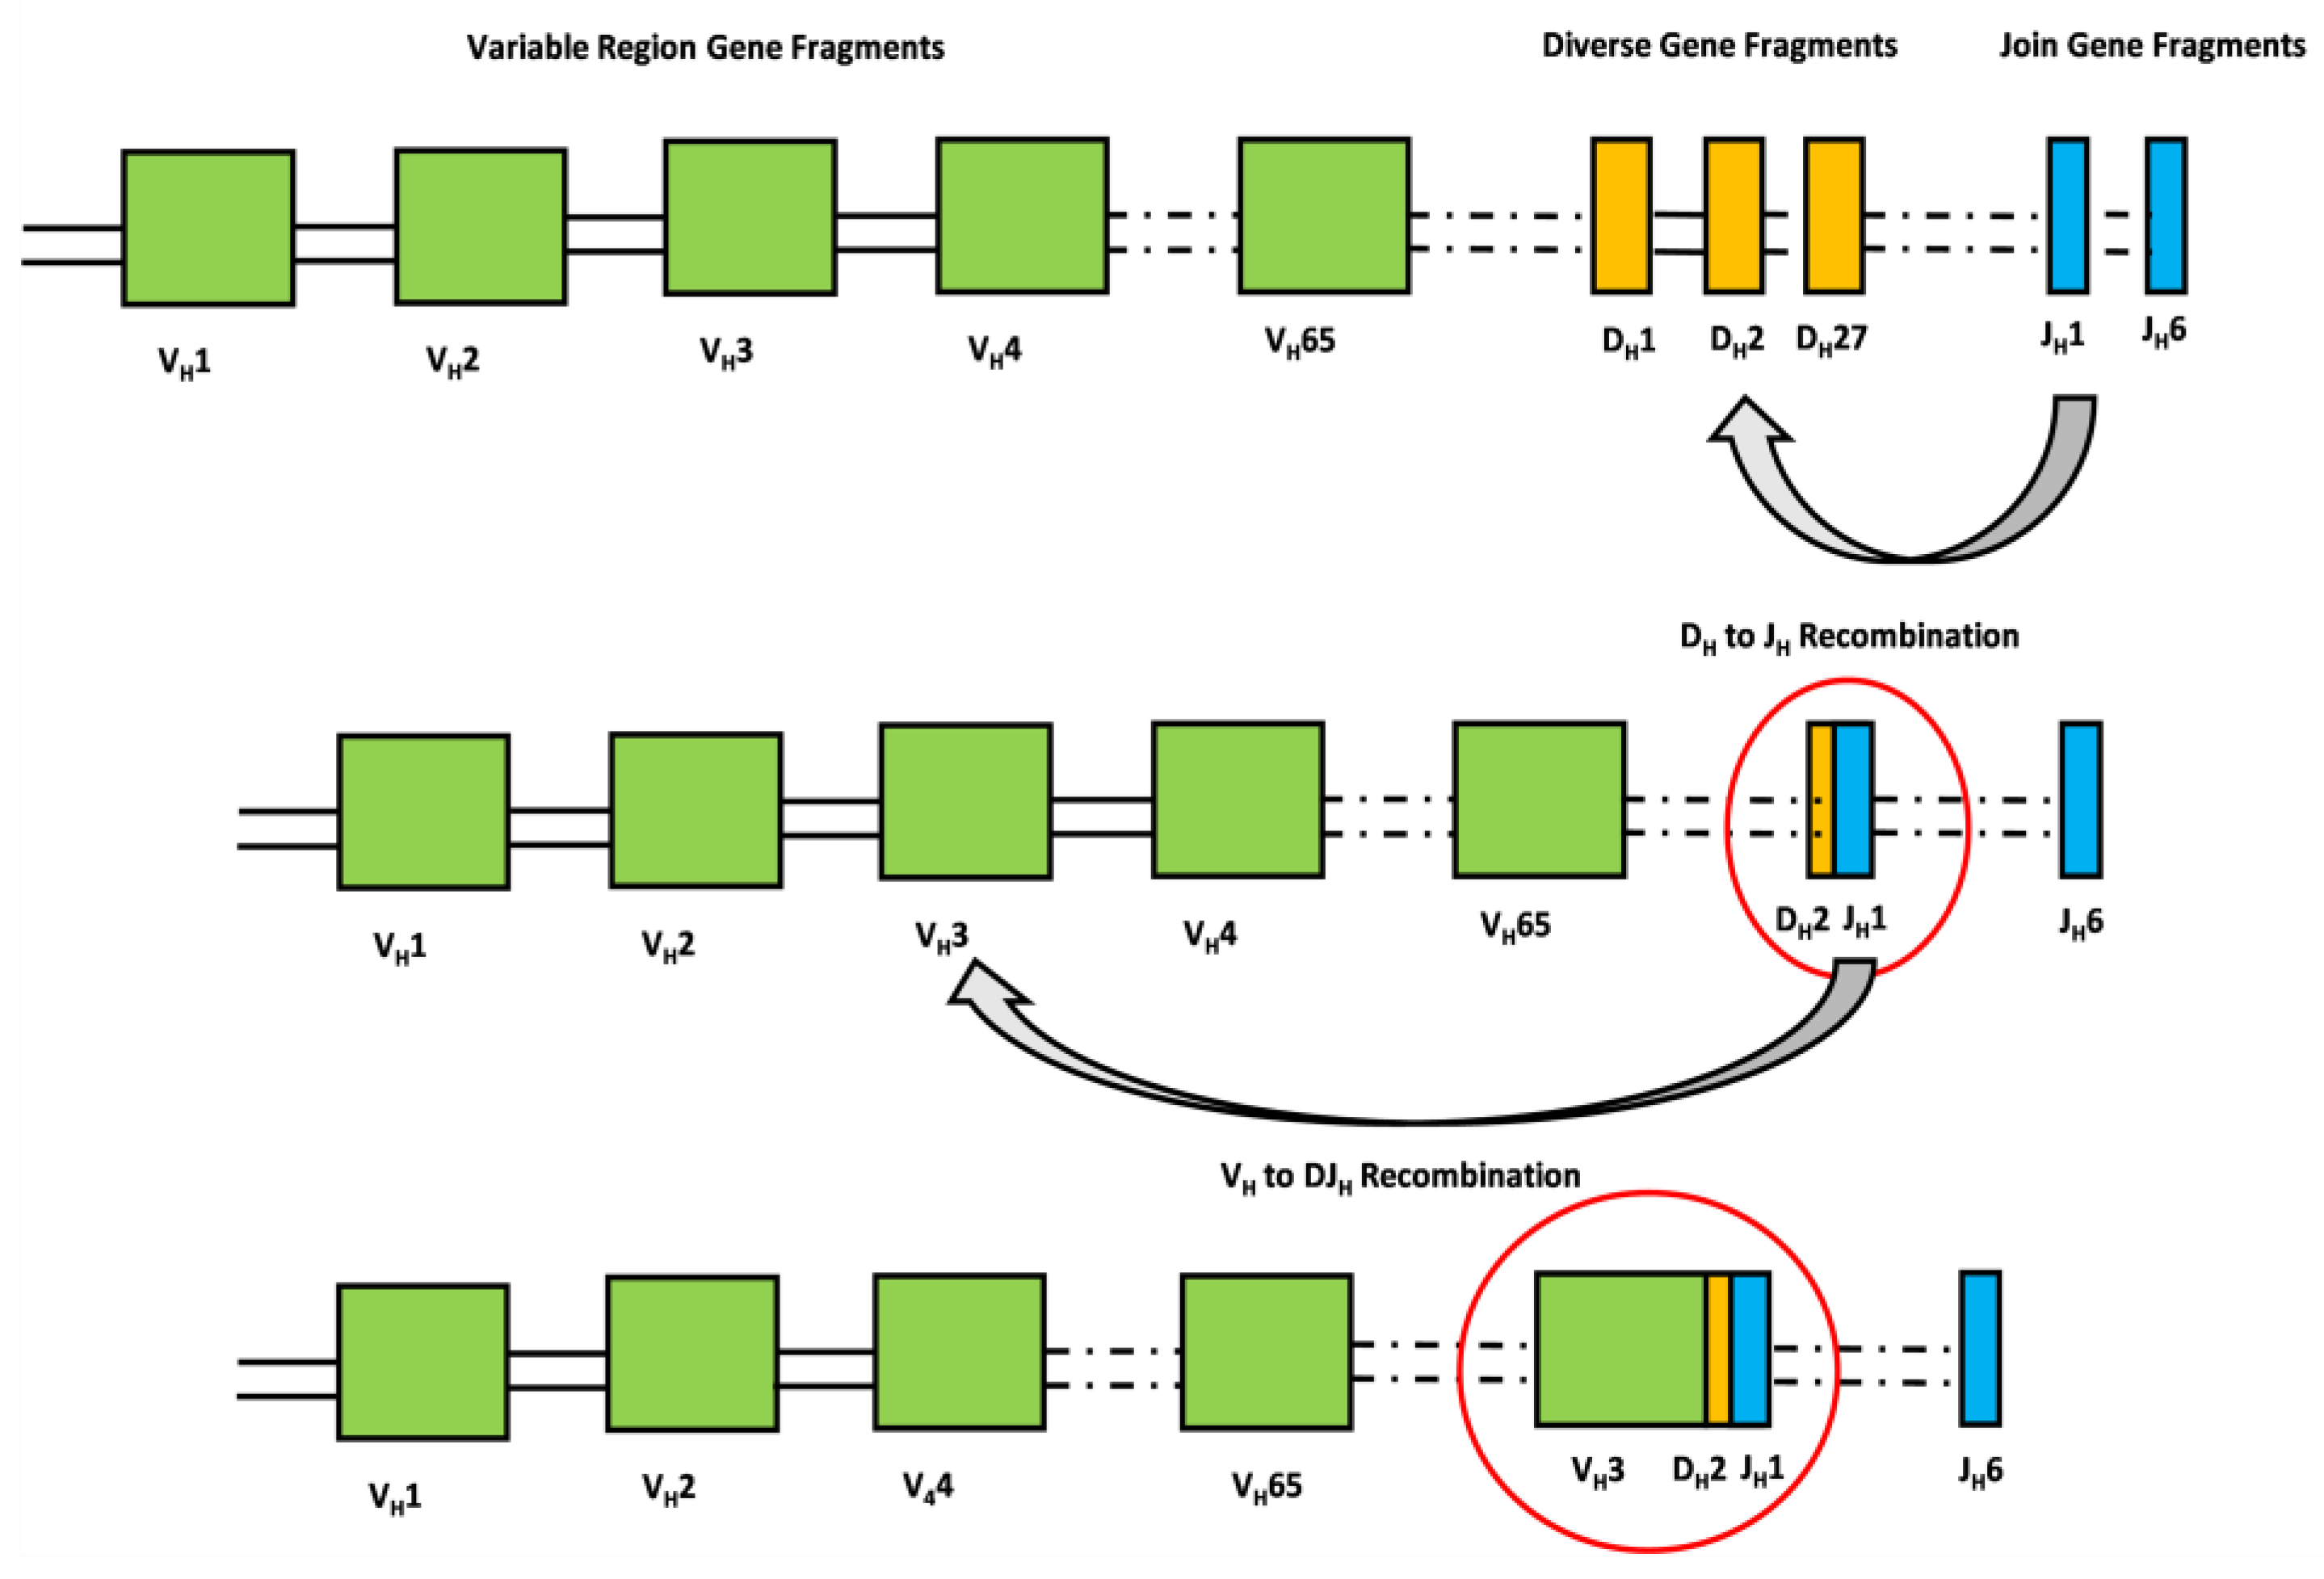
:1. Introduction
2. Materials and Methods
2.1. Samples
2.2. Preparation of Single-Cell Suspensions
2.3. Droplet-Based Single-Cell Sequencing
2.4. Single-Cell RNA Sequencing
2.5. Single-Cell V(D)J Sequencing and Data Processing
3. Results
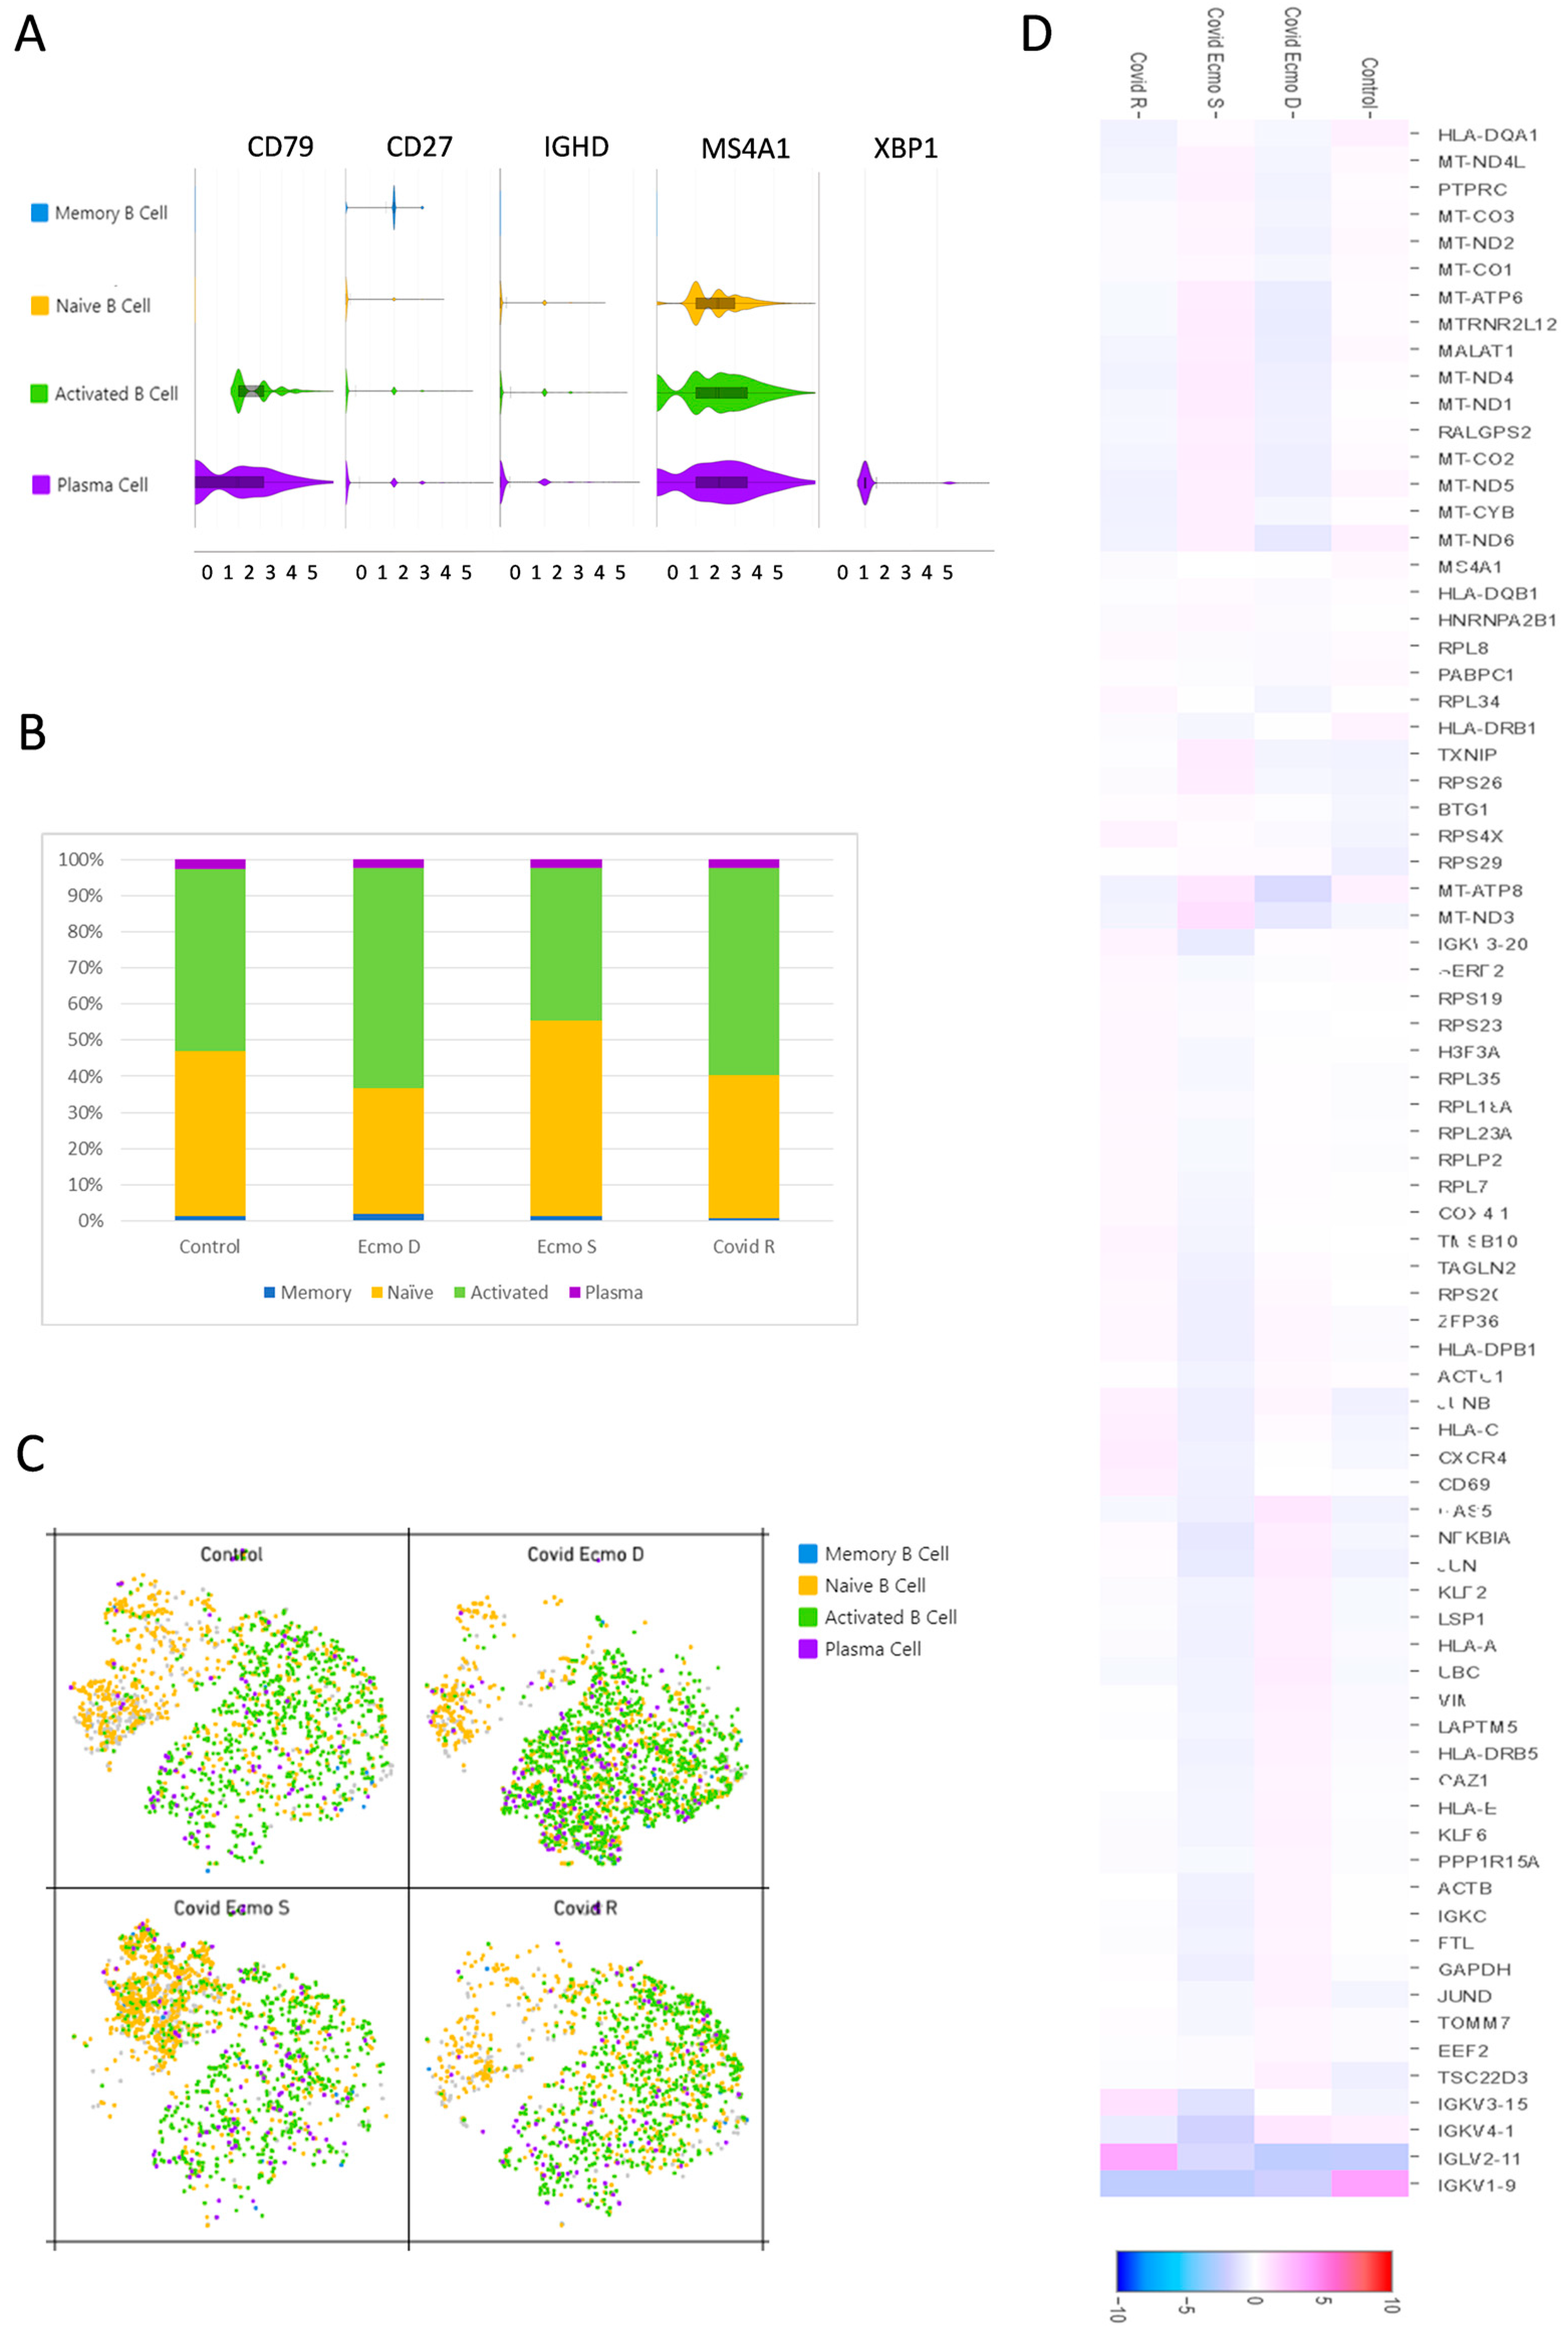
3.1. Study Design and Profiling of B Cells
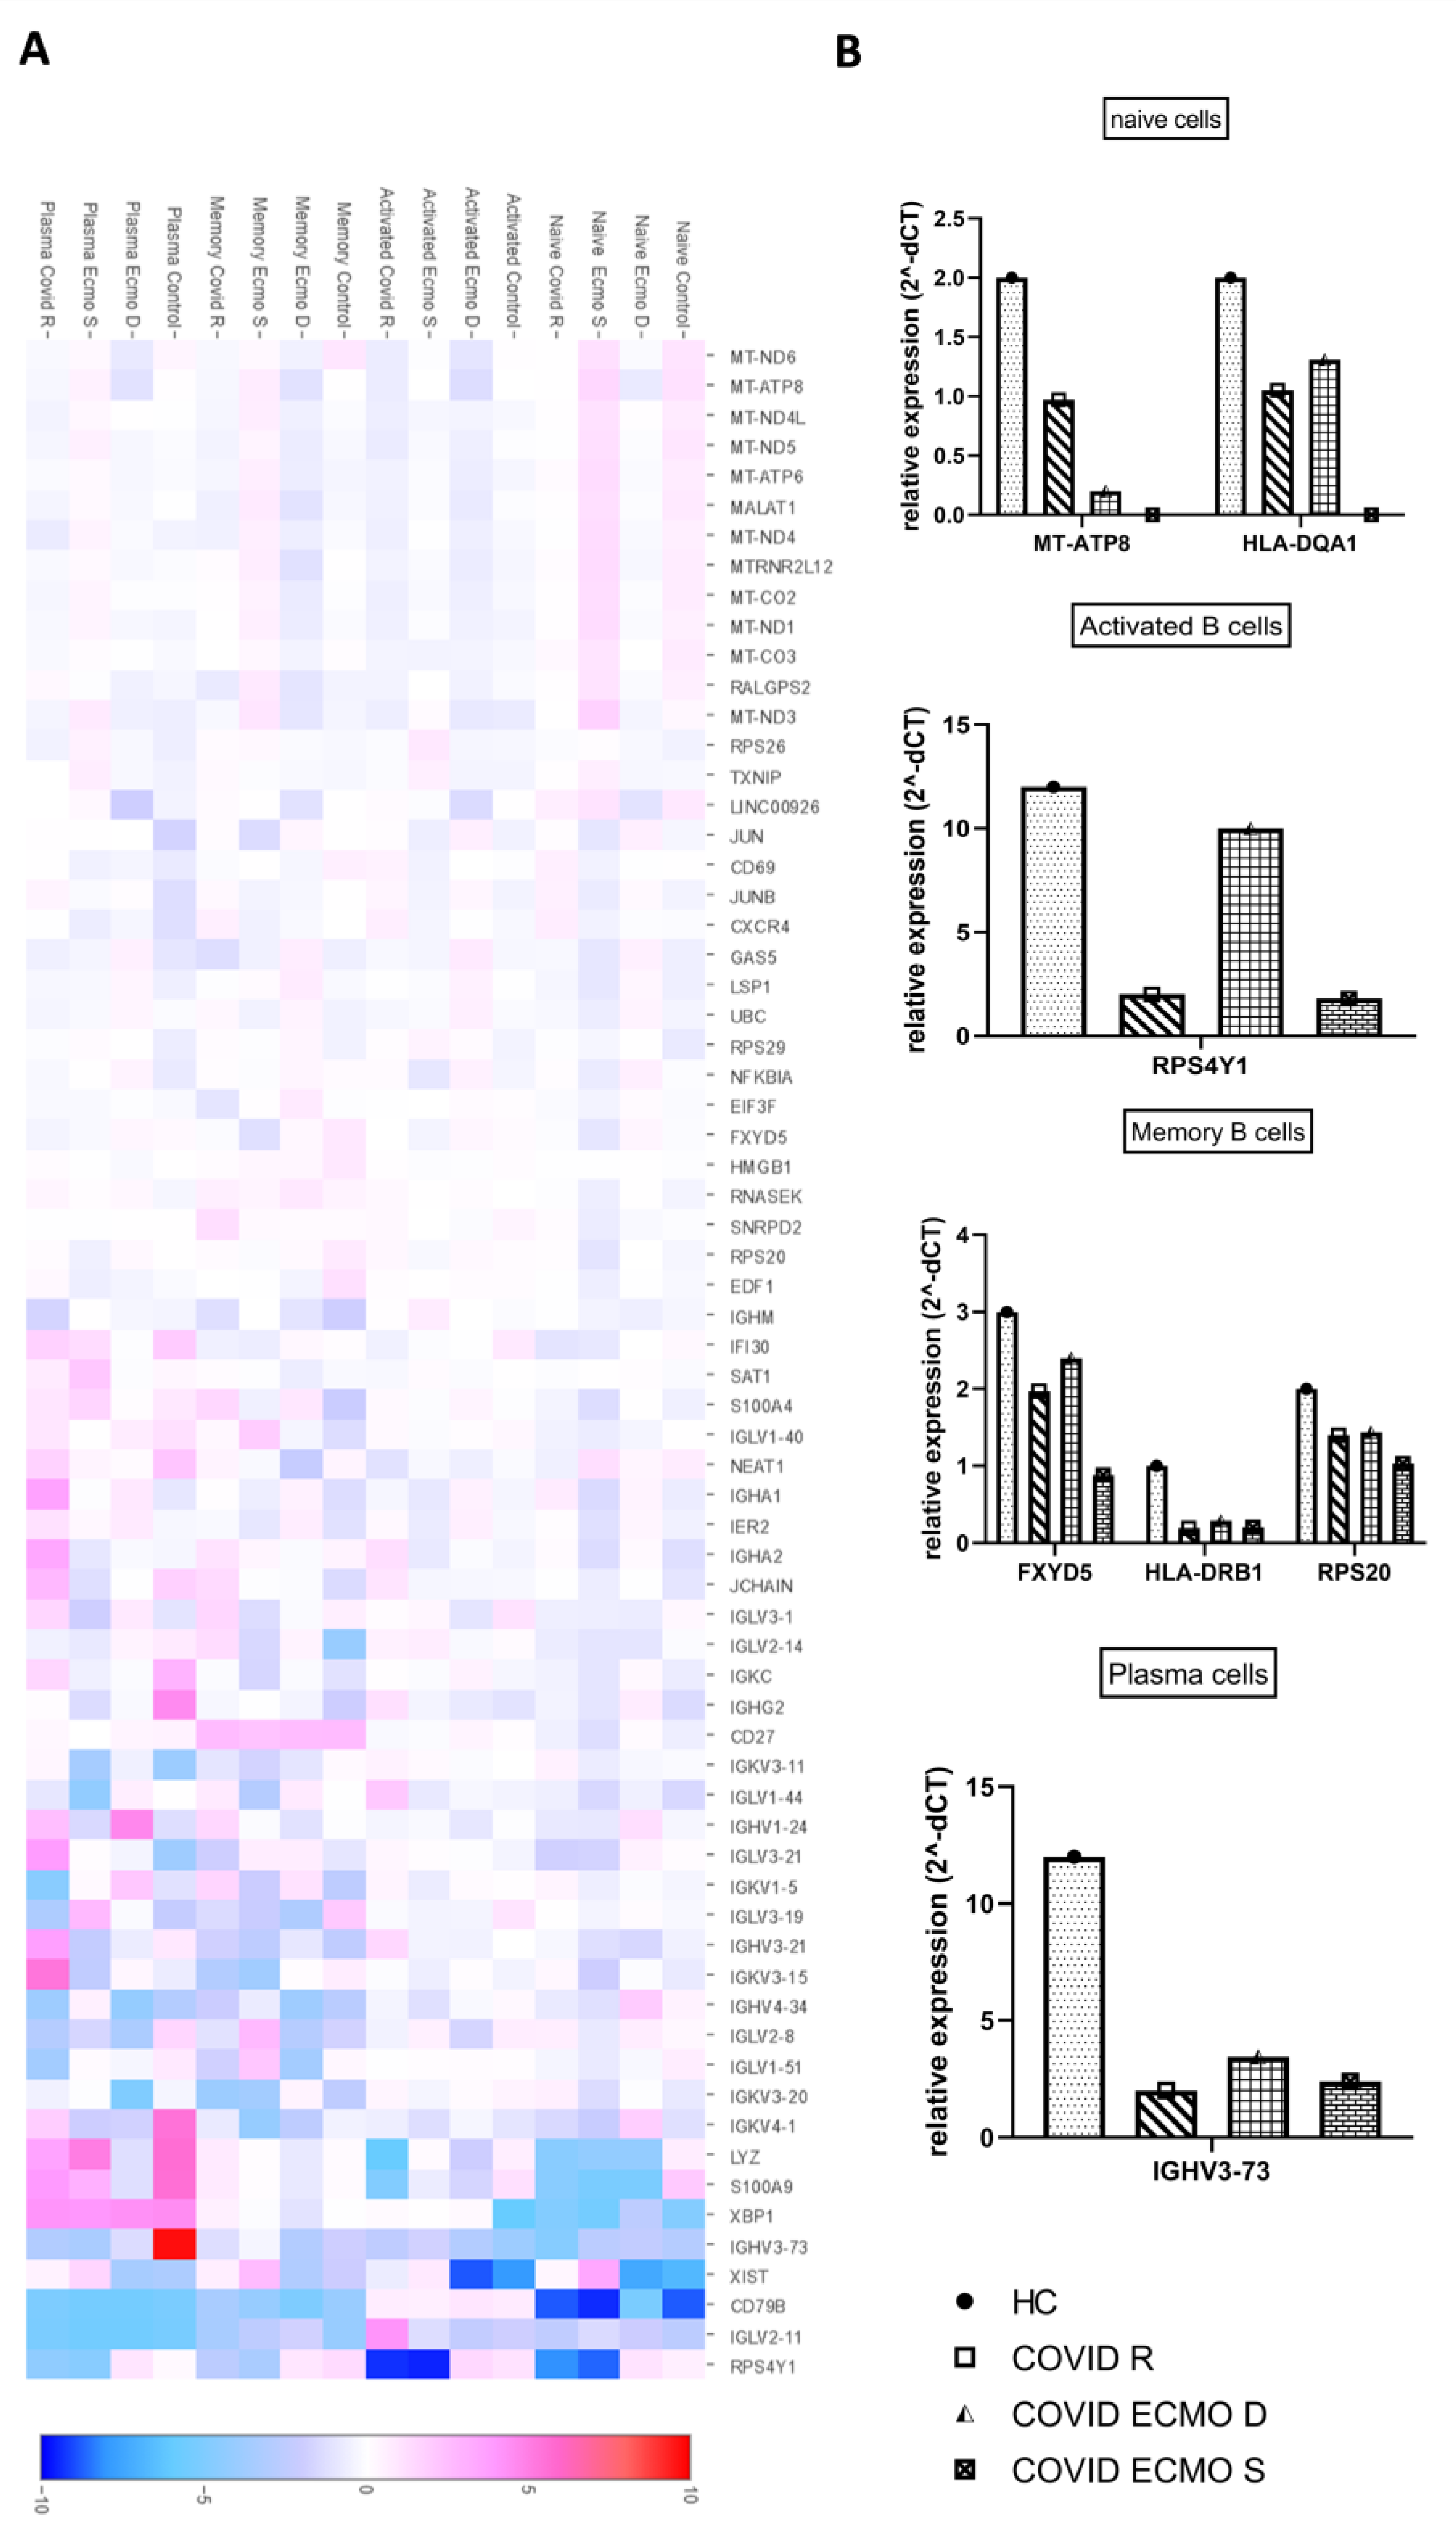
3.2. Features of B Cell Subsets
3.3. Transcriptional Signatures of Different B Cell Subpopulations of COVID-19 Patients
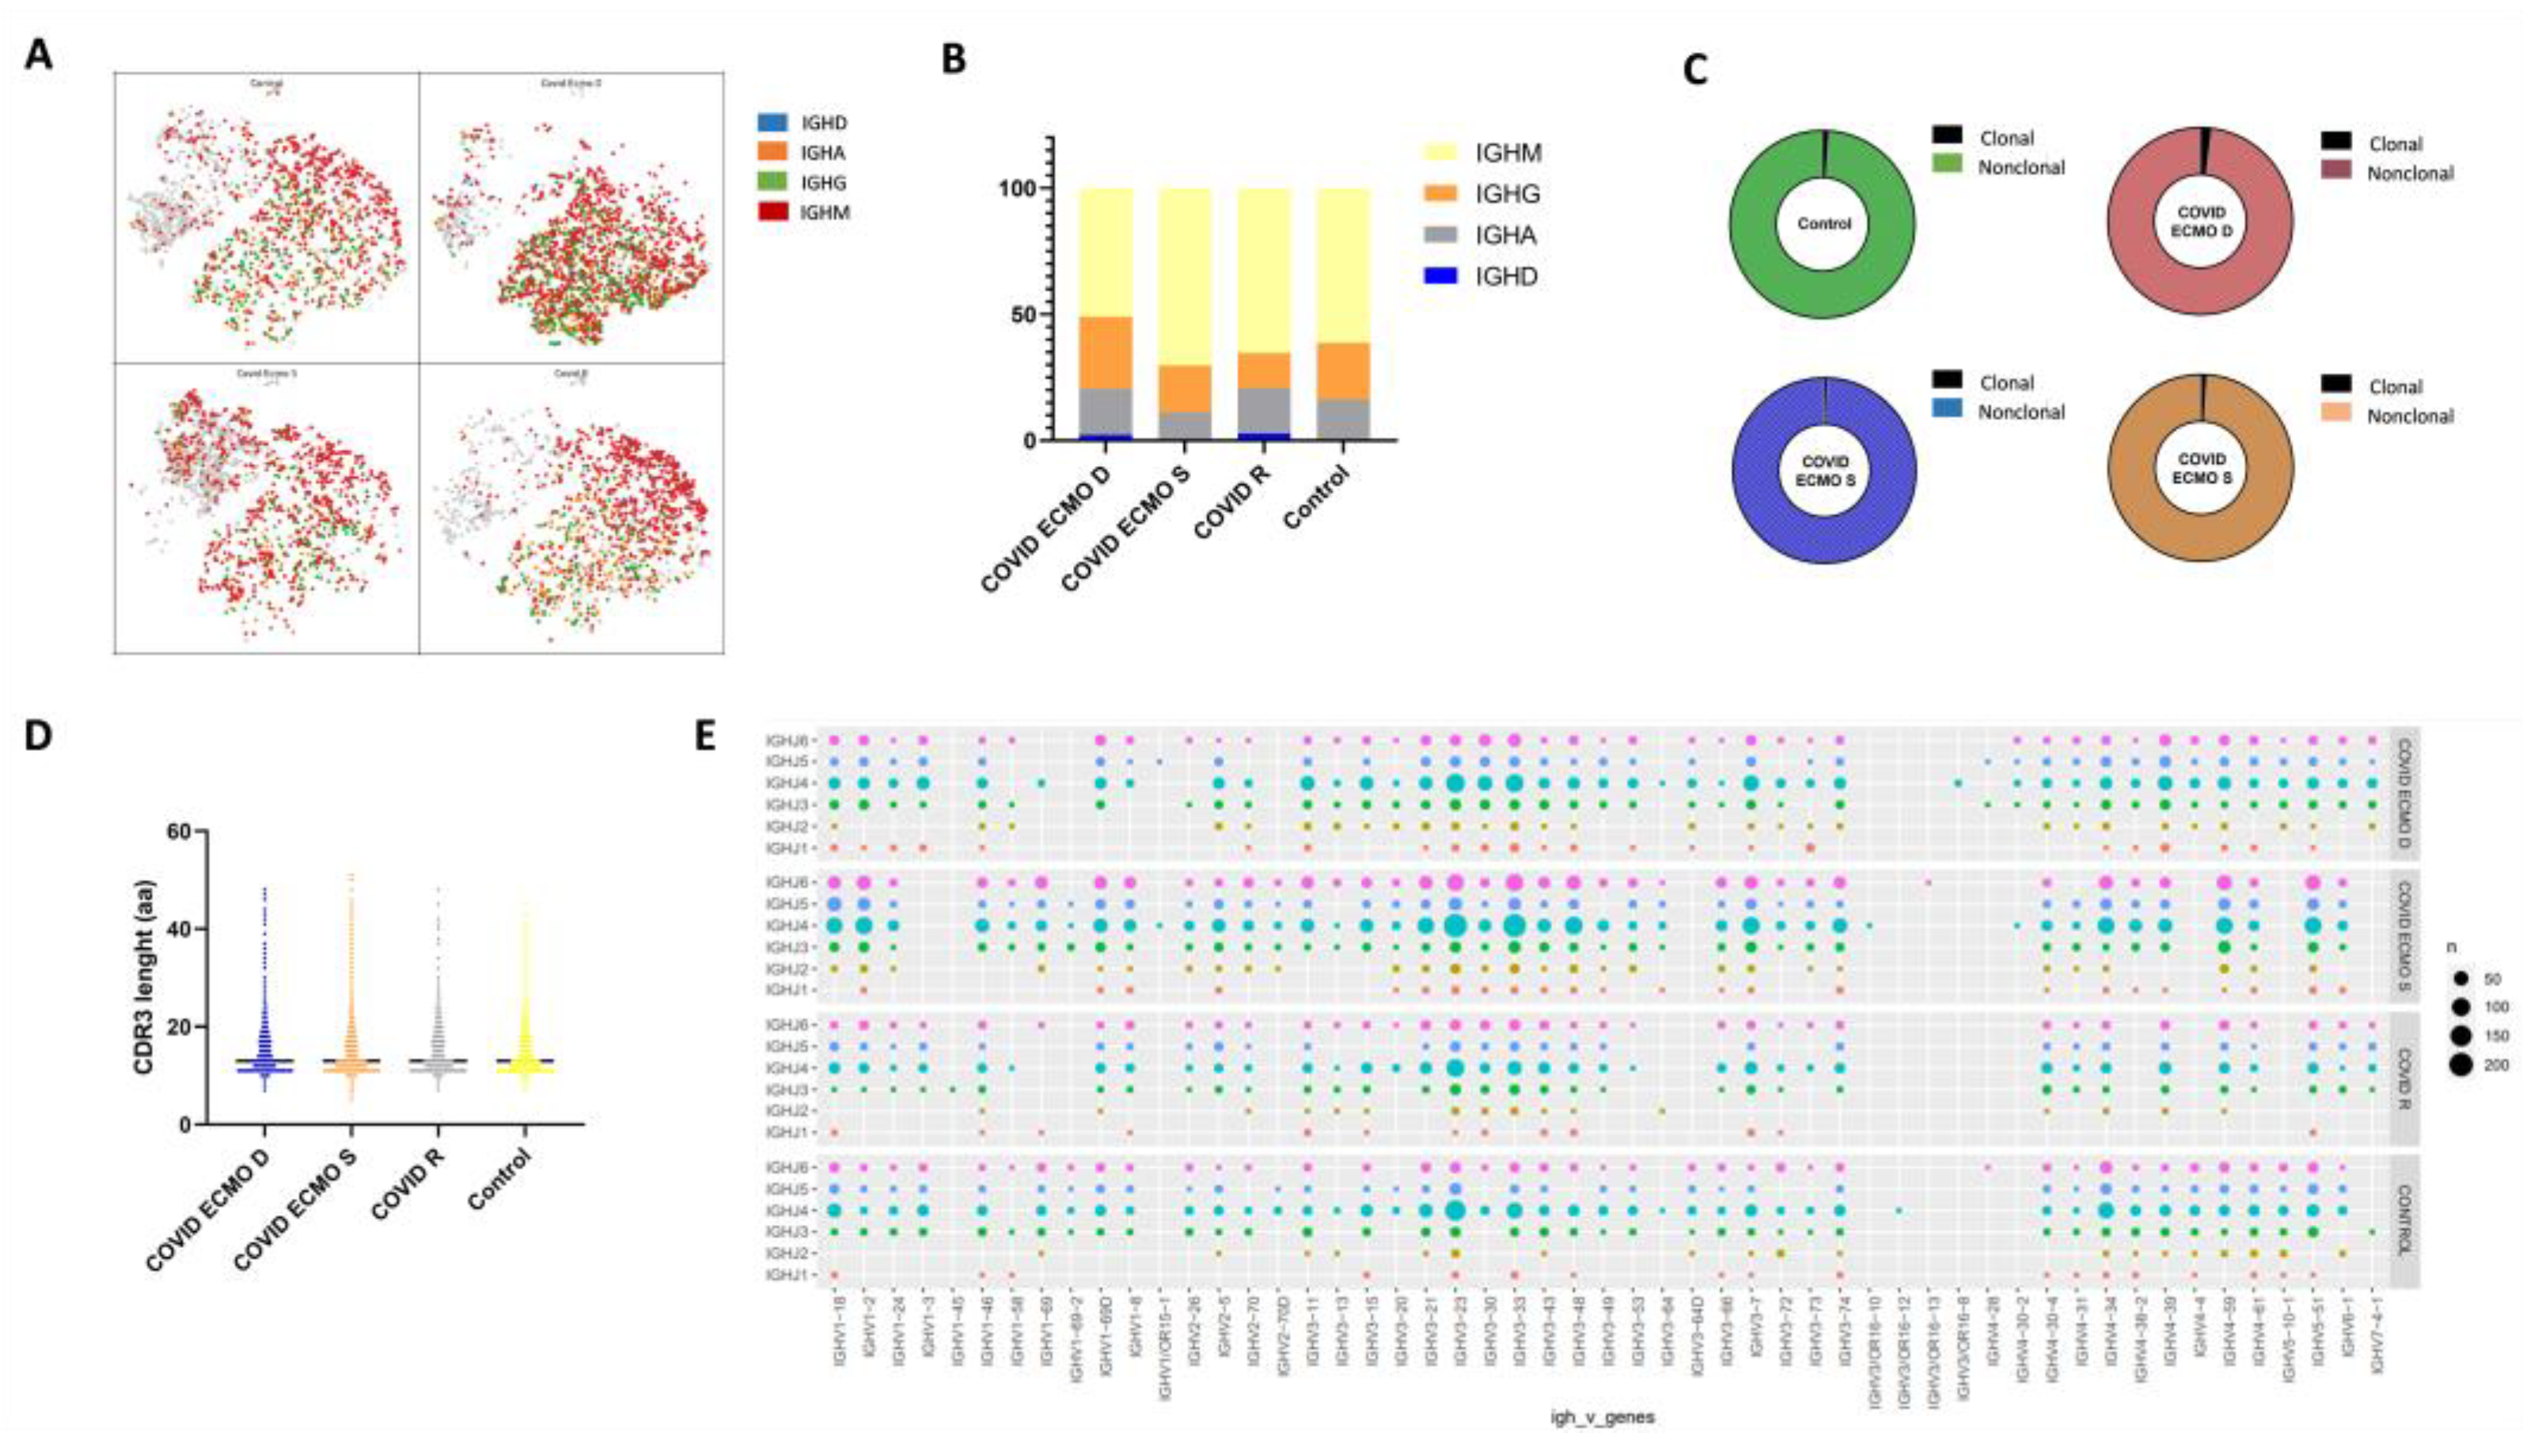
3.4. IgH Class Switching of B Cells and CDR3 Length and Specific Rearrangements of V(D)J Genes
4. Discussion
5. Conclusions
Supplementary Materials
Author Contributions
Funding
Institutional Review Board Statement
Informed Consent Statement
Data Availability Statement
Acknowledgments
Conflicts of Interest
References
- Tsai, P.-H.; Lai, W.-Y.; Lin, Y.-Y.; Luo, Y.-H.; Chen, H.-K.; Chen, Y.-M.; Lai, Y.-C.; Kuo, L.-C.; Chen, S.-D.; Chang, K.-J.; et al. Clinical manifestation and disease progression in COVID-19 infection. J. Chin. Med. Assoc. 2021, 84, 3–8. [Google Scholar] [CrossRef] [PubMed]
- Martucci, G.; Słomka, A.; Lebowitz, S.E.; Raffa, G.M.; Malvindi, P.G.; Coco, V.L.; Swol, J.; Żekanowska, E.; Lorusso, R.; Wierzba, W.; et al. COVID-19 and Extracorporeal Membrane Oxygenation. Adv. Exp. Med. Biol. 2021, 1353, 173–195. [Google Scholar]
- Guidelines Review Committee. Clinical Management of COVID-19: Living Guideline. In WHO Guidelines; Guidelines Review Committee: Geneva, Switzerland, 2022. [Google Scholar]
- Gabelloni, M.; Faggioni, L.; Cioni, D.; Mendola, V.; Falaschi, Z.; Coppola, S.; Corradi, F.; Isirdi, A.; Brandi, N.; Coppola, F.; et al. Extracorporeal membrane oxygenation (ECMO) in COVID-19 patients: A pocket guide for radiologists. Radiol. Med. 2022, 127, 369–382. [Google Scholar] [PubMed]
- Barbaro, R.P.; MacLaren, G.; Boonstra, P.S.; Iwashyna, T.J.; Slutsky, A.S.; Fan, E.; Bartlett, R.H.; Tonna, J.E.; Hyslop, R.; Fanning, J.J.; et al. Extracorporeal membrane oxygenation support in COVID-19: An international cohort study of the Extracorporeal Life Support Organization registry. Lancet 2020, 396, 1071–1078. [Google Scholar] [CrossRef]
- Schmidt, M.; Hajage, D.; Lebreton, G.; Monsel, A.; Voiriot, G.; Levy, D.; Baron, E.; Beurton, A.; Chommeloux, J.; Meng, P.; et al. Extracorporeal membrane oxygenation for severe acute respiratory distress syndrome associated with COVID-19: A retrospective cohort study. Lancet Respir. Med. 2020, 8, 1121–1131. [Google Scholar] [CrossRef] [PubMed]
- Ramanathan, K.; Shekar, K.; Ling, R.R.; Barbaro, R.P.; Wong, S.N.; Tan, C.S.; Rochwerg, B.; Fernando, S.M.; Takeda, S.; MacLaren, G.; et al. Correction to: Extracorporeal membrane oxygenation for COVID-19: A systematic review and meta-analysis. Crit. Care 2021, 25, 375. [Google Scholar] [PubMed]
- Nielsen, S.C.; Yang, F.; Jackson, K.J.; Hoh, R.A.; Röltgen, K.; Jean, G.H.; Stevens, B.A.; Lee, J.Y.; Rustagi, A.; Rogers, A.J.; et al. Human B Cell Clonal Expansion and Convergent Antibody Responses to SARS-CoV-2. Cell Host Microbe 2020, 28, 516–525. [Google Scholar]
- Chen, H.; Zhang, Y.; Ye, A.Y.; Du, Z.; Xu, M.; Lee, C.-S.; Hwang, J.K.; Kyritsis, N.; Ba, Z.; Neuberg, D.; et al. BCR selection and affinity maturation in Peyer’s patch germinal centres. Nature 2020, 582, 421–425. [Google Scholar]
- Roth, D.B. V(D)J Recombination: Mechanism, Errors, and Fidelity. Microbiol. Spectr. 2014, 2, 313–324. [Google Scholar]
- Petrova, V.N.; Muir, L.; McKay, P.F.; Vassiliou, G.S.; Smith, K.G.; Lyons, P.A.; Russell, C.A.; Anderson, C.A.; Kellam, P.; Bashford-Rogers, R.J. Combined Influence of B-Cell Receptor Rearrangement and Somatic Hypermutation on B-Cell Class-Switch Fate in Health and in Chronic Lymphocytic Leukemia. Front. Immunol. 2018, 9, 1784. [Google Scholar] [CrossRef]
- Zheng, G.X.; Terry, J.M.; Belgrader, P.; Ryvkin, P.; Bent, Z.W.; Wilson, R.; Ziraldo, S.B.; Wheeler, T.D.; McDermott, G.P.; Zhu, J.; et al. Massively parallel digital transcriptional profiling of single cells. Nat. Commun. 2017, 8, 14049. [Google Scholar] [CrossRef]
- Bulati, M.; Caruso, C.; Colonna-Romano, G. From lymphopoiesis to plasma cells differentiation, the age-related modifications of B cell compartment are influenced by “inflamm-ageing”. Ageing Res. Rev. 2017, 36, 125–136. [Google Scholar] [PubMed]
- Tjiam, M.C.; Fernandez, S.; French, M.A. Characterising the Phenotypic Diversity of Antigen-Specific Memory B Cells before and after Vaccination. Front. Immunol. 2021, 12, 738123. [Google Scholar] [PubMed]
- Tang, T.F.; Chan, Y.T.; Cheong, H.C.; Cheok, Y.Y.; Anuar, N.A.; Looi, C.Y.; Gan, G.G.; Wong, W.F. Regulatory network of BLIMP1, IRF4, and XBP1 triad in plasmacytic differentiation and multiple myeloma pathogenesis. Cell. Immunol. 2022, 380, 104594. [Google Scholar] [CrossRef] [PubMed]
- Qi, F.; Cao, Y.; Zhang, S.; Zhang, Z. Single-cell analysis of the adaptive immune response to SARS-CoV-2 infection and vaccination. Front. Immunol. 2022, 13, 964976. [Google Scholar] [PubMed]
- Kadam, U.S.; Lossie, A.C.; Schulz, B.; Irudayaraj, J. Gene Expression Analysis Using Conventional and Imaging Methods. In DNA and RNA Nanobiotechnologies in Medicine: Diagnosis and Treatment of Diseases; Erdmann, V.A., Barciszewski, J., Eds.; Springer: Berlin/Heidelberg, Germany, 2013; pp. 141–162. [Google Scholar]
- Galber, C.; Acosta, M.J.; Minervini, G.; Giorgio, V. The role of mitochondrial ATP synthase in cancer. Biol. Chem. 2020, 401, 1199–1214. [Google Scholar] [CrossRef]
- Galperin, M.; Farenc, C.; Mukhopadhyay, M.; Jayasinghe, D.; Decroos, A.; Benati, D.; Tan, L.L.; Ciacchi, L.; Reid, H.H.; Rossjohn, J.; et al. CD4(+) T cell-mediated HLA class II cross-restriction in HIV controllers. Sci. Immunol. 2018, 3, eaat0687. [Google Scholar] [CrossRef]
- Kwok, W.W.; Tan, V.; Gillette, L.; Littell, C.T.; Soltis, M.A.; LaFond, R.B.; Yang, J.; James, E.A.; DeLong, J.H. Frequency of epitope-specific naive CD4(+) T cells correlates with immunodominance in the human memory repertoire. J. Immunol. 2012, 188, 2537–2544. [Google Scholar] [CrossRef]
- Muehling, L.M.; Mai, D.T.; Kwok, W.W.; Heymann, P.W.; Pomes, A.; Woodfolk, J.A. Circulating Memory CD4+ T Cells Target Conserved Epitopes of Rhinovirus Capsid Proteins and Respond Rapidly to Experimental Infection in Humans. J. Immunol. 2016, 197, 3214–3224. [Google Scholar]
- Topalian, S.L.; Gonzales, M.I.; Parkhurst, M.; Li, Y.F.; Southwood, S.; Sette, A.; Rosenberg, S.A.; Robbins, P.F. Melanoma-specific CD4+ T cells recognize nonmutated HLA-DR-restricted tyrosinase epitopes. J. Exp. Med. 1996, 183, 1965–1971. [Google Scholar] [CrossRef]
- Shams, H.; Klucar, P.; Weis, S.E.; Lalvani, A.; Moonan, P.K.; Safi, H.; Wizel, B.; Ewer, K.; Nepom, G.T.; Lewinsohn, D.M.; et al. Characterization of a Mycobacterium tuberculosis peptide that is recognized by human CD4+ and CD8+ T cells in the context of multiple HLA alleles. J. Immunol. 2004, 173, 1966–1977. [Google Scholar]
- Abelin, J.G.; Harjanto, D.; Malloy, M.; Suri, P.; Colson, T.; Goulding, S.P.; Creech, A.L.; Serrano, L.R.; Nasir, G.; Nasrullah, Y.; et al. Defining HLA-II Ligand Processing and Binding Rules with Mass Spectrometry Enhances Cancer Epitope Prediction. Immunity 2019, 51, 766–779. [Google Scholar] [CrossRef] [PubMed]
- Schulze zur Wiesch, J.; Lauer, G.M.; Day, C.L.; Kim, A.Y.; Ouchi, K.; Duncan, J.E.; Wurcel, A.G.; Timm, J.; Jones, A.M.; Mothe, B.; et al. Broad repertoire of the CD4+ Th cell response in spontaneously controlled hepatitis C virus infection includes dominant and highly promiscuous epitopes. J. Immunol. 2005, 175, 3603–3613. [Google Scholar] [PubMed]
- Yong, W.H.; Shabihkhani, M.; Telesca, D.; Yang, S.; Tso, J.L.; Menjivar, J.C.; Wei, B.; Lucey, G.M.; Mareninov, S.; Chen, Z.; et al. Ribosomal Proteins RPS11 and RPS20, Two Stress-Response Markers of Glioblastoma Stem Cells, Are Novel Predictors of Poor Prognosis in Glioblastoma Patients. PLoS ONE 2015, 10, e0141334. [Google Scholar] [CrossRef] [PubMed]
- Ma, J.; Bai, H.; Gong, T.; Mao, W.; Nie, Y.; Zhang, X.; Da, Y.; Wang, X.; Qin, H.; Zeng, Q.; et al. Novel skewed usage of B-cell receptors in COVID-19 patients with various clinical presentations. Immunol. Lett. 2022, 249, 23–32. [Google Scholar] [CrossRef]
- Liu, H.; Kaku, C.I.; Song, G.; Yuan, M.; Andrabi, R.; Burton, D.R.; Walker, L.M.; Wilson, I.A. Human antibodies to SARS-CoV-2 with a recurring YYDRxG motif retain binding and neutralization to variants of concern including Omicron. Commun. Biol. 2022, 5, 766. [Google Scholar]
- He, B.; Liu, S.; Xu, M.; Hu, Y.; Lv, K.; Wang, Y.; Ma, Y.; Zhai, Y.; Yue, X.; Liu, L.; et al. Comparative global B cell receptor repertoire difference induced by SARS-CoV-2 infection or vaccination via single-cell V(D)J sequencing. Emerg. Microbes Infect. 2022, 11, 2007–2020. [Google Scholar] [PubMed]


| ID Patients | Age | Gender | Comorbidities | Severity | Clinical Profile | Co-Infections | Treatments | Hospitalization (Days) |
|---|---|---|---|---|---|---|---|---|
| COVID ECMO S | 74 | M | Vasculopathy and Diabetes | C | ARDS | - | Dexamethasone | 30 total (10 ECMO) |
| COVID ECMO D | 67 | M | HTN | C | ARDS and Sepsis | MDR Xanthomonas (VAE), MDR Acinetobacter (UTI), C.albicans (BSI) | CPAP and Dexamethasone | 40 total (12 NIV + 7 ECMO) |
| COVID R | 42 | F | - | A | - | - | - | |
| HEALTHY CTRL | 45 | M | - | - | - | - | - |
Disclaimer/Publisher’s Note: The statements, opinions and data contained in all publications are solely those of the individual author(s) and contributor(s) and not of MDPI and/or the editor(s). MDPI and/or the editor(s) disclaim responsibility for any injury to people or property resulting from any ideas, methods, instructions or products referred to in the content. |
© 2023 by the authors. Licensee MDPI, Basel, Switzerland. This article is an open access article distributed under the terms and conditions of the Creative Commons Attribution (CC BY) license (https://creativecommons.org/licenses/by/4.0/).
Share and Cite
Gallo, A.; Cuscino, N.; Carcione, C.; Busà, R.; Conaldi, P.G.; Bulati, M. Proof-of-Concept Analysis of B Cell Receptor Repertoire in COVID-19 Patients Undergoing ECMO by Single-Cell V(D)J and Gene Expression Sequencing. Curr. Issues Mol. Biol. 2023, 45, 1471-1482. https://doi.org/10.3390/cimb45020095
Gallo A, Cuscino N, Carcione C, Busà R, Conaldi PG, Bulati M. Proof-of-Concept Analysis of B Cell Receptor Repertoire in COVID-19 Patients Undergoing ECMO by Single-Cell V(D)J and Gene Expression Sequencing. Current Issues in Molecular Biology. 2023; 45(2):1471-1482. https://doi.org/10.3390/cimb45020095
Chicago/Turabian StyleGallo, Alessia, Nicola Cuscino, Claudia Carcione, Rosalia Busà, Pier Giulio Conaldi, and Matteo Bulati. 2023. "Proof-of-Concept Analysis of B Cell Receptor Repertoire in COVID-19 Patients Undergoing ECMO by Single-Cell V(D)J and Gene Expression Sequencing" Current Issues in Molecular Biology 45, no. 2: 1471-1482. https://doi.org/10.3390/cimb45020095
APA StyleGallo, A., Cuscino, N., Carcione, C., Busà, R., Conaldi, P. G., & Bulati, M. (2023). Proof-of-Concept Analysis of B Cell Receptor Repertoire in COVID-19 Patients Undergoing ECMO by Single-Cell V(D)J and Gene Expression Sequencing. Current Issues in Molecular Biology, 45(2), 1471-1482. https://doi.org/10.3390/cimb45020095