Abstract
Increasing demand pressures on the fibre supply are forcing manufacturers to explore using new species in plywood. Here we investigated aspen and black alder, alone and in combination with birch faces, and with different veneer thicknesses in plywood production. The aim of this study was to evaluate the effect of different veneer thicknesses, lay-up systems, and hardwood veneer combinations on plywood mechanical properties. Impacts on modulus of rupture (MOR), modulus of elasticity (MOE), glue consumption, and density properties were observed. All process parameters were the same as for pure birch plywood. Not surprisingly, birch plywood had the highest MOR and MOE, followed by aspen and black alder. Aspen had the highest glue consumption and birch the lowest, when applied with a spreader roll, but the common practice of using relatively thick 2.6 mm aspen veneers resulted in the lowest glue consumption per mm of product. The effects of wood species and veneer thickness on MOR, density, and glue consumption were analysed for panel thicknesses from 6.5 to 18 mm to guide manufacturers in choosing their species and construction to optimize cost, MOR and stiffness, weight, and glue consumption. In conclusion, birch gave the best strength properties while aspen gave the best price and weight combination.
1. Introduction
Plywood is the second highest volume wood panel product in the world [1]. In Estonia, timber and wood-based products are one of the biggest contributors to the economy, accounting for 10% of gross domestic product (GDP) and 5% of the workforce. In the Baltic and Nordic regions of Europe, silver birch is the most common species in plywood production. About 51% of Estonian territory is covered by forest, of which 29.9% is birch, 4% is aspen and 2.2% is black alder, the species investigated here [2]. The main wood species utilised by plywood manufacturers in Northern Europe are spruce, pine, and birch. These species have been used for many decades due to the availability and high quality of the wood material. However, climate change and efficient utilisation of biomass, e.g., low-quality wood species, will drive the veneer-based product industry to seek out other sources and species. Aspen and black alder are not commonly used in the production of plywood, either as sole-species or mixed-species products. In the past, their relatively lower availability and quality compared to birch made their utilisation not feasible. Moreover, these species have commonly lower density [3], and lower density has been shown to decrease the mechanical properties of wood [4]. However, these species have lower log prices, and especially for aspen, lower density provides the possibility of lower cost and lower weight products.
Utilisation of hardwood species by the veneer-based industry has been described by [5] in an extended literature review. However, in that review, the focus was on North American, Asian, and Australian hardwood species and on laminated veneer lumber (LVL). More recent research has been focused also on aspen and black and grey alder species. Rohumaa et al. [6] showed that these species could be successfully bonded and combined with each other under current plywood manufacturing conditions. Moreover, Kallakas et al. [7] showed that birch, aspen, and alder species could be combined by different lay-up systems in order to manipulate the strength properties of the final product. Previous studies also show that veneers from different wood species have different roughness, even if they are prepared under the same conditions [6]. In order to form a successful bondline, the contact between the surfaces should be sufficient and overcome the roughness [8]. Commonly, in the case of rough veneer, the plywood manufacturers increase the adhesive spread rate and press pressure, but the effectiveness of this technique has not been confirmed [9]. The reason could be related to veneer processing conditions [10,11,12,13], which also affect lathe check formation. Commonly, thicker veneer has deeper lathe checks [13], which affect the adhesive consumption [14] and bonding quality of the plywood [12]. However, previous research on aspen and alder veneers did not evaluate the effect of veneer thickness and adhesive consumption on plywood mechanical properties.
Therefore, the goal of this study was to evaluate the effect of different veneer thicknesses, lay-up systems, and hardwood veneer combinations on plywood mechanical properties.
2. Materials and Methods
2.1. Wood Species and Lay-Up Schemas for Plywood
In this research, veneers from three different wood species were used for plywood production: birch (Betula pendula Roth), black alder (Alnus glutinosa L.), and aspen (Populus tremula L.). The logs were freshly felled in September 2020 from Käru, Rapla County in Estonia by State Forest Management Centre (RMK). Mean stand age was 76 years, and logs had quality class B and C [15]. The log nominal lengths were 3 m, and average diameters were 24 cm (birch), 26 cm (black alder), and 33 cm (aspen). The logs were visually sorted and those with less knots, no crooked body, and no decay were chosen for veneer production.
Birch, black alder, and aspen veneers had nominal thickness of 1.5 mm, and aspen veneers were also made with nominal thickness of 2.6 mm to obtain better surface quality for softer wood species. Plywood lay-up schemes were constructed using standard cross-band construction as either single species (Standard) or as birch face veneers with aspen or black alder in the core (Combi). In total, seven plywood types were prepared, four of which were from only one species and three combinations. Single species plywood was produced to compare its strength with birch plywood, and combination plywood was produced to observe the effect of face veneers on total plywood strength. Lay-up schemes are described in Table 1. Additionally, to observe the effect of plywood thickness on MOR, plywood with five different thicknesses was prepared: 6.5 mm, 9 mm, 12 mm, 15 mm, and 18 mm.

Table 1.
Plywood lay-up schemas (last number of plywood type indicates veneer thickness in mm).
2.2. Veneer and Plywood Manufacturing Process
Logs were cut to peeler block length of 1200–1400 mm and kept totally immersed in a water tank for 24 h at 40 °C. After 1 day of soaking, logs were debarked by hand and larger surface knots removed. Before peeling, the following properties were recorded: temperature and moisture content in the outer face and in the core, diameter, log length, heartwood width, and sapwood width. Then, the logs were peeled at 60 rpm with a Raute peeling lathe (Model 3HV66; Raute Oyj, Lahti, Finland) with knife angle of 21° and compression rate of 10%. In total, 36 blocks were peeled into veneer: 9 aspen, 14 black alder, and 10 birch were peeled to 1.5 mm veneers, and 3 peeler blocks of aspen were peeled at 2.6 mm. Veneers were then sorted for defects and knots and graded visually for face and core use. As in industry, the veneers with large knots were placed in cores, as the core has much less impact on product quality than faces. The veneer mat was first cut by hydraulic guillotine to 450 × 900 mm2 for drying and later, dried veneers were cut to 450 × 450 mm2 for plywood production. The veneers were dried at 170 °C to reach a target moisture content of 4.5 ± 1.5% in a laboratory scale veneer dryer (Raute Oyj, Lahti, Finland), where humidity inside the dryer was 500–600 g/kg.
Since all species have different properties, the drying time for each species and veneer thickness varied. Veneers were stored in Laboratory of Wood Technology, Tallinn University of Technology, Tallinn, Estonia storage room at 25 °C and 20% relative humidity (RH) to maintain target moisture content (4 to 5%).
Phenol formaldehyde (PF) resin (Prefere Resins Finland Oy, Hamina, Finland) with solid content of 49% was used. A glue roller (adhesive roller Black Bros 22-D) was used to apply glue at a target spread rate of 160 g/m2 per glue line. Total applied glue was calculated by weighing the veneers before and after spreading. Panels were hot-pressed at 130 °C for the times given in Table 2. Pressing pressure was 1.4 MPa based on preliminary trials. The number of panels (in total 144) for each combination and thickness is given in Table 3.

Table 2.
Hot-press times for different plywood thicknesses.

Table 3.
Number of plywood panels produced.
2.3. Standards and Methods of Analysis
Specimen dimensions were measured according to European Standard EN325:2012 [16] after conditioning at 20 ± 2 °C and 65 ± 5% RH in the climatic chamber (ILKA KTK800). Thickness was measured according to EN315:2002 [17]. Some samples of aspen plywood with 2.6 mm aspen veneers were over-compressed, and were near, but less than, the lower limit specified by the standard. Density was determined according to EN323:2002 [18]. For each plywood panel six 50 × 50 mm specimens were prepared, except for 12 mm and 15 mm plywoods, where only four samples were prepared because of limited material. The total number of prepared density samples, therefore, was 624. All densities were measured after conditioning of specimens in relative humidity of 65 ± 5% and 20 ± 2 °C to reach constant weight with two successive measurements.
Mechanical properties were evaluated with a three-point bending test according to EN310:2002 [19], using a the 50 kN universal testing machine (Zwick/Roell Z050, ZwickRoell GmbH, Germany). All test specimens were conditioned at 20 ± 2 °C, 65 ± 5% RH for at least 24 h as specified in the standard. Forty-eight specimens for every thickness for every type of plywood were tested to give a total of 1440 test samples. Linear correlations for glue consumption vs. MOR were based on the standard Pearson’s method, where each pure species plywood type was analysed separately, as implemented in the Microsoft Excel data analysis toolkit regression function.
3. Results
3.1. Glue Consumption and Density
Glue was applied to all veneers under the same conditions and with the same machine settings. The lowest glue consumption was 152 g/m2 with birch plywood, and the highest was 196 g/m2 with aspen containing 2.6 mm veneers, as shown in Table 4.

Table 4.
Glue consumption per glue line (last number shows veneer thickness in mm).
Birch, black alder, and combi black alder plywood (which has birch face veneers) had the most similar glue consumption. Aspen 1.5 mm veneer consumed 15.8% more glue than the reference birch, while 2.6 mm aspen veneer consumed 28.3% more. For combi plywood, glue consumption followed the pattern of core veneers, where adhesive was applied.
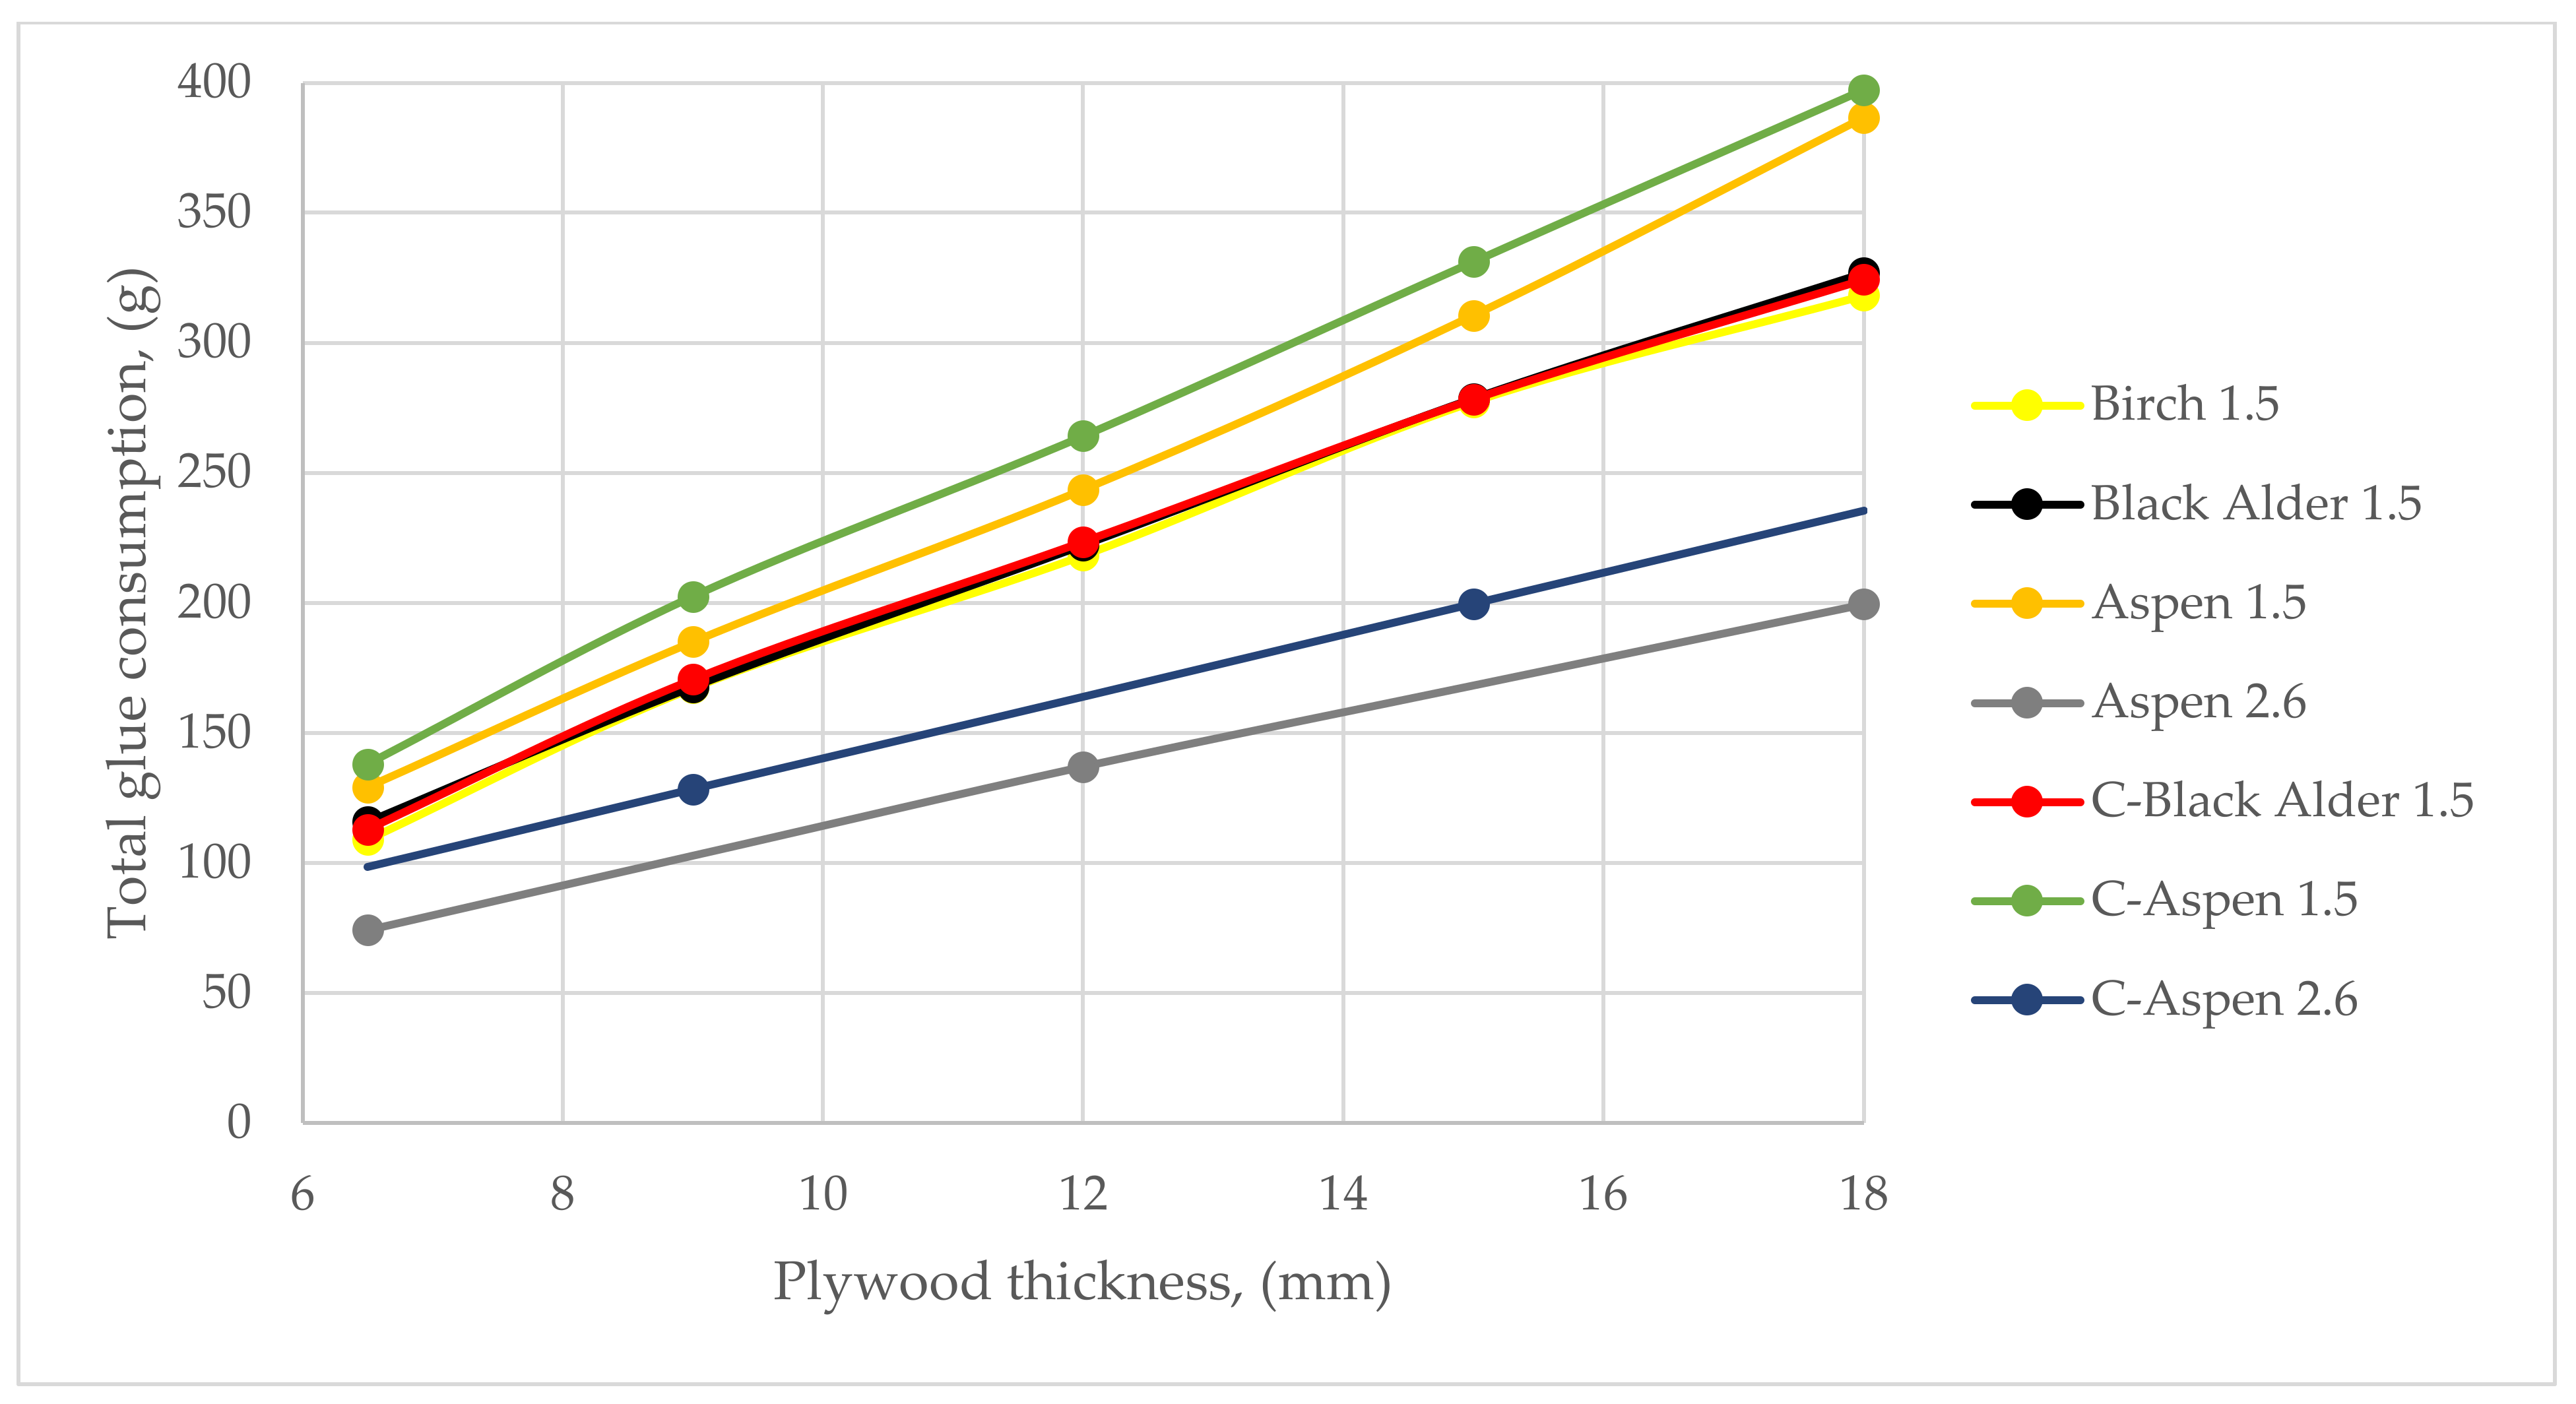
As shown in Figure 1, total glue consumption at a given thickness was highest for combi aspen and aspen 1.5 mm veneer plywood. Black alder, combi alder, and birch plywood were very similar to each other. The lowest glue consumption was with 2.6 mm aspen plywood and 2.6 mm aspen combi plywood, with 34%–40% lower consumption compared to birch and close to 50% less than 1.5 mm veneer aspen or combi-aspen plywood.
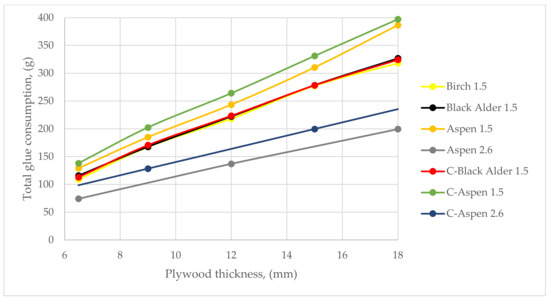
Figure 1.
Total glue consumption per panel vs. plywood thickness for all plywood types. (Last number shows veneer thickness in mm).
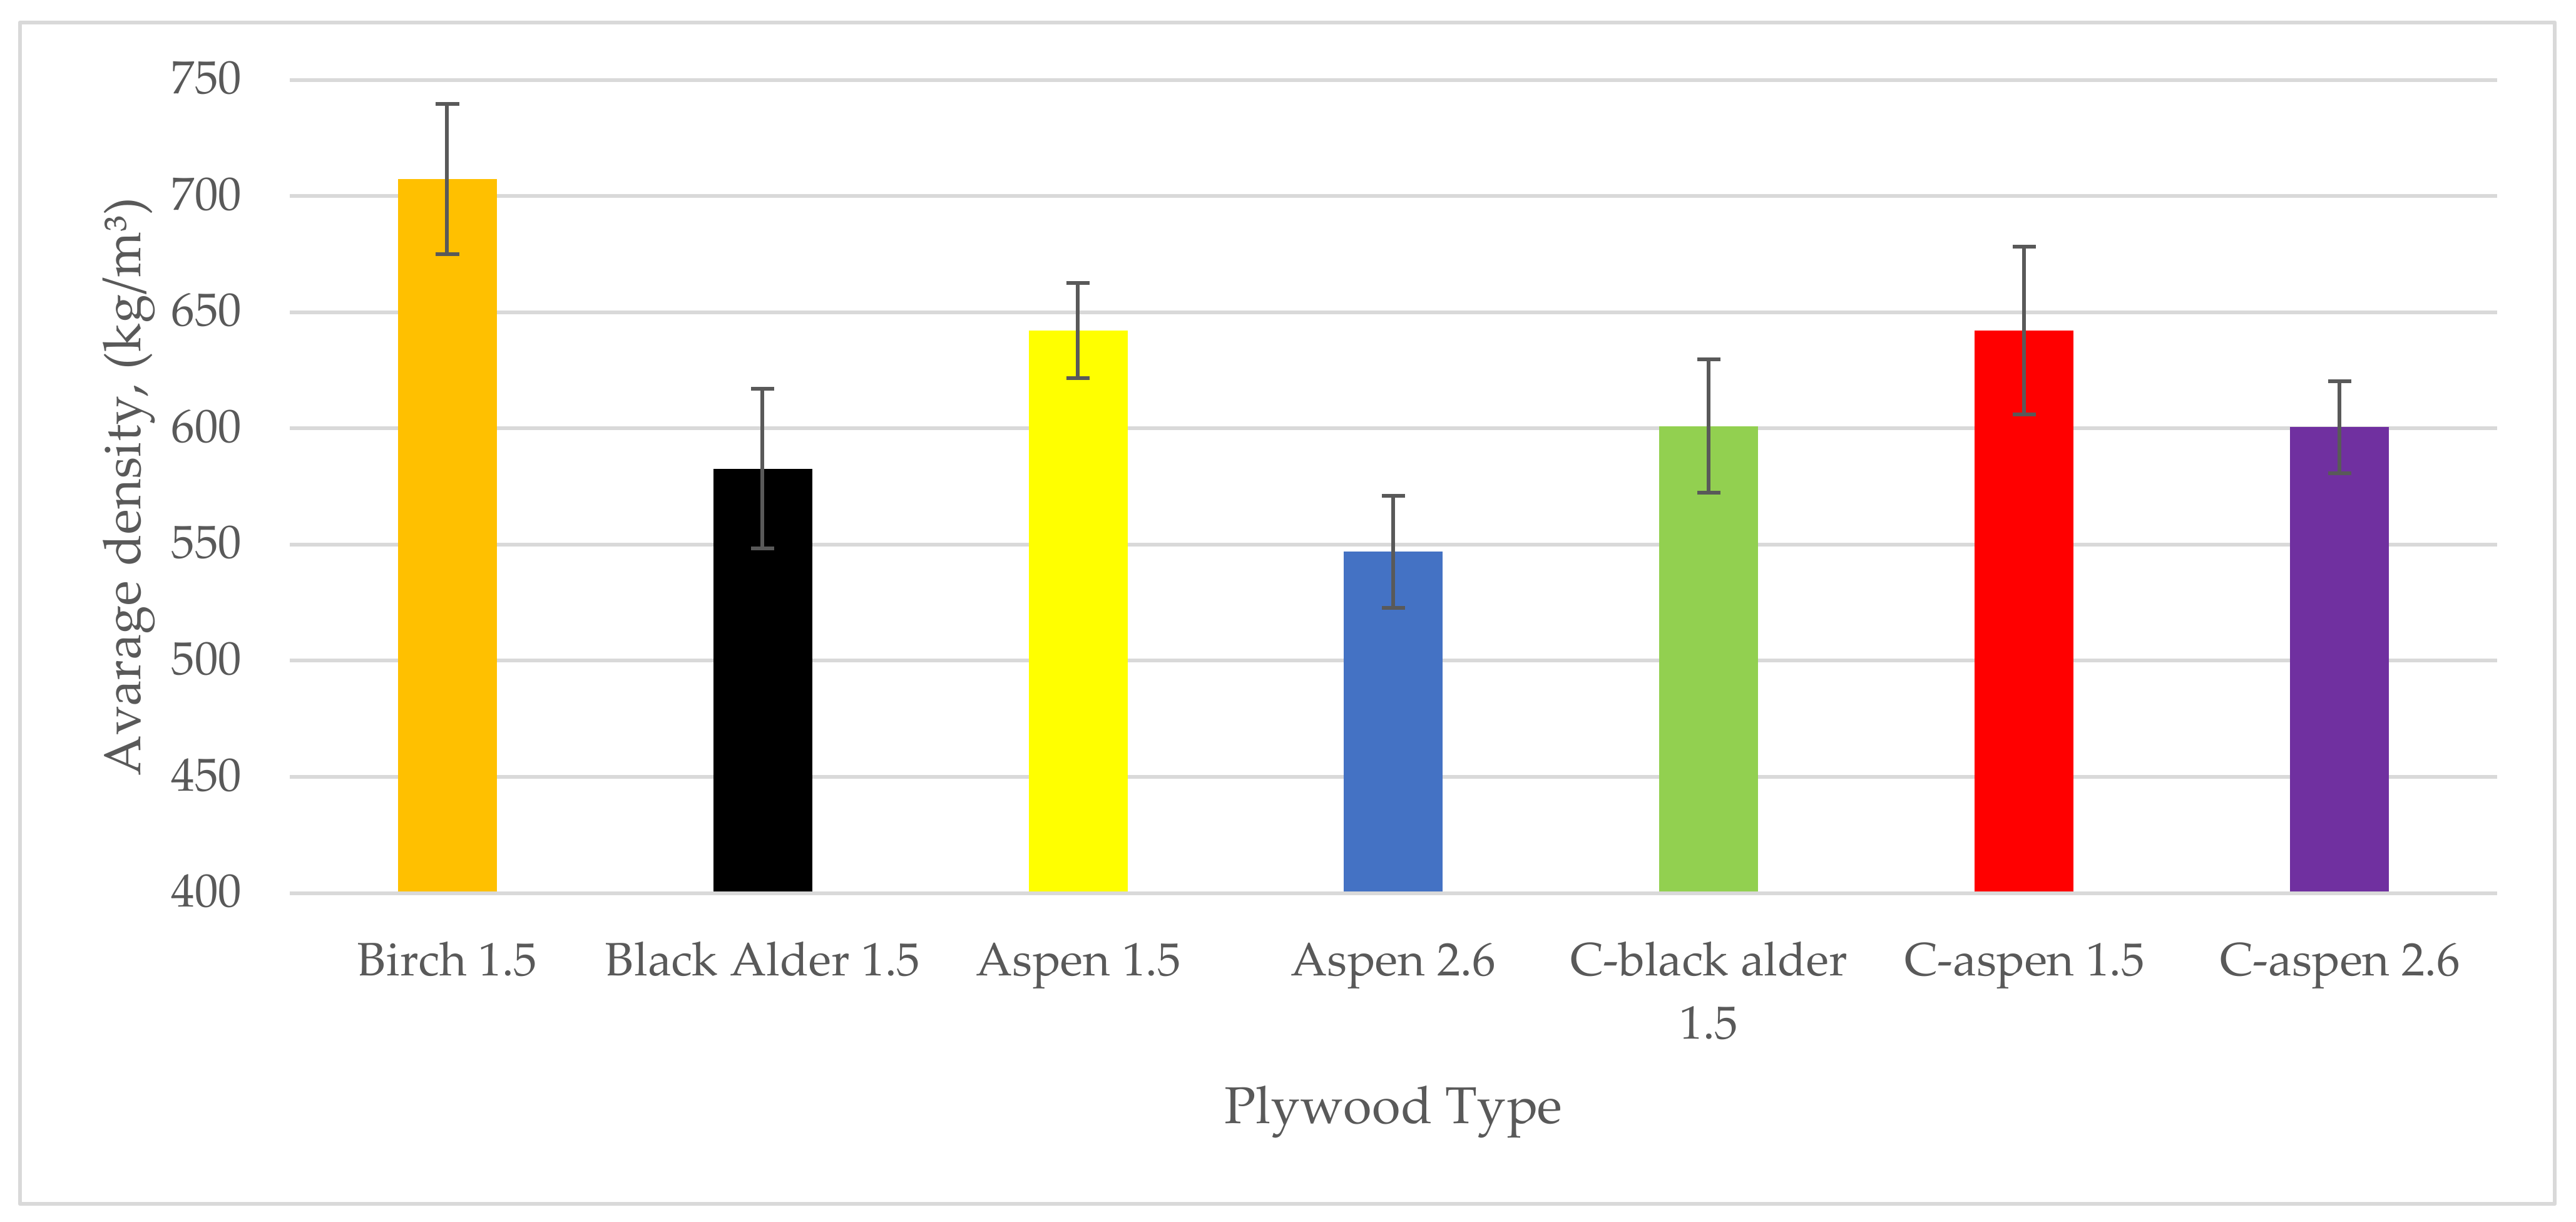
Panel densities are given in Figure 2. Birch plywood had the highest density (707 kg/m3) while black alder plywood had the lowest of those made with 1.5 mm veneers (583 kg/m3). As expected, using birch face veneers with lower density cores increased average panel density. Aspen 2.6 mm veneers produced plywood panels with significantly lower density than those with 1.5 mm veneers, including the lowest density plywood panels in the study, aspen 2.6 mm at 549 kg/m3.
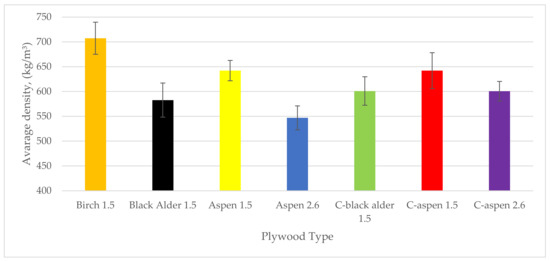
Figure 2.
Average densities according to plywood type (lines on bars show standard deviations).
3.2. Bending Strength (MOR) and Modulus of Elasticity (MOE)
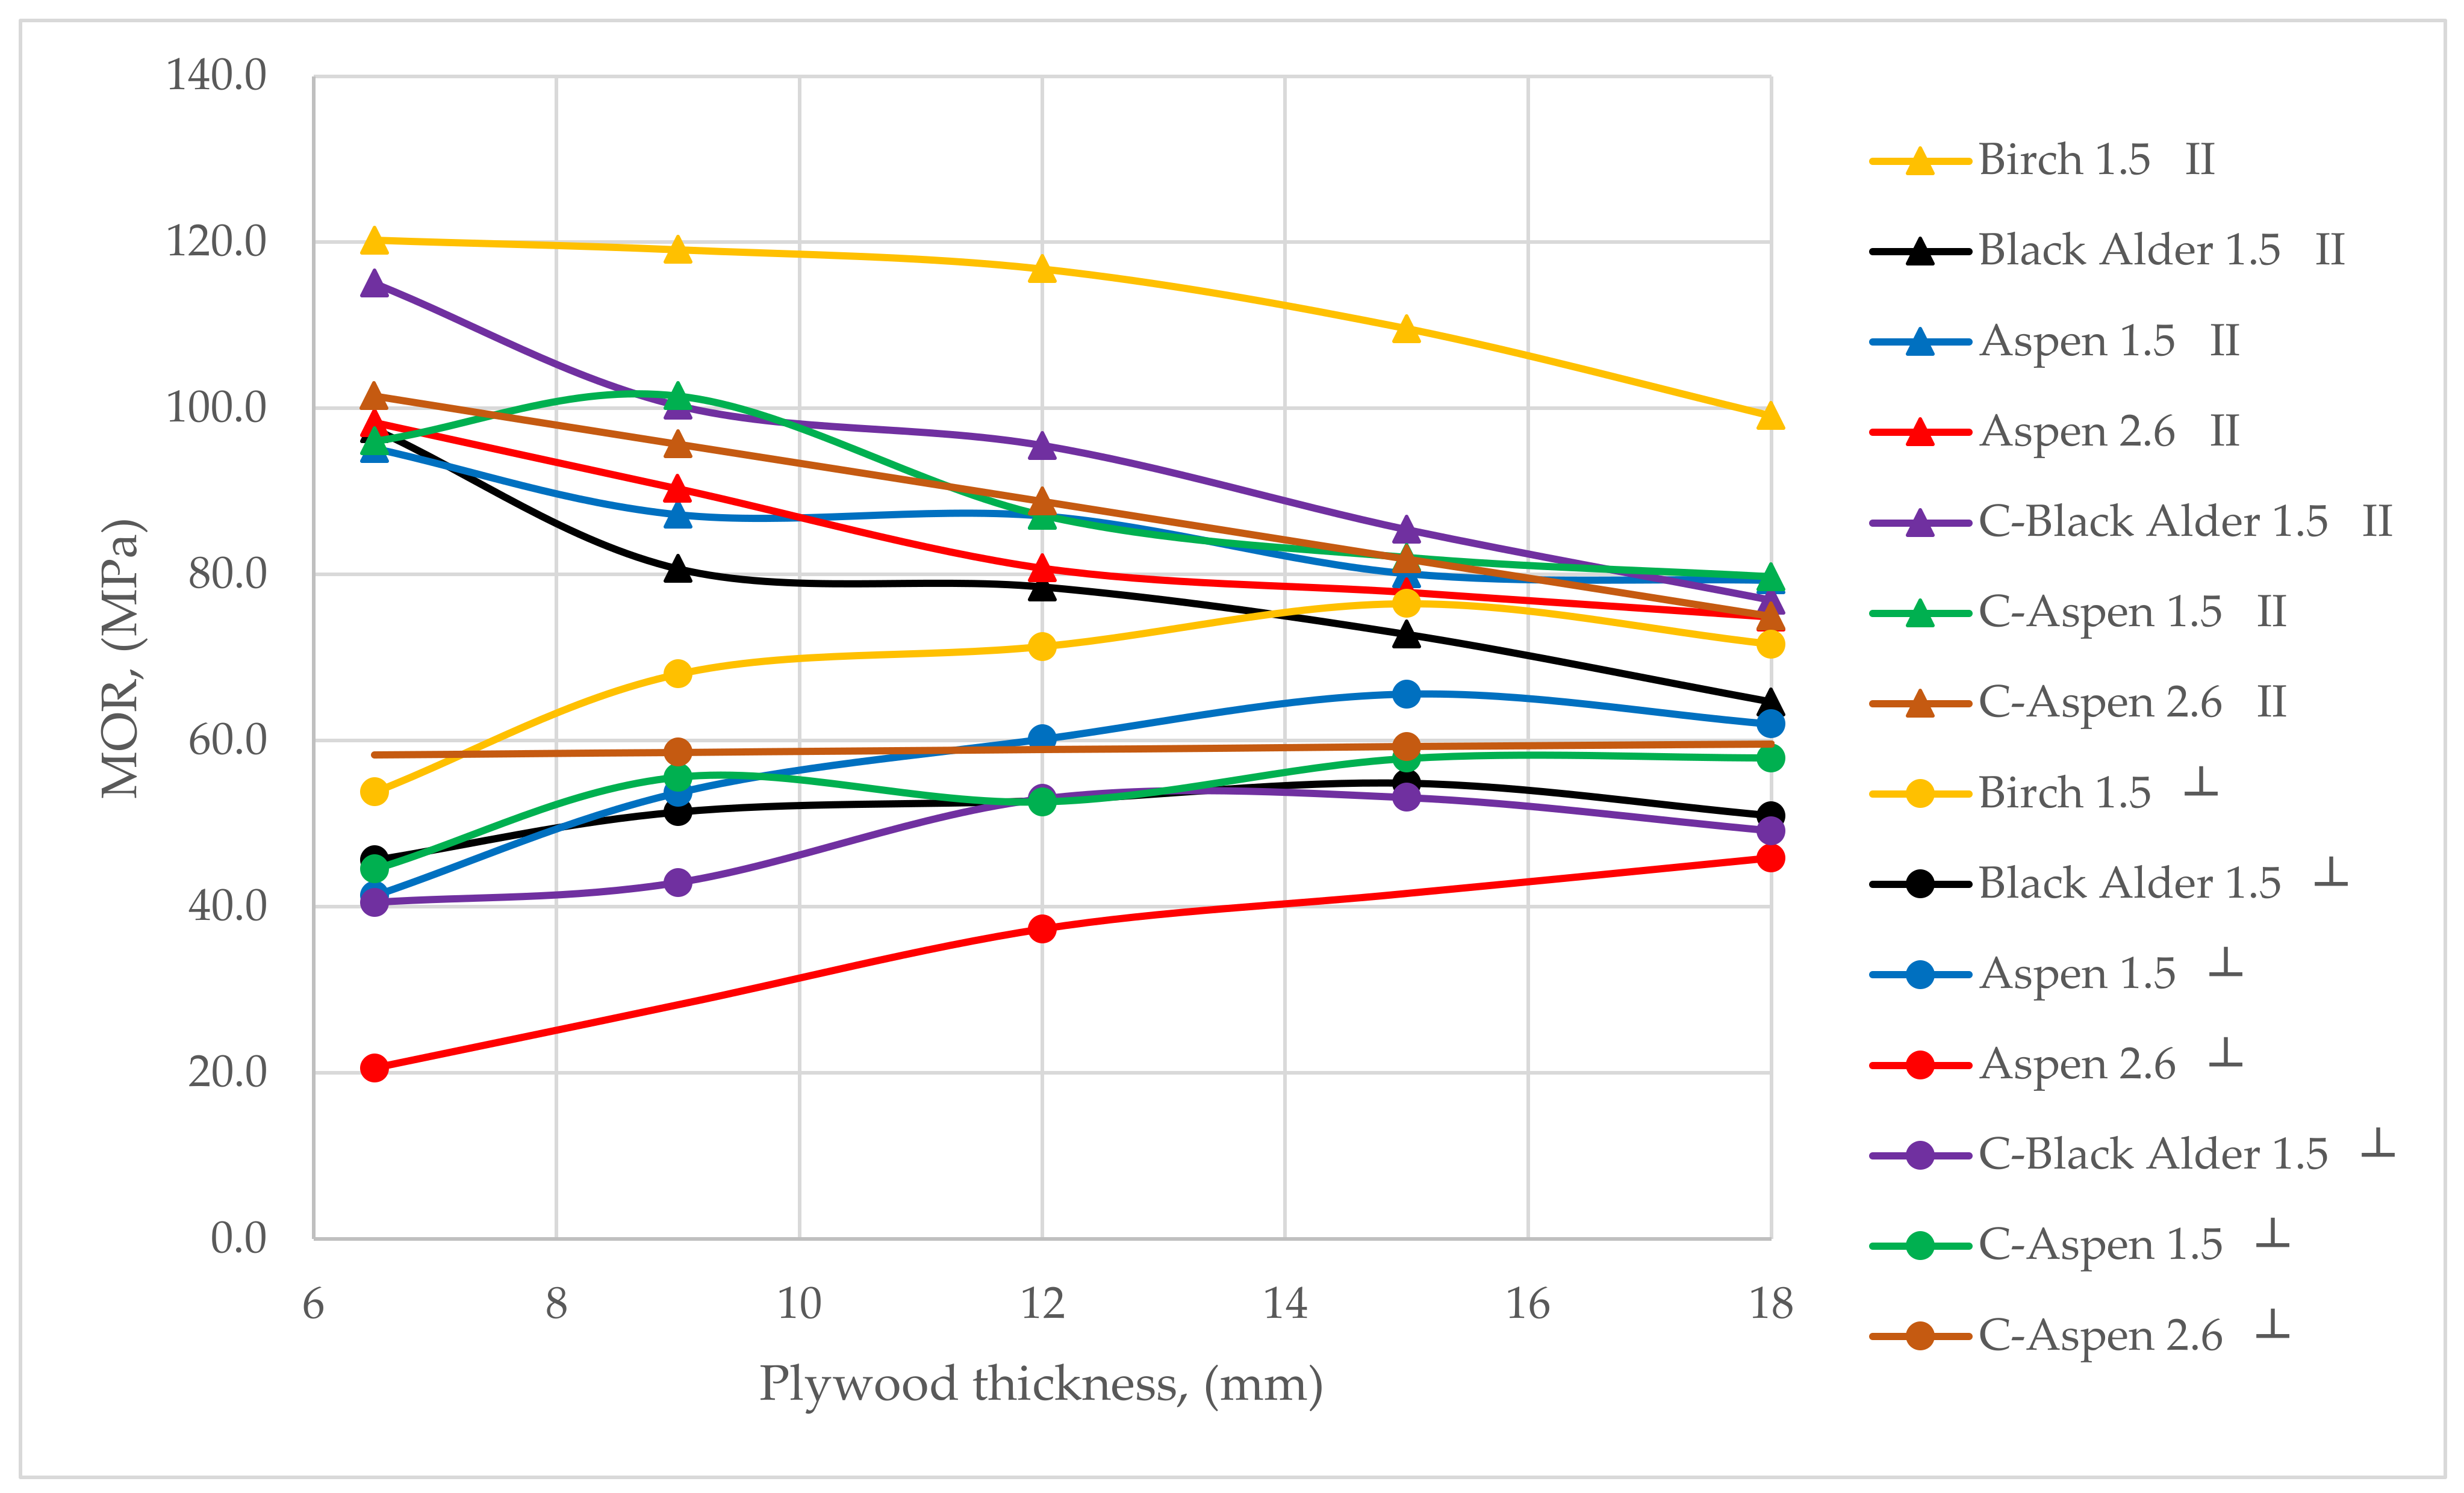
Several trends in MOR are apparent in Figure 3. First, as panel thickness increased, MOR in the grain direction decreased and increased in the cross direction. As a result, the MOR in the grain and cross direction started to converge at the high thicknesses. The highest MOR was observed in pure birch plywood using 1.5 mm veneers at all thicknesses (from 120 N/mm2 for 6.5 mm to 99.1 N/mm2 for 18 mm) and lowest in the plywood with only black alder 1.5 mm veneers (from 97.5 N/mm2 for 6.5 mm to 64.7 N/mm2 for 18 mm). In the cross direction, birch plywood had the highest MOR for all thicknesses (from 53.8 N/mm2 for 6.5 mm to 71.6 N/mm2 for 18 mm), and aspen plywood with 2.6 mm veneers had the lowest (from 20.6 N/mm2 for 6.5 mm to 45.9 N/mm2 for 18 mm).
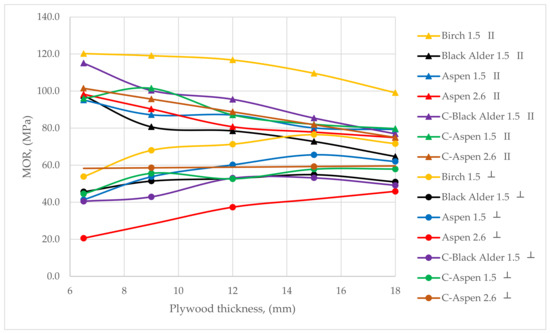
Figure 3.
For different plywood types and thicknesses, MOR vs. thickness, in grain (II) and cross (┴) direction. (Note: the same colour is used for both in grain and cross direction (lower values) for each plywood type).
When comparing MOR, all plywood panels showed lower strength than birch, as summarized in Table 5. The lowest relative (and absolute) strength was for 6.5 mm plywood from 2.6 mm pure aspen in the cross direction, because this panel contains only one cross veneer, placed at the neutral axis.

Table 5.
Strength decrease relative to standard birch plywood at each thickness.
For MOE, all results followed the same pattern as MOR. With increasing thickness, MOE decreased in the grain direction and increased in the cross direction. In the grain direction, average MOE results for all thicknesses included were 10,737 N/mm2 for aspen, 12,447 N/mm2 for birch, 8707 N/mm2 for black alder, and in cross direction, average MOE results for all thicknesses included were 5490 N/mm2 for aspen, 6201 N/mm2 for birch, and 4429 N/mm2 for black alder. For aspen plywood with 2.6 mm veneers, MOE was 11,270 N/mm2 in the grain direction and 3013 N/mm2 in the cross direction. In MOE, results were not significantly different for combi aspen and aspen plywood panels, but combi black alder plywood gave higher results (10,985 N/mm2) in the grain direction, while there was no significant change in the cross direction (4180 N/mm2).
The correlation between glue consumption and MOR varied from very weak (0.05) in birch to a moderate 0.58 in combi black alder, as can be seen from Table 6. However, only the combi black alder correlation was strong enough to be statistically significant (p < 0.05), even though most sets had 24 data points.

Table 6.
Glue consumption—MOR correlation coefficients.
4. Discussion
During pressing, aspen plywood samples compressed more than those made of the other two wood species, resulting in lower final thicknesses. Some plywood samples designed at 18 mm thickness were only 14.5 mm thick when using 2.6 mm thick aspen veneer. This is a result of using the same pressing parameters for all wood species and combinations in the study, rather than tailoring conditions for each wood species. Lower density wood species such as aspen typically compress more [7]. This resulted in higher density aspen plywood.
Glue was applied to the veneers with glue spreading rollers; this caused glue consumption variations by species and veneer thickness as expected. Glue consumption was higher for aspen veneers compared to black alder and birch veneers. As is typical for aspen, it had a much rougher, fuzzier surface than the other species, which is often associated with higher glue uptake from glue spreading rollers [7], whereas the veneers from two other wood species were smooth. Aspen 2.6 mm thick veneers consumed 28% more glue than birch and black alder veneers or 1.5 mm aspen veneers. The thicker veneers had rougher surfaces and more warpage than thin veneers; this is also supported by other researchers’ work [13]. Combi aspen plywoods with 2.6 mm veneers had higher densities than black alder and combi alder plywoods, even though they had less total glue consumption than the plywood made with 1.5 mm veneers of different wood species. The 2.6 mm aspen veneers compressed more than black alder veneers, resulting in lower final thickness of the plywood. Moreover, aspen plywoods with 1.5 mm veneers had higher glue consumption per glue line and more glue per panel. Higher glue consumption contributed to higher density in aspen plywood made with 1.5 mm veneers compared to black alder plywood produced with 1.5 mm veneers, since glue has higher density than veneers. Aspen plywoods with 2.6 mm veneers were 15 to 22% lighter than birch plywoods of the same thickness. A curtain or extrusion application system would likely do a better job of keeping constant spread rates, allowing better comparison of results without considering total glue consumption.
We found that for six of the seven panel types, glue consumption had no correlation (p > 0.05) to MOR. There does appear to be a correlation in combi black alder, suggesting that more resin may be needed on this species. As PF resin is known to stiffen and strengthen wood adjacent to the glue line through cell wall penetration, some amount of reinforcement from additional adhesive is expected [20]. However, the lack of a significant correlation suggests that the glue spread rate did not influence strength properties in most panels. The proper spread rate needs to be determined for each species and process.
Another question to address is whether the birch face plies on combi boards provided any benefit. In the grain direction, combi black alder was 20% stronger than pure black alder, and some improvement was also seen in combi-aspen 2.6 plywoods relative to pure aspen 2.6. There was little difference between aspen 1.5 and combi-aspen 1.5. In the cross direction, the combi aspen plywoods had better MOR than pure aspen, while combi-black alder was not improved over pure black alder.
For 2.6 mm pure aspen plywood, the lowest MOR value in the cross direction was obtained with 6.5 mm panel, which was 62% lower than that for birch. This is an expected result because this plywood has just one cross layer located on the neutral axis. Clearly, this would have a strong detrimental impact on MOR. Even at the higher thicknesses, 2.6 mm aspen MOR in the cross direction was notably lower than that of 1.5 mm aspen. This can be explained by the load-bearing second ply being located 2.6 mm rather than 1.5 mm from the surface. This reasoning is consistent with their very similar performance in the grain direction.
The relatively lower MOR of 2.6 mm aspen plywood in the cross direction, relative to aspen made from 1.5 mm veneers, can be an acceptable result if the cross MOR is not a major concern, i.e., in unidirectional loading. The 2.6 mm veneers resulted in lower density, as well as cost savings from using thicker veneers and using less glue.
As thickness increased, MOR in the grain and cross directions gradually approached each other, as can be seen from Figure 3. The MOR in the grain direction decreased with increasing thickness and vice versa in the cross direction. This is expected because with an increasing number of layers, cross layers represent more of the mass far from the neutral axis, where MOR and stiffness are impacted. Additionally, with more layers, the number of cross layers approaches the number of layers in the grain direction. Therefore, higher numbers of layers are favourable in two-dimensional loading conditions. In unidirectional loading, such as with plywoods used for truck floors, cross layers are still needed to minimize shape deformations and for the flatness of the panel. In these plywoods, MOR in the grain (loading) direction can be increased by replacing cross layers with grain-direction veneers.
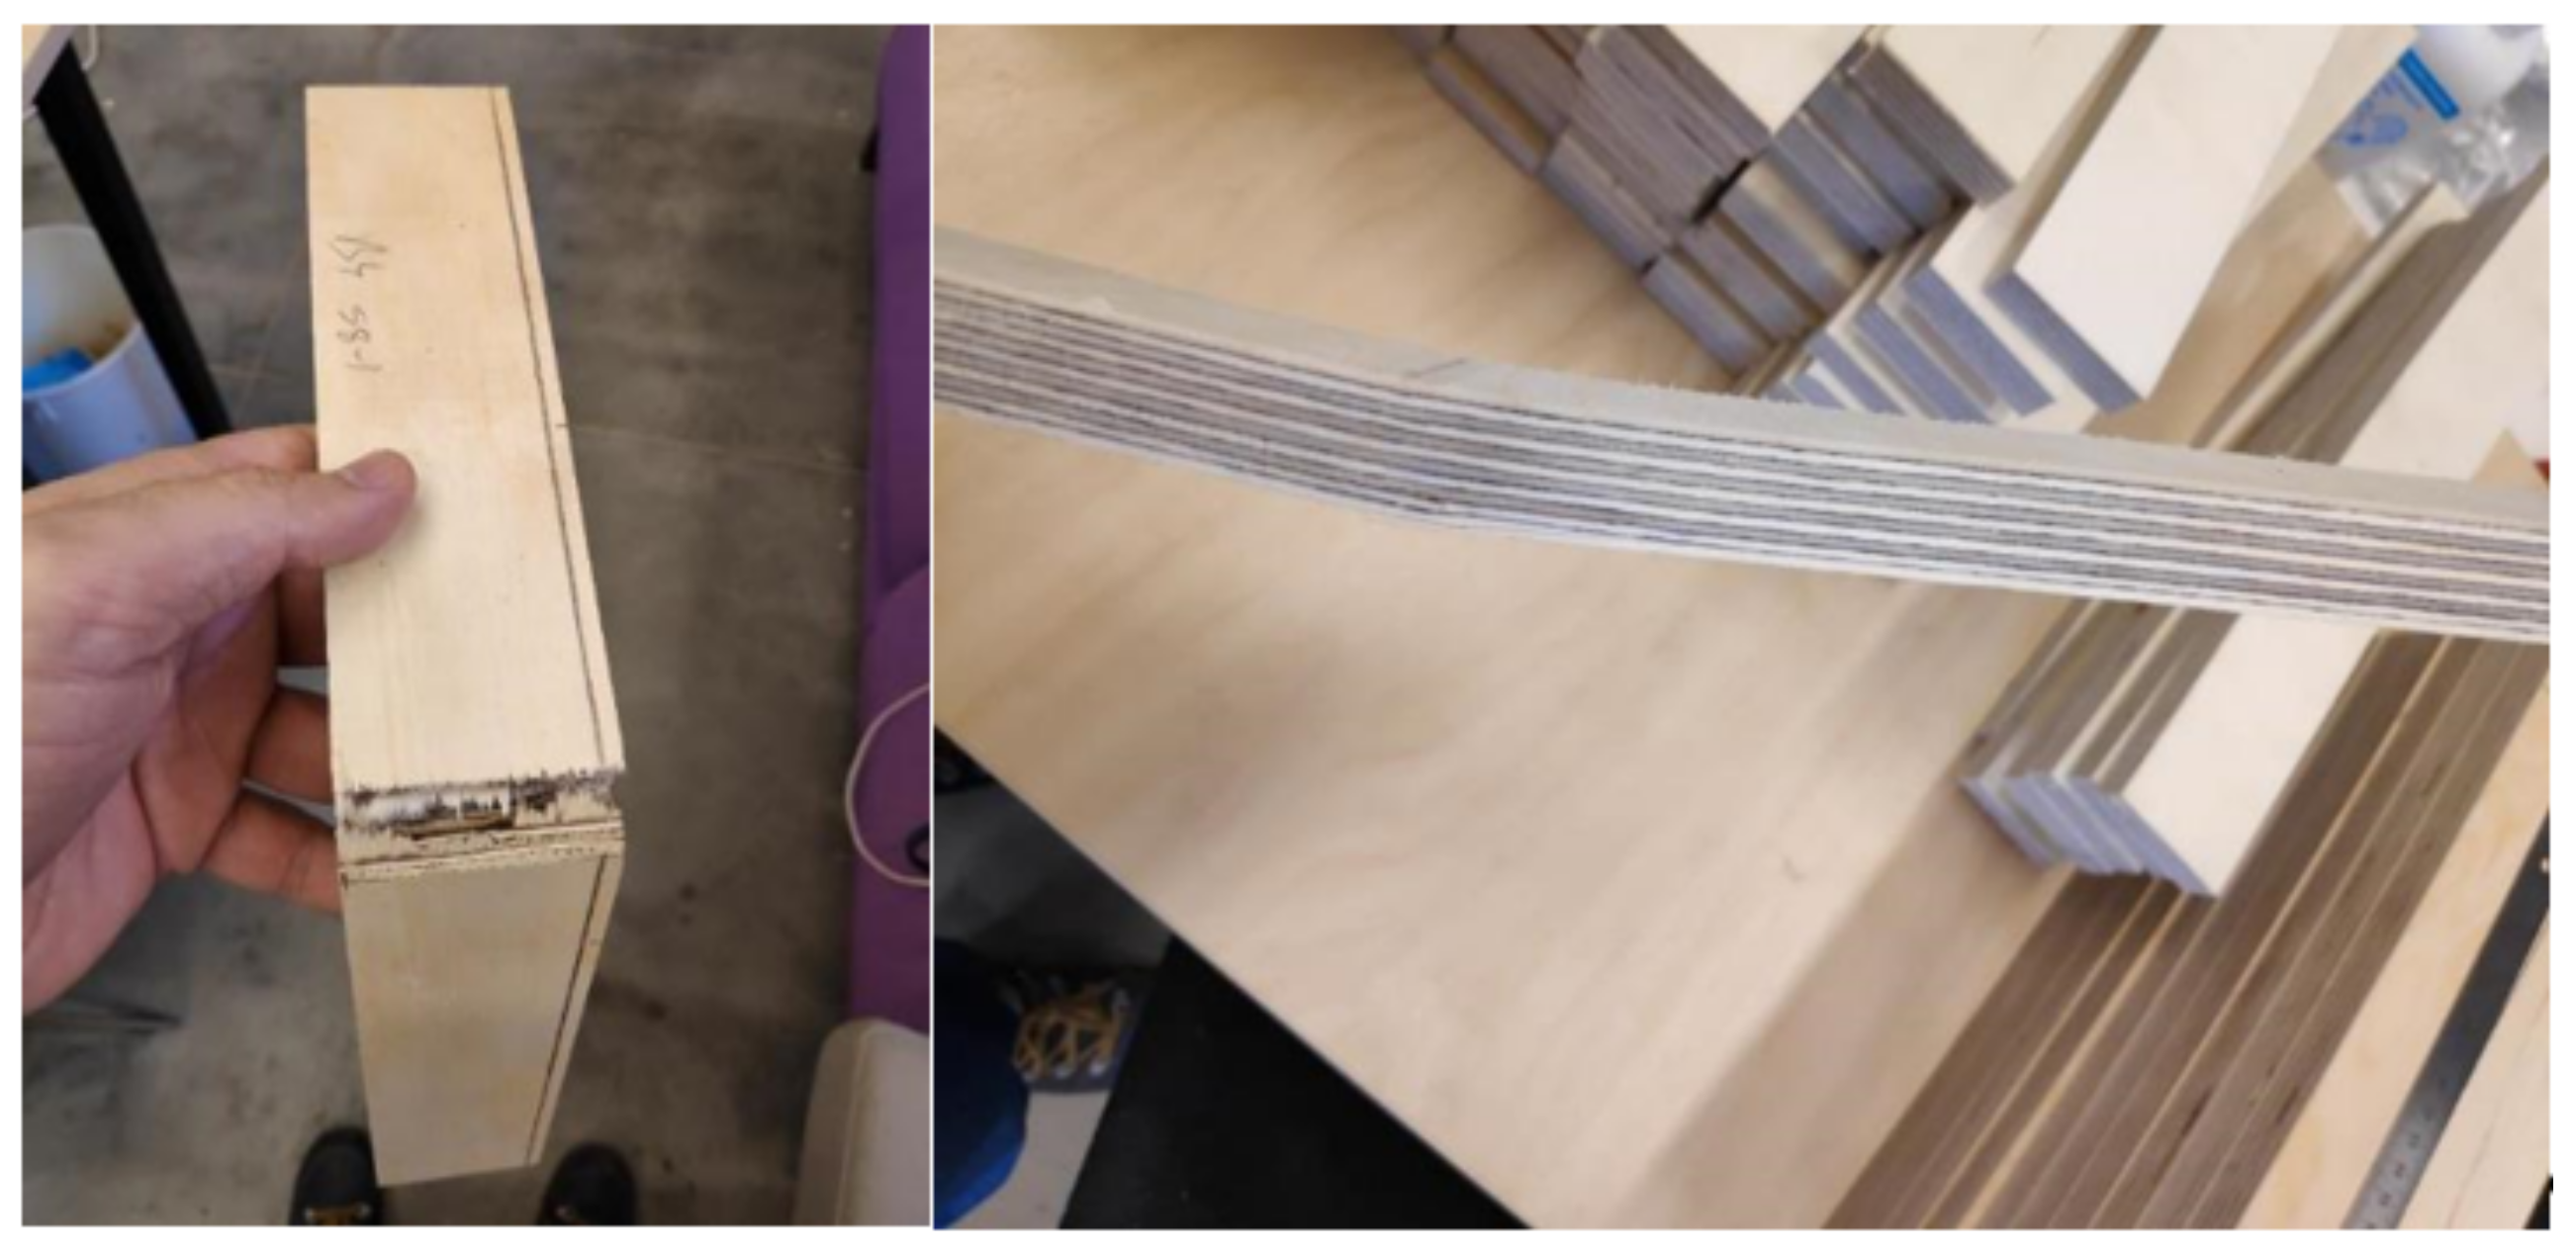
It was noticed in the bending tests that black alder showed a very brittle failure while aspen had the most ductile failure of the three species investigated. This could be due to the processing of veneers or properties of the wood species. In most engineering structures or load-bearing constructions, ductile failure is preferred. In bending tests, all black alder specimens failed suddenly without any pre-failure cracking noises. The specimen almost completely separated in brittle failure. Aspen test pieces made loud cracking noises before ultimate failure in bending, and after their peak load and load removal, the test piece recovered from some of the deformation. Much more energy was needed to completely break the aspen specimens, resulting in better toughness. Energy damping of aspen is, therefore, expected to be better than that of black alder. Figure 4 illustrates the brittle failure of the black alder and ductile failure of the aspen plywood specimen.
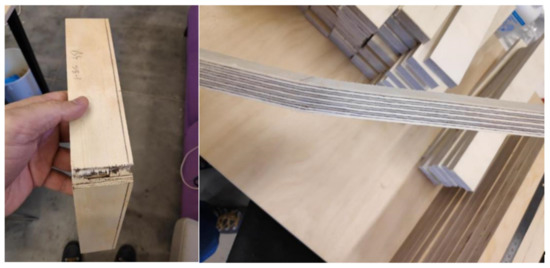
Figure 4.
Test pieces after bending tests, showing brittle failure in black alder (left), and ductile failure in aspen (right) plywood.
In this work, parameters such as soaking temperature and peeling parameters for different species were not investigated. All three species were soaked at 40 °C. However, the peeling and roughness properties could be impacted by soaking temperature, which may impact the properties of plywoods made from these veneers. In future experiments, peeling parameters could be changed to obtain better results for lathe checks and less cracks.
5. Conclusions
Based on the study, the following conclusions can be drawn:
- Aspen was compressed more under the 1.4 MPa pressing pressure of this study than birch or black alder, resulting in thinner, denser aspen panels. A few were below allowable thickness limits according to European standards for plywood tolerances and dimensions. Using lower pressure, a lower-density aspen plywood can be produced.
- Aspen veneers consumed the most glue, especially the 2.6 mm veneers, while black alder glue consumption was very similar to that of birch. Despite this, total glue consumption was 33%~40% lower for 2.6 mm aspen than for pure birch plywood because of the smaller number of glue lines.
- Birch plywood had the highest density, followed by 1.5 mm aspen and then black alder plywood. Aspen 2.6 mm plywood had the lowest density. Using thicker veneers in production can reduce glue consumption and result in lower density and cost.
- Birch plywood had the highest MOR in every case. Pure black alder had the lowest grain direction MOR, ~30% less than that of birch. The other five plywood types had 17%~22% less MOR than birch plywood in the grain direction. In the cross direction, birch plywood has the highest MOR and aspen with 2.6 mm thick veneers the lowest. However, the second highest stiffness came from combination plywood with birch face veneers and 2.6 mm aspen core veneers. These data quantify the impact of alternate species on plywood properties.
- For all species and combinations, grain and cross grain MOR values converged as the panels became thicker.
- MOE followed the same trends as MOR for all plywoods.
- Where the end use requires ductile materials, black alder should be avoided as it breaks with brittle failure.
- Thicker 2.6 mm aspen veneer produced plywood with lower density and lower glue consumption, and used lower priced wood than birch plywood produced from 1.5 mm veneers, but had lower MOR and MOE. Placing birch veneers at the surface made almost no difference in the grain direction MOR and MOE but significantly improved the cross-direction properties.
When considering alternative species and veneer thickness options in plywood production, it is good to keep in mind all of the aspects above as well as end use, costs, and proximity of log yard for transportation. Aspen plywood, especially using thicker veneers, would seem to be lighter and cheaper, but the MOR is lower than that of birch. This work helps in understanding the impact of species and veneer thickness substitutions on the properties of birch plywood.
Author Contributions
Conceptualization, J.K. and A.R.; methodology, H.K. and J.K.; validation, H.K., J.K. and A.R.; formal analysis, C.G.H. and A.R.; investigation, T.A.; resources, J.K.; data curation, T.A.; writing—original draft preparation, T.A.; writing—review and editing, C.G.H. and A.R.; visualization, H.K.; supervision, H.K.; project administration, J.K.; funding acquisition, J.K. All authors have read and agreed to the published version of the manuscript.
Funding
European Regional Development Fund and Estonian Research Council grants (PRG820) and Mobilitas Pluss (MOBTP123) are hereby acknowledged for supporting the research. State Forest Management Centre Estonia is also acknowledged for helping to obtain the wood material for this research. CGH was supported by the US Forest Service and a Fulbright Fellowship from the US State Department of Agriculture.
Institutional Review Board Statement
Not applicable.
Informed Consent Statement
Not applicable.
Data Availability Statement
Not applicable.
Acknowledgments
The European Regional Development Fund and Estonian Research Council grants (PRG820) and Mobilitas Pluss (MOBTP123) are hereby acknowledged for supporting the research. State Forest Management Centre Estonia is also acknowledged for helping to obtain the wood material for this research.
Conflicts of Interest
The authors declare no conflict of interest. The funders had no role in the design of the study; in the collection, analyses, or interpretation of data; in the writing of the manuscript, or in the decision to publish the results.
References
- FAOSTAT. Available online: https://www.fao.org/faostat/en/#home (accessed on 19 December 2021).
- RMK Annual Report 2020. Available online: https://media.rmk.ee/files/RMK_aastaraamat_2020_ENG_final.pdf (accessed on 19 December 2021).
- Heräjärvi, H.; Junkkonen, R. Wood Density and Growth Rate of European and Hybrid Aspen in Southern Finland. Balt. For. 2006, 12, 2–8. [Google Scholar]
- Heräjärvi, H. Static bending properties of Finnish birch wood. Wood Sci. Technol. 2004, 37, 523–530. [Google Scholar] [CrossRef]
- Ozarska, B. A review of the utilisation of hardwoods for LVL. Wood Sci. Technol. 1999, 33, 341–351. [Google Scholar] [CrossRef]
- Rohumaa, A.; Kallakas, H.; Mäetalu, M.; Savest, N.; Kers, J. The effect of surface properties on bond strength of birch, black alder, grey alder and aspen veneers. Int. J. Adhes. Adhes. 2021, 110, 102945. [Google Scholar] [CrossRef]
- Kallakas, H.; Rohumaa, A.; Vahermets, H.; Kers, J. Effect of Different Hardwood Species and Lay-Up Schemes on the Mechanical Properties of Plywood. Forests 2020, 11, 649. [Google Scholar] [CrossRef]
- Wang, B.; Dai, C.; Ellis, S. Veneer surface roughness and compressibility pertaining to plywood/LVL manufacturing. Part I. Experimentation and implication. Wood Fiber Sci. J. Soc. Wood Sci. Technol. 2006, 38, 535–545. [Google Scholar]
- Neese, J.L.; Reeb, J.E.; Funck, J.W. Relating traditional surface roughness measures to gluebond quality in plywood. For. Prod. J. 2004, 54, 67–74. [Google Scholar]
- Rohumaa, A.; Yamamoto, A.; Hunt, C.G.; Frihart, C.R.; Hughes, M.; Kers, J. Effect of log soaking and the temperature of peeling on the properties of Rotary-cut birch (Betula pendula Roth) veneer bonded with phenol-formaldehyde adhesive. BioResources 2016, 11, 5829–5838. [Google Scholar] [CrossRef] [Green Version]
- Rohumaa, A.; Antikainen, T.; Hunt, C.G.; Frihart, C.R.; Hughes, M. The influence of log soaking temperature on surface quality and integrity performance of birch (Betula pendula Roth) veneer. Wood Sci. Technol. 2016, 50, 463–474. [Google Scholar] [CrossRef]
- Rohumaa, A.; Hunt, C.G.; Frihart, C.R.; Saranpää, P.; Ohlmeyer, M.; Hughes, M. The influence of felling season and log-soaking temperature on the wetting and phenol formaldehyde adhesive bonding characteristics of birch veneer. Holzforschung 2014, 68, 965–970. [Google Scholar] [CrossRef]
- Purba, C.Y.C.; Pot, G.; Viguier, J.; Ruelle, J.; Denaud, L. The influence of veneer thickness and knot proportion on the mechanical properties of laminated veneer lumber (LVL) made from secondary quality hardwood. Eur. J. Wood Wood Prod. 2019, 77, 393–404. [Google Scholar] [CrossRef] [Green Version]
- Devallance, D.; Funck, J.W.; Reeb, J. Douglas-fir plywood gluebond quality as influenced by veneer roughness, lathe checks, and annual ring characteristics. For. Prod. J. 2007, 57, 21–28. [Google Scholar]
- Stalnaker, J.J.; Harris, E.C. Wood Structure and Properties. In Structural Design in Wood; Springer: Boston, MA, USA, 1997; pp. 11–31. [Google Scholar]
- EN 325-European Standards. Available online: https://www.en-standard.eu/csn-en-325-wood-based-panels-determination-of-dimensions-of-test-pieces/ (accessed on 19 December 2021).
- DIN EN 315-European Standards. Available online: https://www.en-standard.eu/din-en-315-plywood-tolerances-for-dimensions-english-version-of-din-en-315/ (accessed on 19 December 2021).
- DIN EN 323-European Standards. Available online: https://www.en-standard.eu/din-en-323-wood-based-panels-determination-of-density-german-version-en-323-1993/ (accessed on 19 December 2021).
- DIN EN 310-European Standards. Available online: https://www.en-standard.eu/din-en-310-wood-based-panels-determination-of-modulus-of-elasticity-in-bending-and-of-bending-strength-german-version-en-310-1993/ (accessed on 19 December 2021).
- Hunt, C.G.; Frihart, C.R.; Dunky, M.; Rohumaa, A. Understanding Wood Bonds-Going Beyond What Meets the Eye: A Critical Review. Rev. Adhes. Adhes. 2018, 6, 369–440. [Google Scholar] [CrossRef]
Publisher’s Note: MDPI stays neutral with regard to jurisdictional claims in published maps and institutional affiliations. |
© 2022 by the authors. Licensee MDPI, Basel, Switzerland. This article is an open access article distributed under the terms and conditions of the Creative Commons Attribution (CC BY) license (https://creativecommons.org/licenses/by/4.0/).

