Abstract
There is a current demand for “safety signal” screening, not only for single drugs but also for drug-drug interactions. The detection of drug-drug interaction signals using the proportional reporting ratio (PRR) has been reported, such as through using the combination risk ratio (CRR). However, the CRR does not consider the overlap between the lower limit of the 95% confidence interval of the PRR of concomitant-use drugs and the upper limit of the 95% confidence interval of the PRR of single drugs. In this study, we proposed the concomitant signal score (CSS), with the improved detection criteria, to overcome the issues associated with the CRR. “Hypothetical” true data were generated through a combination of signals detected using three detection algorithms. The signal detection accuracy of the analytical model under investigation was verified using machine learning indicators. The CSS presented improved signal detection when the number of reports was ≥3, with respect to the following metrics: accuracy (CRR: 0.752 → CSS: 0.817), Youden’s index (CRR: 0.555 → CSS: 0.661), and F-measure (CRR: 0.780 → CSS: 0.820). The proposed model significantly improved the accuracy of signal detection for drug-drug interactions using the PRR.
1. Introduction
Pre-marketing randomized clinical trials typically focus on establishing the safety and efficacy of a single drug rather than investigating drug-drug interactions; therefore, patients who use drugs other than the one under investigation are usually excluded. However, unlike pre-marketing trials, it is common to use multiple drugs for treatment post-marketing. Therefore, attention should be paid not only to the adverse events caused by a given drug, but also to those arising as a result of interactions between two or more drugs. In some reports, the proportion of adverse events caused by drug-drug interactions was estimated to be approximately 30% of the unexpected adverse events [1]. The use of a spontaneous reporting system is believed to be beneficial for the early detection of drug-induced adverse events post-marketing. Spontaneous reporting systems do not include the number of drug users; therefore the incidence of adverse events cannot be calculated, and instead, unknown adverse events are searched for using safety signals [2].
Several detection algorithms [3,4,5,6] have been developed based on disproportionality analysis, for example, the proportional reporting ratio (PRR) [3] is often used as an algorithm for single-drug-induced adverse events. In addition to these algorithms, several signal detection algorithms for drug-drug interactions have been reported [7,8,9].
Susuta et al. proposed the combination risk ratio (CRR) as a signal detection algorithm for drug-drug interactions [10]. As suggested by these authors, the CRR is calculated by dividing the estimated PRR points of concomitant-use drug D1 and drug D2 (=PRR drug D1 ∩ drug D2) by the estimated PRR points of drug D1 or drug D2 (PRR drug D1 or PRR drug D2), as shown in Table 1 and Equations (1)–(3) [10].

Table 1.
The 4 × 2 contingency table for signal detection: AE: adverse event; n: the number of reports.
However, to calculate the PRR drug D1 ∩ drug D2 and the χ2 drug D1 ∩ drug D2, replace it as follows: N11 = n111, N00 = n000 + n010 + n100, N10 = n110, N01 = n001 + n011 + n101, N1+ = n11+, N+1 = n++1, N0+ = n00+ + n01+ + n10+, N+0 = n++0. Identically, to calculate (1) the PRR drug D1 and the χ2 drug D1, (2) the PRR drug D2 and the χ2 drug D2, replace it as follows:
(1) N11 = n111 + n101, N00 = n000 + n010, N10 = n110 + n100, N01 = n001 + n011, N1+ = n11+ + n10+, N+1 = n++1, N0+ = n00+ + n01+, N+0 = n++0,
(2) drug D2: N11 = n111 + n011, N00 = n000 + n100, N10 = n110 + n010, N01 = n001 + n101, N1+ = n11+ + n01+, N+1 = n++1, N0+ = n00+ + n10+, N+0 = n++0.
When (1) n111 ≥ 3, (2) PRR drug D1 ∩ drug D2 > 2, (3) χ2 drug D1 ∩ drug D2 > 4, (4) CRR > 2, this was signal of drug-drug interaction.
However, the number of adverse events reported during concomitant use is generally lower than that of single-drug-induced adverse events, and the 95% confidence interval (95%CI) tends to be wider for PRR drug D1 ∩ drug D2. In other words, as shown in Figure 1, when the individual 95%CIs are considered, it is possible that the lower limit of the 95%CI of PRR drug D1 ∩ drug D2 (=PRR025 drug D1 ∩ drug D2) overlaps with the upper limit of the 95%CI of PRR drug D1 or PRR drug D2 (=PRR025 drug D1 or PRR025 drug D2).
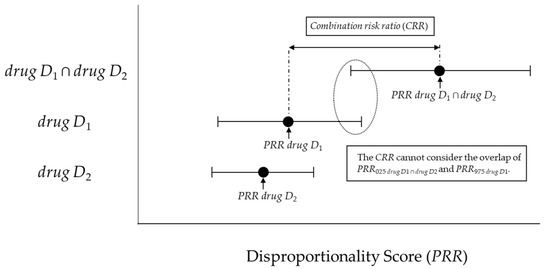
Figure 1.
The association between the combination risk ratio (CRR) and disproportionality score.
If such an overlap occurs, a risk signal may not be detected for concomitant use. Therefore, with reference to the interaction signal score (INTSS) [11], we proposed the concomitant signal score (CSS) (Figure 2) and verified its applicability for improving the detection criteria for the CRR proposed by Susuta et al [10].
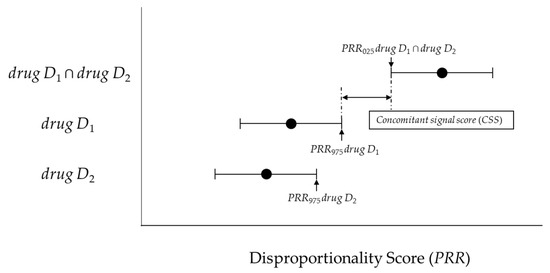
Figure 2.
The association between the concomitant signal score (CSS) and disproportionality score.
2. Results
2.1. Model Evaluation Using Receiver Operating Characteristic (ROC) and Precision-Recall (PR) Curves and the Area Under the Curve (AUC)
The receiver operating characteristic (ROC) curve and precision-recall (PR) curve of the CSS are shown in Figure 3. The area under the curve (AUC) score was 0.86 for the ROC (cutoff value: 1.041, Youden’s index (max): 0.632, and F-measure: 0.638) and 0.570 for PR (cutoff value: 1.271, Youden’s index: 0.623, and F-measure (max): 0.645).
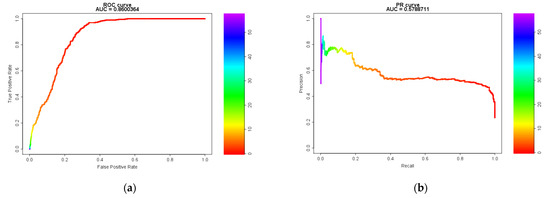
Figure 3.
Model Evaluation Using Receiver Operating Characteristic (ROC) and Precision-Recall (PR) Curves and the Area Under the Curve (AUC). (a) the receiver operator characteristic curve; (b) the precision-recall curve.
2.2. Model Evaluation Using Machine Learning Indicators
In all cases, 739 pairs were detected using the CRR (true positive (TP): 473, false positive (FP): 266, true negative (TN): 2735, and false negative (FN): 450). In contrast, the CSS detected 1862 signal pairs (TP: 882, FP: 980, TN: 2021, and FN: 41).
The numbers of TP, FP, TN, and FN signal pairs detected for n111 ≥ 3 are shown in Table 2. A total of 739 pairs were detected using the CRR (TP: 473, FP: 266, TN: 335, and FN: 1), and 621 pairs were detected using the CSS (TP: 449, FP: 172, TN: 429, and FN: 25).
Table 2.
The numbers of true positive, false positive, true negative, and false negative signal pairs for n111 ≥ 3.
The CSS confirmed an improvement in signal detection with respect to the following metrics: (1) Youden’s index (CRR: 0.424 → CSS: 0.629), (2) F-measure (CRR: 0.569 → CSS: 0.633), (3) Recall (sensitivity) (CRR: 0.512 → CSS: 0.956), and (4) negative predictive value (NPV) (CRR: 0.859 → CSS: 0.874), in comparison with CRR.
Furthermore, for n111 ≥ 3, the CSS confirmed an improvement in signal detection with respect to the following metrics: (1) Accuracy (CRR: 0.752 → CSS: 0.817), (2) Youden’s index (CRR: 0.555 → CSS: 0.661), (3) F-measure (CRR: 0.780 → CSS: 0.820) (4) Specificity (CRR: 0.557 → CSS: 0.714), and (5) Precision (positive predictive value; PPV) (CRR: 0.640 → CSS: 0.723). The metrics of the Ω shrinkage measure were as follows: (1) Accuracy (0.880), (2) Youden’s index (0.775), (3) F-measure (0.875), (4) Specificity (0.824), (5) Recall (sensitivity) (0.951), (6) Precision (PPV) (0.810), and (7) NPV (0.956) (Table 3).
Table 3.
Evaluation of the drug-drug interaction signals detected for n111 ≥ 3.
2.3. Cohen’s Kappa Coefficient
The similarity metrics between the CSS and the Ω shrinkage measure were κ (95%CI): 0.330 (0.314–0.345), Ppositive: 0.505, and Pnegative: 0.759 in all case. On the other hand, for n111 ≥ 3, those values were κ (95%CI): 0.729 (0.708–0750), Ppositive: 0.880, and Pnegative: 0.849.
3. Discussion
We evaluated the setting criteria and accuracy of the CSS, a newly proposed analytical model to overcome potential issues with the CRR. In this study, 3924 pairs of drug D1–drug D2—Stevens–Johnson syndrome (SJS) in the Japanese Adverse Drug Event Report (JADER) database were evaluated. Unknown adverse event data do not exist, therefore no “real” true data for adverse events were available. Therefore, to verify the accuracy of CSS, we had to prepare “hypothetical” true data pertaining to adverse events. These “hypothetical” true data were also used to validate the subset analysis for detecting drug-drug interaction signals [12].
The ROC curve was generated to determine the cutoff value of CSS. The highest value for Youden’s index was 0.632, and the cutoff value was 1.041 (F-measure: 0.645). Furthermore, the PR curve must be considered when evaluating imbalanced data such as those used in the present study. The F-measure was the highest for a cutoff value of 1.271 (F-measure: 0.645, Youden’s index: 0.623). Considering the detection criteria, including the results presented here, the criterion (CSS > 1) proposed by us would be preferable.
The highest number of signals was detected using the CSS, with 1862 pairs (47.5% of the total combinations, accuracy: 0.740, Youden’s index: 0.629, and F-measure: 0.633), followed by the CRR, with 739 pairs (18.8% of the total combinations, accuracy: 0.817, Youden’s index: 0.424, F-measure: 0.569), in all cases. One reason for this difference in the number of detections is that, unlike the CSS, the CRR cannot detect combinations for n111 < 3. Therefore, we also investigated the difference in the number of detections for n111 ≥ 3.
As shown in Table 2 and Table 3, 621 signal pairs were detected using the CSS (57.8% of the total combinations, accuracy: 0.817, Youden’s index: 0.661, and F-measure: 0.820), whereas 739 pairs were detected using the CRR (68.7% of the total combinations, accuracy: 0.752, Youden’s index: 0.556, and F-measure: 0.780). These results demonstrate the significantly improved signal detection accuracy of the newly proposed CSS in comparison with that of the CRR. However, the CSS exhibited slightly lower accuracy for detecting drug-drug interaction signals in comparison with the Ω shrinkage measure.
These results suggest that the CSS might be a more suitable method for detecting drug-drug interaction signals using PRR instead of the CRR.
Our previous studies [13] have shown that the Ω shrinkage measure is the most conservative signal detection method. Therefore, in this study, we also investigated the similarity between the CSS and the Ω shrinkage measure.
The similarity metrics between the CSS and the Ω shrinkage measure were κ (95%CI): 0.330 (0.314–0.345), Ppositive: 0.505, and Pnegative: 0.759, whereas those between the CRR and Ω shrinkage measure were κ: 0.718 (0.703–0.733), Ppositive: 0.771, and Pnegative: 0.948 [13] in all case. As mentioned earlier, although the CRR cannot detect combinations for n111 < 3, the CSS can. It is considered that this difference in detection criteria affected the similarity.
Indeed, the CSS is more similar to the Ω shrinkage measure than the CRR in n111 ≥ 3; the Ω shrinkage measure and CSS was κ (95%CI): 0.729 (0.708–0750), Ppositive: 0.880, and Pnegative: 0.849, whereas the CRR and Ω shrinkage measure were κ: 0.621 (0.597–0.646), Ppositive: 0.850 and Pnegative: 0.763 [13]. Unlike the CRR, the CSS has the advantage of being able to detect combinations for n111 < 3, but if a more conservative signal detection is needed, consider adding “n111 ≥ 3” to the criteria.
However, this study, like our previous study [12], has three limitations:
- (1)
- The true data used in this study consist of a statistics-based drug D1–drug D2 adverse event (SJS) combination rather than a pharmacology-based combination. Unfortunately, data on unknown adverse events do not exist; thus, it was necessary to use “hypothetical” true data instead of “real” true data for validation. Therefore, we used a combination of signals detected using the three algorithms as “hypothetical” true data for detecting drug-drug interaction signals.
- (2)
- It is important to compare detection trends using all adverse events recorded in the validation datasets. However, numerous combinations of drug D1–drug D2 adverse events are expected, and a study design including all such combinations is not practical. Therefore, SJS was the target adverse event in this study. Although this adverse event has been used previously in other comparative studies by our group [12,13] and other researchers [10,14], it is possible that different performance characteristics are obtained when different reference sets are used.
- (3)
- Differences in the approach adopted by regulatory authorities may result in differences in the tendency to register adverse events in the spontaneous reporting system. For example, JADER has long not accepted reports from patients, whereas the Food and Drug Administration Adverse Events Reporting System (FAERS) includes reports from non-medical professionals. It is unclear how the differences in registration tendencies would affect the results of this study [12]. However, as verified by Caster et al. [15], the statistical impact of differences in the number of cases enrolled in the spontaneous reporting system on this study might be small.
4. Materials and Methods
4.1. Data Sources
The validation dataset was created from the Japanese Adverse Drug Event Report database (JADER), using data from the first quarter of 2004 to the fourth quarter of 2015. It can be accessed directly here: (http://www.info.pmda.go.jp/fukusayoudb/CsvDownload.jsp) (in Japanese only).
4.2. Definitions of Adverse Drug Events
The drugs targeted for the survey were all registered and classified as “suspect drugs” in verification data set. The adverse event targeted for this study was Stevens–Johnson syndrome (SJS) using the preferred term (PT) in the Medical Dictionary for Regulatory Activities Japanese version (MedDRA/J).
4.3. “Hypothetical” True Data of Adverse Events for Comparative Verification
There are no “real” true data for unknown adverse events. It was considered that only known adverse events should not be used as “real” true data for validation, because detection algorithms require the power to detect unknown adverse events. Therefore, “hypothetical” true data used in the previous study [12] were also used in this study.
“Hypothetical” true data used the combination of signals detected by three algorithms (the additive model [16], the multiplicative model [16], and the Chi-squared statistical test [17]).
4.4. Statistical Models and Criteria
4.4.1. Previous Model (combination risk ratio) and criteria proposed by Susuta et al.
This model proposed by Susuta [10] is calculated using Figure 1 as described and Equations (1)–(3) in the introduction section. When (1) n111 ≥ 3, (2) PRR drug D1 ∩ drug D2 > 2, (3) χ2 drug D1 ∩ drug D2 > 4, (4) combination risk ratio (CRR) > 2, this was signal of drug-drug interaction.
4.4.2. New Model (Concomitant Signal Score) and Criteria
Two new models and criteria were considered. The lower 95%CI for the PRR (PRR025) and the upper 95%CI for the PRR (PRR975) was calculated using Figure 1 and Equations (2) and (4).
We proposed the CSS (Equation (5)) as a new model. The newly proposed model is the ratio of PRR025 drug D1 ∩ drug D2 and PRR975 drug D1 (or PRR975 drug D2). This principle is similar to the interaction signal score (INTSS) [16].
In this study, we considered (1) PRR025 drug D1 ∩ drug D2 > 1, (2) CSS > 1 as the newly proposed criteria.
4.4.3. Model (Ω Shrinkage Measure) and Criteria to be Compared.
In this study, we selected the Ω shrinkage measure [18] as the model for comparison. The Ω shrinkage measure shows the most conservative detection trends of the five algorithms based on frequency statistical model for drug-drug interactions in our previous study [13].
The calculation is shown in Equations (6) and (7). However, E111 is the expected value of adverse event (AEs) caused by the combination of two drugs. Ω025 > 0 is used as a threshold to screen for signals under the combination of two drugs
4.5. Evaluation of Models for Detection
4.5.1. Model Evaluation Using the ROC and PR Curves and AUC
The ROC curve is normally used to judge model performance. To properly analyze imbalanced data, which include a higher proportion of negative data than positive data, evaluation using the PR curve [19,20] in addition to the ROC curve is necessary. Therefore, the PR curve was also used in this study.
4.5.2. Using Evaluations of Classification in Machine Learning
The evaluation indicators that we have set were Accuracy (Equation (8)), Youden’s index (Equation (9)), F-measure (Equation (10)), Specificity, Recall (=Sensitivity), Precision (=Positive predictive value; PPV), and negative predictive value (NPV).
4.5.3. Cohen’s Kappa Coefficient
The commonality of the signals detected by each statistical model was evaluated using Cohen’s kappa coefficient (κ), proportionate agreement for positive rating (Ppositive), and proportionate agreement for negative rating (Pnegative), as reported in previous studies [12,13,14]. In this study, we investigated the similarities with the Ω shrinkage measure for the previous/newly proposed analysis (CRR/CSS).
4.6. Analysis Software
The analysis software in this study used Visual Mining Studio (NTT DATA Mathematical Systems Inc., Shinjuku-ku, Tokyo, Japan) version 8.4, Microsoft Excel 2019 (Microsoft Corp., Redmond, WA, USA), and R version 4.0.0 (R Core Team, https://www.R-project.org/) with PRROC package version 1.3.1.
5. Conclusions
Polypharmacy has become a contemporary social problem, which has necessitated safety signal screening, not only for single drugs but also for drug-drug interactions. A convenient method is sought because most methods for detecting drug interaction signals involve complicated calculations.
The CRR proposed by Susuta et al. is based on PRR, which not only facilitates the detection of drug-drug interaction signals, but also makes it easy to understand the fluctuations in drug-drug interactions due to a single drug in terms of signal intensity [10]. However, unlike the INTSS, CRR does not consider the overlap between the lower limit of the 95%CI of PRR drug D1 ∩ drug D2 (=PRR025 drug D1 ∩ drug D2) and the upper limit of the 95%CI of PRR drug D1 or PRR drug D2 (=PRR025 drug D1 or PRR025 drug D2).
In this study, we proposed a CSS with an improved detection criteria, with reference to the INTSS, to overcome the issues associated with the CRR. Our proposed model significantly improved the accuracy of signal detection for drug-drug interactions using the PRR.
Author Contributions
Conceptualization, Y.N.; methodology, Y.N. and T.T.; validation, Y.N. and T.T.; investigation, Y.N., K.A. and S.K.; writing—original draft preparation, Y.N.; writing—review and editing, Y.N., T.T. and H.T.; visualization, Y.N.; supervision, Y.N.; project administration, Y.N. and H.T.; funding acquisition, Y.N. All authors have read and agreed to the published version of the manuscript.
Funding
This research was funded by JSPS KAKENHI Grant Number 19K20731.
Institutional Review Board Statement
Not applicable.
Informed Consent Statement
Not applicable.
Data Availability Statement
Please refer to suggested Data Availability Statements in section “MDPI Research Data Policies” at https://www.mdpi.com/ethics.
Conflicts of Interest
The authors declare no conflict of interest.
References
- Iyer, S.V.; Harpaz, R.; Le Pendu, P.; Bauer-Mehren, A.; Shah, N.H. Mining clinical text for signals of adverse drug-drug interactions. J. Am. Med. Inf. Assoc. 2013, 21, 353–362. [Google Scholar] [CrossRef]
- Bate, A.; Evans, S.J. Quantitative signal detection using spontaneous ADR reporting. Pharmacoepidemiol. Drug Saf. 2009, 18, 427–436. [Google Scholar] [CrossRef]
- Evans, S.J.; Waller, P.C.; Davis, S. Use of proportional reporting ratios (PRRs) for signal generation from spontaneous adverse drug reaction reports. Pharmacoepidemiol. Drug Saf. 2001, 10, 483–486. [Google Scholar] [CrossRef] [PubMed]
- Rothman, K.J.; Lanes, S.; Sacks, S.T. The reporting odds ratio and its advantages over the proportional reporting ratio. Pharmacoepidemiol. Drug Saf. 2004, 13, 519–523. [Google Scholar] [CrossRef] [PubMed]
- Bate, A.; Lindquist, M.; Edwards, I.R.; Olsson, S.; Orre, R.; Lansner, A.; De Freitas, R.M. A Bayesian neural network method for adverse drug reaction signal generation. Eur. J. Clin. Pharmacol. 1998, 54, 315–321. [Google Scholar] [CrossRef] [PubMed]
- DuMouchel, W. Bayesian Data Mining in Large Frequency Tables, with an Application to the FDA Spontaneous Reporting System. Am. Stat. 1999, 53, 177–190. [Google Scholar] [CrossRef]
- Noguchi, Y.; Ueno, A.; Otsubo, M.; Katsuno, H.; Sugita, I.; Kanematsu, Y.; Yoshida, A.; Esaki, H.; Tachi, T.; Teramachi, H. A new search method using association rule mining for drug-drug interaction based on spontaneous report system. Front. Pharmacol. 2019, 9, 197. [Google Scholar] [CrossRef] [PubMed]
- Vilar, S.; Friedman, C.; Hripcsak, G. Detection of drug-drug interactions through data mining studies using clinical sources, scientific literature and social media. Brief. Bioinform. 2018, 19, 863–877. [Google Scholar] [CrossRef] [PubMed]
- Noguchi, Y.; Tachi, T.; Teramachi, H. Review of Statistical Methodologies for Detecting Drug-Drug Interactions Using Spontaneous Reporting Systems. Front. Pharmacol. 2019, 10, 1319. [Google Scholar] [CrossRef] [PubMed]
- Susuta, Y.; Takahashi, Y. Safety risk evaluation methodology in detecting the medicine concomitant use risk which might cause critical drug rash. Jpn. J. Pharmacoepidemiol. 2014, 19, 39–49. [Google Scholar] [CrossRef][Green Version]
- Suzuki, A.; Yuen, N.A.; Ilic, K.; Miller, R.T.; Reese, M.J.; Brown, H.R.; Ambroso, J.I.; Falls, J.G.; Hunt, C.M. Comedications alter drug-induced liver injury reporting frequency: Data mining in the WHO VigiBase™. Regul. Toxicol. Pharmacol. 2015, 72, 481–490. [Google Scholar] [CrossRef] [PubMed]
- Noguchi, Y.; Tachi, T.; Teramachi, H. Subset Analysis for Screening Drug–Drug Interaction Signal Using Pharmacovigilance Database. Pharmaceutics 2020, 12, 762. [Google Scholar] [CrossRef] [PubMed]
- Noguchi, Y.; Tachi, T.; Teramachi, H. Comparison of signal detection algorithms based on frequency statistical model for drug-drug interaction using spontaneous reporting systems. Pharm. Res. 2020, 37, 86. [Google Scholar] [CrossRef] [PubMed]
- Kubota, K.; Koide, D.; Hirai, T. Comparison of data mining methodologies using Japanese spontaneous reports. Pharmacoepidemiol. Drug Saf. 2004, 13, 387–394. [Google Scholar] [CrossRef] [PubMed]
- Caster, O.; Aoki, Y.; Gattepaille, L.M.; Grundmark, B. Disproportionality Analysis for Pharmacovigilance Signal Detection in Small Databases or Subsets: Recommendations for Limiting False-Positive Associations. Drug Saf. 2020, 43, 479–487. [Google Scholar] [CrossRef] [PubMed]
- Thakrar, B.T.; Grundschober, S.B.; Doessegger, L. Detecting signals of drug-drug interactions in a spontaneous reports database. Br. J. Clin. Pharmacol. 2007, 64, 489–495. [Google Scholar] [CrossRef] [PubMed]
- Gosho, M.; Maruo, K.; Tada, K.; Hirakawa, A. Utilization of chi-square statistics for screening adverse drug-drug interactions in spontaneous reporting systems. Eur. J. Clin. Pharmacol. 2017, 73, 779–786. [Google Scholar] [CrossRef] [PubMed]
- Noren, G.N.; Sundberg, R.; Bate, A.; Edwards, I.R. A statistical methodology for drug-drug interaction surveillance. Stat. Med. 2008, 27, 3057–3070. [Google Scholar] [CrossRef] [PubMed]
- Saito, T.; Rehmsmeier, M. The precision-recall plot is more informative than the ROC plot when evaluating binary classifiers on imbalanced datasets. PLoS ONE 2015, 10, e0118432. [Google Scholar] [CrossRef] [PubMed]
- Carrington, A.M.; Fieguth, P.W.; Qazi, H.; Holzinger, A.; Chen, H.H.; Mayr, F.; Manuel, D.G. A new concordant partial AUC and partial c statistic for imbalanced data in the evaluation of machine learning algorithms. BMC Med. Inform. Decis. Mak. 2020, 20, 4. [Google Scholar] [CrossRef] [PubMed]
Publisher’s Note: MDPI stays neutral with regard to jurisdictional claims in published maps and institutional affiliations. |
© 2020 by the authors. Licensee MDPI, Basel, Switzerland. This article is an open access article distributed under the terms and conditions of the Creative Commons Attribution (CC BY) license (http://creativecommons.org/licenses/by/4.0/).