Abstract
Statistical correction methods, the Cumulative Distribution Function (CDF) matching technique and Regional Statistics Method (RSM) are applied to adjust the limited temporal variability of Advanced Microwave Scanning Radiometer E (AMSR-E) data using the Common Land Model (CLM). The temporal variability adjustment between CLM and AMSR-E data was conducted for annual and seasonal periods for 2003 in the Little River region, GA. The results showed that the statistical correction techniques improved AMSR-E's limited temporal variability as compared to ground-based measurements. The regression slope and intercept improved from 0.210 and 0.112 up to 0.971 and -0.005 for the non-growing season. The R2 values also modestly improved. The Moderate Resolution Imaging Spectroradiometer (MODIS) Leaf Area Index (LAI) products were able to identify periods having an attenuated microwave brightness signal that are not likely to benefit from these statistical correction techniques.
1. Introduction
Model and field validation studies have identified challenges to the direct application of remote sensing soil moisture products from aircraft and satellite instruments that provide regional surface soil moisture (0 - 5 cm) values [11, 12, 24]. These products tend to capture the soil moisture patterns of relatively wet and dry regions [17, 22, 23], but the remotely sensed magnitude often does not correlate well with in situ measurements [22, 23]. Sahoo et al. [23] pointed out that AMSR-E did not predict the observed soil moisture temporal variation during SMEX02 (Iowa), SMEX03 (Georgia), and SMEX04 (Arizona). Mohr et al. [17] also pointed out that remotely sensed Electronically Scanned Thinned Array Radiometer (ESTAR) surface soil moisture did not predict temporal variation as compared to model and ground data during Southern Great Plains Hydrology 1997 (SGP97). In particular, the limited range of remotely sensed soil moisture values, especially during the growing season, challenges their application [6, 15, 22].
Improvement of satellite soil moisture is possible by means of statistical correction or scaling approaches and may be particularly valuable prior to using a satellite soil moisture product in an assimilation system [21]. The Cumulative Distribution Function (CDF) matching technique and Regional Statistics Method (RSM) have been widely used in diverse disciplines to reduce hydrologic measurement errors. CDF matching reduced the error between measured gage rainfall and radar rainfall [4] as well as Spectral Sensor Microwave Imager (SSM/I) satellite rainfall estimation [2]. Reichle and Koster [21] used CDF matching to reduce the long-term bias for microwave soil moisture retrieved from the C-band Scanning Multi-channel Microwave Radiometer (SMMR). They found that the CDF matching technique improved the bias of mean soil moisture derived from SMMR by up to 80% as compared to the bias of original SMMR retrievals. They pointed out that this simple technique, CDF matching technique, would be useful for practical operation of future satellite products such as AMSR-E. Zhan et al. [27] also applied the CDF matching technique with Land Data Assimilation System's (LDAS) land surface modeling to scale low temporal variability of the AMSR-E soil moisture products during SMEX field experiments. They concluded the AMSR-E soil moisture products' low temporal variability was much improved and that the AMSR-E soil moisture could be used to assimilate into land surface models after scaling by CDF matching technique. RSM is routinely used to predict un-gauged site flow based on nearby gauged site [18, 14, 10] with applications for stream flow time series reconstruction [18].
The objective of this study is to use modeled soil moisture to improve the Advanced Microwave Scanning Radiometer – E (AMSR-E) surface soil moisture's dynamic range of temporal variability. Here we compare the CDF matching and the RSM statistical correction methods. Additionally, the value of remotely sensed vegetation to enhance statistical correction methods is also explored. Remotely sensed vegetation information, the Moderate Resolution Imaging Spectroradiometer (MODIS) Leaf Area Index (LAI) products, is used to identify annual vegetation density variations affecting the accuracy of AMSR-E soil moisture products.
2. Study area
This study was conducted in the Little River watershed in near Tifton, GA which was the site of the Soil Moisture Experiments in 2003 (SMEX03) field campaign and was also heavily instrumented for the long-term calibration and validation of AMSR-E microwave soil moisture. The region's climate is humid with average annual rainfall of 1160 mm. The soils are mostly well drained sands [16]. In the watershed, land use is predominantly row-crop agriculture (40%), pasture (18%), forest (36%), and wetlands and residential (6%) [5]. The main crops are cotton and peanuts with typical growing seasons from May to October. More detailed information on study area is provided by [5]. The Little River Watershed study region coincides with a portion of four 25 km by 25 km EASE Grids identified as A, B, C, and D (Figure 1). Table 1 describes the geographic location, land use, and soil texture for each EASE-Grid.
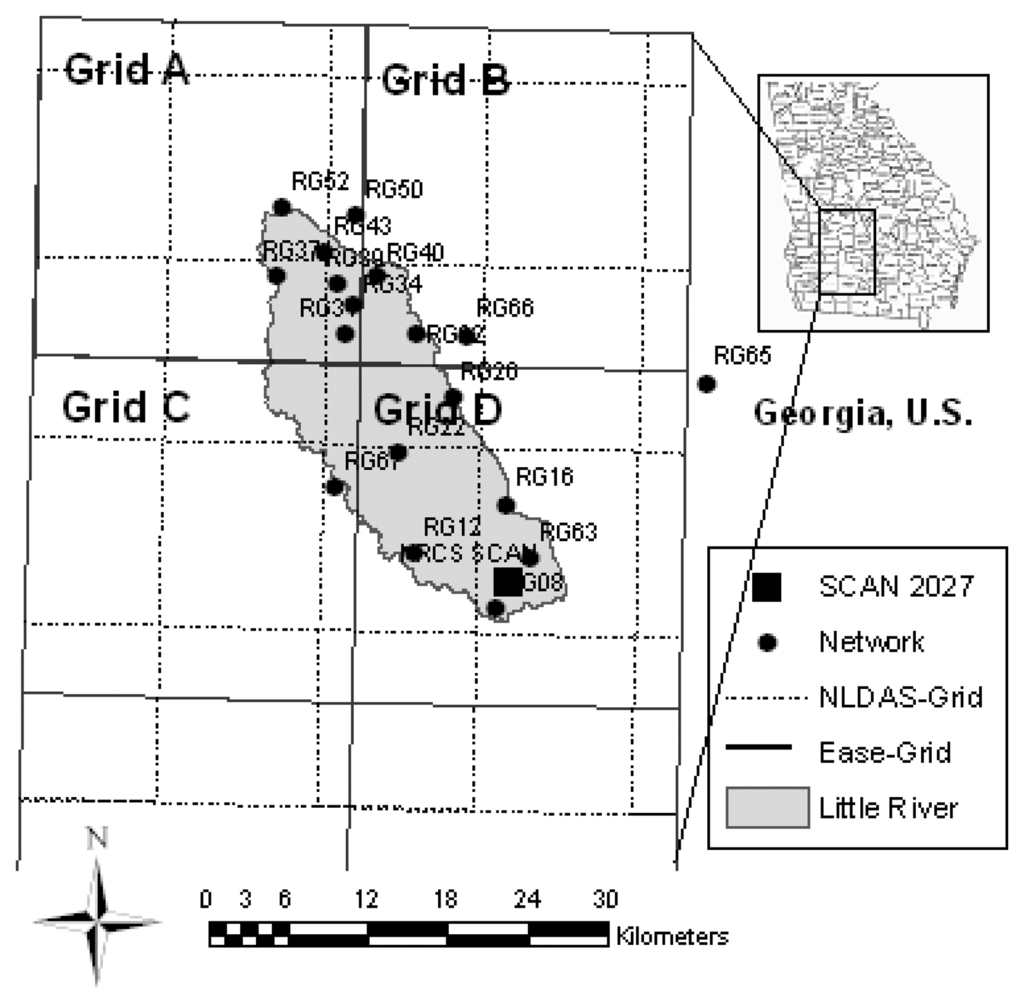
Figure 1.
Little River watershed at Georgia, network sites, NLDAS-Grids, and EASE-Grids.

Table 1.
Geographic locations, land use, and soil texture for Grids A, B, C, and D.
3. Datasets
The study period was January 1 to December 31, 2003. During 2003, soil moisture data were available from in-situ measurements, satellite observations, and CLM model predictions for each grid. A brief description appears below. Additional details are available from [5] and [6].
3.1 In-Situ Measurements
Hydra soil moisture sensors installed at 19 in-situ network sites in or near watershed (Figure 1) provide soil moisture data at 5 cm below ground surface every 30 minutes [5]. The Hydra probes measure the time domain using 6 cm length tines from which average dielectric constant is retrieved and dielectric constant is then converted to volumetric soil moisture based on calibration as a function of soil texture. Seven, three, one, and six in-situ network sites were included in EASE-Grids A, B, C, and D, respectively (Figure 1). However, most in-situ network sites were determined to be much drier than the regional mean soil moisture [5]. In this study, we used time stability analysis introduced by Vachaud et al. [25] to characterize time-invariant association between spatial location and statistical parametric values of a given soil property. If the concept demonstrates a constancy of spatial soil moisture patterns, then the number of observations may be minimized without considerable loss of information. Based on time stability analysis, sites RG50, RG32, and RG16 provide the best representative measurements for EASE-Grid A, B, and D, respectively (Figure 1). RG67, the only available network station, measured from 05/29/2003 to 07/13/2003, is used to represent EASE-Grid C (Figure 1).
3.2 Satellite Observations
The AMSR-E daily land surface products for the 25 km by 25 km EASE-Grids were obtained from the National Snow and Ice Data Center (NSIDC). The level-3 soil moisture product with a 25 km grid spacing and daily temporal resolution (1:30 pm EST overpass) was used in this study [19]. Detailed descriptions for the AMSR-E retrieval algorithms can be found from [19].
The MODIS instrument on the Terra satellite provides global observations of LAI every 1 to 2 days [20, 26]. The 8-day composite LAI products with a 1-km sinusoidal grid projection were obtained from the Earth Observing System (EOS) data gateway and regridded to match the EASE-Grids spatial resolution (25 km).
3.3 Modeled Soil Moisture
For this study, near surface soil moisture was modeled using the CLM. The CLM simulates land surface processes based on the energy and water balance solution integrated by an implicit time-integration scheme [8]. This study used hourly forcing data obtained from the North American Land Data Assimilation System (NLDAS) [7]. Spatial resolution of 15 km for NLDAS forcing were regridded to match the EASE-Grids spatial resolution (25 km). Soil model parameters were determined using soil texture characterized by sand and clay percentage. Land use types based on the International Geosphere-Biosphere Programme (IGBP) classification were used for vegetation parameterizations [8]. The initial subsurface soil temperature and moisture content values were obtained from the Soil Climate Analysis Network (SCAN) 2027 site in Grid D, located in southeast of the watershed (Figure 1). The regression relationship indicates reasonable agreement between the CLM and the in-situ surface soil moisture [6]. However, the CLM simulated soil moisture tended to be wetter than the observed soil moisture, particularly after rainfall events. This may be caused by scale mismatch between the single point in-situ measurements and the grid averaged soil moisture. A limitation of CLM's mosaic approach is that it can not identify actual geographical location of fluxes and stores [9]. The AMSR-E soil moisture values only weakly agree with in-situ measurements [6].
4. Approach for adjustment of temporal variability of AMSR-E
The CDF matching technique uses distributions from one source to correct the distribution from a second source [2, 4]. Here, it was used to correct extremely low temporal variability of the AMSR-E data using a modeled distribution (i.e., CLM distribution). Figure 2 shows that the CDF of the actual AMSR-E retrieved soil moisture has less variability than the CDF of either the ground-based measurements or the CLM soil moisture. Arrows on the dashed lines show how the actual AMSR-E soil moisture is corrected to scaled AMSR-E soil moisture by the CDF matching. After CDF matching, the scaled AMSR-E soil moisture shows a similar distribution pattern as that of the ground- based measurements and CLM soil moisture (Figure 2). The scaled (corrected) AMSR-E soil moisture can be derived as [21]
where cdfm is the cdf of the CLM soil moisture, cdfs is the cdf of the AMSR-E soil moisture, x is the actual AMSR-E retrieved soil moisture, and x' is the scaled (corrected) AMSR-E soil moisture.
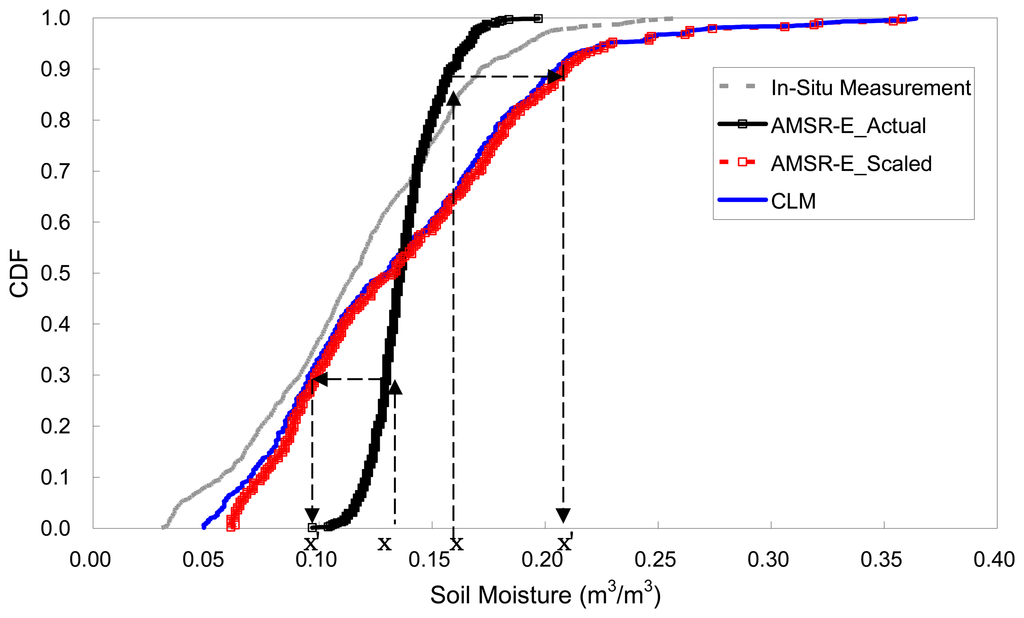
Figure 2.
CDF estimation at EASE-Grid A.
The RSM is applied to correct temporal variability of the AMSR-E products as well as the CDF matching technique. The scaled (corrected) AMSR-E soil moisture can be derived as [14]
where Z(j,i) is the scaled AMSR-E soil moisture for day j of month i, x(j,i) is the original AMSR-E soil moisture products for day j of month i, x̄i and σ(xi) are the mean and standard deviation of the AMSR-E soil moisture in month i, and ȳi and σ(yi) are the corresponding mean and standard deviation of the CLM soil moisture in month i.
5. Result and Discussions
AMSR-E soil moisture retrievals are unreliable for dense canopies due to increased attenuation with increasing vegetation due to their greater vegetation water content [19]. Njoku [19] pointed out soil moisture retrievals from the AMSR-E microwave bands were not sensitive in high vegetation regions due to this attenuation by vegetation density. The CDF matching and RSM analyses were applied separately for the complete 2003 period and the 2003 non-growing season which is the period having less sensitive soil moisture retrievals. The non-growing season was determined from the relationship between AMSR-E and MODIS LAI products. In previous soil moisture studies, the LAI product has provided excellent temporal vegetation information necessary to characterize vegetation [3] and has the advantage of being strongly physically-based [1].
Monthly AMSR-E soil moisture variations were calculated and compared to monthly average LAI values (Figure 3). Generally, soil moisture variations decreased as LAI increased. The threshold LAI value to identify growing season of cotton and peanut is estimated to be 1.5 for this study. This finding is also supported by a visual inspection of AMSR-E soil moisture and MODIS LAI time series plot for 2003. While the limitations of this LAI threshold are self-evident, for the local threshold provides a quantitative means to identify the growing season.
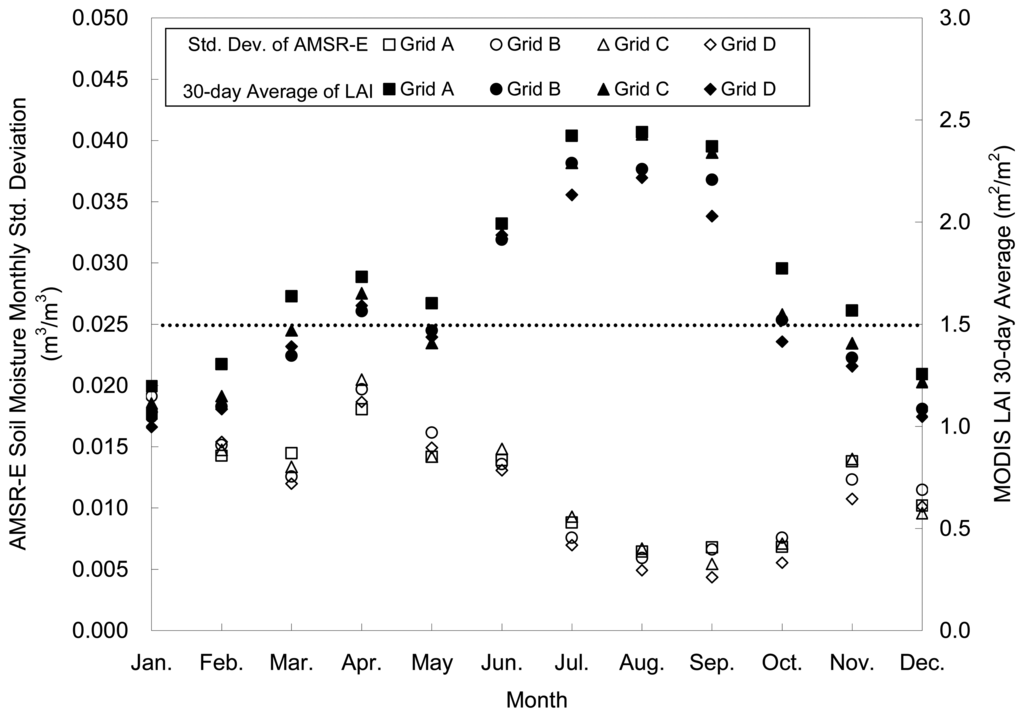
Figure 3.
Relationship between monthly variability of AMSR-E soil moisture and 30-day average of MODIS LAI for 2003.
Given the attenuated AMSR-E's soil moisture response corresponding with vegetation density exceeding 1.5, the statistical correction methods were analyzed separately for entire year of 2003 and non-growing period of 2003 (i.e., January to April and November to December, 2003). This finding is supported by Jacobs and Sudheer [13]. They pointed out that typical crop growth season of cotton and peanut in Georgia region is from May to October [13].
Table 2 compares the actual and the corrected AMSR-E values to the measured values by grid. Both correction methods greatly improved the regression constants (i.e., slope A close to 1.0 and intercept B close to zero). For the entire year, the regression constants, A and B, were improved from 0.141 and 0.121 up to 0.791 and 0.051, respectively for 2003. The R2 values also improved modestly.
Table 2.
Results of statistical correction methods with the original constants across the EASE-Grids (Note: Y =Ax + B, x = Ground based measurements and y = AMSR-E).
Removing periods with a limited AMSR-E response from the analysis greatly improved the results. The A, B, and R2 were improved with ranges up to 0.658-0.971, 0.046--0.005, and 0.306-0.468, respectively during non-growing season. The present results indicate that MODIS vegetation products may be productively used in combination with the AMSR-E datasets. Additionally, these findings suggest that evaluating the improvement to AMSR-E values during periods with known signal attenuation will likely distort the methods' value.
While both statistical correction methods did an excellent job improving enhanced the AMSR-E soil moisture products, the RSM had stronger correlations across the EASE-Grids (Table 2). The A, B, and R2 were better estimated by the RSM. Figure 4 illustrates the relative improvement possible using the RSM corrected AMSR-E values as compared to the actual AMSR-E values. Figure 5 shows that the time series of RSM corrected AMSR-E values are much better aligned with the measured series than the actual AMSR-E values. However, RSM corrected AMSR-E values tend to be wetter than ground-based measurements due to a wet bias of the modeled CLM soil moisture. Our results clearly shows that statistical correction techniques can be used to appropriately adjust AMSR-E's limited temporal variability using modeled soil moisture.
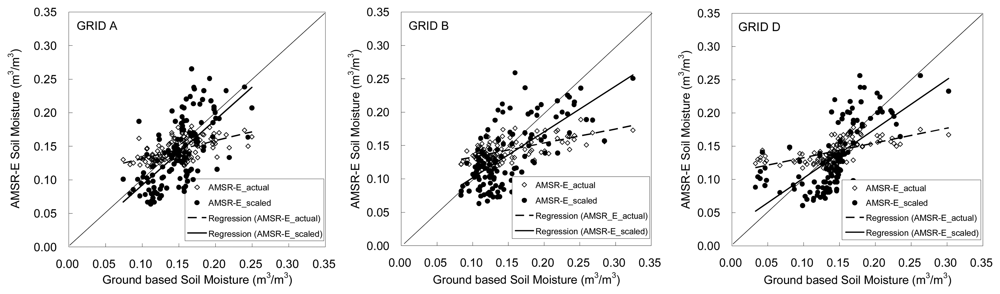
Figure 4.
The actual AMSR-E and the RSM corrected AMSR-E soil moisture values compared with ground based measurements for non-growing period by EASE-Grid.
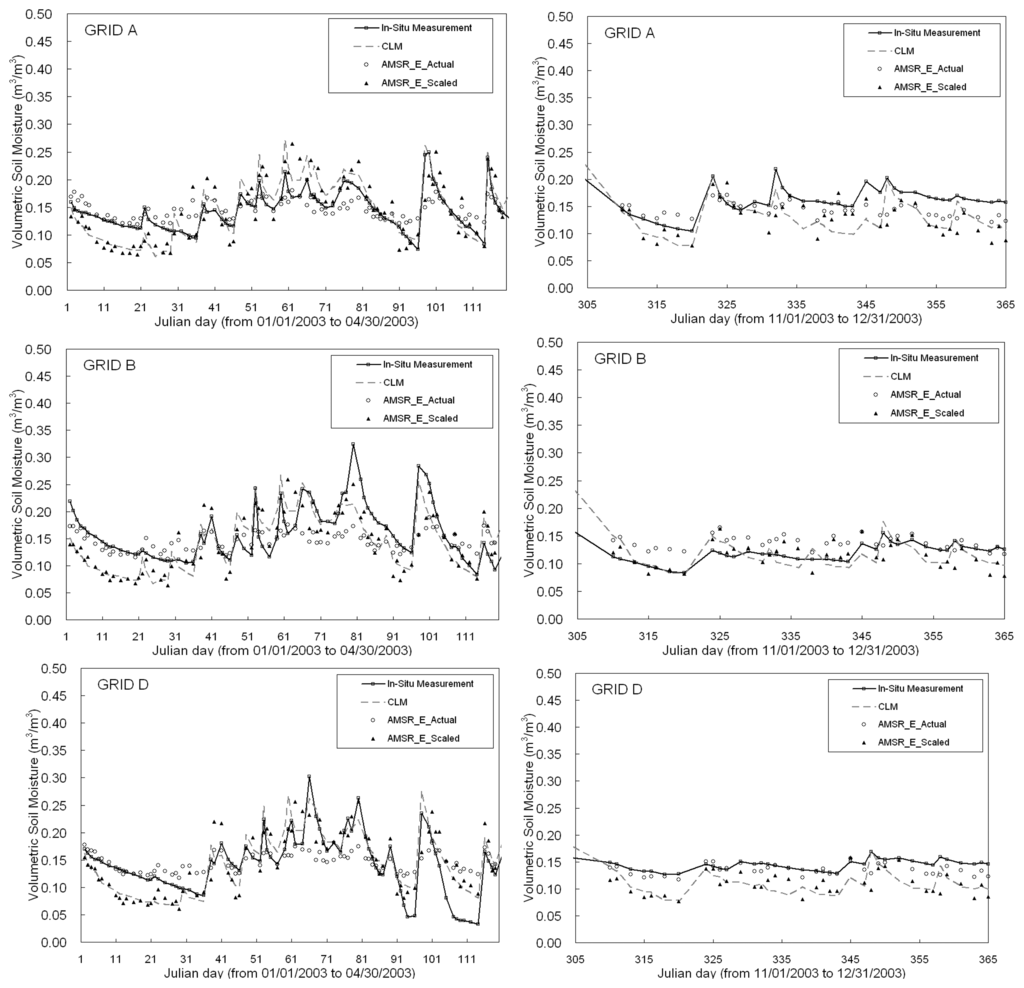
Figure 5.
Time series of the actual AMSR-E and the RSM corrected AMSR-E soil moisture values compared with ground based measurements and CLM for non-growing period by EASE-Grid.
6. Conclusion
In this study, we used the statistical correction methods, CDF matching technique and RSM, to improve limited temporal variability of the AMSR-E products at SMEX03 region. We found that these simple statistical correction methods associated with the CLM improved the low temporal variation of the AMSR-E products in dynamic vegetation regions. Further, we found that the statistical correction analysis results differ greatly when periods having an attenuated microwave brightness signal are identified using vegetation density information from satellites (i.e., LAI) and removed from the analysis. Clear identification of such periods will aid our ability to appropriately apply the retrieved soil moisture products as well as to study means to enhance retrieved products using model derived statistics.
Acknowledgments
Support for this study was provided by the NASA Grant (NNG04GL60G) and NSF Grant (NSF-EAR -0337277).
References
- Allen, R.; Tasumi, M.; Trezza, R. Mapping Evapotranspiration at High Resolution. In Application Manual; University of Idaho, 2007. [Google Scholar]
- Anagnostou, E.N.; Negri, A.J.; Adler, R.F. Statistical adjustment of satellite microwave monthly rainfall estimates over Amazonia. Journal of Applied Meteorology 1999, 38, 1590–1598. [Google Scholar]
- Anderson, M.C.; Norman, J.M.; Mecikalski, J.R.; Otkin, J.A.; Kustas, W.P. A climatological study of evapotranspiration and moisture stress across the continental United States based on thermal remote sensing: 1. Model formulation. Journal of Geophysical Research 2007, 112, D10117. [Google Scholar] [CrossRef]
- Atlas, D.; Rosenfeld, D.; Wolff, D.B. Climatologically tuned reflectivity-rain rate relations and links to area-time lntegrals. Journal of Applied Meteorology 1990, 29, 1120–1135. [Google Scholar]
- Bosch, D.D.; Lakshmi, V.; Jackson, T.J.; Choi, M.; Jacobs, J.M. Large scale measurements of soil moisture for validation of remotely sensed data: Georgia soil moisture experiment of 2003. Journal of Hydrology 2006, 323, 120–137. [Google Scholar]
- Choi, M.; Jacobs, J.M.; Bosch, D.D. Remote sensing observatory validation of surface soil moisture using Advanced Microwave Scanning Radiometer E, Common Land Model, and ground based data: Case study in SMEX03 Little River Region, Georgia, U.S. Water Resources Research. In Press.
- Cosgrove, B.A.; Lohmann, D.; Mitchell, K.E.; Houser, P.R.; Wood, E.F.; Schaake, J.C.; Robock, A.; Marshall, C.; Sheffield, J.; Duan, Q.; Luo, L.; Higgins, R.W.; Pinker, R.T.; Tarpley, J.D.; Meng, J. Real-time and retropective forcing in the North American Land Data Assimilation System (NLDAS) project. Journal of Geophysical Research 2003, 108(D22), 8842. [Google Scholar] [CrossRef]
- Dai, Y.; Zeng, X.; Dickinson, R.E.; Baker, I.; Bonan, G.B.; Bosilovich, M.G.; Denning, A.S.; Dirmeyer, P.A.; Houser, P.R.; Niu, G.; Oleson, K.W.; Schlosser, C.A.; Yang, Z.L. The Common Land Model. Bulletin of the American Meteorological Society 2003, 84(8), 1013–1023. [Google Scholar]
- Georgi, F.; Avissar, R. Representation of heterogeneity effects in earth system modeling: experience from land surface modeling. Rev. Geophys. 1997, 35(4), 413–438. [Google Scholar]
- Hirsch, R.M. An evaluation of some record reconstruction techniques. Water resources research 1979, 15(6), 1781–1790. [Google Scholar]
- Jackson, T.J. Measuring surface soil moisture using passive microwave remote sensing. Hydrological processes 1993, 7, 139–152. [Google Scholar]
- Jackson, T.J.; Schmugge, T.J. Surface soil moisture measurement with microwave radiometry. Acta Astronautica 1995, 35(7), 477–482. [Google Scholar]
- Jacobs, J.M.; Satti, S.R. AFSIRS Evaluation of Gerogia Crop Water Use; Project No. 45-04-789; Northwest Florida Water Management District: Haven, Florida, 2001. [Google Scholar]
- Maidment, D. R. Handbook of Hydrology; 1992; McGRAW-HILL, INC. [Google Scholar]
- Margulis, S.A.; McLaughlin, D.; Entekhabi, D.; Dunne, S. Land data assimilation and estimation of soil moisture using measurements from the southern great plains 1997 field experiment. Water resources research 2002, 38(12). No. 1299. [Google Scholar] [CrossRef]
- Miller, D.A.; White, R.A. A Conterminous United States Multi-Layer Soil Characteristics Data Set for Regional Climate and Hydrology Modeling. Earth Interactions 1998, 2, 1–26. [Google Scholar]
- Mohr, K.I.; Famiglietti, J.S.; Boone, A.; Starks, P.J. Modeling soil moisture and surface flux variability with an untuned land surface scheme: A case study from the Southern Great Plains 1997 Hydrology Experiment. Journal of hydrometeorology 2000, 1, 154–169. [Google Scholar]
- Nawaz, N.R.; Adeloye, A.J. Evaluation of monthly runoff estimated by a rainfall-runoff regression model for reservoir yield assessment. Hydrological Sciences-Journal-des Sciences Hydrologiques 1999, 44(1), 113–134. [Google Scholar]
- Njoku, E.G.; Jackson, T.J.; Lakshmi, V.; Chan, T.K.; Nghiem, S.V. Soil moisture retrieval from AMSR-E. IEEE transactions on Geoscience and remote sensing 2003, 41(2), 215–229. [Google Scholar]
- Privette, J.L.; Myneni, R.B.; Knyazikhin, Y.; Mukelabai, M.; Roberts, G.; Tian, Y.; Wang, Y.; Leblanc, S.G. Early spatial and temporal validation of MODIS LAI product in the Southern Africa Kalahari. Remote Sensing of Environment 2002, 83, 232–243. [Google Scholar]
- Reichle, R.; Koster, R. Bias reduction in short records of satellite soil moisture. Geophysical Research Letters 2004, 31, L19501. [Google Scholar] [CrossRef]
- Reichle, R.; Koster, R.; Dong, J.; Berg, A. Global soil moisture from satellite observations, land surface models, and ground data: implication for data assimilation. Journal of Hydrometeorology 2004, 5, 430–442. [Google Scholar]
- Sahoo, A.K.; Zhan, X.; Arsenault, K.; Kafatos, M. Cross-validation of soil moisture data from AMSR-E using field observations and NASA's land data assimilation system simulations. American Meteorological Society(AMS) 2006. meeting proceeding paper. [Google Scholar]
- Schmugge, T.J.; Kustas, W.P.; Ritchie, J.; Jackson, T.J.; Rango, A. Remote sensing in hydrology. Advances in Water Resources 2002, 25, 1367–1385. [Google Scholar]
- Vauchaud, G.; Passerat de Silans, A.; Balabanis, P.; Vauclin, M. Temporal stability of spatially measured soil water probability density function. Soil Sci. Soc. Am. J. 1985, 49, 822–828. [Google Scholar]
- Wang, Q.; Tenhunen, J.; Dinh, N.Q.; Reichstein, M.; Otieno, D.; Granier, A.; Pilegarrd, K. Evaluation of seasonal variation of MODIS derived leaf area index at two European deciduous broadleaf forest sites. Remote Sensing of Environment 2005, 96, 475–484. [Google Scholar]
- Zhan, X.; Jackson, T.J.; Arsenault, K.; Houser, P. An investigation of the differences between AMSR-E soil moisture retrievals, LDAS model simulations and SMEX field measurements. Eos Trans. AGU 2006, 87(36). Jt, Assem, Suppl., Abstract H34B-03. [Google Scholar]
© 2008 by MDPI (http://www.mdpi.org). Reproduction is permitted for noncommercial purposes.