Nucleoside Sensing

Abstract
:1. Introduction
2. Results and Discussion
3. Experimental Section
- a)
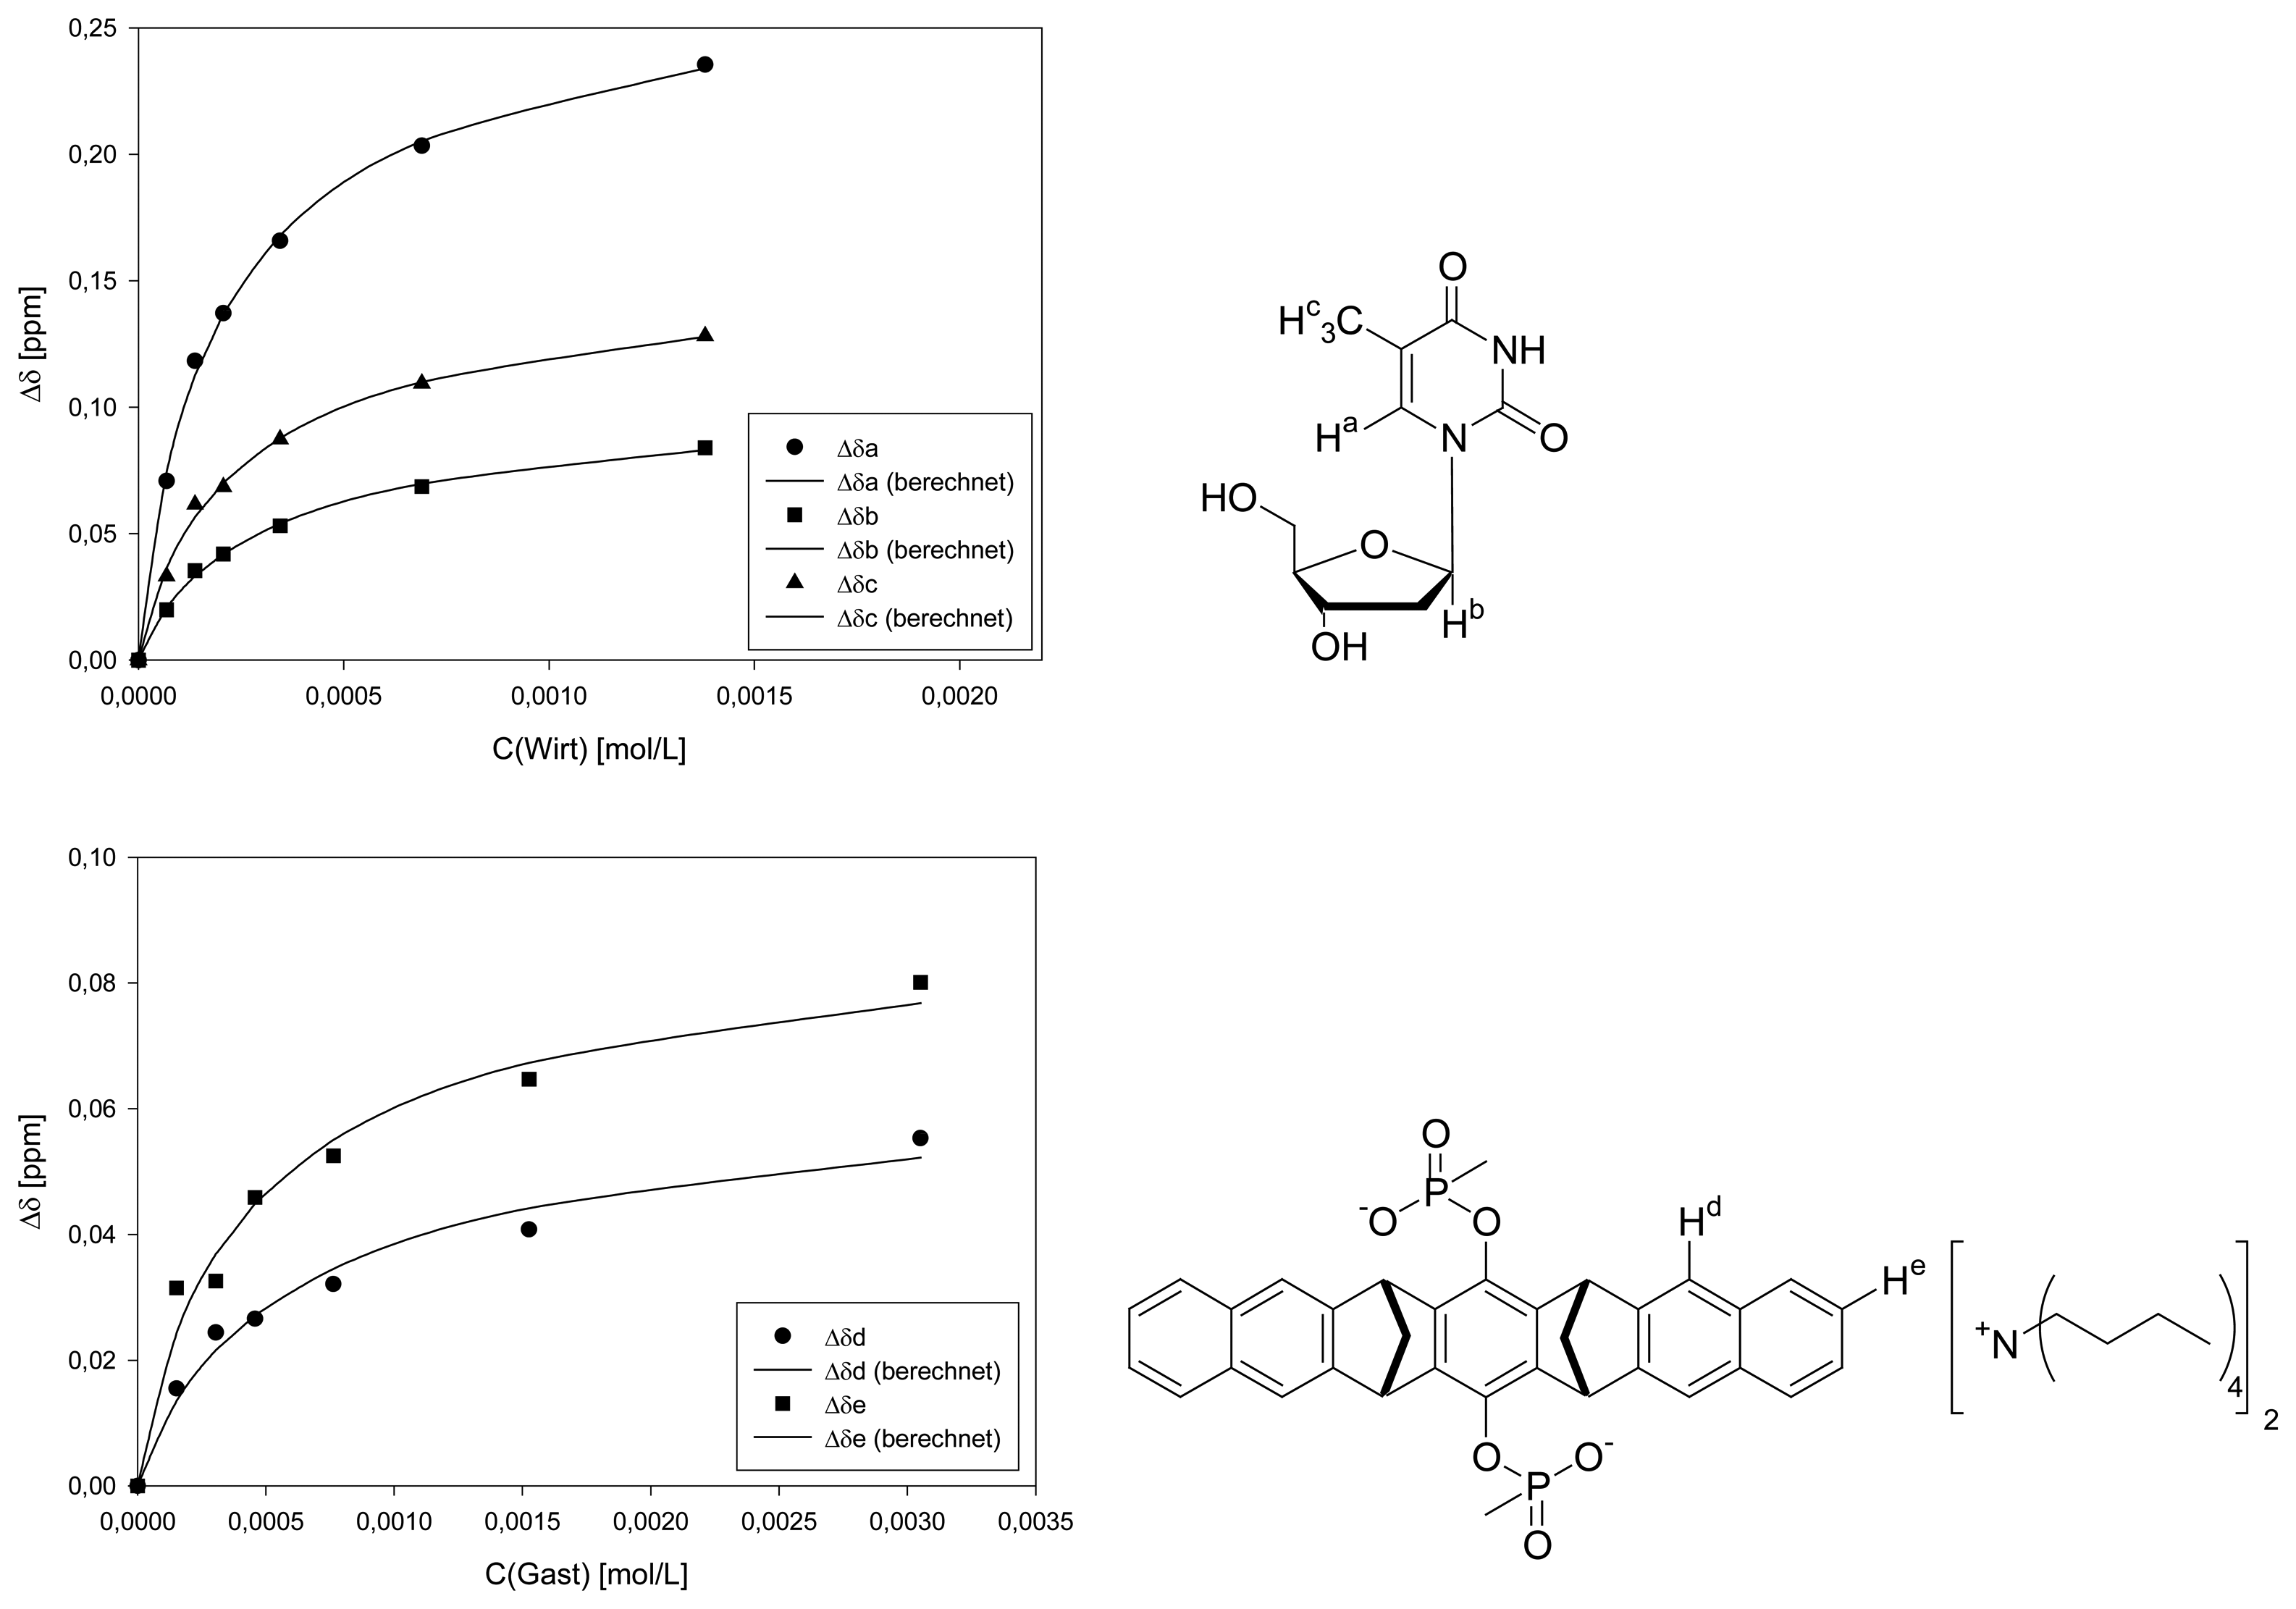
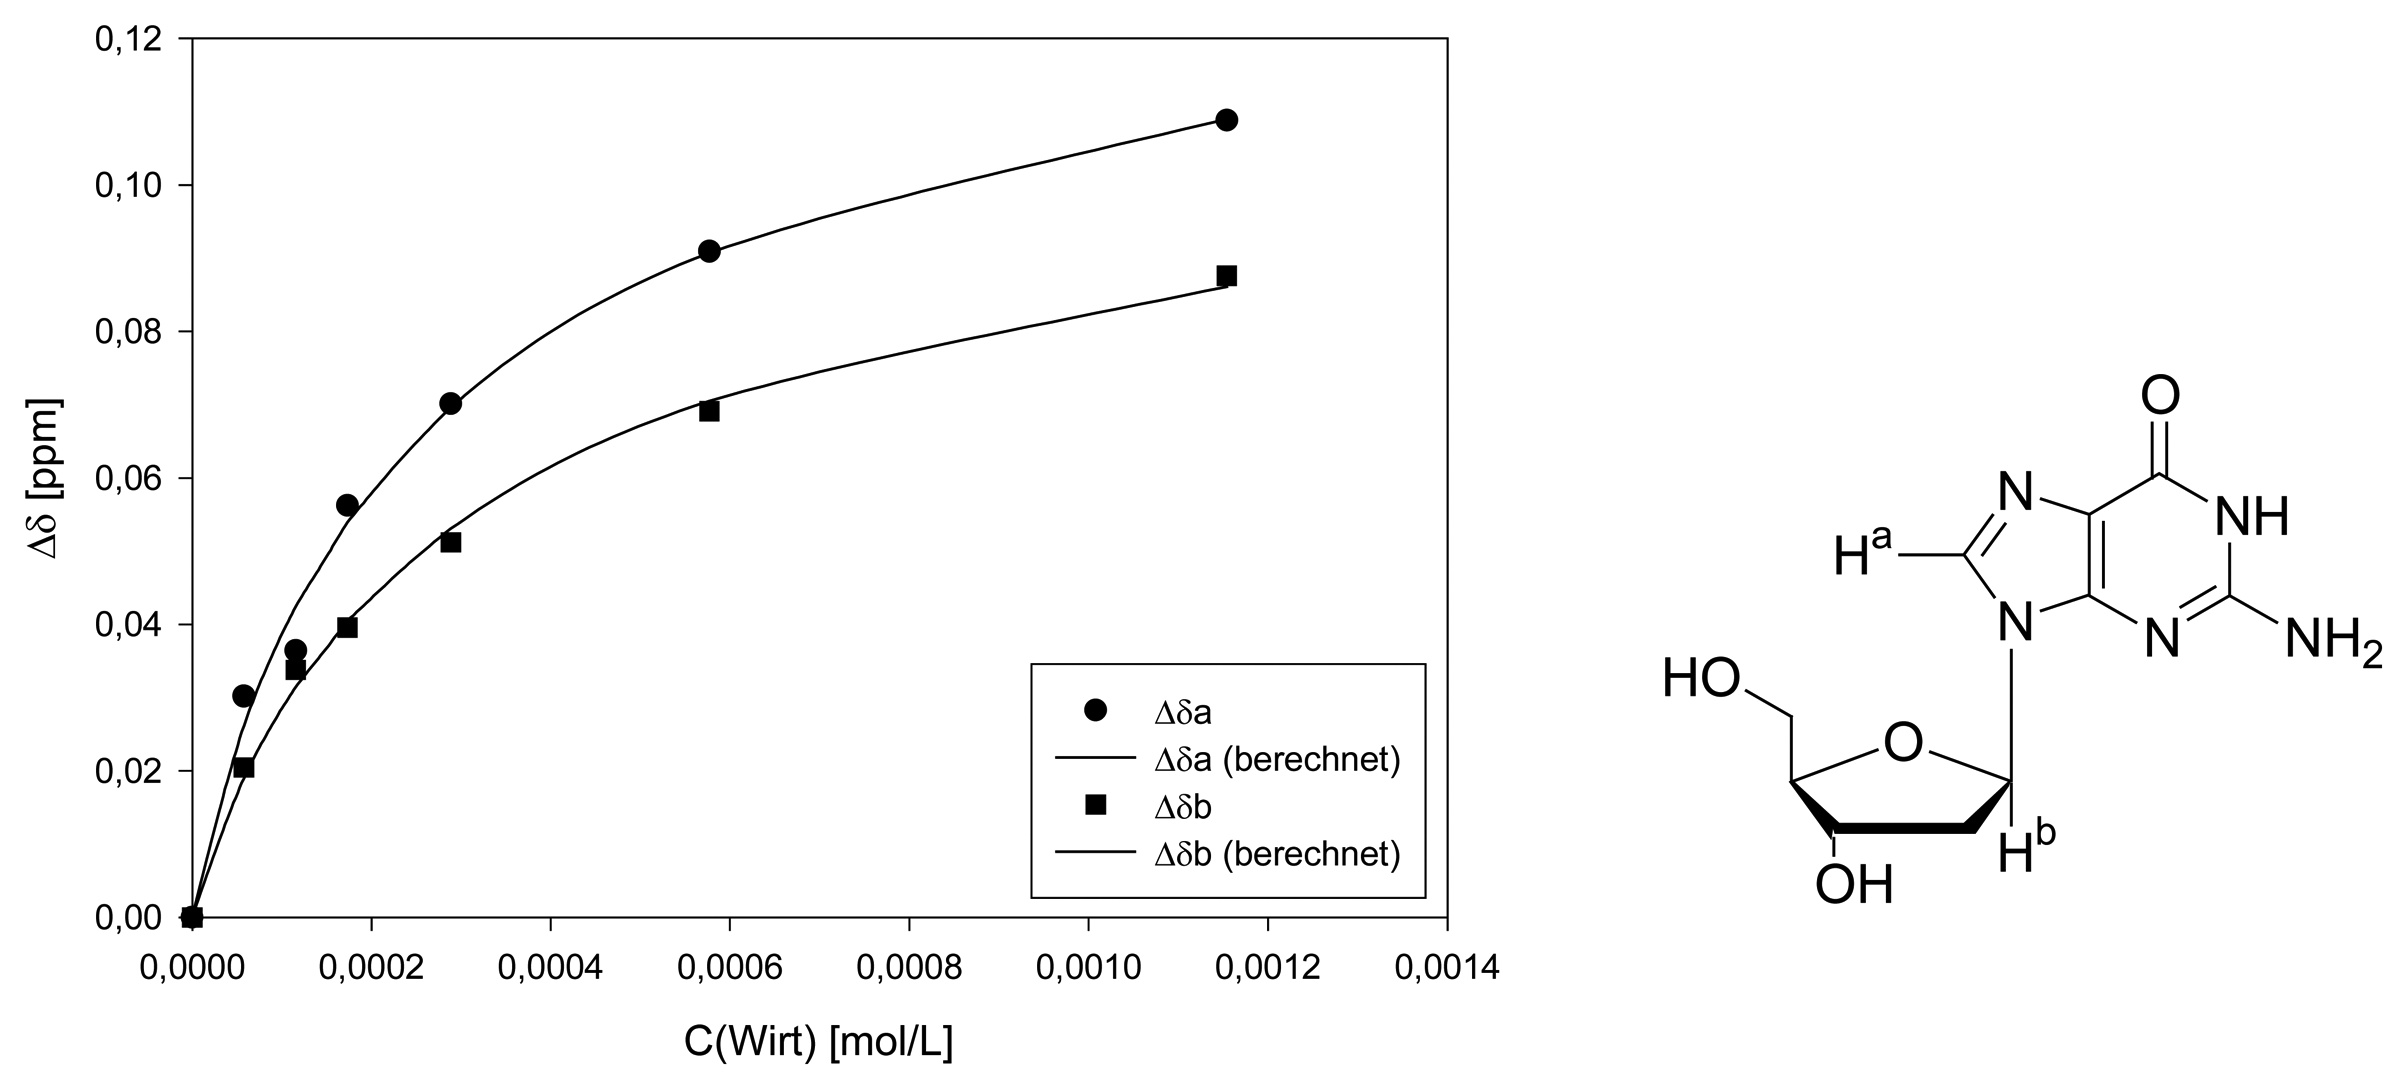
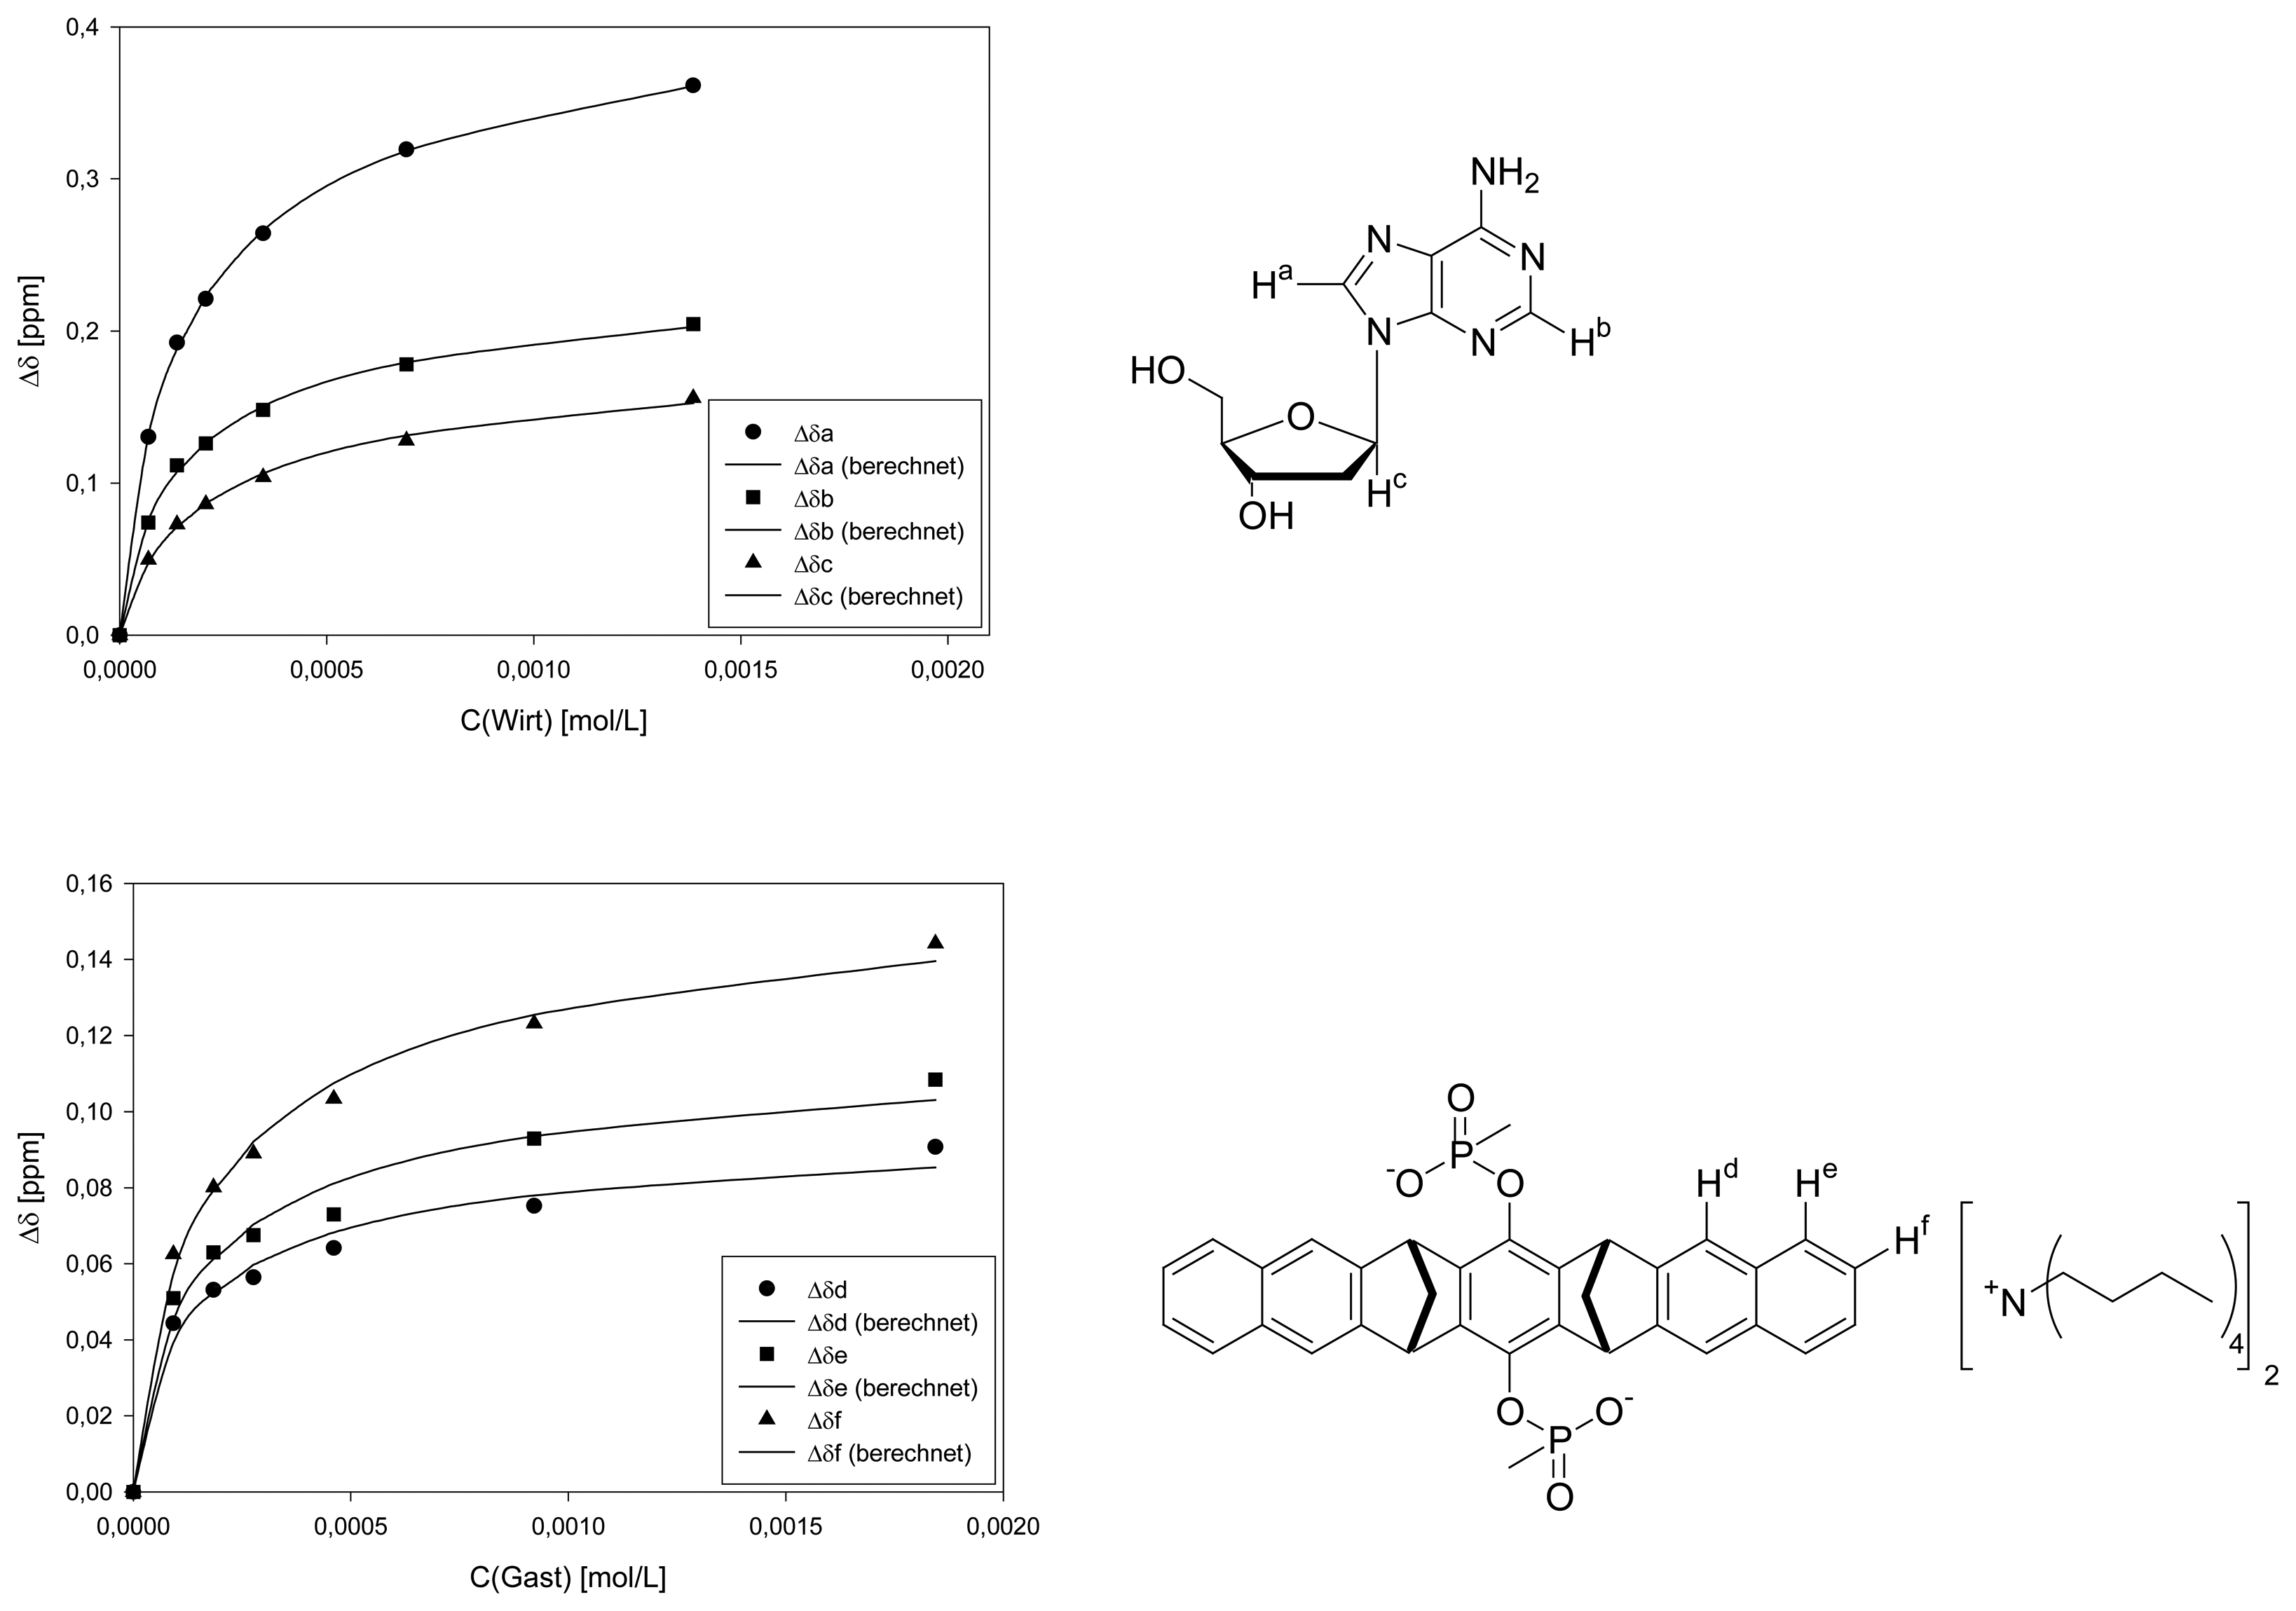
- dilution titration: host and guest were dissolved as a 1:1 mixture in D2O and an NMR spectrum was measured. Subsequently, the solution was diluted several times with D2O. Pure host as well as pure guest solutions of varying concentrations were also measured and compared with respect to their proton shifts. Only those proton signals which are insensitive towards dilution, can be used as probes. All NMR spectra were routinely calibrated onto the rest proton signal of the deuterated solvent (D2O: 4.700 ppm). The corresponding binding constants and Δδsat values were obtained by standard nonlinear regression.
- b)
- conventional titration: ten NMR tubes were filled each with the same amount of a solution of the guest in D2O. The host solution (D2O) was added in increasing volume increments to tubes 2-10. All tubes were subsequently filled with pure solvent to the very same total volume to exclude potential dilution effects. Tube 1 served as the reference. The guest concentration was estimated at the reciprocal value of the expected association constant (Kd). NMR spectra were calibrated onto the rest proton signal of the deuterated solvent (D2O: 4.700 ppm). The corresponding binding constants and Δδsat values were obtained by standard nonlinear regression.
Job plots
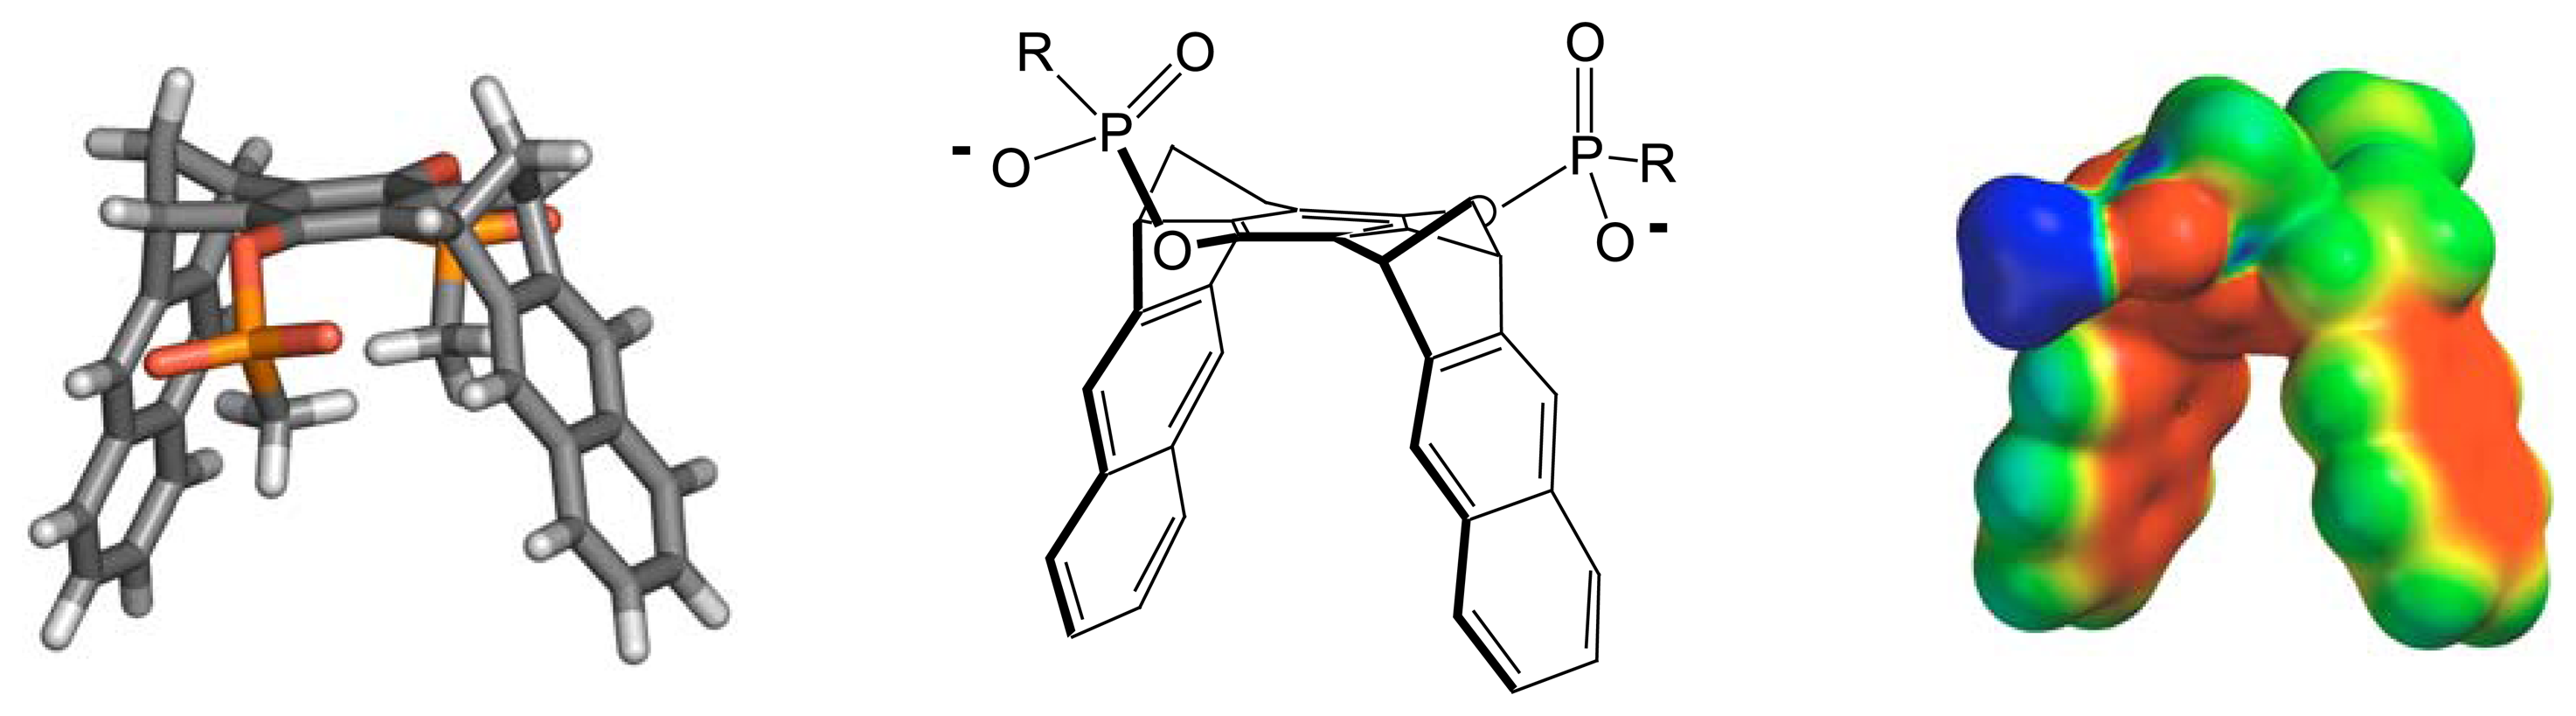
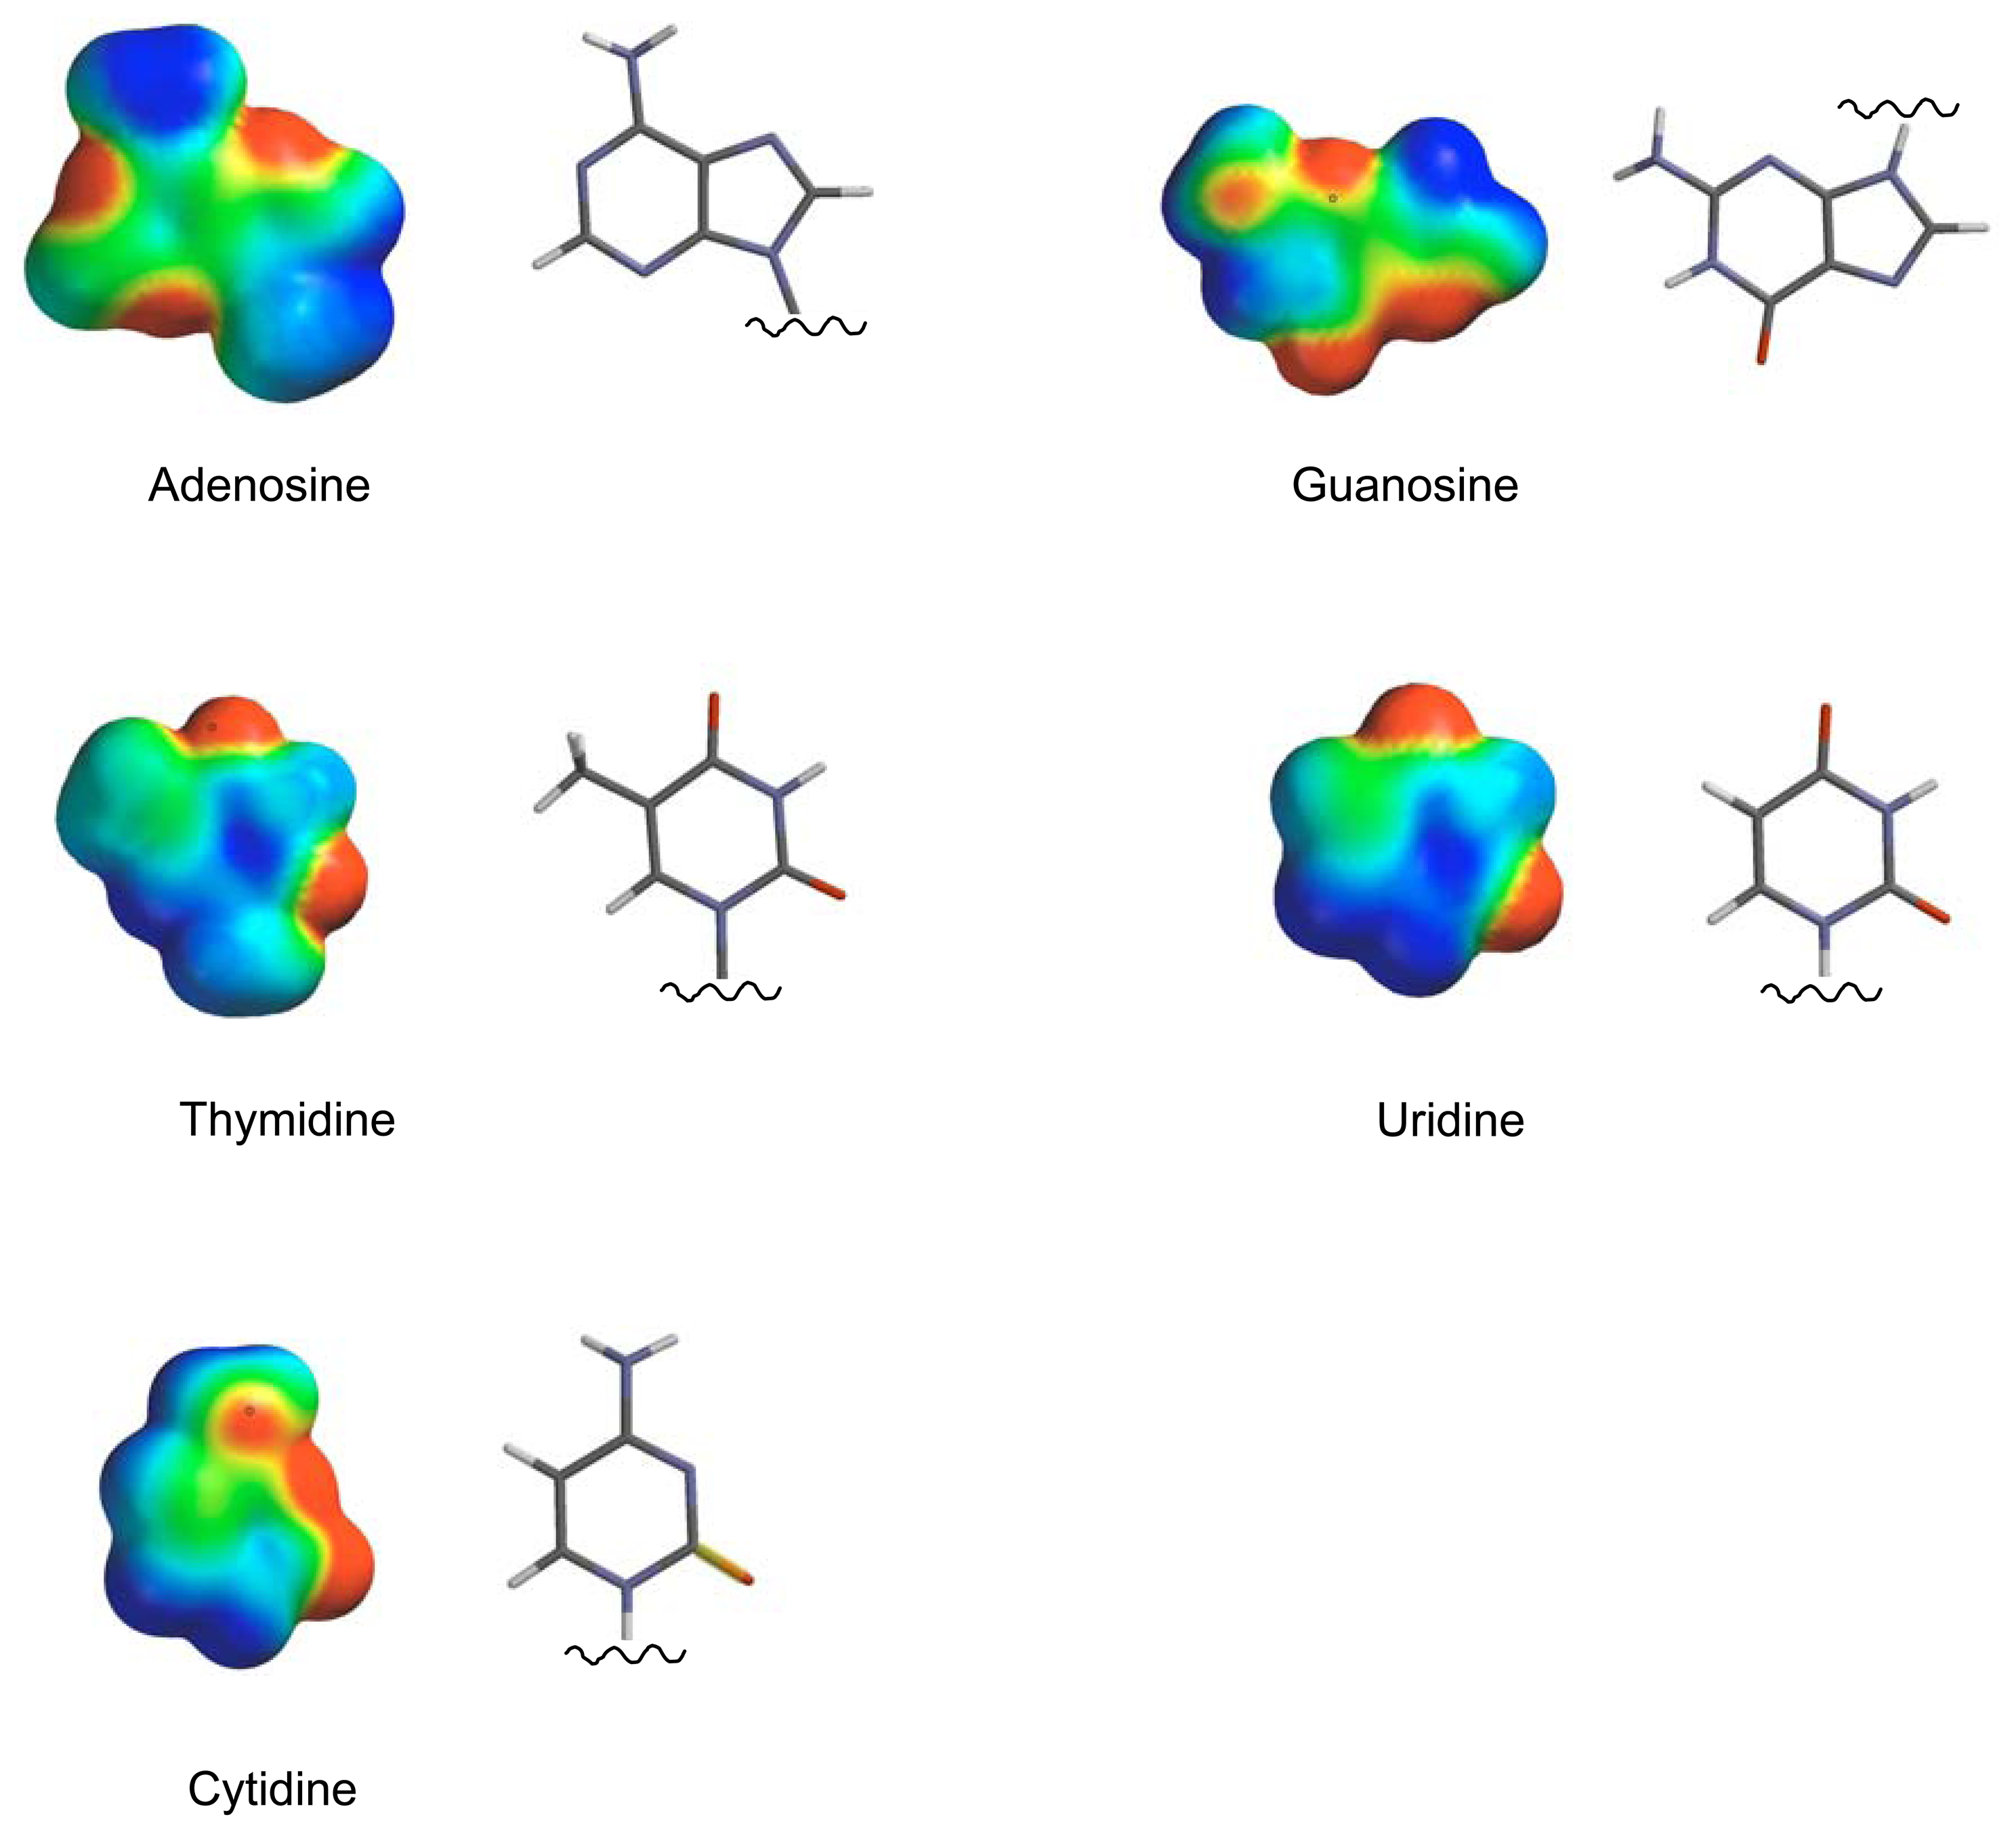
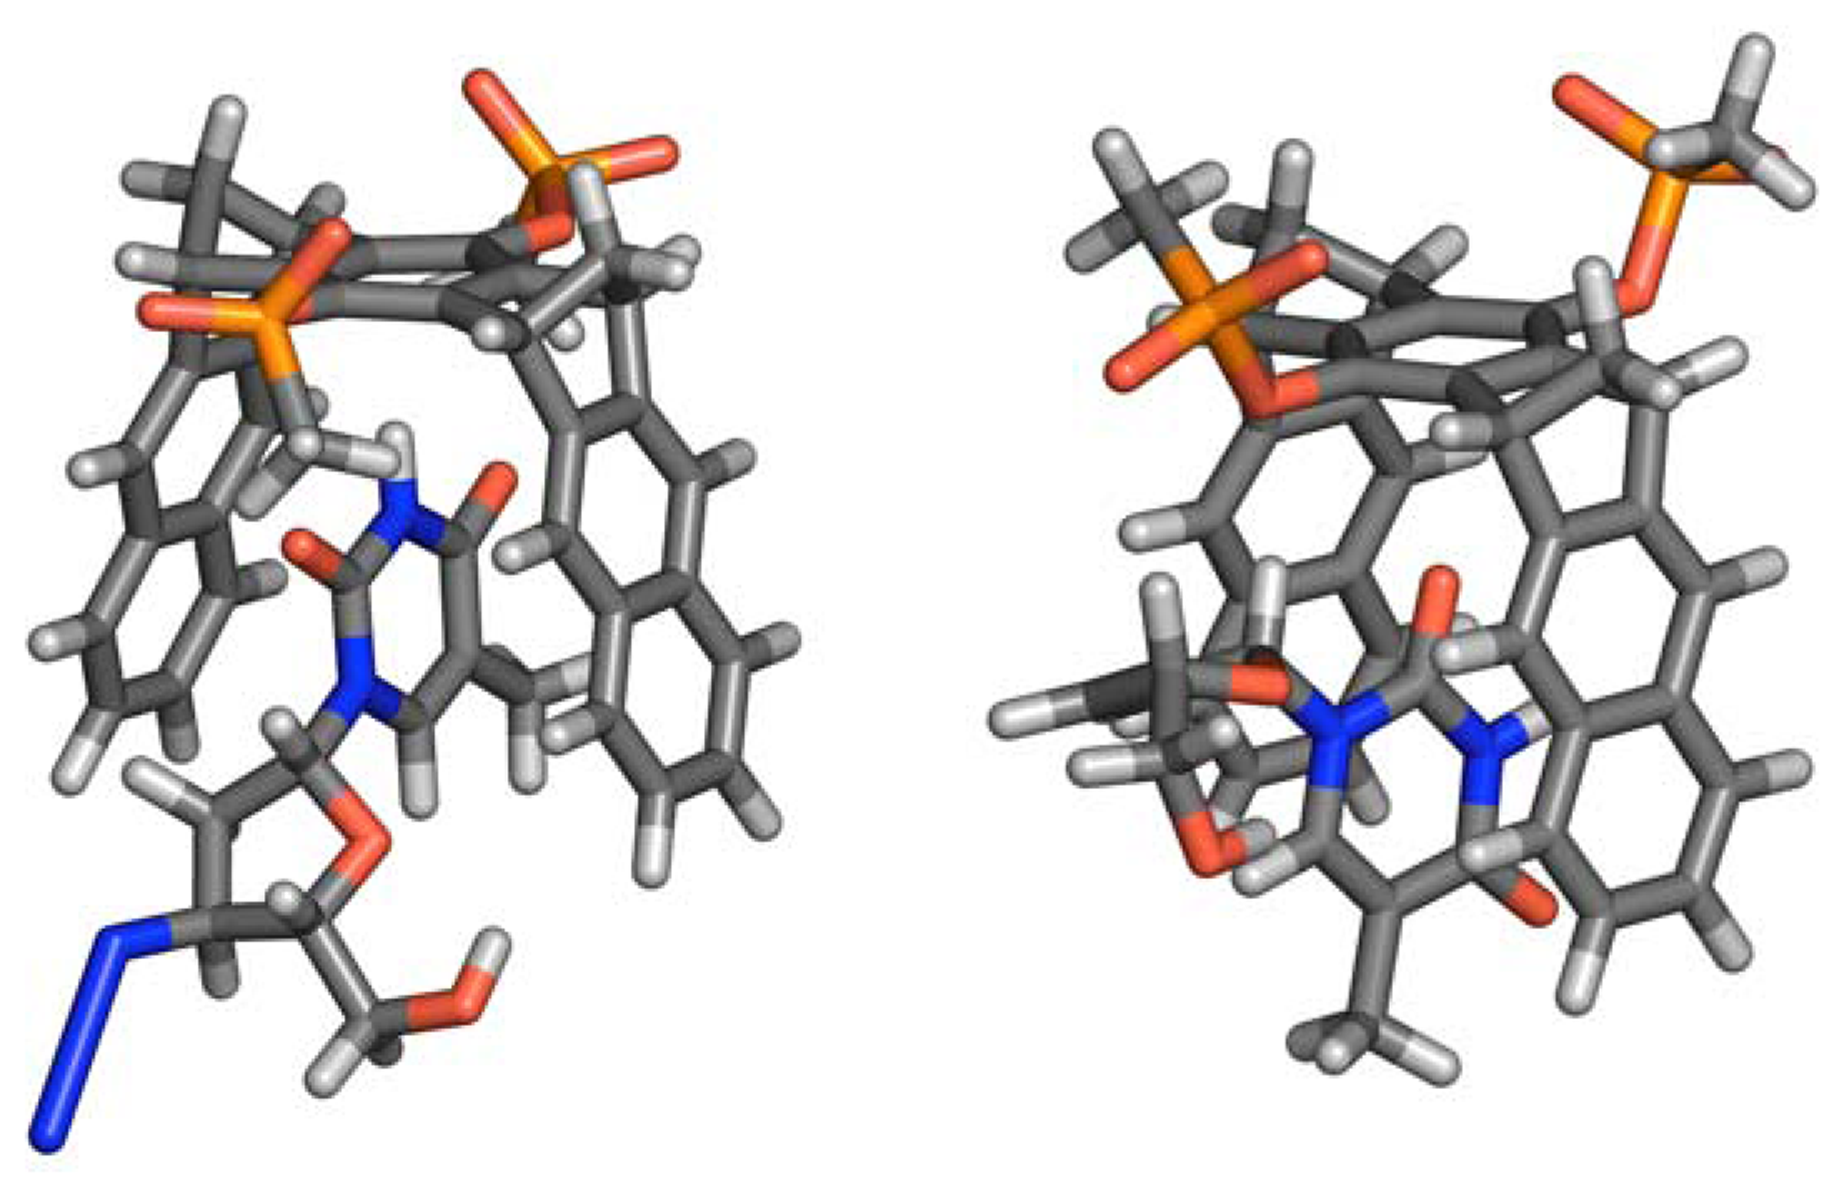
Molecular Modeling
Acknowledgments
Supplementary Information
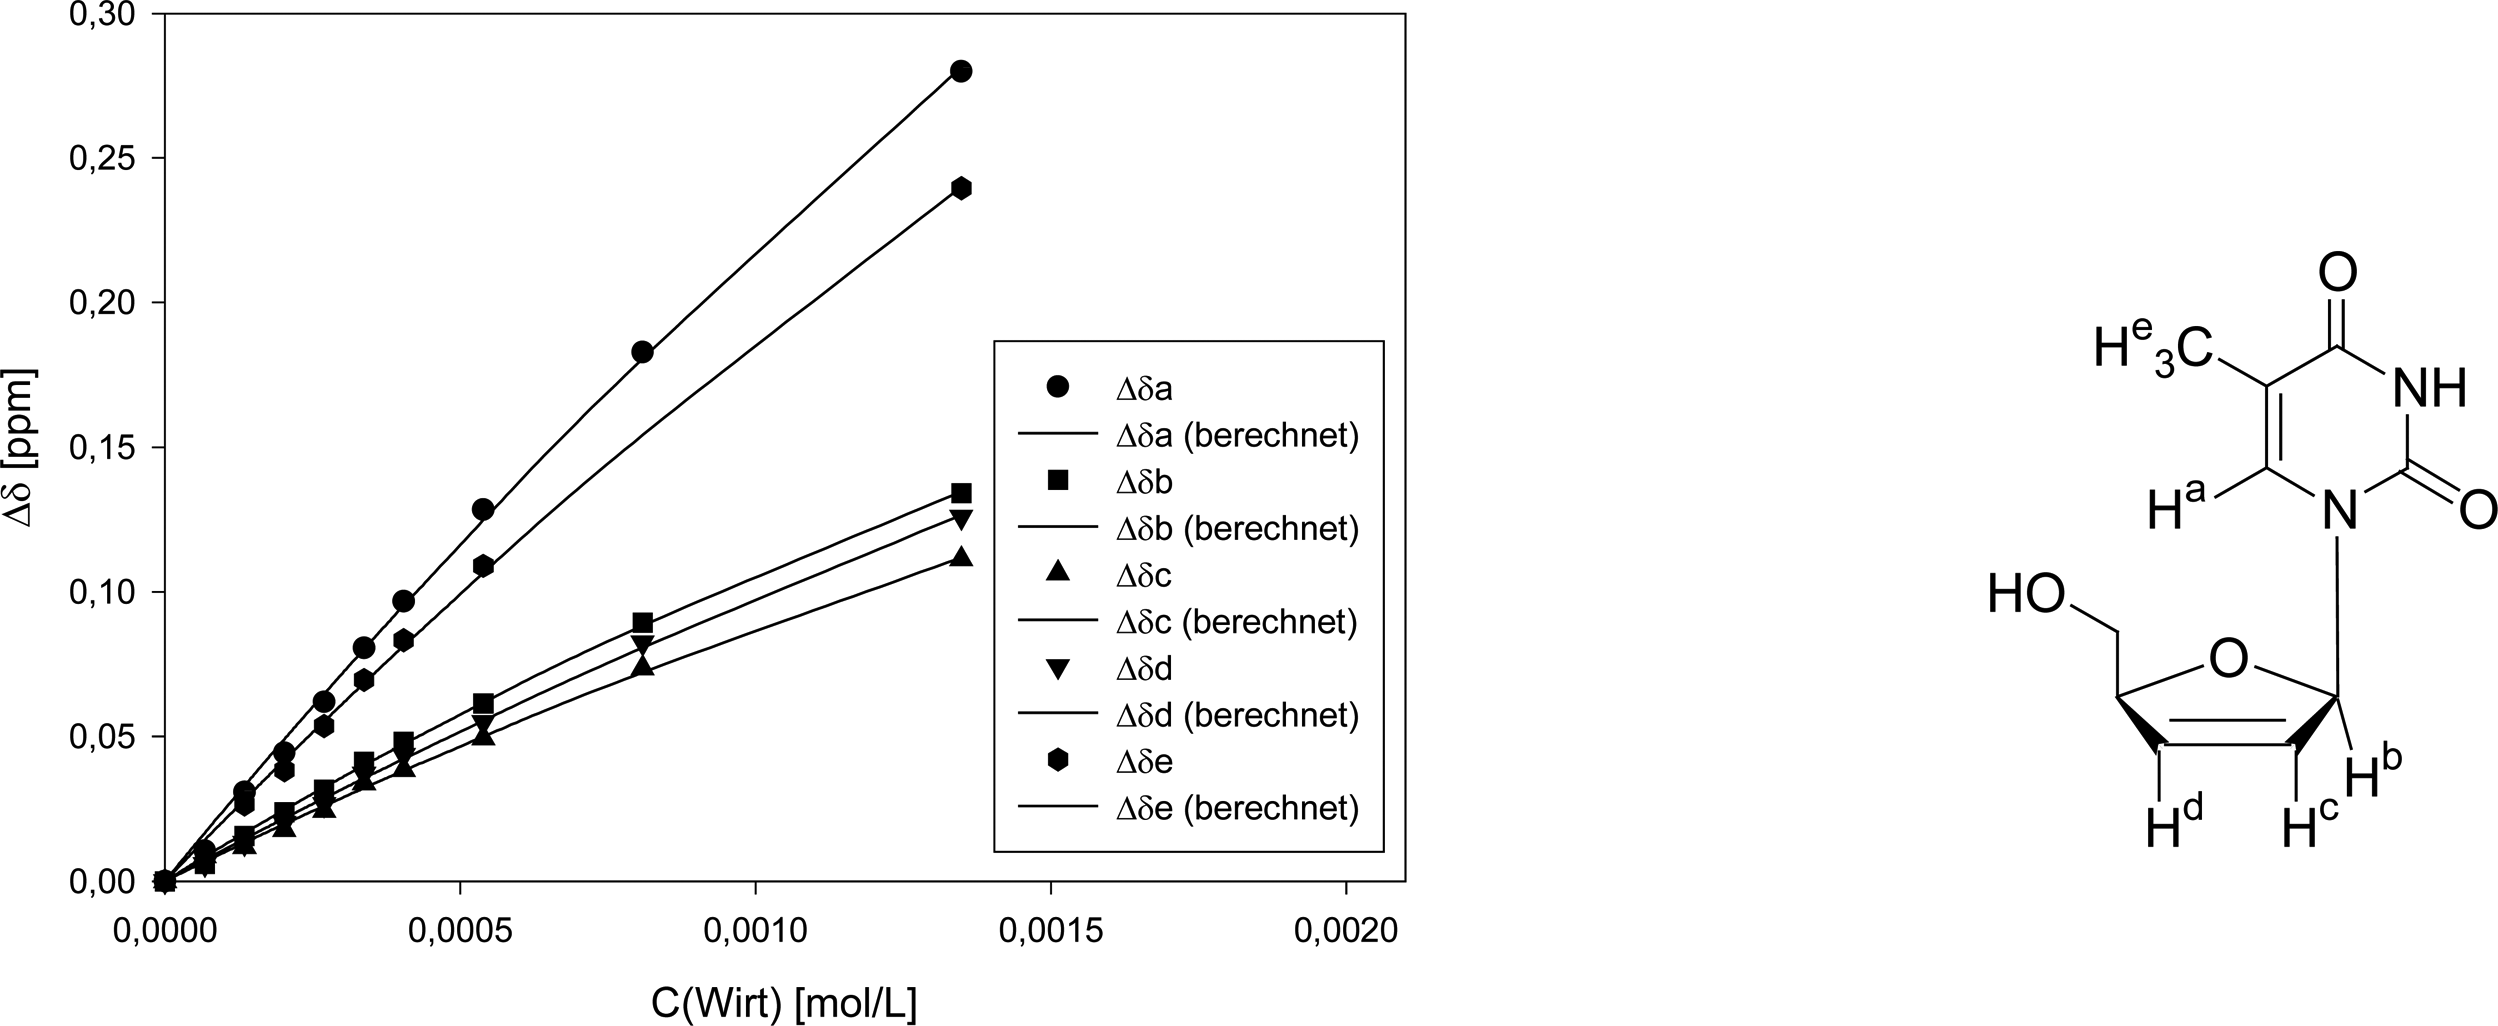
Dilution titration between clip 1 and 2′-deoxythymidine

| entry | Vparent solution (μL) | Vtotal (μL) | cguest (mol/L) | chost (mol/L) | δa (ppm) | δb (ppm) | δc (ppm) | δd (ppm) | δe (ppm) |
|---|---|---|---|---|---|---|---|---|---|
| 0 | reference | 500 | 3.05·10-3 | 1.38·10-3 | 7.6106 | 6.2600 | 1.8545 | 7.6747 | 7.3326 |
| 1 | 25 | 500 | 1.53·10-4 | 6.90·10-5 | 7.5398 | 6.2401 | 1.8213 | 7.6592 | 7.3011 |
| 2 | 50 | 500 | 3.05·10-4 | 1.38·10-4 | 7.4923 | 6.2246 | 1.7929 | 7.6503 | 7.3000 |
| 3 | 75 | 500 | 4.58·10-4 | 2.07·10-4 | 7.4735 | 6.2180 | 1.7860 | 7.6481 | 7.2867 |
| 4 | 125 | 500 | 7.63·10-4 | 3.45·10-4 | 7.4448 | 6.2069 | 1.7672 | 7.6426 | 7.2801 |
| 5 | 250 | 500 | 1.53·10-3 | 6.90·10-4 | 7.4072 | 6.1914 | 1.7451 | 7.6339 | 7.2679 |
| 6 | 500 | 500 | 3.05·10-3 | 1.38·10-3 | 7.3751 | 6.1760 | 1.7263 | 7.6194 | 7.2525 |
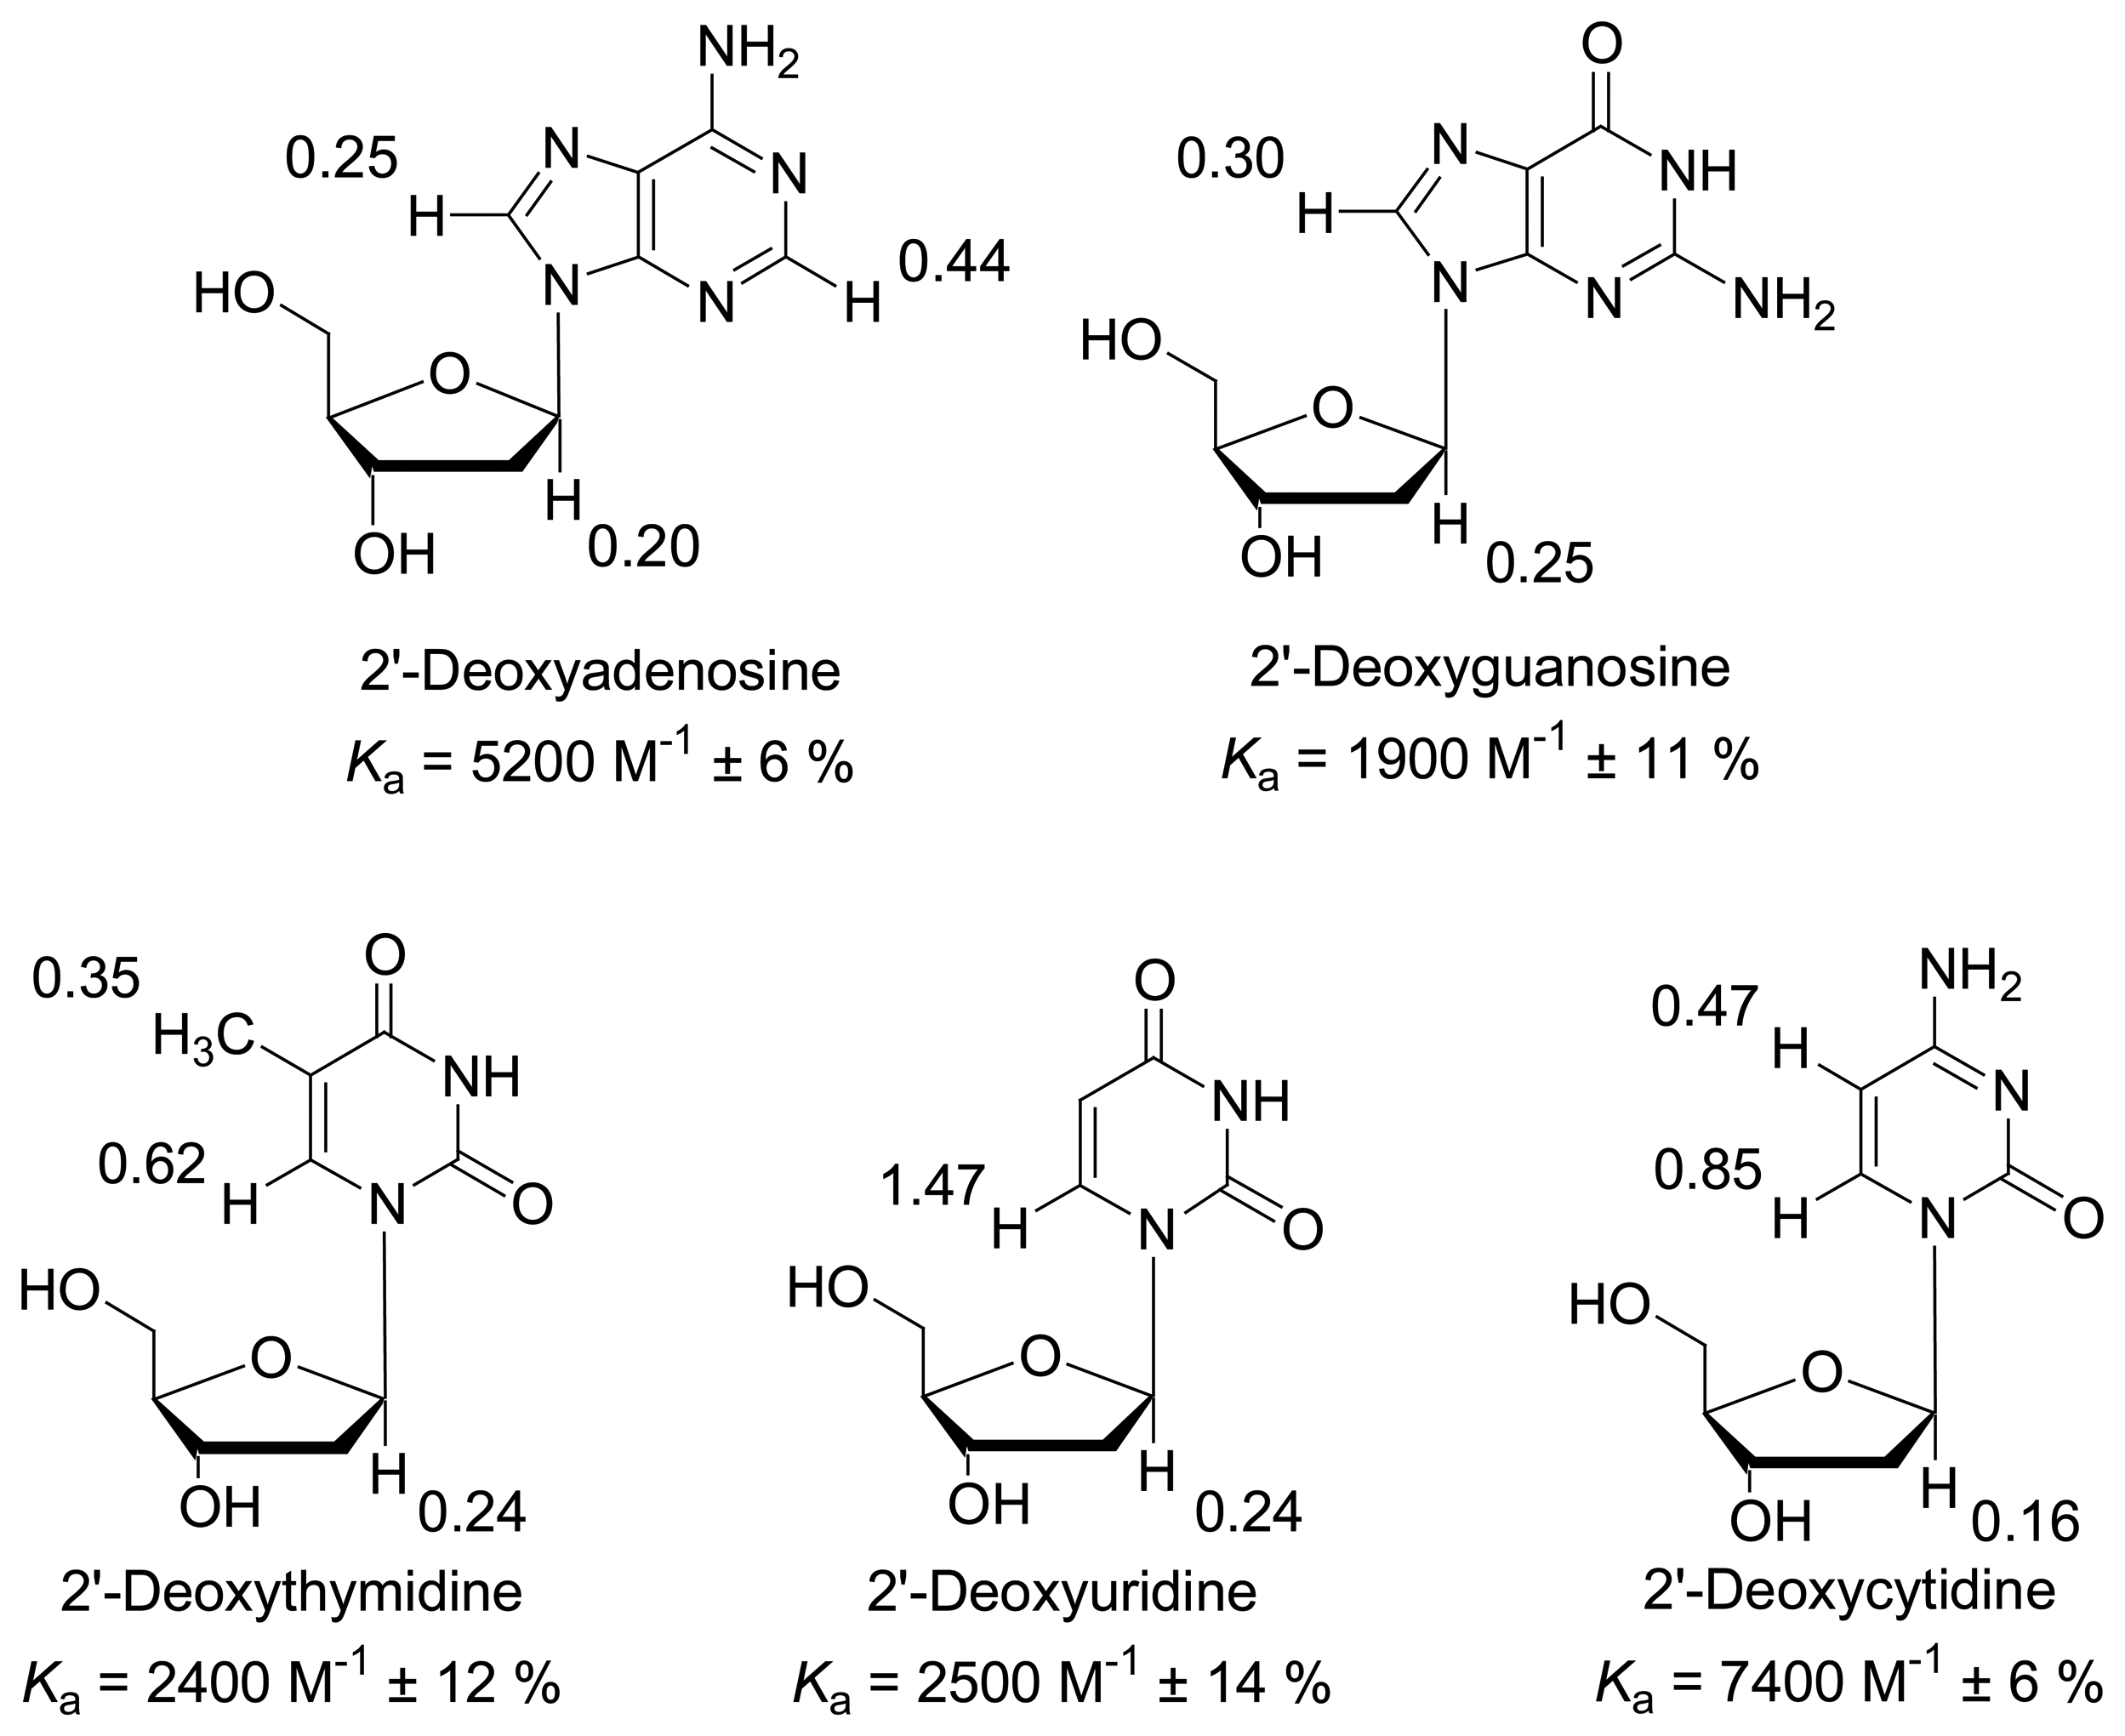
| Δδsat (ppm) | 0.6184 ± 2% | 0.2379 ± 2% | 0.3495 ± 3% | 0.0617 ± 5% | 0.0869 ± 5% | ||||
| Ka (mol/L) | 2701 ± 6% | 1707 ± 7% | 2184 ± 10% | 2162 ± 16% | 3064 ± 21% | ||||
Dilution titration of clip 1 with 2′-deoxyguanosine
| entry | Vparent solution (μL) | Vtotal (μL) | cguest (mol/L) | chost (mol/L) | δa (ppm) | δb (ppm) |
|---|---|---|---|---|---|---|
| 0 | reference | 600 | 2.43·10-3 | - | 8.0212 | 6.3408 |
| 1 | 30 | 600 | 1.22·10-4 | 5.77·10-5 | 7.9910 | 6.3203 |
| 2 | 60 | 600 | 2.43·10-4 | 1.15·10-4 | 7.9848 | 6.3070 |
| 3 | 90 | 600 | 3.65·10-4 | 1.73·10-4 | 7.9650 | 6.3012 |
| 4 | 150 | 600 | 6.08·10-4 | 2.89·10-4 | 7.9511 | 6.2896 |
| 5 | 300 | 600 | 1.22·10-3 | 5.77·10-4 | 7.9303 | 6.2717 |
| 6 | 600 | 600 | 2.43·10-3 | 1.12·10-3 | 7.9124 | 6.2532 |
| Δδsat (ppm) | 0.3033 ± 5% | 0.2480 ± 4% | ||||
| Ka (mol/L) | 2000 ± 13% | 1718 ± 9% | ||||
Dilution titration of clip 1 with 2′-deoxyadenosine
| entry | Vparent solution (μL) | Vtotal (μL) | cguest (mol/L) | chost (mol/L) | δa (ppm) | δb (ppm) | δc (ppm) | δd (ppm) | δe (ppm) | δf (ppm) |
|---|---|---|---|---|---|---|---|---|---|---|
| 0 | reference | 500 | 1.84·10-3 | 1.38·10-3 | 8.2903 | 8.2096 | 6.4556 | 7.6957 | 7.6747 | 7.3326 |
| 1 | 25 | 500 | 9.22·10-5 | 6.90·10-5 | 8.1599 | 8.1355 | 6.4059 | 7.6514 | 7.6238 | 7.2701 |
| 2 | 50 | 500 | 1.84·10-4 | 1.38·10-4 | 8.0980 | 8.0980 | 6.3826 | 7.6426 | 7.6117 | 7.2525 |
| 3 | 75 | 500 | 2.77·10-4 | 2.07·10-4 | 8.0836 | 8.0692 | 6.3694 | 7.6393 | 7.6072 | 7.2436 |
| 4 | 125 | 500 | 4.61·10-4 | 3.45·10-4 | 8.0615 | 8.0261 | 6.3517 | 7.6316 | 7.6017 | 7.2292 |
| 5 | 250 | 500 | 9.22·10-4 | 6.90·10-4 | 8.0316 | 7.9709 | 6.3275 | 7.6205 | 7.5818 | 7.2094 |
| 6 | 500 | 500 | 1.84·10-3 | 1.38·10-3 | 8.0051 | 7.9289 | 6.2997 | 7.6050 | 7.5663 | 7.2884 |
| Δδsat (ppm) | 0.5955 ± 1% | 0.3318 ± 2% | 0.2660 ± 3% | 0.1308 ± 6% | 0.1602 ± 6% | 0.1662 ± 4% | ||||
| Ka (mol/L) | 5771 ± 3% | 6068 ± 6% | 4115 ± 8% | 10300 ± 25% | 9076 ± 25% | 7710 ± 14% | ||||
| (averaged Ka value only from guest signals) | ||||||||||
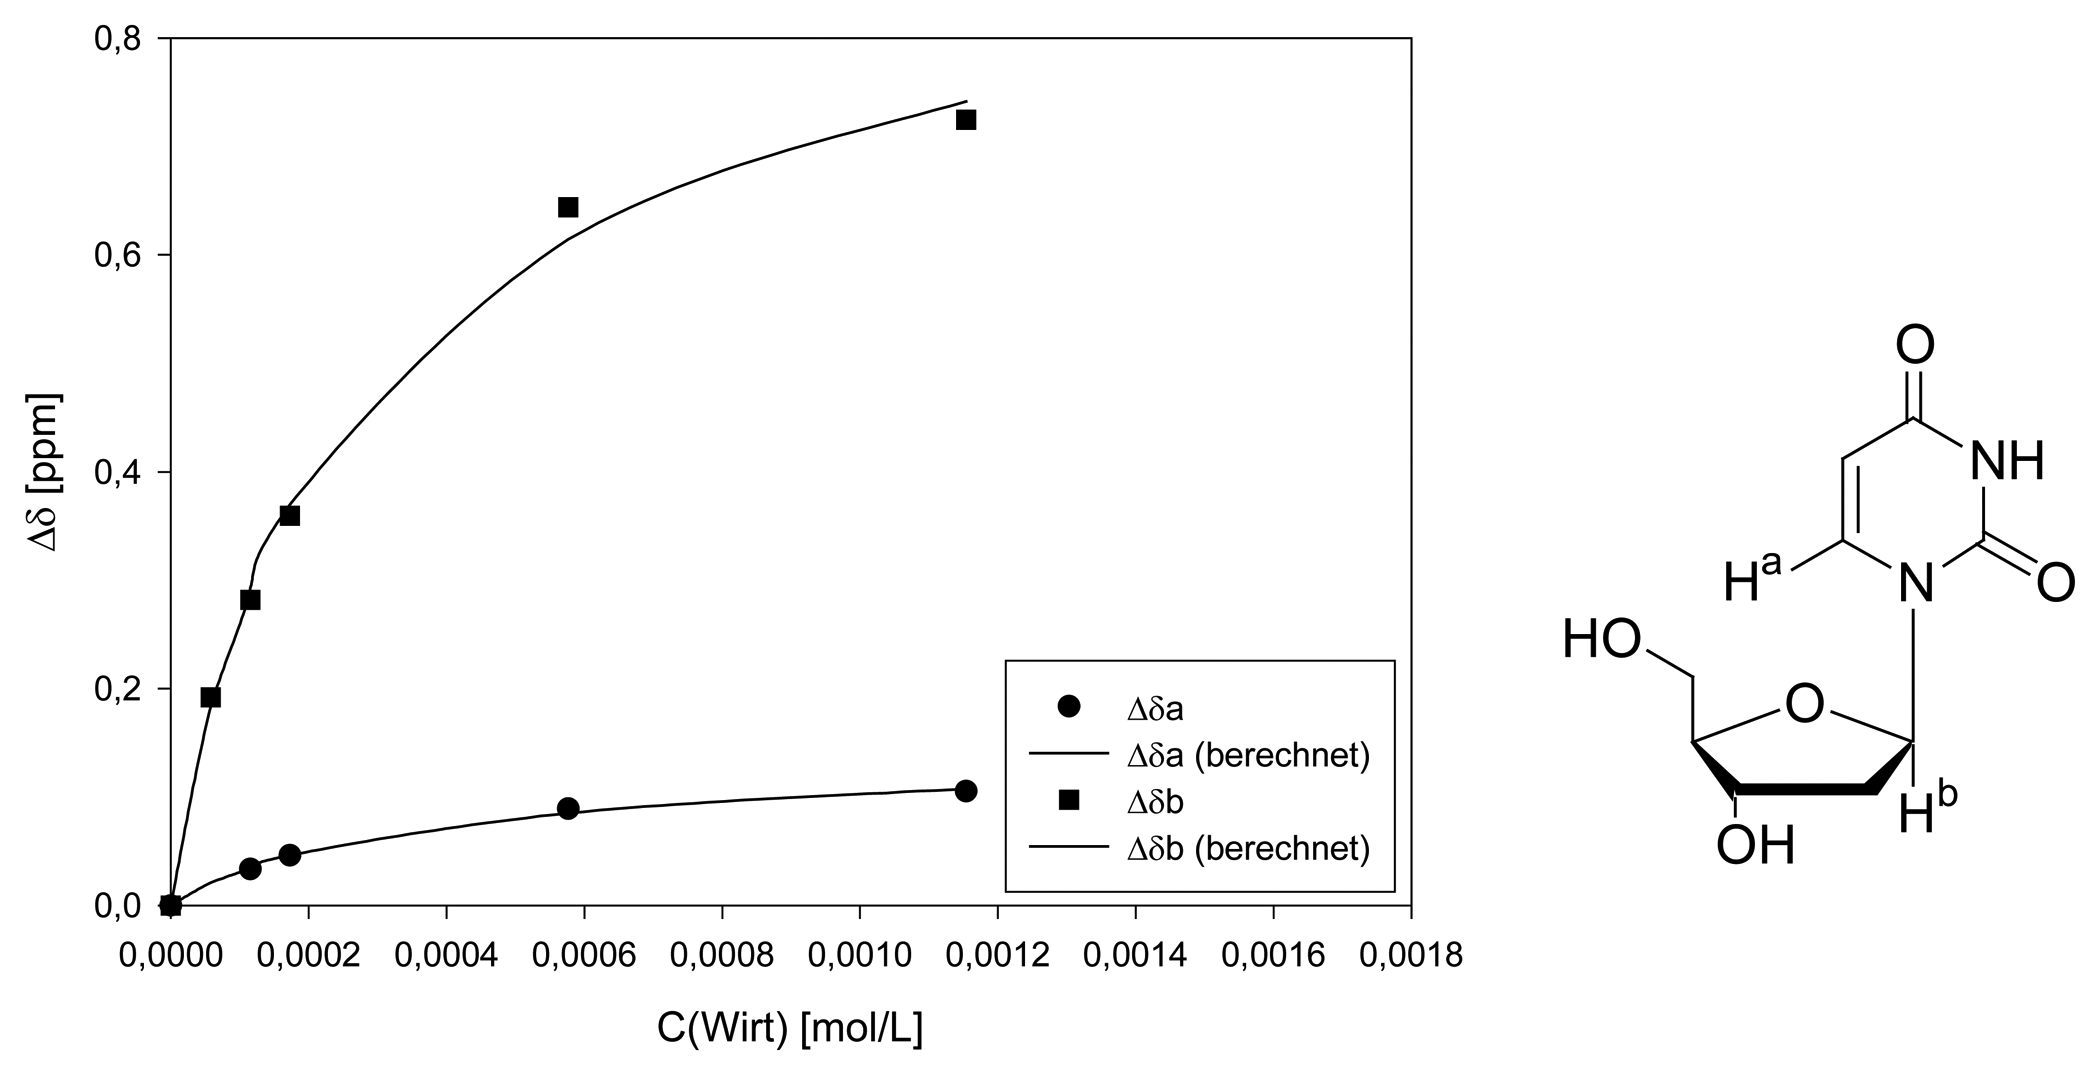
Dilution titration of clip 1 with 2′-deoxyuridine
| entry | Vparent solution (μL) | Vtotal (μL) | cguest (mol/L) | chost (mol/L) | δa (ppm) | δb (ppm) |
|---|---|---|---|---|---|---|
| 0 | reference | 600 | 1.61·10-3 | - | 6.2339 | 5.8324 |
| 1 | 30 | 600 | 8.05·10-5 | 5.77·10-5 | - | 5.6402 |
| 2 | 60 | 600 | 1.61·10-4 | 1.15·10-4 | 6.2005 | 5.5505 |
| 3 | 90 | 600 | 2.41·10-4 | 1.73·10-4 | 6.1877 | 5.4730 |
| 4 | 300 | 600 | 8.04·10-4 | 5.77·10-4 | 6.1446 | 5.1885 |
| 5 | 600 | 600 | 1.61·10-3 | 1.12·10-3 | 6.1286 | 5.1079 |
| Δδsat (ppm) | 1.465 ± 5% | 0.2384 ± 6% | ||||
| Ka (mol/L) | 3012 ± 12% | 1922 ± 16% | ||||
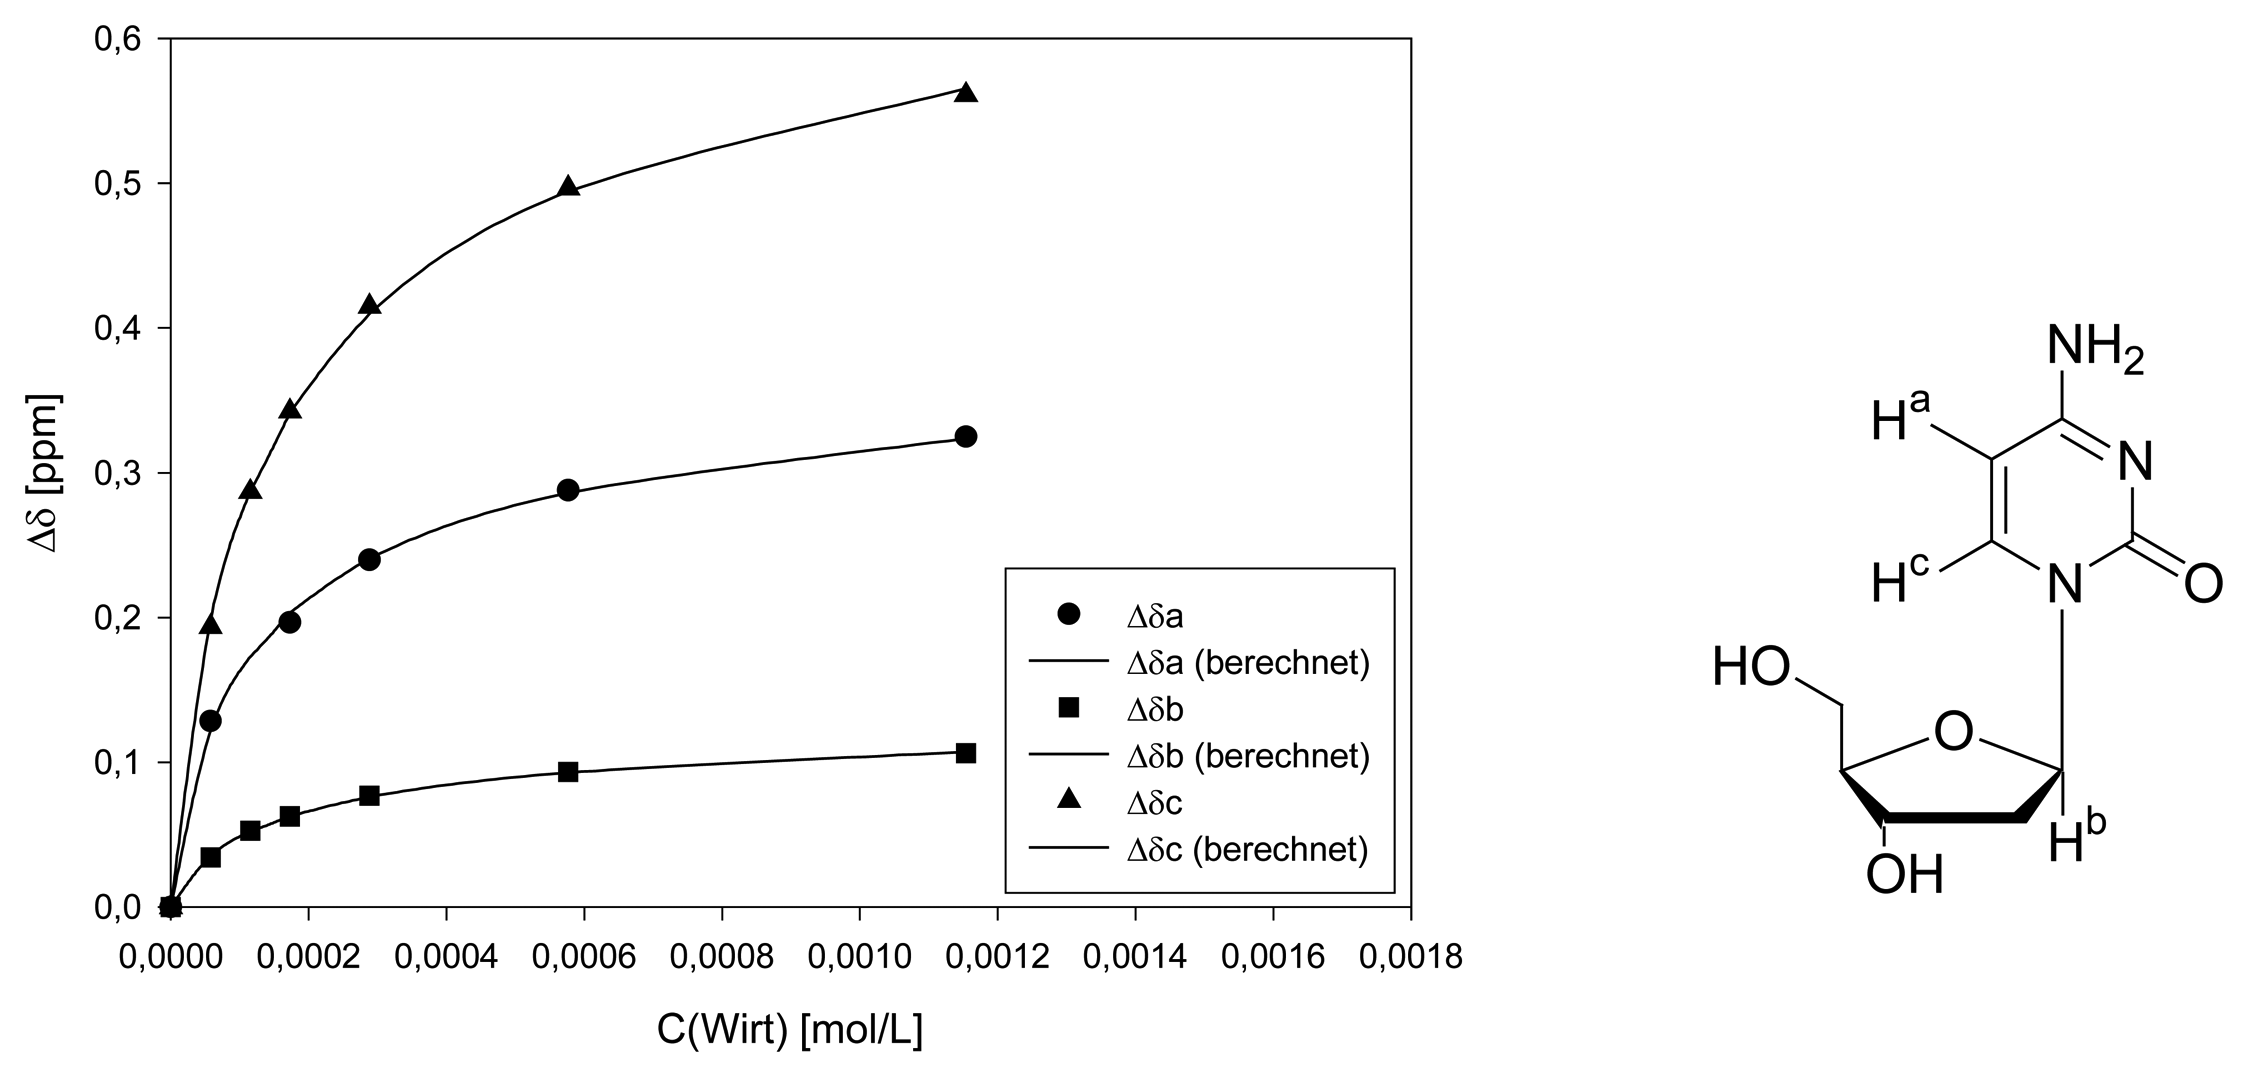
Dilution titration of clip 1 with 2′-deoxycytidine
| entry | Vparent solution (μL) | Vtotal (μL) | cguest (mol/L) | chost (mol/L) | δa (ppm) | δb (ppm) | δc (ppm) |
|---|---|---|---|---|---|---|---|
| 0 | reference | 600 | 1.32·10-3 | - | 7.8492 | 6.3008 | 6.0741 |
| 1 | 30 | 600 | 6.61·10-5 | 5.77·10-5 | 7.7209 | 6.2665 | 5.8807 |
| 2 | 60 | 600 | 1.32·10-4 | 1.15·10-4 | - | 6.2481 | 5.7873 |
| 3 | 90 | 600 | 1.98·10-4 | 1.73·10-4 | 7.6527 | 6.2381 | 5.7319 |
| 4 | 250 | 600 | 3.30·10-4 | 2.89·10-4 | 7.6096 | 6.2239 | 5.6595 |
| 5 | 300 | 600 | 6.61·10-4 | 5.77·10-4 | 7.5615 | 6.2074 | 5.5775 |
| 6 | 600 | 600 | 1.32·10-3 | 1.15·10-3 | 7.5244 | 6.1945 | 5.5133 |
| Δδsat (ppm) | 0.4738 ± 2% | 0.1646 ± 1% | 0.8499 ± 1% | ||||
| Ka (mol/L) | 8545 ± 8% | 6332 ± 4% | 7197 ± 3% | ||||
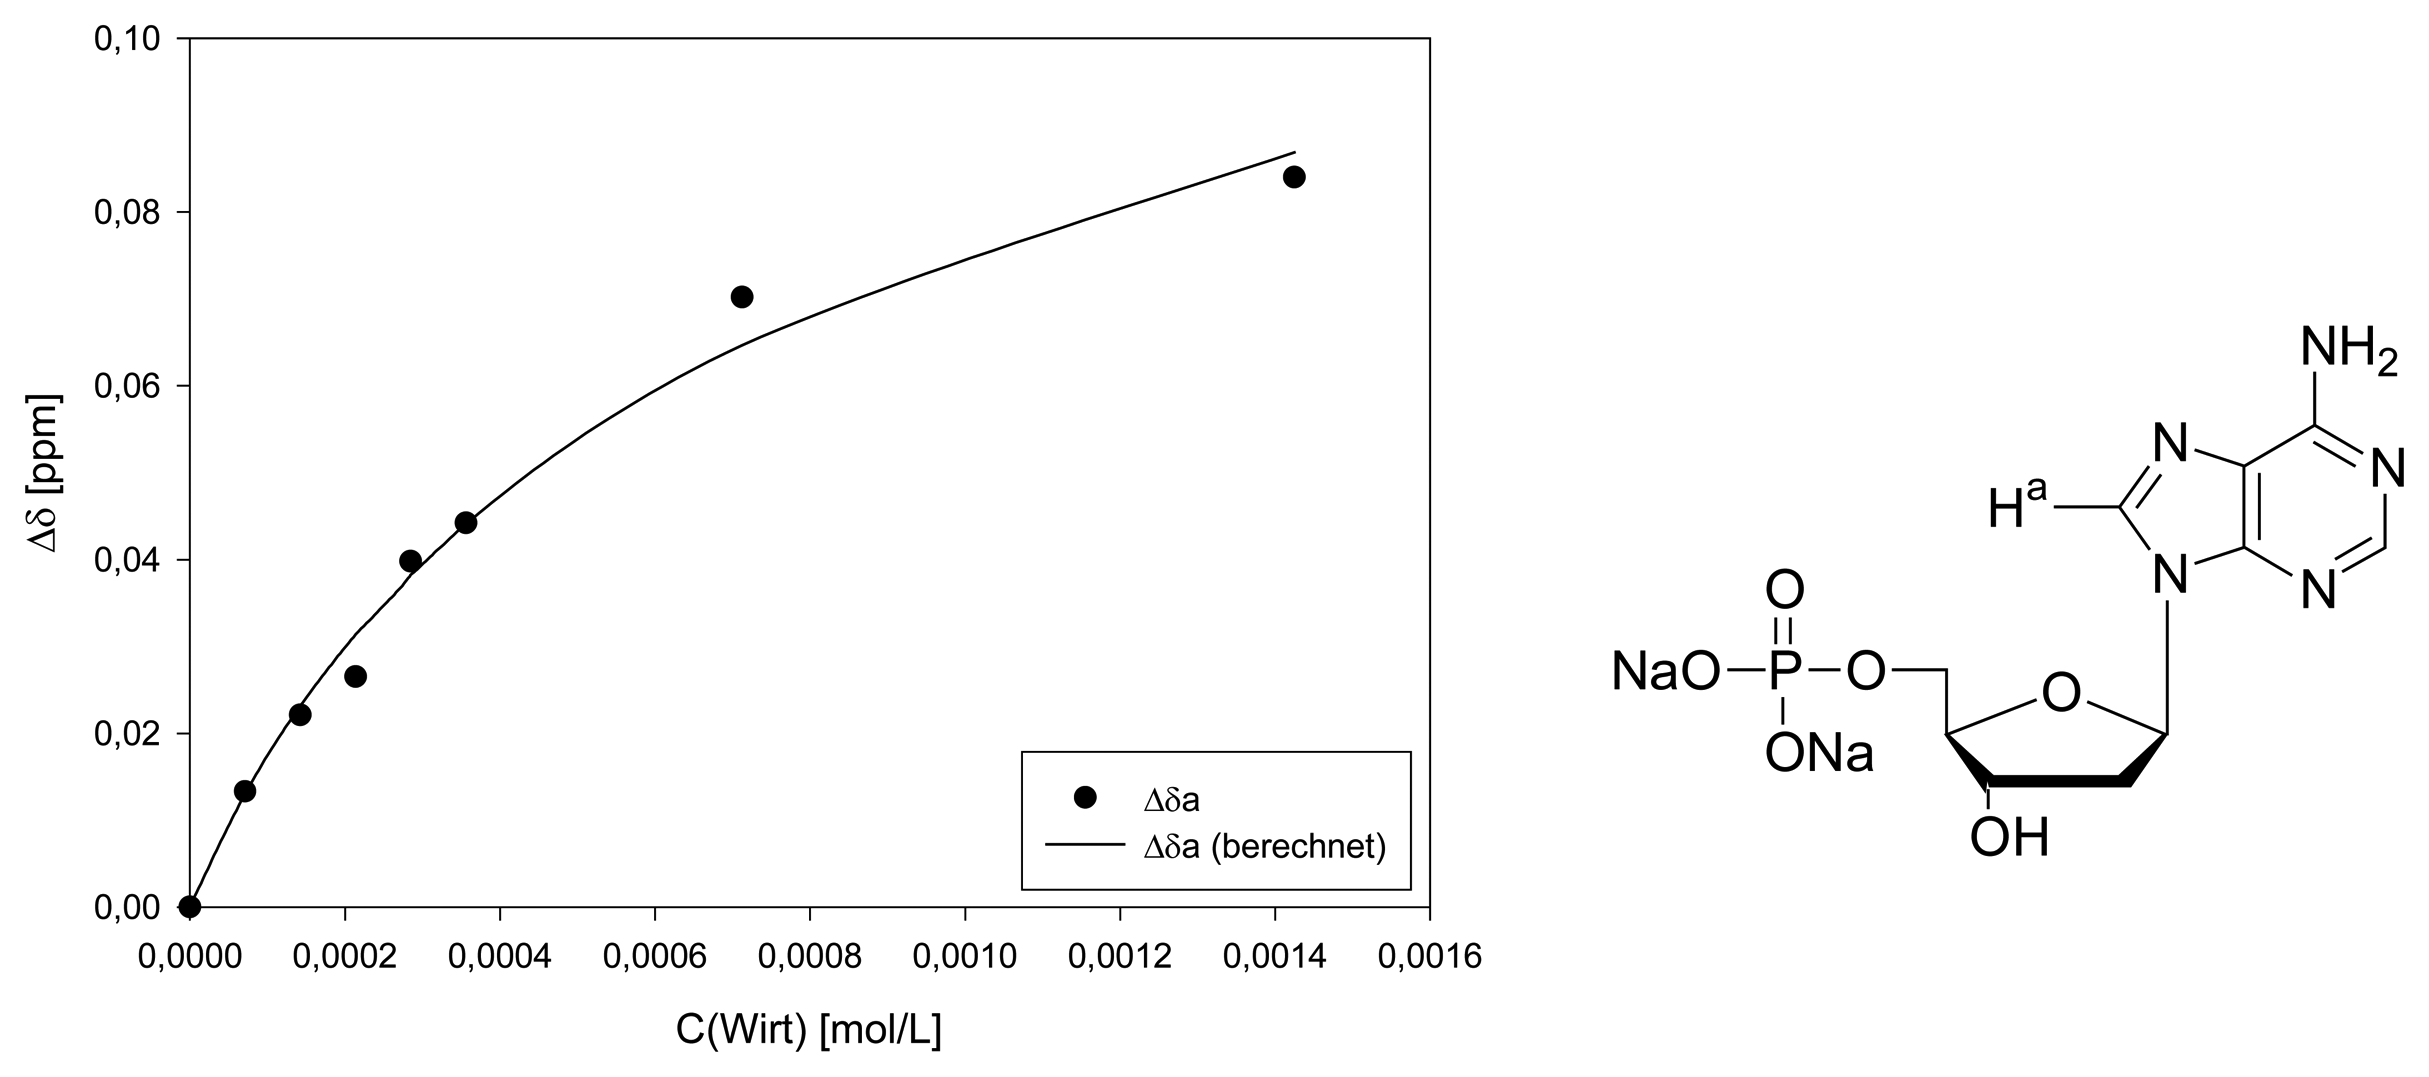
Dilution titration of clip 1 with AMP
| entry | Vparent solution (μL) | Vtotal (μL) | cguest (mol/L) | chost (mol/L) | δa (ppm) |
|---|---|---|---|---|---|
| 0 | reference | 500 | 1.44·10-3 | - | 8.2317 |
| 1 | 25 | 500 | 7.18·10-5 | 7.13·10-5 | 8.2184 |
| 2 | 50 | 500 | 1.44·10-4 | 1.43·10-4 | 8.2096 |
| 3 | 75 | 500 | 2.15·10-4 | 2.14·10-4 | 8.2052 |
| 4 | 100 | 500 | 2.87·10-4 | 2.85·10-4 | 8.1919 |
| 5 | 125 | 500 | 3.59·10-4 | 3.56·10-4 | 8.1875 |
| 6 | 250 | 500 | 7.18·10-4 | 7.13·10-4 | 8.1615 |
| 7 | 500 | 500 | 1.44·10-3 | 1.43·10-4 | 8.1477 |
| Δδsat (ppm) | 0.1881 ± 10% | ||||
| Ka (mol/L) | 1126 ± 19% | ||||
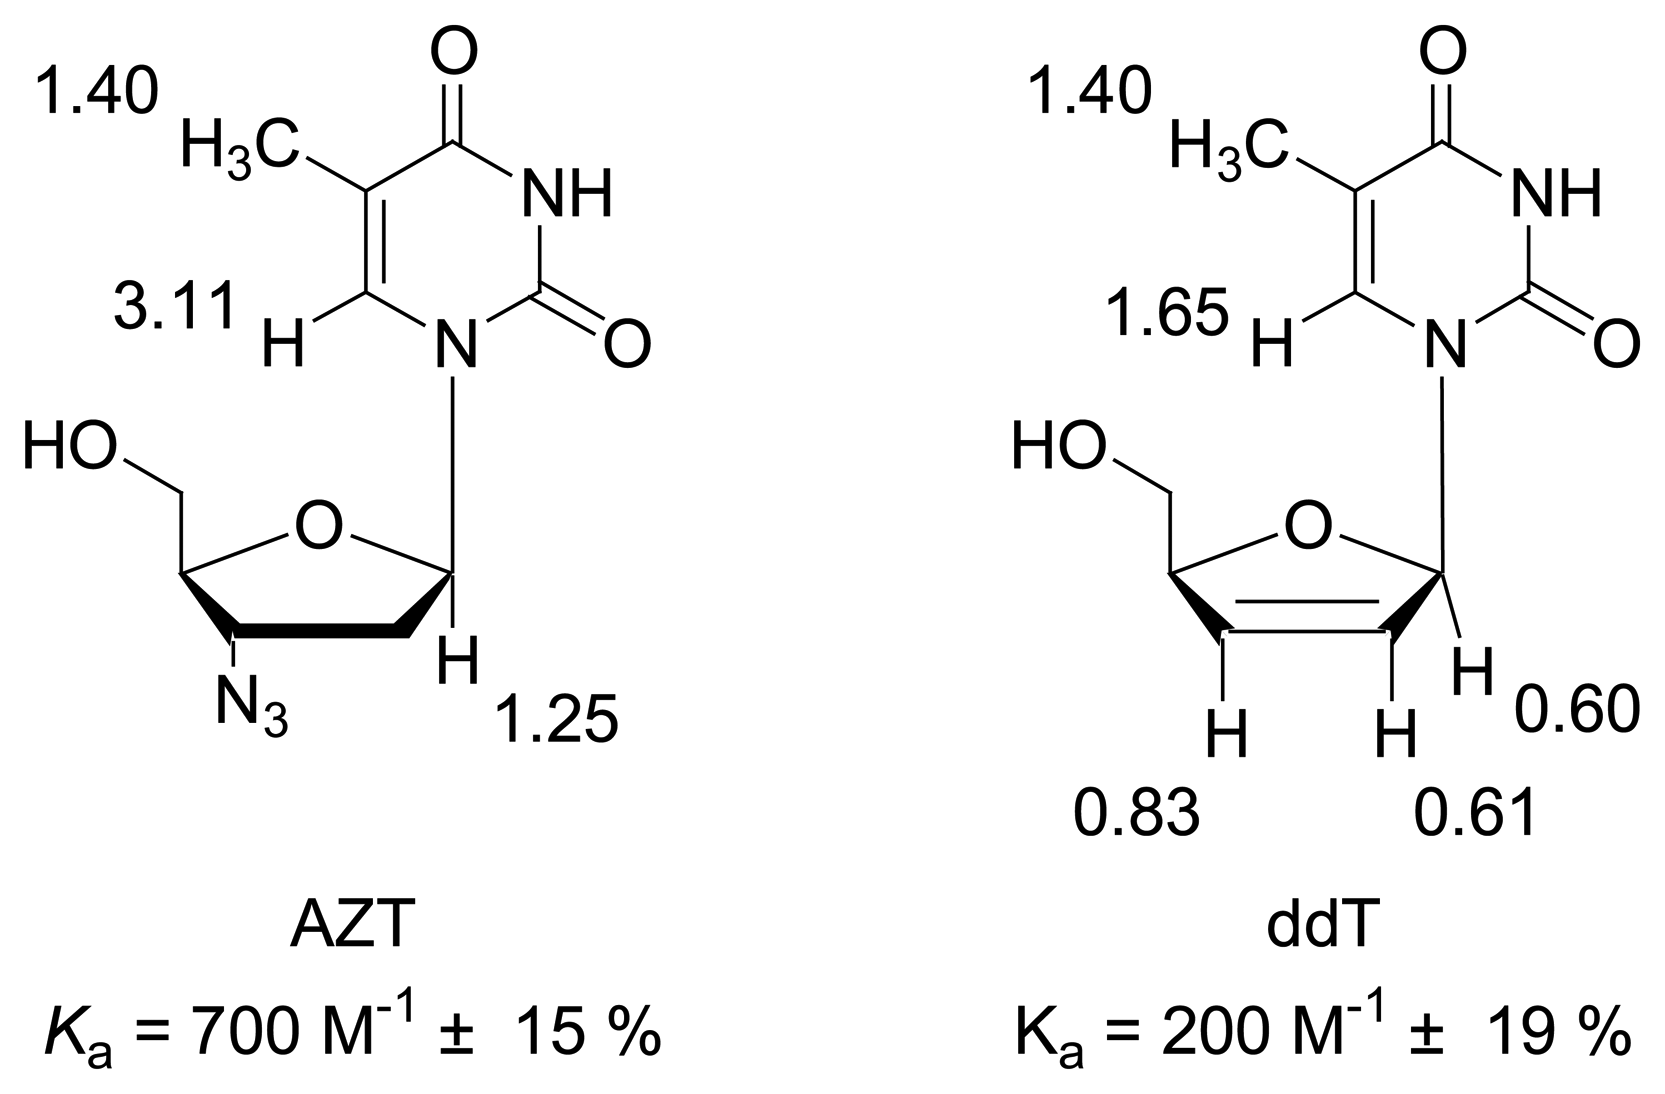
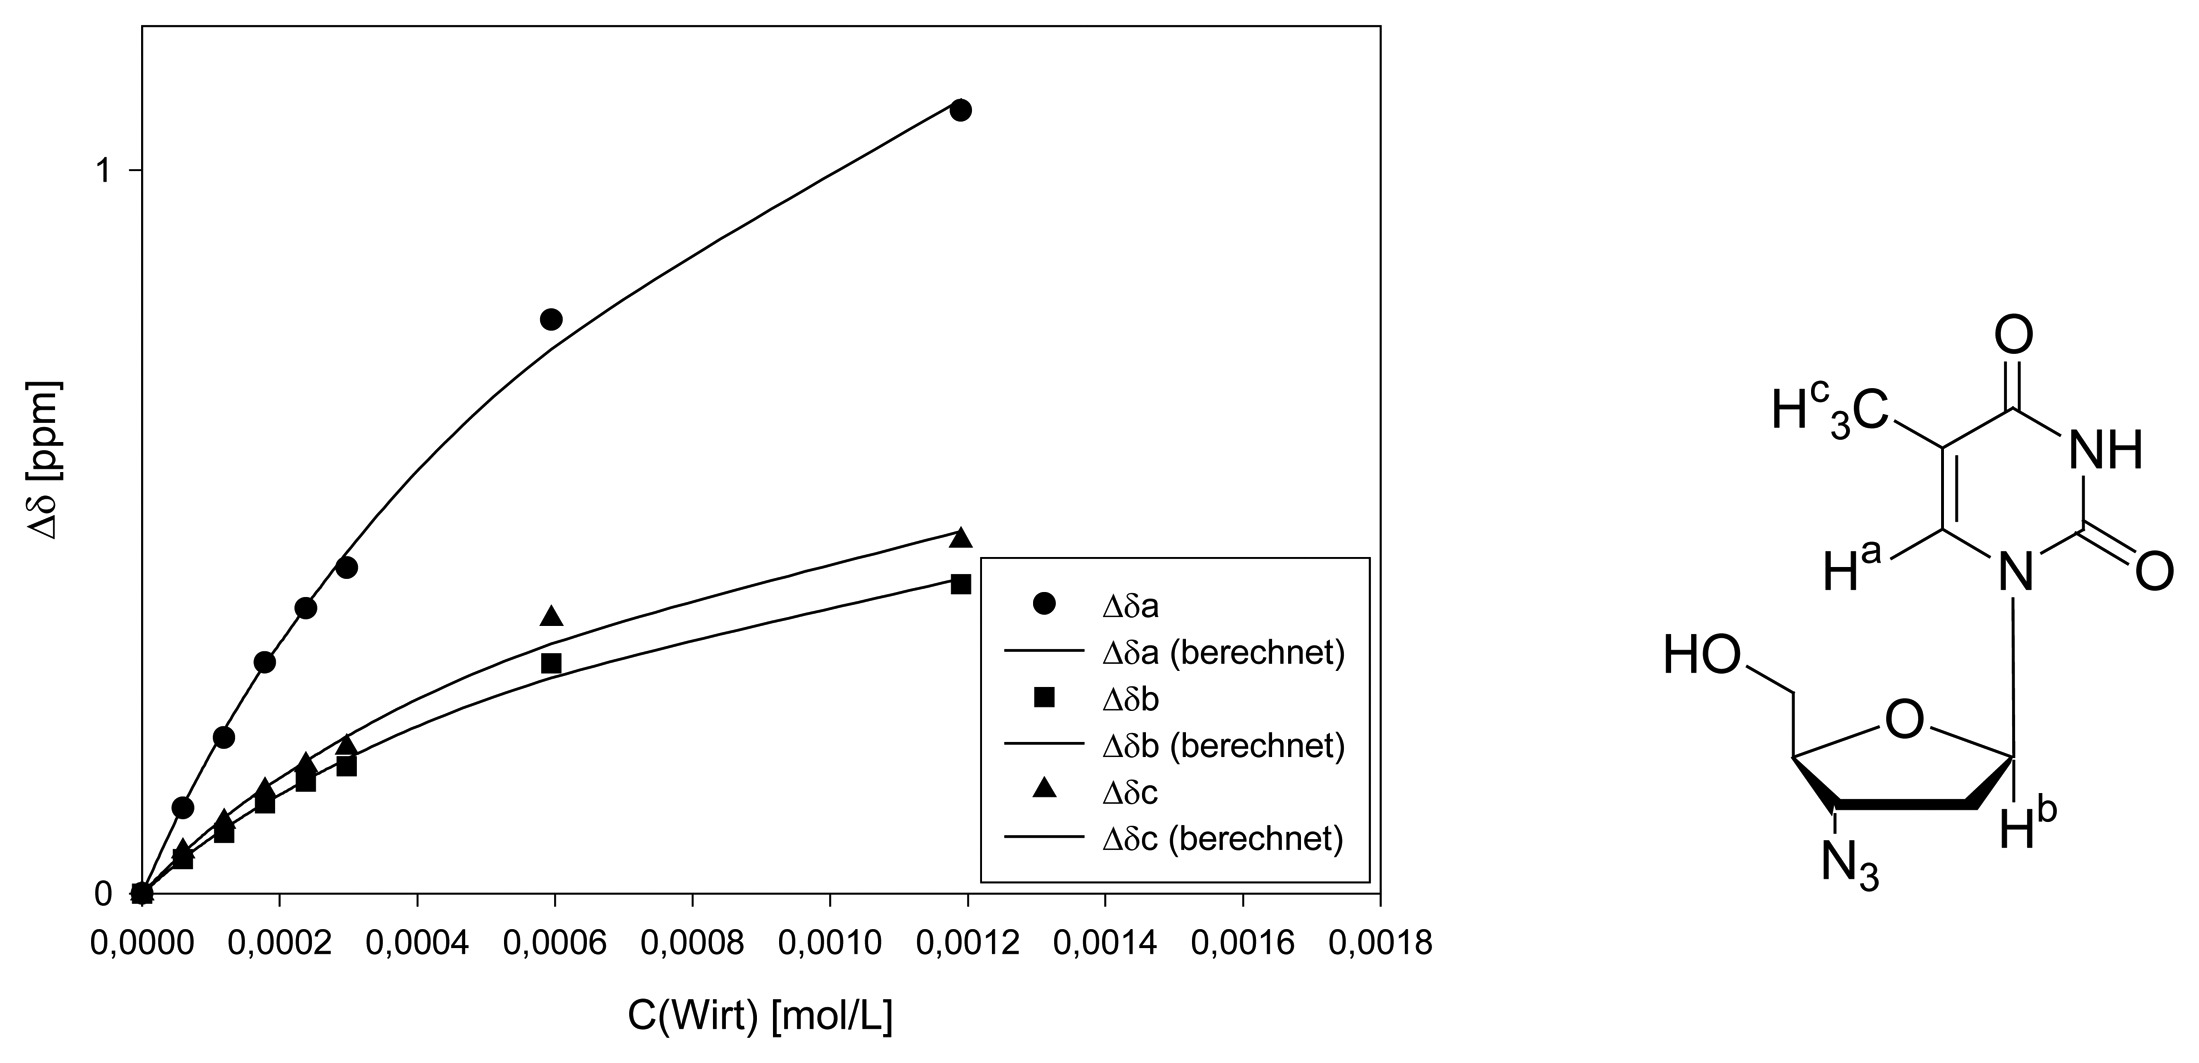
Dilution titration of clip 1 with AZT
| entry | Vparent solution (μL) | Vtotal (μL) | cguest (mol/L) | chost (mol/L) | δa (ppm) | δb (ppm) | δc (ppm) |
|---|---|---|---|---|---|---|---|
| 0 | reference | 600 | 1.20·10-3 | - | 7.6200 | 6.1936 | 1.6839 |
| 1 | 30 | 600 | 5.98·10-5 | 5.95·10-5 | 7.5022 | 6.1461 | 1.8059 |
| 2 | 60 | 600 | 1.20·10-4 | 1.19·10-4 | 7.4050 | 6.1096 | 1.7650 |
| 3 | 90 | 600 | 1.79·10-4 | 1.79·10-5 | 7.3011 | 6.0688 | 1.7219 |
| 4 | 120 | 600 | 2.39·10-4 | 2.38·10-4 | 7.2259 | 6.0389 | 1.6865 |
| 5 | 150 | 600 | 2.98·10-4 | 2.98·10-4 | 7.1696 | 6.0179 | 1.6622 |
| 6 | 300 | 600 | 5.98·10-4 | 5.95·10-4 | 6.8269 | 5.8752 | 1.4842 |
| 7 | 600 | 600 | 1.20·10-3 | 1.19·10-3 | 6.2464 | 5.7659 | 1.3759 |
| Δδsat (ppm) | 3.116 ± 6% | 1.245 ± 8% | 1.400 ± 11% | ||||
| Ka (mol/L) | 707 ± 11% | 696 ± 14% | 730 ± 19% | ||||
Titration of clip 1 with 2′,3′-deoxythymidine
| entry | Vguest (μL) | Vhost (μL) | Vtotal (μL) | cguest (mol/L) | chost (mol/L) | δa (ppm) | δb (ppm) | δc (ppm) | δd (ppm) | δf (ppm) |
|---|---|---|---|---|---|---|---|---|---|---|
| 0 | 75 | 0 | 600 | 3.24·10-4 | 0 | 7.6417 | 6.9692 | 6.4877 | 5.9824 | 1.8810 |
| 1 | 75 | 10 | 600 | 3.24·10-4 | 6.74·10-5 | 7.6312 | 6.9632 | 6.4790 | 5.9765 | 1.8719 |
| 2 | 75 | 20 | 600 | 3.24·10-4 | 1.35·10-4 | 7.6110 | 6.9536 | 6.4758 | 5.9693 | 1.8545 |
| 3 | 75 | 30 | 600 | 3.24·10-4 | 2.02·10-4 | 7.5973 | 6.9454 | 6.4699 | 5.9623 | 1.8426 |
| 4 | 75 | 40 | 600 | 3.24·10-4 | 2.70·10-4 | 7.5798 | 9.9376 | 6.4634 | 5.9559 | 1.8274 |
| 5 | 75 | 50 | 600 | 3.24·10-4 | 3.37·10-4 | 7.5611 | 9.9280 | 6.4538 | 5,9453 | 1.8114 |
| 6 | 75 | 60 | 600 | 3.24·10-4 | 4.04·10-4 | 7.5450 | 6.9211 | 6.4492 | 5,9389 | 1.7977 |
| 7 | 75 | 80 | 600 | 3.24·10-4 | 5.39·10-4 | 7.5133 | 6.9078 | 6.4383 | 5,9275 | 1.7720 |
| 8 | 75 | 120 | 600 | 3.24·10-4 | 8.09·10-4 | 7.4589 | 6.8799 | 6.4140 | 5,9000 | - |
| 9 | 75 | 200 | 600 | 3.24·10-4 | 1.35·10-3 | 7.3618 | 6.8350 | 6.3764 | 5,8565 | 1.6415 |
| Δδsat (ppm) | 1.645 ± 17% | 0.6014 ± 9% | 0.6108 ± 18% | 0.8318 ± 19% | 1.399 ± 20% | |||||
| Ka (mol/L) | 160 ± 20% | 226 ± 12% | 174 ± 21% | 138 ± 23% | 160 ± 20% | |||||
References and Notes
- Meier, C. Mini Reviews in Medicinal Chemistry 2002, 2, 219–234.
- Wu, D.; Clement, J.G.; Pardridge, W. M. Brain Res. 1998, 791, 313–316.
- Rotger, M.C.; González, J. F.; Ballester, P.; Deyà, P. M.; Costa, A. J. Org. Chem. 1994, 59, 4501–4505.
- Cudic, P.; Žinic, M.; Tomišic, V.; Simeon, V.; Vigneron, J.-P.; Lehn, J.-M. J. Chem. Soc., Chem. Commun. 1995, 1073–1075.
- Klärner, F.-G.; Kahlert, B. Acc. Chem. Res. 2003, 36, 919–932.
- Jasper, C.; Schrader, T.; Panitzky, J.; Klärner, F.-G. Angew. Chem. 2002, 114, 1411–1415.
- Connors, K. A. Binding Constants, The Measurement of Molecular Complex Stability; Wiley: New York, 1987. [Google Scholar]Fielding, L. Tetrahedron 2000, 56, 6151–6170.
- Fokkens, M.; Jasper, C.; Schrader, T.; Koziol, F.; Ochsenfeld, C.; Polkowska, J.; Lobert, M.; Kahlert, B.; Klärner, F.-G. Chem. Eur. J. 2005, 11, 477–494.
- Balzarini, J.; Herdewijn, P.; De Clercq, E. J. Biol. Chem. 1989, 264, 6127–6133.
2006 by MDPI ( http://www.mdpi.org). Reproduction is permitted for noncommercial purposes.
Share and Cite
Fokkens, M.; Klärner, F.-G.; Schrader, T. Nucleoside Sensing. Sensors 2006, 6, 860-873. https://doi.org/10.3390/s6080860
Fokkens M, Klärner F-G, Schrader T. Nucleoside Sensing. Sensors. 2006; 6(8):860-873. https://doi.org/10.3390/s6080860
Chicago/Turabian StyleFokkens, Michael, Frank-Gerrit Klärner, and Thomas Schrader. 2006. "Nucleoside Sensing" Sensors 6, no. 8: 860-873. https://doi.org/10.3390/s6080860
APA StyleFokkens, M., Klärner, F.-G., & Schrader, T. (2006). Nucleoside Sensing. Sensors, 6(8), 860-873. https://doi.org/10.3390/s6080860