
A Comprehensive Review on Sensor-Based Electronic Nose for Food Quality and Safety

 ,
,  ,
,  ,
,  ,
,
Abstract
1. Introduction
- Ensuring food quality and safety: E-noses help detect spoilage, contamination, and adulteration in food products, ensuring freshness and quality control.
- Advancing medical diagnostics: E-noses are used in disease detection by analyzing breath, sweat, or urine to identify biomarkers associated with conditions like diabetes, cancer, and infections.
- Enhancing environmental monitoring: E-noses detect pollutants, hazardous gases, and air quality changes, aiding in environmental protection and public health.
- Improving industrial process control: E-noses help monitor manufacturing processes, detect leaks, and ensure consistent product quality in industries such as pharmaceuticals, perfumes, and beverages.
- Strengthening security and defense: E-noses are used in explosive and drug detection, helping in law enforcement and military and border security operations.
- Boosting agriculture and farming: E-noses assist in monitoring soil conditions, plant health, and pest infestations by detecting VOCs released by plants to improve crop yields and reduce reliance on harmful pesticides.
- Ensuring workplace safety: E-noses help prevent occupational hazards by detecting toxic or flammable gases in industrial and laboratory environments.
1.1. Research Questions and Contributions
1.1.1. Research Questions
- Research Question 1 (RQ1): What are the state-of-the-art research results over the last decade in the field of e-nose systems aimed at food quality and safety?
- Research Question 2 (RQ2): What lessons have been learned from the design and deployment of e-nose systems in laboratory and industrial settings?
- Research Question 3 (RQ3): What research gaps exist in the application of e-noses for food quality and safety, and what are the future research directions that we must explore to address these gaps?
1.1.2. Research Contributions
- We present an in-depth analysis of research results over the past decade in the e-nose field designed for food quality and safety. We concluded the analysis based on a proposed taxonomy, which we developed through a comprehensive examination of peer-reviewed research papers from three scientific databases. We highlight key technological advances, practical implementations, and performance results obtained across various food sectors.
- We identify critical lessons learned, such as the importance of e-nose components selection (sensors, signal processing unit, data pattern recognition model) according to the type of food and the need to develop suitable data pattern recognition models, as well as new sensors tailored to food quality and safety assessment.
- We identify current research gaps, such as the lack of real-world validation and limited sensor sensitivity, and we discuss future research opportunities that will improve the reliability, scalability, and industrial applicability of e-nose technologies in food systems.
1.1.3. Organization of This Paper
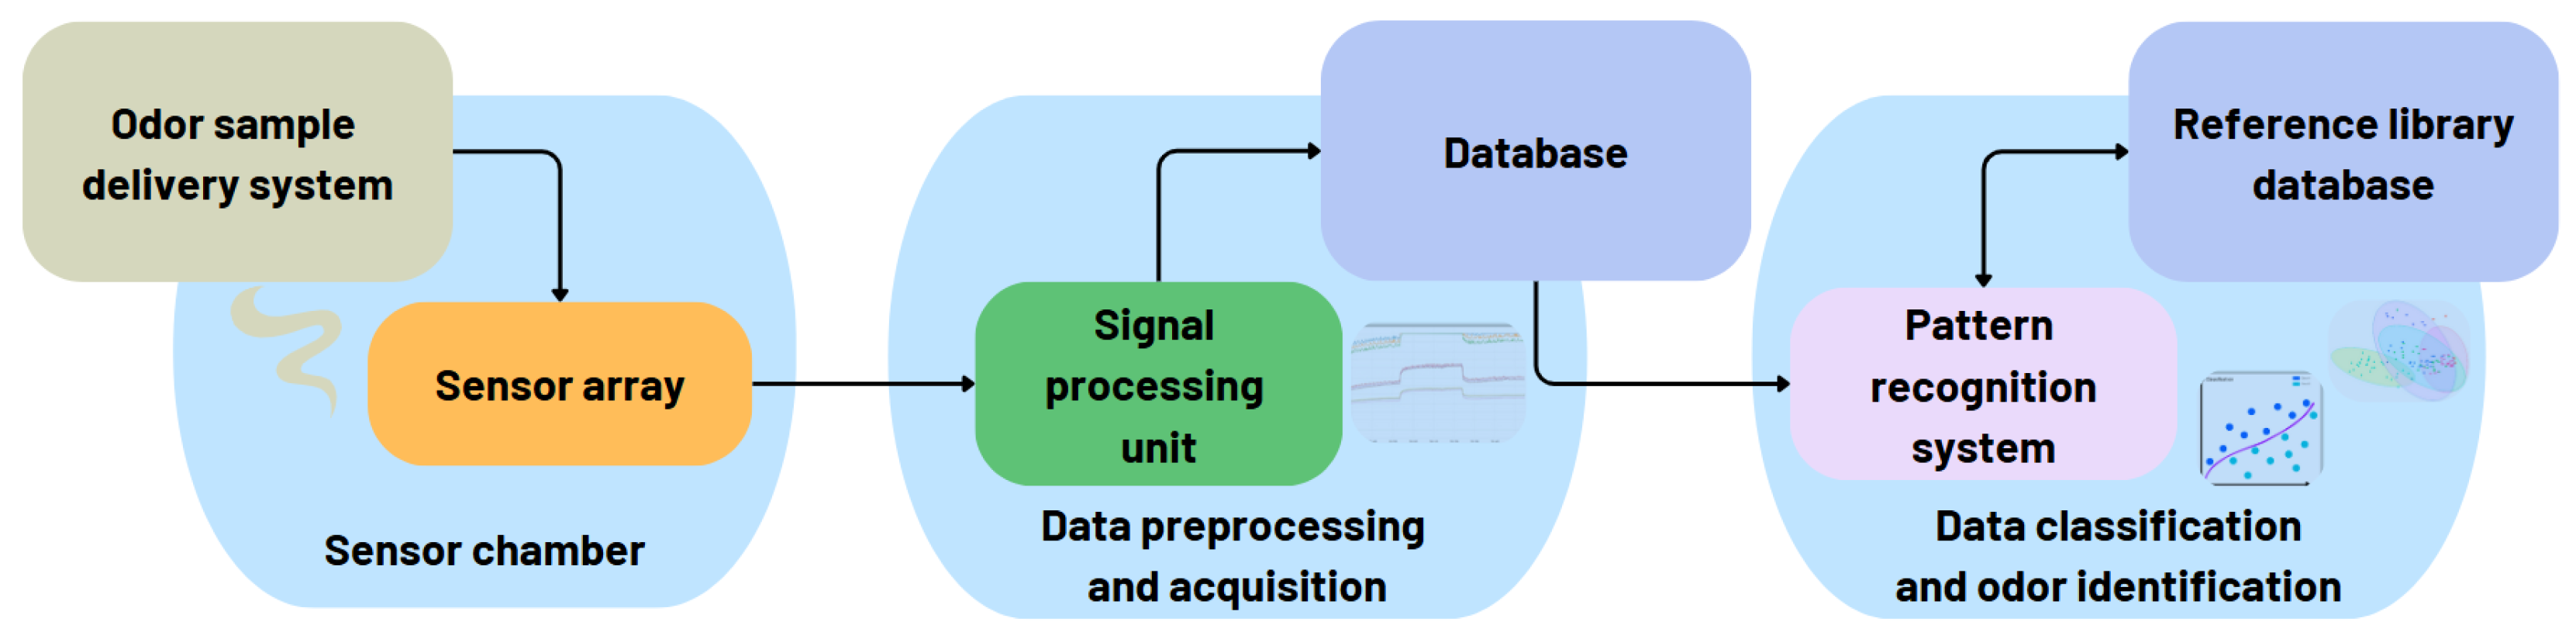
2. E-Nose Components
- Conductometric sensors, including conducting polymer (CP) sensors [12], alter their conductivity in the presence of gas molecules.
- Electrochemical sensors [15] convert chemical reactions at the electrode surface into electrical signals.
- Optical sensors [16] monitor changes in light absorption, fluorescence, or scattering in response to gas exposure.
- Bioelectronic sensors [19] integrate biological recognition elements to selectively detect specific VOCs.
3. Review Methodology
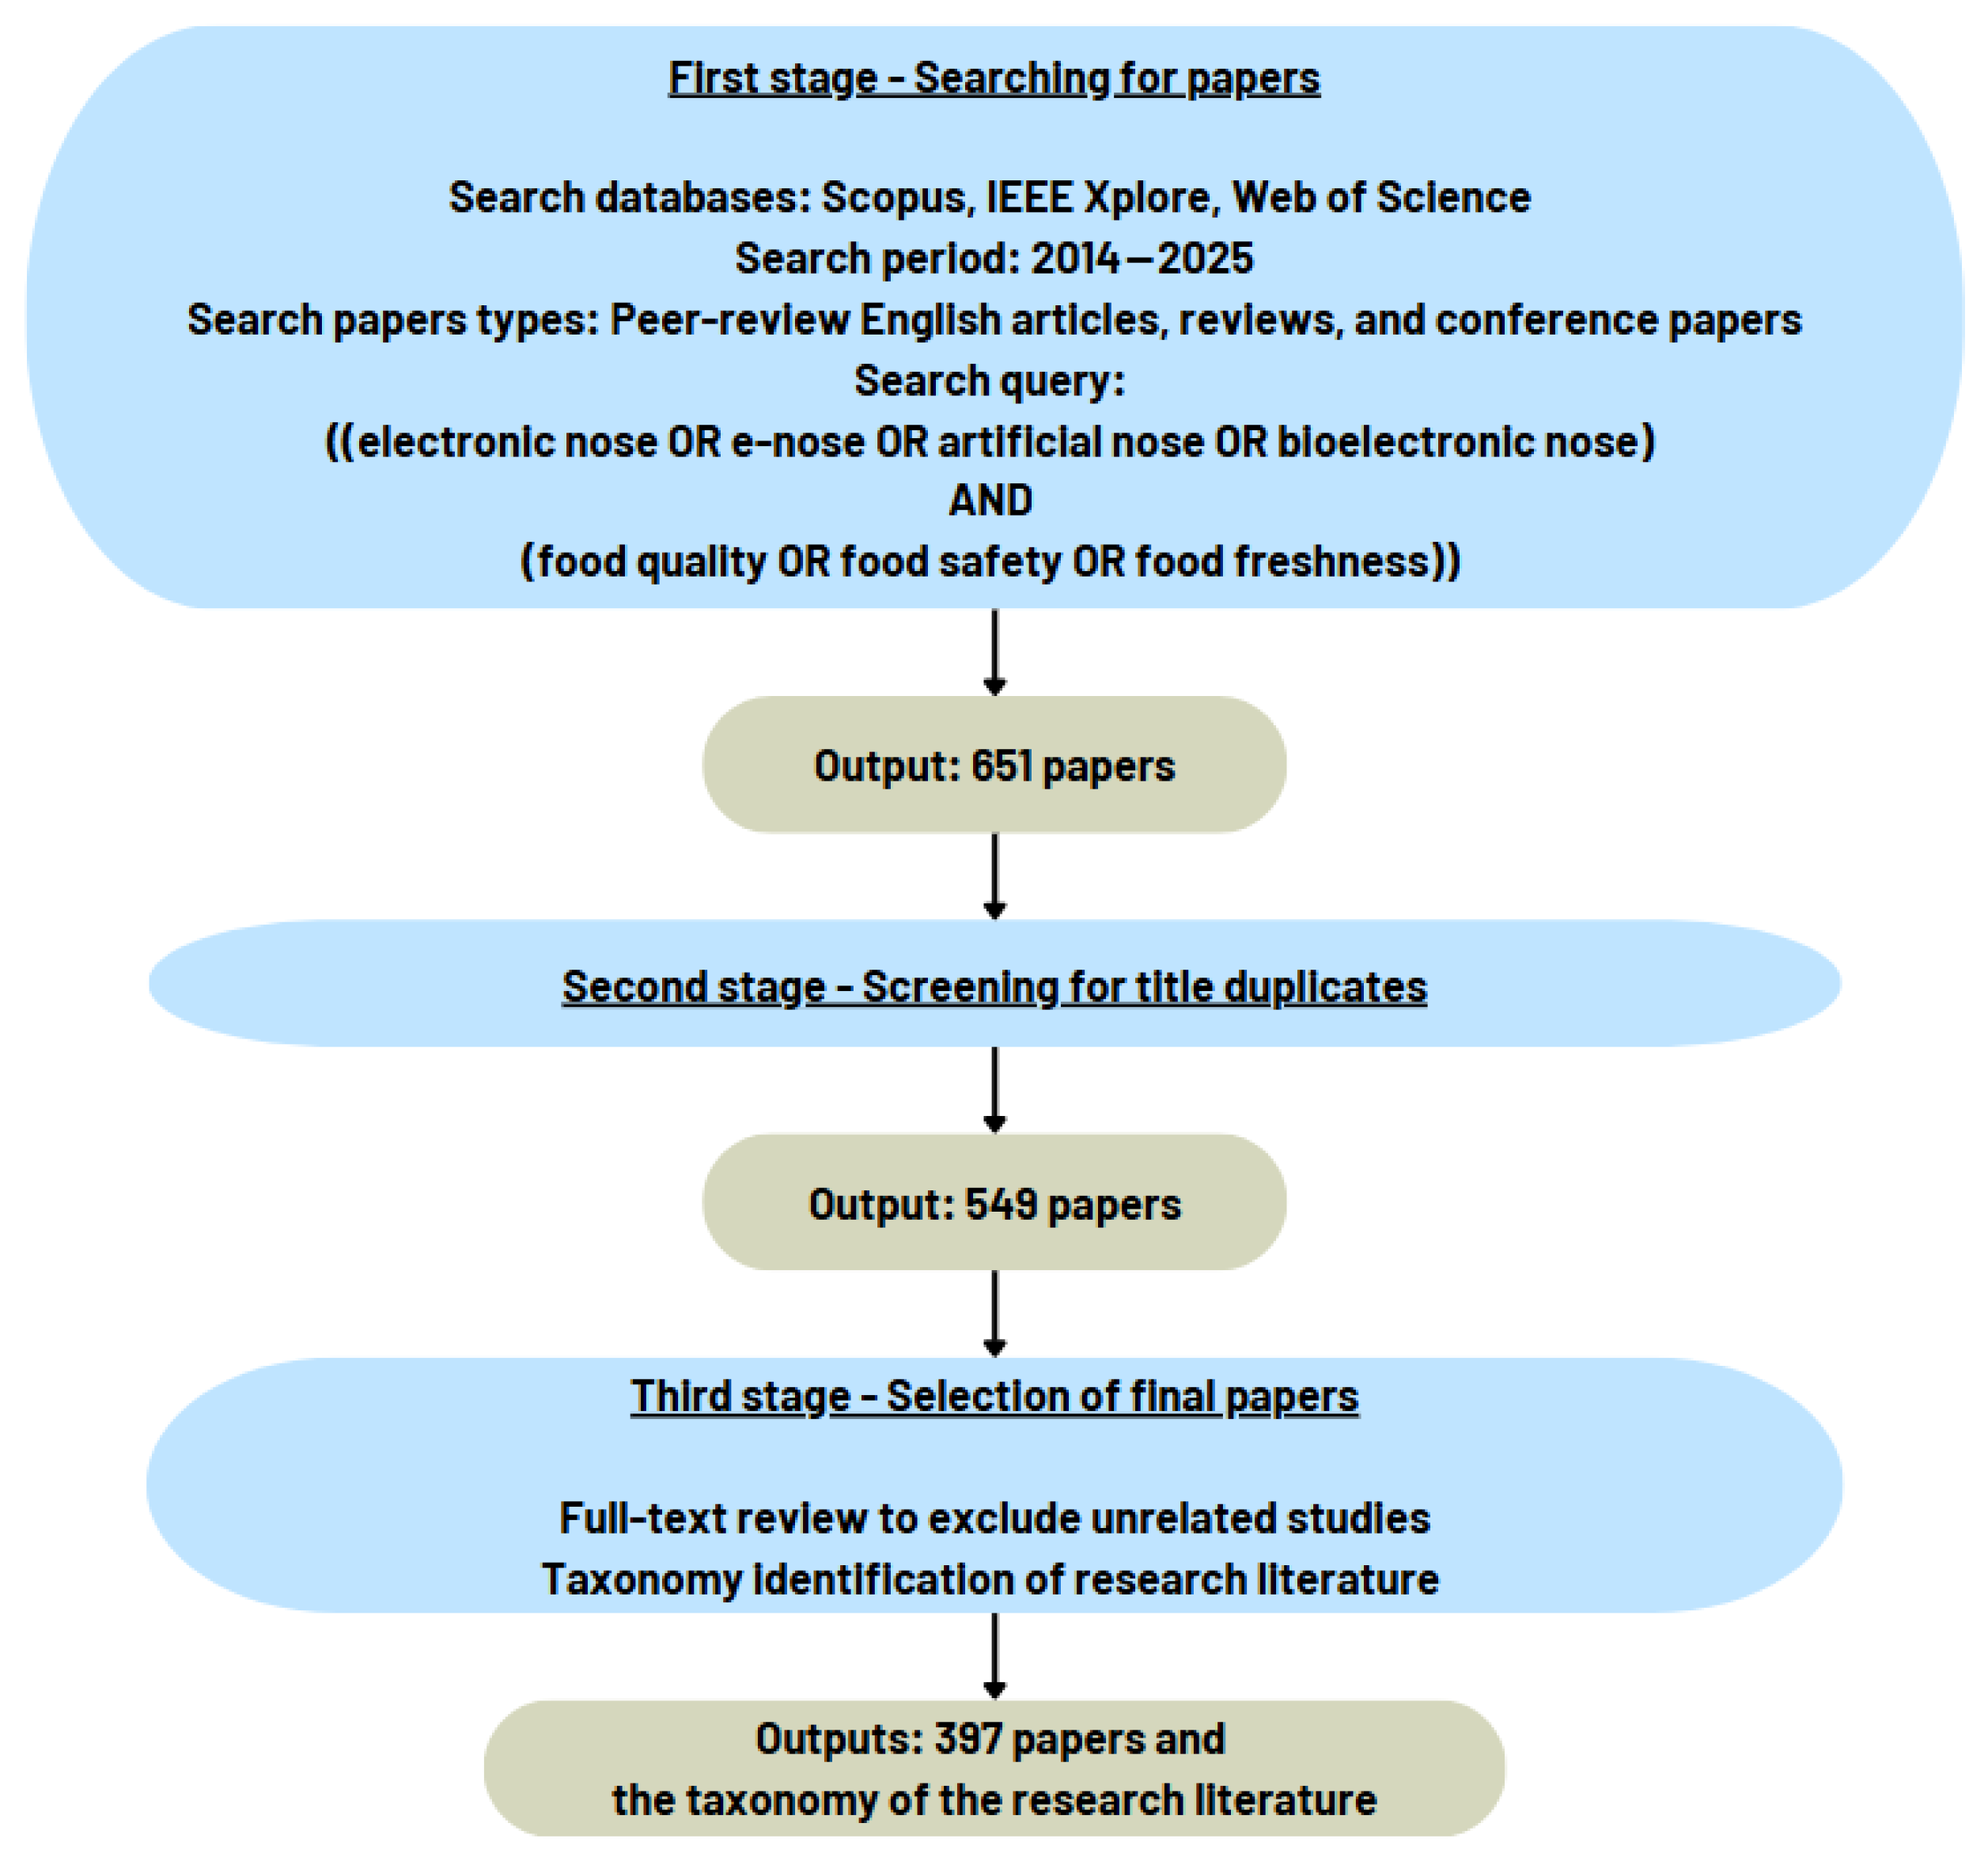
3.1. Criteria for Selecting Relevant Research Papers Used in This Review
- In the first stage, we used the Scopus, IEEE Xplore, and Web of Science (WoS) electronic databases to search for final peer-review English-language documents published between 2014 and 2025. We considered only documents of type articles, reviews, and conference papers. We conducted the search using the following words appearing in the title or abstract of the documents: electronic nose, e-nose, artificial nose, bioelectronic nose, food quality, food safety, and food freshness.
- In the second stage, we reviewed the titles of the documents retrieved from the search query to remove duplicates.
- In the third stage, we thoroughly reviewed the full text of the remaining documents (after removing duplicates) before making the final selection, excluding unrelated studies, highlighting the key sections relevant to our review, and identifying the taxonomy of the research literature on the development of e-nose technology/applications in the field of food quality and safety.
3.2. Preliminary Results Obtained
3.3. Final List of Selected Papers and Taxonomy of the Research Literature on E-Nose for Food Quality and Safety
4. Analysis of the Research Works from the Final List of Selected Publications
4.1. Reviews
4.1.1. Reviews on Advancements in Electronic Nose Systems for Food Industry Applications
4.1.2. Reviews on Sensor Development and Pattern Recognition Techniques in Electronic Nose Systems
4.1.3. Reviews on Recent Sensing Technologies for Food Quality Assessment
4.1.4. Our Review on Sensor-Based Electronic Nose for Food Quality and Safety
- Development and application of a unique taxonomy ensuring broad coverage and reduced selection bias: We conducted an extensive analysis of peer-reviewed studies across three major scientific databases, the taxonomy. The taxonomy enables a systematic evaluation of technological advancements (both sensors and pattern recognition techniques), practical implementations, and performance outcomes across the following food and beverage sectors: meat, seafood, vegetables and fruits, spices, oils, coffee, tea, diary, and alcoholic beverages.
- Decade-long coverage of research results: By capturing trends over an extended period, our review offers an up-to-date perspective on technological evolution and trends.
- Lessons-learned synthesis: Our review identifies critical lessons learned from the existing literature in each category from the taxonomy we developed. The lessons learned will help guide both future academic research and practical development of e-nose systems for food quality and safety.
- Identification of unresolved research gaps: Our review reveals notable gaps that must be addressed in the future. These gaps include the lack of e-nose real-world validation, limitations in sensor sensitivity and stability, challenges in achieving miniaturize and portable e-noses, lack of standardized testing protocols, limited real-time processing capabilities, and insufficient support for user-friendly visualization of odor classification and identification outcomes.
4.2. Electronic Nose Systems for Food Quality and Safety
Lessons Learned
- Cost: The sensors used in the experiments belong to the cheap components’ class, usually included in gas measurement systems, where their main feature is the detection of the presence of a certain gas component. Another characteristic of such systems is the low manufacturing cost. The documentation that comes with the sensors used is brief, containing little relevant information, omitting aspects like the manufacturer-recommended schematics, calibration and compensation methods depending on temperature and relative humidity values, or formulas for converting the voltage or resistance measured by the microcontroller back into the actual physical quantity measured by the sensor. In many cases, the datasheets do not include important characteristics such as precision, accuracy, repeatability, stability over time, or startup periods. Most sensors used are analog, and they do not integrate calibration circuits, drift, compensation or control mechanisms, or an ADC within the same package. As a result, their overall measurement performance is typically poor, and they are further affected by the required external electronics. The BME688 [125] sensor used in [124,152] stands out in a positive way because it includes important circuitry besides the sensing element, which supports advanced functions such as filtering, signal conditioning, the ADC, the compensation table and algorithm, and digital communication with the processing unit, ESP32. The BME688 development kit uses eight sensors instead of one to form a sensor array, which enhances detection performance, especially for low-cost setups. Though calibrated, sensors differ slightly, and tracking signal trends over time across multiple sensors improve reliability. Additionally, free gas flow causes variations in individual sensor responses before steady state, making arrays beneficial.
- Power usage: The energy consumption required by the sensors used is high, and they are suitable for integration with systems powered permanently from the main power outlet. Sensors with heaters that are common in most studies have long response times, between 10 and 300 s, and operate at 200–400 °C. This leads to high power consumption unsuitable for portable devices and faster aging that requires frequent recalibrations. The recommended preheating time, or sensor warm-up time, until the first correct measurements can be extensively long, up to 2 to 7 days in some cases. The power consumed during measurement ranges from 0.3 to 1.0 W, and the continuous operation of the heating element in some sensors makes them unsuitable for use in portable electronic nose systems.
- Data collection: The data acquisition platforms are not designed for instrumentation systems. Most of the proposed solutions use low-resolution ADCs (10- or 12-bit), typically with a 0 to 5 V input range. This leads to an effective resolution per bit of 5 to 10 mV. Temperature and relative humidity compensation are generally based on low-accuracy T and RH sensors (±1 °C for temperature and ±4% for relative humidity), with a few exceptions. In platforms based on ESP32, measurement performance in terms of used digits is further limited by the built-in ADC, which typically offers an effective resolution of only 8 bits. Some proposed electronic nose systems utilize industrial-grade measurement platforms (i.e., PCI6035E, AD7606) and compensation sensors (sensors helping in adjusting the measurement depending on ambient parameters such as temperature, humidity, or pressure) for temperature and relative humidity (i.e., SHT15), which outperform those commonly used in standard gas detectors.
- Portability: Very few papers focus on low-power or portable systems. However, the question of whether a measurement system can be powered from the main outlet is a valid one. In this case, what are the time and logistical efforts required to make the system operational at a different location? For example, when considering the BME688 sensor, a system using it requires 30 min to reach maximum accuracy after power cycling. Other manufacturers do not specify this time requirement, but in some cases, it could require days.
- Data processing: Generally, the accuracy of measurement data is verified through thousands of hours of operation and repeated measurements, ideally conducted on multiple similar devices operating in parallel. Some past research solutions [103,115,119,138,141,163] used professional techniques (i.e., Gas Chromatography–Mass Spectrometry (GC–MS) [176]) to compare their experimental results with reference ones. In all the papers that we reviewed, the number of samples collected by the sensor arrays and used by the machine learning algorithms is rather small (<300 samples). In these conditions, expecting authors to validate their work with equipment that has been running for a full year is not feasible. This raises questions regarding the performance metrics obtained. To validate the results obtained, standard test/evaluation scenarios should be run, not just particular test sets created by the authors of the papers.
4.3. Food Analysis Based on Previously Developed/Commercial Electronic Nose Systems
4.3.1. Commercial Electronic Nose Systems
4.3.2. Electronic Noses Developed by Academic Research Groups
Lessons Learned
- To apply well-known pattern recognition techniques to assess the quality and safety of different types of food: Studies such as [178,188,194,195,196] used PEN3, Fox 3000, and Fox 4000 commercial electronic noses to apply algorithms such as PCA, Random Forest, and ANNs to evaluate the quality of various food categories (meat, fruits, jams, milk). In [186,189,197], the researchers applied well-known pattern recognition techniques (PCA, PLS-DA, Partial Least Squares regression) to both e-nose data (PEN3, Fox 4000) and chromatography analysis results (GC–MS), leveraging the complementary strengths of these methods in chemical analysis and pattern recognition.
- To develop novel models or algorithms for odor identification and classification: Studies such as [183,191,193,202] used data collected from commercial electronic nose devices (PEN3, Cyranose@ 320) to develop novel data models for the identification and classification of odors, demonstrating strong performance.
- To confirm the ability of commercial e-noses to recognize and classify aromas: Studies such as [199,200] proved that the FOODsniffer e-nose can accurately classify meat based on its data analysis, with results validated against GC–MS analysis and physicochemical measurements. The authors of [201] validated NeOse Pro to evaluate the quality of the plant-based beverage by applying PCA and LDA to the e-nose data and comparing the results with those obtained using the same algorithms on GC–MS data.
4.4. Gas Sensors for Electronic Nose Systems
Lessons Learned
4.5. Food-Related Datasets and Algorithms/Techniques for Pattern Recognition Used on Them
Lesson Learned
- Public datasets provide a valuable foundation for developing and testing new models or algorithms for odor identification and classification.
- Public datasets accelerate comparative research. The availability of well-structured datasets has enabled researchers to benchmark different models, promoting transparency and repeatability. As Table 11 shows, deep learning models outperform traditional classifiers in some cases. Additionally, approaches that combine multiple classifiers tend to boost accuracy and model stability. Such comparisons are possible because the researchers employed the same dataset.
- Diverse model strategies provide complementary insights. The use of a wide range of algorithms across datasets shows that no single approach performs best across all datasets and applications. Different algorithms excel under specific data characteristics and task requirements.
- Model performance is dataset dependent. Even if the authors of the cited research efforts reported high accuracies, these are heavily influenced by the specific dataset, number of classes, sensor types, and experimental conditions.
5. Research Gaps and Future Research Opportunities
- Sensor technology: We must develop novel gas-sensitive materials with enhanced selectivity and sensitivity for food VOCs, new gas sensors with fast response time, adaptive calibration methods, and sensor baseline correction techniques to improve the stability of the gas sensors and integrate bio-inspired or biomimetic sensors.
- Data processing: We must implement deep learning algorithms for pattern recognition and VOC classification. We must develop and implement efficient multi-sensor (e-nose, e-tongue, e-eye) data fusion algorithms for a more holistic food profiling approach. Additionally, we must also develop standardized odor databases and reference libraries and real-time data analysis platforms for on-site decision making.
- Miniaturization and portability: We must integrate micro-electro-mechanical systems/ nano-electro-mechanical systems technology for compact and low-power devices. We must also develop reliable wireless and IoT-enabled e-noses for remote monitoring.
- Standardization: We must develop standardized testing protocols across different food types and storage conditions.
6. Conclusions
Author Contributions
Funding
Acknowledgments
Conflicts of Interest
Abbreviations
| ADC | analog-to-digital converters |
| ANNs | artificial neural networks |
| CNN | Convolutional Neural Network |
| CNT | carbon nanotube |
| CP | conducting polymer |
| GC–IMS | Gas Chromatography with Ion Mobility Spectrometry |
| GC–MS | Gas Chromatography–Mass Spectrometry |
| KNNs | k-nearest neighbors |
| LDA | linear discriminant analysis |
| LSTM | Long Short-Term Memory |
| MLP | Multilayer Perceptron |
| MOS | metal oxide semiconductor |
| MSE | Mean Squared Error (MSE) |
| PCA | principal component analysis |
| PIC | Programmable Interface Controller |
| PLS-DA | Partial Least Squares-Discriminant Analysis |
| PNN | Probabilistic Neural Network |
| PPM | Parts per Million |
| QCM | quartz crystal microbalance |
| R2 | R-squared |
| RMSE | Root Mean Square Error |
| SAW | surface acoustic wave |
| SVMs | support vector machines |
| SVR | Support Vector Machine Regression Technique |
| VOCs | volatile organic compounds |
| WoS | Web of Science |
References
- Wilkens, W.F.; Hartman, J.D. An electronic analog for the olfactory processes. Ann. N. Y. Acad. Sci. 1964, 116, 608–612. [Google Scholar] [CrossRef] [PubMed]
- Buck, T.; Allen, F.; Dalton, J. Detection of Chemical Species by Surface Effects on Metals and Semiconductors; Bell Telephone System Technical Publications; Bell Telephone Laboratories: Murray Hill, NJ, USA, 1965; Available online: https://books.google.ro/books?id=08s_mwEACAAJ (accessed on 7 July 2025).
- Dravnieks, A.; Trotter, P. Polar vapour detector based on thermal modulation of contact potential. J. Sci. Instruments 1965, 42, 624. [Google Scholar] [CrossRef]
- Persaud, K.; Dodd, G. Analysis of discrimination mechanisms in the mammalian olfactory system using a model nose. Nature 1982, 299, 352–355. [Google Scholar] [CrossRef] [PubMed]
- Ikegami, A.; Kaneyasu, M. Olfactory detection using integrated sensors. Dig. Tech. Pap. Transducers 1985, 85, 136–139. [Google Scholar]
- Gardner, J.W.; Bartlett, P.N. A brief history of electronic noses. Sens. Actuators B Chem. 1994, 18, 210–211. [Google Scholar] [CrossRef]
- Yu, X.; Fu, L.; Wang, T.; Liu, Z.; Niu, N.; Chen, L. Multivariate chemical analysis: From sensors to sensor arrays. Chin. Chem. Lett. 2024, 35, 109167. [Google Scholar] [CrossRef]
- Freddi, S.; Sangaletti, L. Trends in the Development of Electronic Noses Based on Carbon Nanotubes Chemiresistors for Breathomics. Nanomaterials 2022, 12, 2992. [Google Scholar] [CrossRef] [PubMed]
- Furizal, F.; Ma’arif, A.; Firdaus, A.; Rahmaniar, W. Future Potential of E-Nose Technology: A Review. Int. J. Robot. Control Syst. 2023, 3, 449–469. [Google Scholar] [CrossRef]
- Goel, N.; Kunal, K.; Kushwaha, A.; Kumar, M. Metal oxide semiconductors for gas sensing. Eng. Rep. 2023, 5, e12604. [Google Scholar] [CrossRef]
- Luo, K.; Peng, H.; Zhang, B.; Chen, L.; Zhang, P.; Peng, Z.; Fu, X. Advances in carbon nanotube-based gas sensors: Exploring the path to the future. Coord. Chem. Rev. 2024, 518, 216049. [Google Scholar] [CrossRef]
- Abdel-Hakim, M.; Sayed, M.M. Conducting Polymers Sensor. In Handbook of Nanosensors: Materials and Technological Applications; Ali, G.A.M., Chong, K.F., Makhlouf, A.S.H., Eds.; Springer Nature: Cham, Switzerland, 2024; pp. 229–262. [Google Scholar] [CrossRef]
- Johannsmann, D.; Langhoff, A.; Leppin, C. Studying Soft Interfaces with Shear Waves: Principles and Applications of the Quartz Crystal Microbalance (QCM). Sensors 2021, 21, 3490. [Google Scholar] [CrossRef] [PubMed]
- Mandal, D.; Banerjee, S. Surface Acoustic Wave (SAW) Sensors: Physics, Materials, and Applications. Sensors 2022, 22, 820. [Google Scholar] [CrossRef] [PubMed]
- Williams, D.E. Electrochemical sensors for environmental gas analysis. Curr. Opin. Electrochem. 2020, 22, 145–153. [Google Scholar] [CrossRef]
- Mishra, V.; Rashmi, R.; Khera, S. Optical Gas Sensors; IntechOpen: London, UK, 2022. [Google Scholar] [CrossRef]
- Salaün, A.C.; Le Bihan, F.; Pichon, L. Field Effect Transistor Technologies for Biological and Chemical Sensors. In Smart Sensors for Environmental and Medical Applications; John Wiley & Sons, Ltd.: Hoboken, NJ, USA, 2020; Chapter 2; pp. 11–41. [Google Scholar] [CrossRef]
- Wang, C.; Chen, Z.; Chan, C.L.J.; Wan, Z.A.; Ye, W.; Tang, W.; Ma, Z.; Ren, B.; Zhang, D.; Song, Z.; et al. Biomimetic olfactory chips based on large-scale monolithically integrated nanotube sensor arrays. Nat. Electron. 2024, 7, 157–167. [Google Scholar] [CrossRef]
- Balasurya, S.; Kokilavani, S.; Janani, B.; Sudheer Khan, S. 5–Recent advances in bioelectronic noses based on olfactory receptors. In Nanotechnology-Based E-Noses; Gupta, R.K., Nguyen, T.A., Bilal, M., Ahmadi, M., Eds.; Woodhead Publishing Series in Electronic and Optical Materials; Woodhead Publishing: Sawston, UK, 2023; pp. 125–141. [Google Scholar] [CrossRef]
- Jolliffe, I.T.; Cadima, J. Principal component analysis: A review and recent developments. Philos. Trans. R. Soc. A Math. Phys. Eng. Sci. 2016, 374, 20150202. [Google Scholar] [CrossRef] [PubMed]
- Xanthopoulos, P.; Pardalos, P.M.; Trafalis, T.B. Linear Discriminant Analysis. In Robust Data Mining; Springer: New York, NY, USA, 2013; pp. 27–33. [Google Scholar] [CrossRef]
- Walczak, S.; Cerpa, N. Artificial Neural Networks. In Encyclopedia of Physical Science and Technology, 3rd ed.; Meyers, R.A., Ed.; Academic Press: New York, NY, USA, 2003; pp. 631–645. [Google Scholar] [CrossRef]
- Wang, L. Support Vector Machines: Theory and Applications; Springer: Berlin/Heidelberg, Germany, 2005. [Google Scholar] [CrossRef]
- Zhang, Z. Introduction to machine learning: K-nearest neighbors. Ann. Transl. Med. 2016, 4, 218. [Google Scholar] [CrossRef] [PubMed]
- Borowik, P.; Grzywacz, T.; Tarakowski, R.; Tkaczyk, M.; Ślusarski, S.; Dyshko, V.; Oszako, T. Development of a Low-Cost Electronic Nose with an Open Sensor Chamber: Application to Detection of Ciboria batschiana. Sensors 2023, 23, 627. [Google Scholar] [CrossRef] [PubMed]
- Zhai, Z.; Liu, Y.; Li, C.; Wang, D.; Wu, H. Electronic Noses: From Gas-Sensitive Components and Practical Applications to Data Processing. Sensors 2024, 24, 4806. [Google Scholar] [CrossRef] [PubMed]
- Li, Y.; Wang, Z.; Zhao, T.; Li, H.; Jiang, J.; Ye, J. Electronic nose for the detection and discrimination of volatile organic compounds: Application, challenges, and perspectives. TrAC Trends Anal. Chem. 2024, 180, 117958. [Google Scholar] [CrossRef]
- Wang, M.; Chen, Y. Electronic nose and its application in the food industry: A review. Eur. Food Res. Technol. 2024, 250, 21–67. [Google Scholar] [CrossRef]
- Wang, Y.; Feng, Y.; Zhang, B.; Upadhyay, A.; Xiao, Z.; Luo, Y. Machine learning-supported sensor array for multiplexed foodborne pathogenic bacteria detection and identification. Trends Food Sci. Technol. 2024, 154, 104787. [Google Scholar] [CrossRef]
- Ali, A.; Mansol, A.S.; Khan, A.A.; Muthoosamy, K.; Siddiqui, Y. Electronic nose as a tool for early detection of diseases and quality monitoring in fresh postharvest produce: A comprehensive review. Compr. Rev. Food Sci. Food Saf. 2023, 22, 2408–2432. [Google Scholar] [CrossRef] [PubMed]
- Roy, M.; Yadav, B. Electronic nose for detection of food adulteration: A review. J. Food Sci. Technol. 2022, 59, 846–858. [Google Scholar] [CrossRef] [PubMed]
- Al-Dayyeni, W.S.; Al-Yousif, S.; Taher, M.M.; Al-Faouri, A.W.; Tahir, N.M.; Jaber, M.M.; Ghabban, F.; Najm, I.A.; Alfadli, I.M.; Ameerbakhsh, O.Z.; et al. A Review on Electronic Nose: Coherent Taxonomy, Classification, Motivations, Challenges, Recommendations and Datasets. IEEE Access 2021, 9, 88535–88551. [Google Scholar] [CrossRef]
- Mohd Ali, M.; Hashim, N.; Abd Aziz, S.; Lasekan, O. Principles and recent advances in electronic nose for quality inspection of agricultural and food products. Trends Food Sci. Technol. 2020, 99, 1–10. [Google Scholar] [CrossRef]
- Bonah, E.; Huang, X.; Aheto, J.H.; Osae, R. Application of electronic nose as a non-invasive technique for odor fingerprinting and detection of bacterial foodborne pathogens: A review. J. Food Sci. Technol. 2020, 57, 1977–1990. [Google Scholar] [CrossRef] [PubMed]
- Sanaeifar, A.; ZakiDizaji, H.; Jafari, A.; de la Guardia, M. Early detection of contamination and defect in foodstuffs by electronic nose: A review. TrAC Trends Anal. Chem. 2017, 97, 257–271. [Google Scholar] [CrossRef]
- Gliszczyńska-Świgło, A.; Chmielewski, J. Electronic Nose as a Tool for Monitoring the Authenticity of Food. A Review. Food Anal. Methods 2017, 10, 1800–1816. [Google Scholar] [CrossRef]
- Loutfi, A.; Coradeschi, S.; Mani, G.K.; Shankar, P.; Rayappan, J.B.B. Electronic noses for food quality: A review. J. Food Eng. 2015, 144, 103–111. [Google Scholar] [CrossRef]
- Sun, X.; Wang, S.; Jia, W. Research Progress of Electronic Nose and Near-Infrared Spectroscopy in Meat Adulteration Detection. Chemosensors 2024, 12, 35. [Google Scholar] [CrossRef]
- Khaled, A.Y.; Parrish, C.A.; Adedeji, A. Emerging Nondestructive Approaches for Meat Quality and Safety Evaluation—A Review. Compr. Rev. Food Sci. Food Saf. 2021, 20, 3438–3463. [Google Scholar] [CrossRef] [PubMed]
- Zaukuu, J.L.Z.; Bazar, G.; Gillay, Z.; Kovacs, Z. Emerging trends of advanced sensor based instruments for meat, poultry and fish quality—A review. Crit. Rev. Food Sci. Nutr. 2020, 60, 3443–3460. [Google Scholar] [CrossRef] [PubMed]
- Jia, W.; Liang, G.; Wang, Y.; Wang, J. Electronic Noses as a Powerful Tool for Assessing Meat Quality: A Mini Review. Food Anal. Methods 2018, 11, 2916–2924. [Google Scholar] [CrossRef]
- Wang, D.; Zhang, M.; Mujumdar, A.S.; Yu, D. Advanced Detection Techniques Using Artificial Intelligence in Processing of Berries. Food Eng. Rev. 2022, 14, 176–199. [Google Scholar] [CrossRef]
- Modesti, M.; Taglieri, I.; Bianchi, A.; Tonacci, A.; Sansone, F.; Bellincontro, A.; Venturi, F.; Sanmartin, C. E-Nose and Olfactory Assessment: Teamwork or a Challenge to the Last Data? The Case of Virgin Olive Oil Stability and Shelf Life. Appl. Sci. 2021, 11, 8453. [Google Scholar] [CrossRef]
- Majchrzak, T.; Wojnowski, W.; Dymerski, T.; Gębicki, J.; Namieśnik, J. Electronic noses in classification and quality control of edible oils: A review. Food Chem. 2018, 246, 192–201. [Google Scholar] [CrossRef] [PubMed]
- Osmólska, E.; Stoma, M.; Starek-Wójcicka, A. Juice Quality Evaluation with Multisensor Systems—A Review. Sensors 2023, 23, 4824. [Google Scholar] [CrossRef] [PubMed]
- Nagraik, R.; Sharma, A.; Kumar, D.; Chawla, P.; Kumar, A.P. Milk adulterant detection: Conventional and biosensor based approaches: A review. Sens. Bio-Sens. Res. 2021, 33, 100433. [Google Scholar] [CrossRef]
- Yakubu, H.G.; Kovacs, Z.; Toth, T.; and, G.B. Trends in artificial aroma sensing by means of electronic nose technologies to advance dairy production—A review. Crit. Rev. Food Sci. Nutr. 2023, 63, 234–248. [Google Scholar] [CrossRef] [PubMed]
- Kaushal, S.; Nayi, P.; Rahadian, D.; Chen, H.H. Applications of Electronic Nose Coupled with Statistical and Intelligent Pattern Recognition Techniques for Monitoring Tea Quality: A Review. Agriculture 2022, 12, 1359. [Google Scholar] [CrossRef]
- Alfieri, G.; Modesti, M.; Riggi, R.; Bellincontro, A. Recent Advances and Future Perspectives in the E-Nose Technologies Addressed to the Wine Industry. Sensors 2024, 24, 2293. [Google Scholar] [CrossRef] [PubMed]
- Rodríguez-Méndez, M.L.; De Saja, J.A.; González-Antón, R.; García-Hernández, C.; Medina-Plaza, C.; García-Cabezón, C.; Martín-Pedrosa, F. Electronic Noses and Tongues in Wine Industry. Front. Bioeng. Biotechnol. 2016, 4, 81. [Google Scholar] [CrossRef] [PubMed]
- Shuba, A.; Umarkhanov, R.; Bogdanova, E.; Anokhina, E.; Burakova, I. Possibilities of an Electronic Nose on Piezoelectric Sensors with Polycomposite Coatings to Investigate the Microbiological Indicators of Milk. Sensors 2024, 24, 3634. [Google Scholar] [CrossRef] [PubMed]
- Nemufulwi, M.I.; Swart, H.C.; Mhlongo, G.H. Advances of Nano-Enabled ZnFe2O4 Based-Gas Sensors for VOC Detection and Their Potential Applications: A Review. Processes 2023, 11, 3122. [Google Scholar] [CrossRef]
- Kumar, A.; Castro, M.; Feller, J.F. Review on Sensor Array-Based Analytical Technologies for Quality Control of Food and Beverages. Sensors 2023, 23, 4017. [Google Scholar] [CrossRef] [PubMed]
- Wu, K.; Debliquy, M.; Zhang, C. Metal–oxide–semiconductor resistive gas sensors for fish freshness detection. Compr. Rev. Food Sci. Food Saf. 2023, 22, 913–945. [Google Scholar] [CrossRef] [PubMed]
- Chia, M.R.; Phang, S.W.; Ahmad, I. Emerging Applications of Versatile Polyaniline-Based Polymers in the Food Industry. Polymers 2022, 14, 5168. [Google Scholar] [CrossRef] [PubMed]
- Zhang, H.; Chan-Park, M.B.; Wang, M. Functional Polymers and Polymer–Dye Composites for Food Sensing. Macromol. Rapid Commun. 2020, 41, 2000279. [Google Scholar] [CrossRef] [PubMed]
- He, S.; Yuan, Y.; Nag, A.; Feng, S.; Afsarimanesh, N.; Han, T.; Mukhopadhyay, S.C.; Organ, D.R. A Review on the Use of Impedimetric Sensors for the Inspection of Food Quality. Int. J. Environ. Res. Public Health 2020, 17, 5220. [Google Scholar] [CrossRef] [PubMed]
- Ponzoni, A.; Baratto, C.; Cattabiani, N.; Falasconi, M.; Galstyan, V.; Nunez-Carmona, E.; Rigoni, F.; Sberveglieri, V.; Zambotti, G.; Zappa, D. Metal Oxide Gas Sensors, a Survey of Selectivity Issues Addressed at the SENSOR Lab, Brescia (Italy). Sensors 2017, 17, 714. [Google Scholar] [CrossRef] [PubMed]
- Ji, H.; Pu, D.; Yan, W.; Zhang, Q.; Zuo, M.; Zhang, Y. Recent advances and application of machine learning in food flavor prediction and regulation. Trends Food Sci. Technol. 2023, 138, 738–751. [Google Scholar] [CrossRef]
- Lin, Y.; Ma, J.; Wang, Q.; Sun, D.W. Applications of Machine Learning Techniques for Enhancing Nondestructive Food Quality and Safety Detection. Crit. Rev. Food Sci. Nutr. 2023, 63, 1649–1669. [Google Scholar] [CrossRef] [PubMed]
- Salehi, F. Recent Advances in the Modeling and Predicting Quality Parameters of Fruits and Vegetables during Postharvest Storage: A Review. Int. J. Fruit Sci. 2020, 20, 506–520. [Google Scholar] [CrossRef]
- Sun, Q.; Zhang, M.; Mujumdar, A.S. Recent developments of artificial intelligence in drying of fresh food: A review. Crit. Rev. Food Sci. Nutr. 2019, 59, 2258–2275. [Google Scholar] [CrossRef] [PubMed]
- Gil, M.; Rudy, M.; Duma-Kocan, P.; Stanisławczyk, R. Electronic Sensing Technologies in Food Quality Assessment: A Comprehensive Literature Review. Appl. Sci. 2025, 15, 1530. [Google Scholar] [CrossRef]
- Tibaduiza, D.; Anaya, M.; Gómez, J.; Sarmiento, J.; Perez, M.; Lara, C.; Ruiz, J.; Osorio, N.; Rodriguez, K.; Hernandez, I.; et al. Electronic Tongues and Noses: A General Overview. Biosensors 2024, 14, 190. [Google Scholar] [CrossRef] [PubMed]
- Grassi, S.; Benedetti, S.; Casiraghi, E.; Buratti, S. E-sensing systems for shelf life evaluation: A review on applications to fresh food of animal origin. Food Packag. Shelf Life 2023, 40, 101221. [Google Scholar] [CrossRef]
- Poeta, E.; Liboà, A.; Mistrali, S.; Núñez-Carmona, E.; Sberveglieri, V. Nanotechnology and E-Sensing for Food Chain Quality and Safety. Sensors 2023, 23, 8429. [Google Scholar] [CrossRef] [PubMed]
- Lu, L.; Hu, Z.; Hu, X.; Li, D.; Tian, S. Electronic tongue and electronic nose for food quality and safety. Food Res. Int. 2022, 162, 112214. [Google Scholar] [CrossRef] [PubMed]
- Modesti, M.; Tonacci, A.; Sansone, F.; Billeci, L.; Bellincontro, A.; Cacopardo, G.; Sanmartin, C.; Taglieri, I.; Venturi, F. E-Senses, Panel Tests and Wearable Sensors: A Teamwork for Food Quality Assessment and Prediction of Consumer’s Choices. Chemosensors 2022, 10, 244. [Google Scholar] [CrossRef]
- Calvini, R.; Pigani, L. Toward the Development of Combined Artificial Sensing Systems for Food Quality Evaluation: A Review on the Application of Data Fusion of Electronic Noses, Electronic Tongues and Electronic Eyes. Sensors 2022, 22, 577. [Google Scholar] [CrossRef] [PubMed]
- Aouadi, B.; Zaukuu, J.L.Z.; Vitális, F.; Bodor, Z.; Fehér, O.; Gillay, Z.; Bazar, G.; Kovacs, Z. Historical Evolution and Food Control Achievements of Near Infrared Spectroscopy, Electronic Nose, and Electronic Tongue—Critical Overview. Sensors 2020, 20, 5479. [Google Scholar] [CrossRef] [PubMed]
- Tan, J.; Xu, J. Applications of electronic nose (e-nose) and electronic tongue (e-tongue) in food quality-related properties determination: A review. Artif. Intell. Agric. 2020, 4, 104–115. [Google Scholar] [CrossRef]
- Son, M.; Park, T.H. The bioelectronic nose and tongue using olfactory and taste receptors: Analytical tools for food quality and safety assessment. Biotechnol. Adv. 2018, 36, 371–379. [Google Scholar] [CrossRef] [PubMed]
- Peris, M.; Escuder-Gilabert, L. Electronic noses and tongues to assess food authenticity and adulteration. Trends Food Sci. Technol. 2016, 58, 40–54. [Google Scholar] [CrossRef]
- Wang, D.; Zhang, M.; Jiang, Q.; Mujumdar, A.S. Intelligent System/Equipment for Quality Deterioration Detection of Fresh Food: Recent Advances and Application. Foods 2024, 13, 1662. [Google Scholar] [CrossRef] [PubMed]
- Lin, H.; Jiang, H.; Adade, S.Y.S.S.; Kang, W.; Xue, Z.; Zareef, M.; and, Q.C. Overview of advanced technologies for volatile organic compounds measurement in food quality and safety. Crit. Rev. Food Sci. Nutr. 2023, 63, 8226–8248. [Google Scholar] [CrossRef] [PubMed]
- Amalia, A.; Rivai, M.; Purwanto, D. Indoor Beef Quality Identification Using Gas Sensor Array and Probabilistic Neural Network Method. In Proceedings of the 2024 IEEE International Conference on Artificial Intelligence and Mechatronics Systems (AIMS), Virtual, 22–23 February 2024; pp. 1–5. [Google Scholar] [CrossRef]
- Hanwei Electronics Co., Ltd. MQ Series Gas Sensors. Available online: https://www.hwsensor.com/ (accessed on 14 March 2025).
- Figaro Engineering Inc. TGS Series Gas Sensors. Available online: https://www.figaro.co.jp/en/product/sensor/ (accessed on 14 March 2025).
- Mohebali, B.; Tahmassebi, A.; Meyer-Baese, A.; Gandomi, A.H. Chapter 14–Probabilistic neural networks: A brief overview of theory, implementation, and application. In Handbook of Probabilistic Models; Samui, P., Tien Bui, D., Chakraborty, S., Deo, R.C., Eds.; Butterworth-Heinemann: Oxford, UK, 2020; pp. 347–367. [Google Scholar] [CrossRef]
- Damdam, A.N.; Ozay, L.O.; Ozcan, C.K.; Alzahrani, A.; Helabi, R.; Salama, K.N. IoT-Enabled Electronic Nose System for Beef Quality Monitoring and Spoilage Detection. Foods 2023, 12, 2227. [Google Scholar] [CrossRef] [PubMed]
- Aosong Electronics Co., Ltd. AM2302 (DHT22) Temperature and Humidity Sensor. Available online: https://cdn.sparkfun.com/assets/f/7/d/9/c/DHT22.pdf (accessed on 14 March 2025).
- Winsen Electronics Technology Co., Ltd. MH-Z19C–NDIR CO2 Sensor Module. Available online: https://www.winsen-sensor.com/sensors/co2-sensor/mh-z19c.html (accessed on 14 March 2025).
- Winsen Electronics Technology Co., Ltd. Electrochemical Gas Detection Module. User’s Manual V2.8. Model: ZE03. Available online: https://www.winsen-sensor.com/d/files/ze03-electrochemical-module-manualv2_8(3).pdf (accessed on 14 March 2025).
- Espressif Systems. ESP32-S3–Wi-Fi and Bluetooth Microcontroller. Available online: https://www.espressif.com/en/products/socs/esp32-s3 (accessed on 14 March 2025).
- Draper, N.R.; Smith, H. Applied Regression Analysis, 3rd ed.; John Wiley & Sons: New York, NY, USA, 1998. [Google Scholar] [CrossRef]
- Mada Sanjaya, W.S.; Roziqin, A.; Purnama Sari, N.A.M.; Sintia, P.; Alamsyah, F.; Putra, T.F.; Taqwim, A.; Mubasyir, F.H.; Temiesela, A.W.; Zaman, M.F.B.; et al. Chicken Meat Freshness Evaluation using Support Vector Machine Method and Raspberry Pi 4 based Electronic Nose. In Proceedings of the 2023 IEEE 9th Information Technology International Seminar (ITIS), Batu Malang, Indonesia, 18–20 October 2023; pp. 1–6. [Google Scholar] [CrossRef]
- Arduino. Arduino Mega 2560 Rev3–Microcontroller Board. Available online: https://docs.arduino.cc/hardware/mega-2560/?_gl=1*11yinyr*_up*MQ..*_ga*MTQyNTM5MTk0NC4xNzQyMTI2Mzk4*_ga_NEXN8H46L5*MTc0MjEyNjM5Ni4xLjAuMTc0MjEyNjM5Ni4wLjAuMjAwODkwNTQ4NQ (accessed on 14 March 2025).
- The Raspberry Pi Foundation. Raspberry Pi 4 Model B–Single Board Computer. Available online: https://www.raspberrypi.com/products/raspberry-pi-4-model-b/ (accessed on 14 March 2025).
- Anwar, H.; Anwar, T. Quality assessment of chicken using machine learning and electronic nose. Sens. Bio-Sens. Res. 2025, 47, 100739. [Google Scholar] [CrossRef]
- Kuongshun Electronic, Ltd. DHT22/AM2302 Digital Temperature Humidity Sensor. Available online: https://www.kuongshun-ks.com/uno/uno-sensor/dht22-am2302-digital-temperature-humidity-sensor.html (accessed on 14 March 2025).
- Breiman, L. Random Forests. Mach. Learn. 2001, 45, 5–32. [Google Scholar] [CrossRef]
- Ren, X.; Wang, Y.; Huang, Y.; Sun, D.; Xu, L.; Wu, F. E-nose System using CNN and Abstract Odor Map to Classify Meat Freshness. In Proceedings of the 2023 IEEE 6th Information Technology, Networking, Electronic and Automation Control Conference (ITNEC), Chongqing, China, 24–26 February 2023; Volume 6, pp. 1200–1204. [Google Scholar] [CrossRef]
- Hefei Micro Nano Sensing Technology Co., Ltd. HGS1000, HGS1001, HGS1002 MEMS Gas Sensors. Available online: https://www.pilotagemicrosystem.com/ (accessed on 14 March 2025).
- O’Shea, K.; Nash, R. An Introduction to Convolutional Neural Networks. arXiv 2015. [Google Scholar] [CrossRef]
- Li, L.; Wu, Y.; Ou, Y.; Li, Q.; Zhou, Y.; Chen, D. Research on machine learning algorithms and feature extraction for time series. In Proceedings of the 2017 IEEE 28th Annual International Symposium on Personal, Indoor, and Mobile Radio Communications (PIMRC), Montreal, QC, Canada, 8–13 October 2017; pp. 1–5. [Google Scholar] [CrossRef]
- Laga, S.A.; Sarno, R. Optimal Sample Temperature of Electronic Nose For Detecting Beef and Pork Mixture. In Proceedings of the 2019 International Conference on Information and Communications Technology (ICOIACT), Yogyakarta, Indonesia, 24–25 July 2019; pp. 398–402. [Google Scholar] [CrossRef]
- Zakaria, E.; Wijaya, D.R.; Gunawan, T. Predicting Microbial Populations in Seafood using Support Vector Regression Algorithms and Electronic Nose. In Proceedings of the 2023 International Conference on Artificial Intelligence Robotics, Signal and Image Processing (AIRoSIP), Yogyakarta, Indonesia, 9–10 August 2023; pp. 280–284. [Google Scholar] [CrossRef]
- Drucker, H.; Burges, C.J.C.; Kaufman, L.; Smola, A.; Vapnik, V. Support Vector Regression Machines. Adv. Neural Inf. Process. Syst. (NIPS) 1997, 9, 155–161. Available online: https://proceedings.neurips.cc/paper_files/paper/1996/file/d38901788c533e8286cb6400b40b386d-Paper.pdf (accessed on 16 March 2025).
- Wang, X.; Yu, G.; Liu, R.P.; Zhang, J.; Wu, Q.; Su, S.W.; He, Y.; Zhang, Z.; Yu, L.; Liu, T.; et al. Blockchain-Enabled Fish Provenance and Quality Tracking System. IEEE Internet Things J. 2022, 9, 8130–8142. [Google Scholar] [CrossRef]
- Hermawan, L.M.; Novamizanti, L.; Wijaya, D.R. Crab Quality Detection with Gas Sensors Using a Machine Learning. In Proceedings of the 2024 IEEE International Conference on Internet of Things and Intelligence Systems (IoTaIS), Bali, Indonesia, 28–30 November 2024; pp. 270–275. [Google Scholar] [CrossRef]
- Duda, R.O.; Hart, P.E. Pattern Classification and Scene Analysis; John Wiley & Sons: New York, NY, USA, 1973. [Google Scholar] [CrossRef]
- Astuti, S.D.; Isyrofie, A.I.F.A.; Nashichah, R.; Kashif, M.; Mujiwati, T.; Susilo, Y.; Winarno.; Syahrom, A. Gas Array Sensors based on Electronic Nose for Detection of Tuna (Euthynnus Affinis) Contaminated by Pseudomonas aeruginosa. J. Med. Signals Sens. 2022, 12, 306–316. [Google Scholar] [CrossRef] [PubMed]
- Jiang, C.; Ning, J.; Mei, Z.; Chen, J.; Gao, Y.; Yi, X.; Wu, P. Development of food electronic nose for prawn (macrobrachium rosenbergii) quality rapid assessment and their relationship with the physicochemical index. Int. J. Food Prop. 2021, 24, 346–353. [Google Scholar] [CrossRef]
- Padilla, D.A.; Krystine, D.; Anticuando, M.; Directo, C.K.R. An Electronic Nose Approach in Identifying Ripe Tomato Fruit Using LeNet-5 Structure. In Proceedings of the 2024 7th International Conference on Information and Computer Technologies (ICICT), Honolulu, HI, USA, 15–17 March 2024; pp. 223–227. [Google Scholar] [CrossRef]
- Anticuando, M.K.D.; Directo, C.K.R.; Padilla, D.A. Electronic Nose and Deep Learning Approach in Identifying Ripe Lycopersicum esculentum L. TomatoFruit. In Proceedings of the 2022 13th International Conference on Computing Communication and Networking Technologies (ICCCNT), Kharagpur, India, 3–5 October 2022; pp. 1–6. [Google Scholar] [CrossRef]
- Affognon, L.; Diallo, A.; Diallo, C.; Ezin, E.C. Supervised Learning Models for Tomato Quality Prediction Using Electronic Nose Data. In Proceedings of the 2023 International Conference on Electrical, Computer and Energy Technologies (ICECET), Cape Town, South Africa, 16–17 November 2023; pp. 1–6. [Google Scholar] [CrossRef]
- Concepcion, R.S.; Sybingco, E.; Lauguico, S.C.; Dadios, E.P. Implementation of Multilayer Perceptron Neural Network on Quality Assessment of Tomato Puree in Aerobic Storage using Electronic Nose. In Proceedings of the 2019 IEEE International Conference on Cybernetics and Intelligent Systems (CIS) and IEEE Conference on Robotics, Automation and Mechatronics (RAM), Bangkok, Thailand, 18–20 November 2019; pp. 65–70. [Google Scholar] [CrossRef]
- Concepcion, R.S.; Bandala, A.A.; Bedruz, R.A.R.; Dadios, E.P. Fuzzy Classification Approach on Quality Deterioration Assessment of Tomato Puree in Aerobic Storage using Electronic Nose. In Proceedings of the 2019 IEEE 11th International Conference on Humanoid, Nanotechnology, Information Technology, Communication and Control, Environment, and Management (HNICEM), Laoag, Philippines, 29 November–1 December 2019; pp. 1–6. [Google Scholar] [CrossRef]
- e Gizmo Mechatronix Central. Gizduino: Arduino Compatible Kit. 2011. Available online: https://www.e-gizmo.net/oc/kits%20documents/Gizduino/Gizduino%20manual.pdf (accessed on 16 March 2025).
- Yen, J. Fuzzy logic-a modern perspective. IEEE Trans. Knowl. Data Eng. 1999, 11, 153–165. [Google Scholar] [CrossRef]
- Ebenezer L, B.; A, S.; Baskar, C. Freshness Monitoring of Broccoli Using Intelligent Electronic Nose Systems for Sustainability in Food Supply Chains. In Proceedings of the 2024 International Conference on Smart Electronics and Communication Systems (ISENSE), Kottayam, India, 6–7 December 2024; pp. 1–6. [Google Scholar] [CrossRef]
- van der Maaten, L.; Hinton, G. Visualizing Data using t-SNE. J. Mach. Learn. Res. 2008, 9, 2579–2605. Available online: http://jmlr.org/papers/v9/vandermaaten08a.html (accessed on 16 March 2025).
- MacQueen, J.B. Some Methods for Classification and Analysis of Multivariate Observations. In Proceedings of the Fifth Berkeley Symposium on Mathematical Statistics and Probability; University of California Press: Berkeley, CA, USA, 1967; Volume 1, pp. 281–297. Available online: https://projecteuclid.org/euclid.bsmsp/1200512992 (accessed on 16 March 2025).
- Hochreiter, S.; Schmidhuber, J. Long Short-Term Memory. Neural Comput. 1997, 9, 1735–1780. [Google Scholar] [CrossRef] [PubMed]
- Ezhilan, M.; Nesakumar, N.; Babu, K.J.; Srinandan, C.; Rayappan, J.B.B. Freshness Assessment of Broccoli using Electronic Nose. Measurement 2019, 145, 735–743. [Google Scholar] [CrossRef]
- Microchip Technology Inc. ATmega8. Available online: https://www.microchip.com/en-us/product/atmega8 (accessed on 18 March 2025).
- Rana, S.; Bisht, Y.; Tyagi, G.; Badoni, A. FruitfulInsight: IOT and ML-Based System to Predict Expiry of Fruits. In Proceedings of the 2024 2nd International Conference on Device Intelligence, Computing and Communication Technologies (DICCT), Dehradun, India, 15–16 March 2024; pp. 148–153. [Google Scholar] [CrossRef]
- Espressif Systems. NodeMcu Connect Things EASY. Available online: https://www.nodemcu.com/index_en.html (accessed on 18 March 2025).
- Chen, L.Y.; Wu, C.C.; Chou, T.I.; Chiu, S.W.; Tang, K.T. Development of a Dual MOS Electronic Nose/Camera System for Improving Fruit Ripeness Classification. Sensors 2018, 18, 3256. [Google Scholar] [CrossRef] [PubMed]
- National Instruments. NI USB-6008/6009. 2023. Available online: https://www.ni.com/docs/en-US/bundle/usb-6008-6009-feature/page/introduction.html (accessed on 16 March 2025).
- Elbi, M.D.; Özgören Çapraz, E.; Şahin, E.; Koyuncuoğlu, M.U.; Tuncer, C. A classification based on support vector machines for monitoring avocado fruit quality. Pamukkale Üniversitesi Mühendislik Bilim. Derg. 2024, 30, 343–353. [Google Scholar] [CrossRef]
- Arduino. Arduino Due–Microcontroller Board. Available online: https://docs.arduino.cc/hardware/due/ (accessed on 18 March 2025).
- Caya, M.V.C.; Cruz, F.R.G.; Fernando, C.M.N.; Lafuente, R.M.M.; Malonzo, M.B.; Chung, W.Y. Monitoring and Detection of Fruits and Vegetables Spoilage in the Refrigerator using Electronic Nose Based on Principal Component Analysis. In Proceedings of the 2019 IEEE 11th International Conference on Humanoid, Nanotechnology, Information Technology, Communication and Control, Environment, and Management (HNICEM), Laoag, Philippines, 29 November–1 December 2019; pp. 1–6. [Google Scholar] [CrossRef]
- Tămâian, A.; Folea, S. Spoiled Food Detection Using a Matrix of Gas Sensors. In Proceedings of the 2024 IEEE International Conference on Automation, Quality and Testing, Robotics (AQTR), Cluj-Napoca, Romania, 16–18 May 2024; pp. 1–5. [Google Scholar] [CrossRef]
- Bosch Sensortec. BME688–Digital Low Power Gas, Pressure, Temperature & Humidity Sensor with AI. Technical Report, Bosch Sensortec. 2024. Available online: https://www.bosch-sensortec.com/products/environmental-sensors/gas-sensors/bme688/ (accessed on 18 March 2025).
- Adafruit. Adafruit HUZZAH32–ESP32 Feather. Technical Report, Adafruit Industries. 2024. Available online: https://cdn-learn.adafruit.com/downloads/pdf/adafruit-huzzah32-esp32-feather.pdf (accessed on 18 March 2025).
- Omatu, S.; Yano, M. E-nose system by using neural networks. Neurocomputing 2016, 172, 394–398. [Google Scholar] [CrossRef]
- Bhujbal, K.; Rawat, A. Artificial Nose: Machine Learning model for categorization & identification of spices. In Proceedings of the 2023 International Conference on Computational Intelligence, Communication Technology and Networking (CICTN), Ghaziabad, India, 20–21 April 2023; pp. 596–599. [Google Scholar] [CrossRef]
- Kukade, M.; Karve, T.; Gharpure, D. Identification and Classification of Spices by Machine Learning. In Proceedings of the 2019 IEEE International Conference on Intelligent Systems and Green Technology (ICISGT), Visakhapatnam, India, 29–30 June 2019; pp. 1–13. [Google Scholar] [CrossRef]
- Yunxiang, L.; Tianwei, L. Study on electronic nose and algorithm for identification of spice. In Proceedings of the 2016 First IEEE International Conference on Computer Communication and the Internet (ICCCI), Wuhan, China, 13–15 October 2016; pp. 518–521. [Google Scholar] [CrossRef]
- Analog Devices. AD7606: 16-Bit, 8-Channel, Simultaneous Sampling Analog-to-Digital Converter (ADC). 2019. Available online: https://www.analog.com/en/products/ad7606.html (accessed on 18 March 2025).
- Samsung Electronics. S3C6410: ARM11-Based Mobile Application Processor. 2009. Available online: https://www.samsung.com/semiconductor/ (accessed on 18 March 2025).
- Choirul Amri, T.; Sarno, R.; Sunaryono, D.; Ahsana Putri, R. Clustering in A Sensor Array System Based on The Distribution of Volatile Compounds from Palm Oil Using Electronic Nose. In Proceedings of the 2024 16th International Conference on Information Technology and Electrical Engineering (ICITEE), Bali, Indonesia, 23–25 October 2024; pp. 189–194. [Google Scholar] [CrossRef]
- Ghosal, A.; Nandy, A.; Das, A.K.; Goswami, S.; Panday, M. A Short Review on Different Clustering Techniques and Their Applications. In Proceedings of the Emerging Technology in Modelling and Graphics; Mandal, J.K., Bhattacharya, D., Eds.; Springer: Singapore, 2020; pp. 69–83. [Google Scholar] [CrossRef]
- Ivanov, S.; Todorov, T.; Nenov, T.; Wilk-Jakubowski, J. Multisensor Sunflower Oil Quality Assessment System Based on “Electronic Nose”. In Proceedings of the 2023 International Conference Automatics and Informatics (ICAI), Varna, Bulgaria, 5–7 October 2023; pp. 290–294. [Google Scholar] [CrossRef]
- SGX Sensortech. MICS-6814: Multiple Gas Sensor. Available online: https://www.sgxsensortech.com/content/uploads/2015/02/1143_Datasheet-MiCS-6814-rev-8.pdf (accessed on 20 March 2025).
- Microchip Technology Inc. MCP9700. Available online: https://www.microchip.com/en-us/product/mcp9700#Documentation (accessed on 20 May 2025).
- Gonzalez Viejo, C.; Fuentes, S. Digital Detection of Olive Oil Rancidity Levels and Aroma Profiles Using Near-Infrared Spectroscopy, a Low-Cost Electronic Nose and Machine Learning Modelling. Chemosensors 2022, 10, 159. [Google Scholar] [CrossRef]
- Oates, M.J.; Fox, P.; Sanchez-Rodriguez, L.; Ángel, A.; Carbonell-Barrachina.; Ruiz-Canales, A. DFT based classification of olive oil type using a sinusoidally heated, low cost electronic nose. Comput. Electron. Agric. 2018, 155, 348–358. [Google Scholar] [CrossRef]
- Sidhu, T.; Bhajla, B.; Das, S. Numerical algorithms for protection and metering devices. In Encyclopedia of Electrical and Electronic Power Engineering; García, J., Ed.; Elsevier: Oxford, UK, 2023; pp. 45–87. [Google Scholar] [CrossRef]
- Zorpeykar, S.; Mirzaee-Ghaleh, E.; Karami, H.; Ramedani, Z.; Wilson, A.D. Electronic Nose Analysis and Statistical Methods for Investigating Volatile Organic Compounds and Yield of Mint Essential Oils Obtained by Hydrodistillation. Chemosensors 2022, 10, 486. [Google Scholar] [CrossRef]
- Rasekh, M.; Karami, H.; Wilson, A.D.; Gancarz, M. Classification and Identification of Essential Oils from Herbs and Fruits Based on a MOS Electronic-Nose Technology. Chemosensors 2021, 9, 142. [Google Scholar] [CrossRef]
- Graboski, A.; Feltes, G.; Zakrzevski, C.; Shimizu, F.M.; Steffens, J.; Paroul, N.; Steffens, C. Adulteration of Clove Essential Oil: Detection Using an Electronic Nose with Polymeric Gas Sensors. Food Anal. Methods 2024, 17, 296–308. [Google Scholar] [CrossRef]
- Chen, I.T.; Chen, C.C.; Dai, H.J.; Rianto, B.; Huang, S.K.; Lee, C.H. An Incremental Learning Method for Preserving World Coffee Aromas by Using an Electronic Nose and Accumulated Specialty Coffee Datasets. IEEE Trans. Agrifood Electron. 2024, 2, 12–27. [Google Scholar] [CrossRef]
- Chen, T.; Guestrin, C. XGBoost: A Scalable Tree Boosting System. In Proceedings of the 22nd ACM SIGKDD International Conference on Knowledge Discovery and Data Mining, San Francisco, CA, USA, 13–17 August 2016; pp. 785–794. [Google Scholar] [CrossRef]
- Greff, K.; Srivastava, R.K.; Koutník, J.; Steunebrink, B.R.; Schmidhuber, J. LSTM: A Search Space Odyssey. IEEE Trans. Neural Netw. Learn. Syst. 2017, 28, 2222–2232. [Google Scholar] [CrossRef] [PubMed]
- Huang, S.; Riemenschneider, L.; Panes-Ruiz, L.; Ibarlucea, B.; Cuniberti, G. Discrimination of Complex Mixtures Using Carbon Nanotubes-based Multichannel Electronic Nose: Coffee Aromas. In Proceedings of the 2023 IEEE Nanotechnology Materials and Devices Conference (NMDC), Paestum, Italy, 22–25 October 2023; pp. 1–4. [Google Scholar] [CrossRef]
- Sberveglieri, V.; Pulvirenti, A.; Comini, E.; Carmona, E.N. What happens at the aroma of coffee beans after roasting? MOX nanowire technology by Novel Electronic Nose to discover the fingerprint. Int. J. Smart Sens. Intell. Syst. 2019, 12, 1–4. [Google Scholar] [CrossRef]
- Thazin, Y.; Pobkrut, T.; Kerdcharoen, T. Prediction of Acidity Levels of Fresh Roasted Coffees Using E-nose and Artificial Neural Network. In Proceedings of the 2018 10th International Conference on Knowledge and Smart Technology (KST), Chiang Mai, Thailand, 31 January–3 February 2018; pp. 210–215. [Google Scholar] [CrossRef]
- Broomhead, D.S.; Lowe, D. Multivariable functional interpolation and adaptive networks. Complex Syst. 1988, 2, 321–355. Available online: https://sci2s.ugr.es/keel/pdf/algorithm/articulo/1988-Broomhead-CS.pdf (accessed on 18 March 2025).
- Andre, R.S.; Campaner, K.; Facure, M.H.M.; Mercante, L.A.; Bogusz, S.; Correa, D.S. Nanocomposite-Based Chemiresistive Electronic Nose and Application in Coffee Analysis. ACS Food Sci. Technol. 2021, 1, 1464–1471. [Google Scholar] [CrossRef]
- Sanislav, T.; Sipos, D.A.; Mois, G.; Folea, S. Intelligent System for Coffee Odor Identification and Classification. In Proceedings of the 2024 32nd Telecommunications Forum (TELFOR), Belgrade, Serbia, 26–27 November 2024; pp. 1–4. [Google Scholar] [CrossRef]
- Ketkar, N. Stochastic Gradient Descent. In Deep Learning with Python: A Hands-On Introduction; Apress: Berkeley, CA, USA, 2017; pp. 113–132. [Google Scholar] [CrossRef]
- Kingma, D.; Ba, J. Adam: A Method for Stochastic Optimization. In Proceedings of the International Conference on Learning Representations (ICLR), San Diega, CA, USA, 7–9 May 2015. [Google Scholar] [CrossRef]
- Banerjee(Roy), R.; Chattopadhyay, P.; Tudu, B.; Bhattacharyya, N.; Bandyopadhyay, R. Artificial flavor perception of black tea using fusion of electronic nose and tongue response: A Bayesian statistical approach. J. Food Eng. 2014, 142, 87–93. [Google Scholar] [CrossRef]
- National Instruments. PCI-6035E: 16-Bit, 200 kS/s, 32-Channel, Analog I/O Device. 2024. Available online: https://www.artisantg.com/TestMeasurement/73100-4/National-Instruments-PCI-6035E-200-kS-s-16-Bit-Multifunction-DAQ?srsltid=AfmBOoq-LdUEsAT7NfmWSD1hvS7BW2hKCeG_cP2spv1Q5ImNk-P02smn (accessed on 18 March 2025).
- Zhang, D. Bayesian Classification. In Fundamentals of Image Data Mining: Analysis, Features, Classification and Retrieval; Springer International Publishing: Cham, Switzerland, 2019; pp. 161–178. [Google Scholar] [CrossRef]
- Mu, F.; Gu, Y.; Zhang, J.; Zhang, L. Milk Source Identification and Milk Quality Estimation Using an Electronic Nose and Machine Learning Techniques. Sensors 2020, 20, 4238. [Google Scholar] [CrossRef] [PubMed]
- LaValley, M.P. Logistic Regression. Circulation 2008, 117, 2395–2399. [Google Scholar] [CrossRef] [PubMed]
- Zheng, W.; Wang, Y.; Liang, X.; Zhang, A. Origin identification for rice wines based on an electronic nose and convolution dot-product attention mechanism. Sens. Actuators A Phys. 2024, 375, 115521. [Google Scholar] [CrossRef]
- Zhang, K.; Sun, M.; Han, T.X.; Yuan, X.; Guo, L.; Liu, T. Residual Networks of Residual Networks: Multilevel Residual Networks. IEEE Trans. Circuits Syst. Video Technol. 2018, 28, 1303–1314. [Google Scholar] [CrossRef]
- Sun, J.T.; Lee, C.H.; Rianto, B.; Huang, S.K. Combining an Electronic Nose System with Artificial Intelligence Methods for Odor Identification of Spirits. In Proceedings of the 2024 10th International Conference on Applied System Innovation (ICASI), Kyoto, Japan, 17–21 April 2024; pp. 332–334. [Google Scholar] [CrossRef]
- Zhang, W.; Liu, T.; Brown, A.; Ueland, M.; Forbes, S.L.; Su, S.W. The Use of Electronic Nose for the Classification of Blended and Single Malt Scotch Whisky. IEEE Sens. J. 2022, 22, 7015–7021. [Google Scholar] [CrossRef]
- Hastie, T.; Tibshirani, R.; Friedman, J. The Elements of Statistical Learning: Data Mining, Inference, and Prediction, 2nd ed.; Springer: New York, NY, USA, 2009; Available online: https://hastie.su.domains/ElemStatLearn/ (accessed on 18 March 2025).
- Sun, J.T.; Lee, C.H. AI-driven Sensor Array Electronic Nose System for Authenticating and Recognizing Aromas in Spirit Samples. Sens. Mater. 2025, 37, 23–40. [Google Scholar] [CrossRef]
- Caterini, A.L.; Chang, D.E. Recurrent Neural Networks. In Deep Neural Networks in a Mathematical Framework; Springer International Publishing: Cham, Switzerland, 2018; pp. 59–79. [Google Scholar] [CrossRef]
- Liang, K.; Wang, Y.; He, J.Q.; Meng, H.; Chen, S.Q.; Chang, J.Y.; Gao, J.M.; Wang, J.H.; Feng, L. An Electronic Nose Based on Copper Oxide Heterojunctions for Rapid Assessment of Liquor. Chin. J. Anal. Chem. 2019, 47, e19073–e19080. [Google Scholar] [CrossRef]
- da Silva Torres, E.A.F.; Garbelotti, M.L.; Moita Neto, J.M. The application of hierarchical clusters analysis to the study of the composition of foods. Food Chem. 2006, 99, 622–629. [Google Scholar] [CrossRef]
- Jin, J.; Tang, X.; Cai, Y.; Han, Y.; Wang, M.; Zheng, H.; Hui, G. Optimization of eigenvalue selection in Chinese liquors discrimination based on electronic nose. Food Bioprocess Technol. 2014, 8, 270–276. [Google Scholar] [CrossRef]
- Harnsoongnoen, S.; Babpan, N.; Srisai, S.; Kongkeaw, P.; Srisongkram, N. A Portable Electronic Nose Coupled with Deep Learning for Enhanced Detection and Differentiation of Local Thai Craft Spirits. Chemosensors 2024, 12, 221. [Google Scholar] [CrossRef]
- Sensirion. SHT15 Digital Temperature and Humidity Sensor. Available online: https://sensirion.com/media/documents/BD45ECB5/61642783/Sensirion_Humidity_Sensors_SHT1x_Datasheet.pdf (accessed on 20 March 2025).
- Bourlard, H.A.; Morgan, N. Multilayer Perceptrons. In Connectionist Speech Recognition: A Hybrid Approach; Springer: Boston, MA, USA, 1994; pp. 59–80. [Google Scholar] [CrossRef]
- Viejo, C.G.; Fuentes, S.; Godbole, A.; Widdicombe, B.; Unnithan, R.R. Development of a low-cost e-nose to assess aroma profiles: An artificial intelligence application to assess beer quality. Sens. Actuators B Chem. 2020, 308, 127688. [Google Scholar] [CrossRef]
- Hanwei Electronics Co., Ltd. MG811 Carbon Dioxide (CO2) Sensor Module. Available online: https://www.yumpu.com/en/document/read/33225829/mg811-datasheet (accessed on 20 March 2025).
- Aosong Electronics Co., Ltd. AM2320 Digital Temperature and Humidity Sensor. Available online: https://cdn-shop.adafruit.com/product-files/3721/AM2320.pdf (accessed on 20 March 2025).
- McNair, H.M.; Miller, J.M.; Snow, N.H. Basic Gas Chromatography, 3rd ed.; Wiley: Hoboken, NJ, USA, 2019; p. 288. [Google Scholar]
- AIRSENSE Analytics GmbH. PEN3–Portable Electronic Nose Technical Data. Available online: https://airsense.com/sites/default/files/flyer_pen.pdf (accessed on 20 March 2025).
- Hazarika, S.; Choudhury, R.; Montazer, B.; Medhi, S.; Goswami, M.P.; Sarma, U. Detection of Citrus Tristeza Virus in Mandarin Orange Using a Custom-Developed Electronic Nose System. IEEE Trans. Instrum. Meas. 2020, 69, 9010–9018. [Google Scholar] [CrossRef]
- Esfahani, S.; Wicaksono, A.; Mozdiak, E.; Arasaradnam, R.P.; Covington, J.A. Non-Invasive Diagnosis of Diabetes by Volatile Organic Compounds in Urine Using FAIMS and Fox4000 Electronic Nose. Biosensors 2018, 8, 121. [Google Scholar] [CrossRef] [PubMed]
- FOODSniffer. The Foodsniffer. Available online: https://www.myfoodsniffer.com/product.html (accessed on 23 March 2025).
- Aryballe. NeOse Advance Datasheet. Available online: http://aryballe.com/wp-content/uploads/2021/07/NeOse_Advance_DS_072121.pdf (accessed on 20 March 2025).
- Sensigent Intelligent Sensing Solution. Cyranose Electronic Nose. Available online: https://www.sensigent.com/cyranose-320.html (accessed on 24 March 2025).
- Yu, Y.; Li, Q.; Shi, Y. Integrating Criss-Cross Attention Mechanism for Origin Traceability of Peanuts Using Electronic Nose Technology. In Proceedings of the 2024 7th International Symposium on Autonomous Systems (ISAS), Chongqing, China, 7–9 May 2024; pp. 1–5. [Google Scholar] [CrossRef]
- Huang, Z.; Wang, X.; Wei, Y.; Huang, L.; Shi, H.; Liu, W.; Huang, T.S. CCNet: Criss-Cross Attention for Semantic Segmentation. IEEE Trans. Pattern Anal. Mach. Intell. 2020, 45, 6896–6908. [Google Scholar] [CrossRef] [PubMed]
- Kodithuwakku, P.; Jayasundara, D.; Munaweera, I.; Jayasinghe, R.; Thoradeniya, T.; Bogahawatta, A.; Manuda, K.R.J.; Weerasekera, M.; Kottegoda, N. Ilmenite-Grafted Graphene Oxide as an Antimicrobial Coating for Fruit Peels. ACS Omega 2024, 9, 26568–26581. [Google Scholar] [CrossRef] [PubMed]
- Zhang, P.P.; Gui, X.J.; Fan, X.H.; Han, L.; Li, H.Y.; Li, X.P.; Dong, F.Y.; Wang, Y.L.; Jing, Y.; Shi, J.H.; et al. Quality identification of Amomi fructus using E-nose, HS-GC-IMS, and intelligent data fusion methods. Front. Chem. 2025, 13, 1544743. [Google Scholar] [CrossRef] [PubMed]
- Lee, L.C.; Liong, C.Y.; Jemain, A.A. Partial least squares-discriminant analysis (PLS-DA) for classification of high-dimensional (HD) data: A review of contemporary practice strategies and knowledge gaps. Analyst 2018, 143, 3526–3539. [Google Scholar] [CrossRef] [PubMed]
- Yang, Y.; Wei, L. Application of E-nose technology combined with artificial neural network to predict total bacterial count in milk. J. Dairy Sci. 2021, 104, 10558–10565. [Google Scholar] [CrossRef] [PubMed]
- Mu, W.; Zhao, Y.; Wang, Z.; He, Y.; Yang, C.; Wang, J. Combining lipase enzymatic techniques and antioxidants on the flavor of structured lipids (SLs) prepared from goat butter and coconut oil. Food Biosci. 2024, 60, 104332. [Google Scholar] [CrossRef]
- Boyacı, E.; Rodríguez-Lafuente, Á.; Gorynski, K.; Mirnaghi, F.; Souza-Silva, É.A.; Hein, D.; Pawliszyn, J. Sample preparation with solid phase microextraction and exhaustive extraction approaches: Comparison for challenging cases. Anal. Chim. Acta 2015, 873, 14–30. [Google Scholar] [CrossRef] [PubMed]
- Dai, J.; Li, W.; Dong, G. Dung Beetle Optimizer Algorithm and Machine Learning-Based Genome Analysis of Lactococcus lactis: Predicting Electronic Sensory Properties of Fermented Milk. Foods 2024, 13, 1958. [Google Scholar] [CrossRef] [PubMed]
- Xue, J.; Shen, B. Dung beetle optimizer: A new meta-heuristic algorithm for global optimization. J. Supercomput. 2023, 79, 7305–7336. [Google Scholar] [CrossRef]
- Zheng, W.; Yuan, Q.; Zhang, A.; Lei, Y.; Pan, G. Data augmentation of flavor information for electronic nose and electronic tongue: An olfactory-taste synesthesia model combined with multiblock reconstruction method. Expert Syst. Appl. 2025, 272, 126810. [Google Scholar] [CrossRef]
- Knežević-Jugović, Z.; Culetu, A.; Mijalković, J.; Duta, D.; Stefanović, A.; Šekuljica, N.; Đorđević, V.; Antov, M. Impact of Different Enzymatic Processes on Antioxidant, Nutritional and Functional Properties of Soy Protein Hydrolysates Incorporated into Novel Cookies. Foods 2023, 12, 24. [Google Scholar] [CrossRef] [PubMed]
- Wang, Z.; Shi, Y.; Zhou, K.; Zhou, H.; Li, X.; Li, C.; Wang, Z.; Xu, B. Effects of different thermal temperatures on the shelf life and microbial diversity of Dezhou-braised chicken. Food Res. Int. 2020, 136, 109471. [Google Scholar] [CrossRef] [PubMed]
- Culetu, A.; Manolache, F.; Duta, D. Exploratory Study of Physicochemical, Textural and Sensory Characteristics of Sugar-Free Traditional Plum Jams. J. Texture Stud. 2014, 45, 138–147. [Google Scholar] [CrossRef]
- Gu, S.-q.; Wang, X.-c.; Tao, N.-p.; Wu, N. Characterization of volatile compounds in different edible parts of steamed Chinese mitten crab (Eriocheir sinensis). Food Res. Int. 2013, 54, 81–92. [Google Scholar] [CrossRef]
- Wold, S.; Sjöström, M.; Eriksson, L. PLS-regression: A basic tool of chemometrics. Chemom. Intell. Lab. Syst. 2001, 58, 109–130. [Google Scholar] [CrossRef]
- Castrica, M.; Chiesa, L.M.; Nobile, M.; De Battisti, F.; Siletti, E.; Pessina, D.; Panseri, S.; Balzaretti, C.M. Rapid safety and quality control during fish shelf-life by using a portable device. J. Sci. Food Agric. 2021, 101, 315–326. [Google Scholar] [CrossRef] [PubMed]
- Ramírez, H.L.; Soriano, A.; Gómez, S.; Iranzo, J.U.; Briones, A.I. Evaluation of the Food Sniffer electronic nose for assessing the shelf life of fresh pork meat compared to physicochemical measurements of meat quality. Eur. Food Res. Technol. 2018, 244, 1047–1055. [Google Scholar] [CrossRef]
- Papp, Z.; Nemeth, L.G.; Nzetchouang Siyapndjeu, S.; Bufa, A.; Marosvölgyi, T.; Gyöngyi, Z. Classification of Plant-Based Drinks Based on Volatile Compounds. Foods 2024, 13, 4086. [Google Scholar] [CrossRef] [PubMed]
- Ferreira, I.; Dias, T.; Mouazen, A.M.; Cruz, C. Using Science and Technology to Unveil The Hidden Delicacy Terfezia arenaria, a Desert Truffle. Foods 2023, 12, 3527. [Google Scholar] [CrossRef] [PubMed]
- Di Natale, C.; Macagnano, A.; Davide, F.; D’Amico, A.; Paolesse, R.; Boschi, T.; Faccio, M.; Ferri, G. An electronic nose for food analysis. Sens. Actuators B Chem. 1997, 44, 521–526. [Google Scholar] [CrossRef]
- Muñoz-Castells, R.; Modesti, M.; Moreno-García, J.; Rodríguez-Moreno, M.; Catini, A.; Capuano, R.; Di Natale, C.; Bellincontro, A.; Moreno, J. Differentiation through E-nose and GC-FID data modeling of rosé sparkling wines elaborated via traditional and Charmat methods. J. Sci. Food Agric. 2025, 105, 1439–1447. [Google Scholar] [CrossRef] [PubMed]
- Capuano, R.; Paba, E.; Mansi, A.; Marcelloni, A.M.; Chiominto, A.; Proietto, A.R.; Zampetti, E.; Macagnano, A.; Lvova, L.; Catini, A.; et al. Aspergillus Species Discrimination Using a Gas Sensor Array. Sensors 2020, 20, 4004. [Google Scholar] [CrossRef] [PubMed]
- Barea-Ramos, J.D.; Cascos, G.; Mesías, M.; Lozano, J.; Martín-Vertedor, D. Evaluation of the Olfactory Quality of Roasted Coffee Beans Using a Digital Nose. Sensors 2022, 22, 8654. [Google Scholar] [CrossRef] [PubMed]
- Gancarz, M.; Rusinek, R.; Nawrocka, A.; Tadla, M.; Gawrysiak-Witulska, M.; Wawrzyniak, J. Electronic Sensor Array of the Electronic Nose. P.419383, 7 November 2016. [Google Scholar]
- Makarichian, A.; Amiri Chayjan, R.; Ahmadi, E.; Mohtasebi, S.S. Assessment the influence of different drying methods and pre-storage periods on garlic (Allium sativum L.) aroma using electronic nose. Food Bioprod. Process. 2021, 127, 198–211. [Google Scholar] [CrossRef]
- Estelles-Lopez, L.; Ropodi, A.; Pavlidis, D.; Fotopoulou, J.; Gkousari, C.; Peyrodie, A.; Panagou, E.; Nychas, G.J.; Mohareb, F. An automated ranking platform for machine learning regression models for meat spoilage prediction using multi-spectral imaging and metabolic profiling. Food Res. Int. 2017, 99, 206–215. [Google Scholar] [CrossRef] [PubMed]
- Kodogiannis, V.S.; Alshejari, A. Neuro-fuzzy based identification of meat spoilage using an electronic nose. In Proceedings of the 2016 IEEE 8th International Conference on Intelligent Systems (IS), Sofia, Bulgaria, 4–6 September 2016; pp. 96–103. [Google Scholar] [CrossRef]
- Kodogiannis, V. Application of an Electronic Nose Coupled with Fuzzy-Wavelet Network for the Detection of Meat Spoilage. Food Bioprocess Technol. 2017, 10, 730–749. [Google Scholar] [CrossRef]
- Mohareb, F.; Papadopoulou, O.; Panagou, E.; Nychas, G.J.; Bessant, C. Ensemble-based support vector machine classifiers as an efficient tool for quality assessment of beef fillets from electronic nose data. Anal. Methods 2016, 8, 3711–3721. [Google Scholar] [CrossRef]
- Modesti, M.; Alfieri, G.; Chieffo, C.; Mencarelli, F.; Vannini, A.; Catalani, A.; Chilosi, G.; Bellincontro, A. Destructive and non-destructive early detection of postharvest noble rot (Botrytis cinerea) in wine grapes aimed at producing high-quality wines. J. Sci. Food Agric. 2024, 104, 2314–2325. [Google Scholar] [CrossRef] [PubMed]
- Bosch Sensortec. Gas Sensor BME680. Available online: https://www.bosch-sensortec.com/products/environmental-sensors/gas-sensors/bme680/#technical (accessed on 29 May 2025).
- Sensirion. Datasheet SGP30. Available online: https://sensirion.com/media/documents/984E0DD5/61644B8B/Sensirion_Gas_Sensors_Datasheet_SGP30.pdf (accessed on 29 May 2025).
- Adafruit CCS811 Air Quality Sensor. Available online: https://cdn-learn.adafruit.com/downloads/pdf/adafruit-ccs811-air-quality-sensor.pdf (accessed on 29 May 2025).
- iAQ-Core Indoor Air Quality Sensor Module. Available online: https://www.es.co.th/Schemetic/PDF/IAQ-CORE-C.PDF (accessed on 29 May 2025).
- Mesías, M.; Barea-Ramos, J.D.; Lozano, J.; Morales, F.J.; Martín-Vertedor, D. Application of an Electronic Nose Technology for the Prediction of Chemical Process Contaminants in Roasted Almonds. Chemosensors 2023, 11, 287. [Google Scholar] [CrossRef]
- AS-MLV-P2 Air Quality Sensor. Available online: https://ro.mouser.com/datasheet/2/1081/AS_MLV_P2_Datasheet-1890483.pdf (accessed on 29 May 2025).
- Figaro USA, Inc. TGS 8100–For the Detection of Air Contaminants. Available online: www.figarosensor.com/product/docs/TGS8100%280914%29.pdf (accessed on 29 May 2025).
- Rusinek, R.; Gancarz, M.; Nawrocka, A. Application of an electronic nose with novel method for generation of smellprints for testing the suitability for consumption of wheat bread during 4-day storage. LWT 2020, 117, 108665. [Google Scholar] [CrossRef]
- Rusinek, R.; Gancarz, M.; Krekora, M.; Nawrocka, A. A Novel Method for Generation of a Fingerprint Using Electronic Nose on the Example of Rapeseed Spoilage. J. Food Sci. 2019, 84, 51–58. [Google Scholar] [CrossRef] [PubMed]
- Berthomieu, C.; Hienerwadel, R. Fourier transform infrared (FTIR) spectroscopy. Photosynth. Res. 2009, 101, 157–170. [Google Scholar] [CrossRef] [PubMed]
- Makarichian, A.; Chayjan, R.A.; Ahmadi, E.; Mohtasebi, S.S.; Zafari, D. Use of E-Nose in inspecting the effect of processing type on the aroma of garlic (Allium sativum L.): A critical hint in the quality assessment. Food Prod. Process. Nutr. 2024, 6, 52. [Google Scholar] [CrossRef]
- Hecht-Nielsen. Theory of the backpropagation neural network. In Proceedings of the International 1989 Joint Conference on Neural Networks, Washington, DC, USA, 18–22 June 1989; Volume 1, pp. 593–605. [Google Scholar] [CrossRef]
- Linevych, Y.; Koval, V.; Dusheiko, M.; Lakyda, M.; Kavraska, N. Odor Sensors Based on Silicon Nanowires With a Modified Surface for Electronic Nose Application. IEEE Sens. Lett. 2025, 9, 1–4. [Google Scholar] [CrossRef]
- Mo, F.; Ala, W.; Spano, C.E.; Piccinini, G.; Graziano, M.; Ardesi, Y. Single-Molecule Graphene Junction Aflatoxin Sensors: Chemo-Physical Insights from Ab Initio Simulations. In Proceedings of the 2024 IEEE 24th International Conference on Nanotechnology (NANO), Gijon, Spain, 8–11 July 2024; pp. 420–423. [Google Scholar] [CrossRef]
- Qu, C.; Fang, H.; Yu, F.; Chen, J.; Su, M.; Liu, H. Artificial nose of scalable plasmonic array gas sensor for Multi-Dimensional SERS recognition of volatile organic compounds. Chem. Eng. J. 2024, 482, 148773. [Google Scholar] [CrossRef]
- Tan, J.; Duan, S.; Wang, L.; Yan, J. Multi-Gas Sensing Electronic Nose Using Memristor-Based In-Memory Computing. IEEE Sens. J. 2023, 23, 28526–28534. [Google Scholar] [CrossRef]
- Freddi, S.; Marzuoli, C.; Pagliara, S.; Drera, G.; Sangaletti, L. Targeting biomarkers in the gas phase through a chemoresistive electronic nose based on graphene functionalized with metal phthalocyanines. RSC Adv. 2023, 13, 251–263. [Google Scholar] [CrossRef] [PubMed]
- Wu, C.; Li, J. Portable FBAR based E-nose for cold chain real-time bananas shelf time detection. Nanotechnol. Precis. Eng. 2023, 6, 013004. [Google Scholar] [CrossRef]
- Sun, L.; Rotaru, A.; Garcia, Y. A non-porous Fe(II) complex for the colorimetric detection of hazardous gases and the monitoring of meat freshness. J. Hazard. Mater. 2022, 437, 129364. [Google Scholar] [CrossRef] [PubMed]
- Shin, N.; Lee, S.; Pham Ba, V.; Park, T.H.; Hong, S. Micelle-stabilized Olfactory Receptors for a Bioelectronic Nose Detecting Butter Flavors in Real Fermented Alcoholic Beverages. Sci. Rep. 2020, 10, 9064. [Google Scholar] [CrossRef] [PubMed]
- Wijaya, D.R. Dataset for Electronic Nose from Various Beef Cuts. Available online: https://dataverse.harvard.edu/dataset.xhtml?persistentId=doi:10.7910/DVN/XNFVTS (accessed on 23 March 2025).
- Wijaya, D.R.; Sarno, R.; Zulaika, E. DWTLSTM for electronic nose signal processing in beef quality monitoring. Sens. Actuators B Chem. 2021, 326, 128931. [Google Scholar] [CrossRef]
- Espina, K.R.; Naval, P. 1D-CNN Model for Fast Assessment of Beef Freshness from Noisy Electronic Nose Signal. In Proceedings of the 2024 6th International Conference on Computer Communication and the Internet (ICCCI), Tokyo, Japan, 14–16 June 2024; pp. 67–71. [Google Scholar] [CrossRef]
- Feyzioglu, A.; Taspinar, Y.S. Beef Quality Classification with Reduced E-Nose Data Features According to Beef Cut Types. Sensors 2023, 23, 2222. [Google Scholar] [CrossRef] [PubMed]
- Enériz, D.; Medrano, N.; Calvo, B. An FPGA-Based Machine Learning Tool for In-Situ Food Quality Tracking Using Sensor Fusion. Biosensors 2021, 11, 366. [Google Scholar] [CrossRef] [PubMed]
- Kaya, A.; Keçeli, A.S.; Catal, C.; Tekinerdogan, B. Sensor Failure Tolerable Machine Learning-Based Food Quality Prediction Model. Sensors 2020, 20, 3173. [Google Scholar] [CrossRef] [PubMed]
- Sarno, R.; Wijaya, D.R.; Sabilla, S.I. The dataset for pork adulteration from electronic nose system. IEEE Dataport 2020. [Google Scholar] [CrossRef]
- Avian, C.; Leu, J.; Prakosa, S.; Faisal, M. An Improved Classification of Pork Adulteration in Beef Based on Electronic Nose Using Modified Deep Extreme Learning with Principal Component Analysis as Feature Learning. Food Anal. Methods 2022, 15, 3020–3031. [Google Scholar] [CrossRef]
- GAMBOA, J.C.R.; Estrada, E.S.A.; da Silva, A.; Ferreira, T. Electronic Nose Dataset for Detection of Wine Spoilage Thresholds. Available online: https://data.mendeley.com/datasets/vpc887d53s/3 (accessed on 23 March 2025).
- Rodriguez Gamboa, J.C.; Albarracin, E.S.; da Silva, A.J.; Tiago, T.A. Electronic nose dataset for detection of wine spoilage thresholds. Data Brief 2019, 25, 104202. [Google Scholar] [CrossRef] [PubMed]
- Bulucu, P.; Özkurt, N.; Güzeliş, C.; Yıldız, O. Wine Quality Assessment with Application Specific 2D Single Channel Convolutional Neural Networks. In Proceedings of the 2021 13th International Conference on Electrical and Electronics Engineering (ELECO), Bursa, Turkey, 25–27 November 2021; pp. 369–372. [Google Scholar] [CrossRef]
- Hanif, S.; Wijaya, D.R.; Wikusna, W. K-Nearest Neighbors Algorithm for Prediction Shelf Life of Rice Based on Electronic Nose Dataset. In Proceedings of the 2021 IEEE Asia Pacific Conference on Wireless and Mobile (APWiMob), Bandung, Indonesia, 8–10 April 2021; pp. 116–120. [Google Scholar] [CrossRef]
- Aulia, I.; Wijaya, D.R.; Hidayat, W. Rice Quality Detection Using Gradient Tree Boosting Based On Electronic Nose Dataset. In Proceedings of the 2021 International Conference on Artificial Intelligence and Mechatronics Systems (AIMS), Bandung, Indonesia, 28–30 April 2021; pp. 1–5. [Google Scholar] [CrossRef]
- Sari, I.M.; Wijaya, D.R.; Hidayat, W.; Kannan, R. An Approach to Classify Rice Quality using Electronic Nose Dataset-based Naïve Bayes Classifier. In Proceedings of the 2021 International Symposium on Electronics and Smart Devices (ISESD), Bandung, Indonesia, 29–30 June 2021; pp. 1–5. [Google Scholar] [CrossRef]
- Erlangga, F.; Wijaya, D.R.; Wikusna, W. Electronic Nose Dataset for Classifying Rice Quality using Neural Network. In Proceedings of the 2021 9th International Conference on Information and Communication Technology (ICoICT), Yogyakarta, Indonesia, 3–5 August 2021; pp. 462–466. [Google Scholar] [CrossRef]


| Type of Sensor | Advantages | Application Sector |
|---|---|---|
| Chemiresistive sensors: MOS | High sensitivity, high selectivity, durability, long lifespan, fast response time | Air quality monitoring, food freshness detection, industrial gas sensing, medical diagnostic |
| Chemiresistive sensors: CNT | Ultra-high sensitivity, fast response time, low power consumption, miniaturization potential | Breath analysis for disease detection, air quality monitoring, workspace safety |
| Conductometric sensors: CP | Fast response time, low power consumption, tunable sensitivity | Medical diagnostics, food quality assessment, environmental monitoring |
| Mass-sensitive sensors: QCM | High sensitivity, ability to detect low-concentration gases | Breath analysis, detection of toxic substances, fragrance quality control |
| Mass-sensitive sensors: SAW | Fast response time, small size, high ruggedness | Explosive and drug detection, environmental monitoring, workspace safety |
| Electrochemical sensors | High selectivity in terms of the electrochemical properties of target VOCs, low power consumption, reliable detection of specific gases | Toxic gas detection, breath analysis, air quality monitoring |
| Optical sensors | Non-contact sensing, high specificity in terms of the chemical identity of VOCs, fast response time | Industrial gas detection, medical diagnostics, hazardous material monitoring, food quality assessment |
| FET sensors | High sensitivity, fast response time, compatibility with nanomaterials and 2D materials, fast electronic response | Medical diagnostics, food quality assessment, environmental monitoring, industrial process control, security and defense |
| Bioelectronic sensors | High specificity in terms of molecular recognition of target VOCs, biomimetic functionality, potential for personalized diagnostics | Disease detection, food quality monitoring |
| Pattern Recognition Technique | Advantages | Type of Sensor | Application Sector |
|---|---|---|---|
| PCA |
| MOS, CP, QCM, SAW, CNT, optical sensors, electrochemical sensors | Food quality control, medical diagnostics, environmental monitoring, industrial process control |
| LDA |
| MOS, CP, QCM, SAW, optical sensors, electrochemical sensors | Medical diagnostics, food quality control, environmental monitoring, security and defense |
| ANNs |
| MOS, CP, QCM, SAW, CNT, bioelectronic sensors | Medical diagnostics, food quality control, environmental monitoring, security and defense |
| SVM |
| MOS, CP, QCM, SAW, CNT | Medical diagnostics, food quality control, environmental monitoring, security and defense, workspace safety |
| KNN |
| MOS, CP, QCM, SAW, CNT | Food quality monitoring, environmental monitoring, medical diagnostics, industrial process control |
| 6 March 2025 | Journal/ Magazine Articles | Reviews | Conference Papers | Total |
|---|---|---|---|---|
| Scopus | 40 | 11 | 18 | 69 |
| IEEE Xplore | 21 | 2 | 94 | 117 |
| WoS | 298 | 120 | 47 | 465 |
| Total | 359 | 133 | 159 | 651 |
| Total without duplicates | 314 | 122 | 113 | 549 |
| 6 March 2025 | Journal/ Magazine Articles | Reviews | Conference Papers | Total |
|---|---|---|---|---|
| Scopus | 3 | 2 | 6 | 11 |
| IEEE Xplore | 5 | 0 | 35 | 40 |
| WoS | 233 | 78 | 35 | 346 |
| Final total | 241 | 80 | 76 | 397 |
| Paper | Design Architecture | Data Analysis Techniques | Evaluation and Performance Metrics | Application Area |
|---|---|---|---|---|
| Electronic Nose Systems for Meat Quality and Safety | ||||
| [76] | Sensor array: MQ-137, MQ-136 [77], TGS2602 [78]; Signal processing unit: Arduino Uno R3 | PCA | Accuracy: 94.9% (fresh/spoiled/rotten) | Beef quality assessment |
| PCA + Probabilistic Neural Network (PNN) [79] | Accuracy: 100% (fresh/spoiled) | |||
| [80] | IoT-enabled e-nose; Sensor array: AM2302 [81], one optical sensor from Winsen Electronics Technology Co., Zhengzhou, China, MH-Z19C [82], ZE03-NH3, ZE03-C2H4 [83]; Signal processing unit: ESP32-S3 controller [84] | Linear Regression [85] | Aerobic bacteria and Pseudomonas species play a crucial role in the production of VOCs in beef | Beef quality monitoring and spoilage detection |
| [86] | Sensor array: MQ-2, MQ-3, MQ-4, MQ-6, MQ-7, MQ-8, MQ-9, MQ-135 [77]; Signal processing unit: Arduino Mega 2560 microcontroller [87], Raspberry Pi 4 [88] | PCA + SVM | Accuracy: 98.49% (healthy/ compromised) | Chicken meat quality assessment |
| [89] | Sensor array: MQ-2, MQ-3, MQ-6, MQ-7, MQ-9, MQ-135, DHT22 [90]; Signal processing unit: Arduino Uno microcontroller | SVM, Linear Regression, KNN, Random Forest [91] | Best accuracy: 100% for Random Forest with random split data; 69% for Random Forest with non-randomly split data; 78.5% for SVM with group split data (fresh/semi-fresh/spoiled) | Chicken meat quality assessment |
| [92] | Sensor array: HGS1000, HGS1001, HGS1002, HGS1007 [93]; Signal processing unit: 12-bit ADC with four channels of input data; heating voltage can be set between 0 and 2.4V | Convolutional Neural Network (CNN) CNN [94] + time series feature extraction [95] | Accuracy: 92.1% (fresh/sub-fresh/spoiled) Accuracy: 98.4% (fresh/sub-fresh/spoiled) | Pork, beef, mutton, chicken, crab, shrimp, fish meat quality assessment |
| [96] | Sensor array: MQ-2, MQ-4, MQ-6, MQ-9, MQ-135, MQ-136, MQ-137, MQ-138,DHT22; Signal processingunit: N/A | KNN | Accuracy rates between 97% and 100% (variations of meat with ratio 0%, 10%, 50%, 90%, 100%) | Authenticity of beef and pork meat |
| SVM | Accuracy rates between 81.5% and 99.5% (variations of meat with ratio 0%, 10%, 50%, 90%, 100%) | |||
| Electronic Nose Systems for Seafood Quality and Safety | ||||
| [97] | Sensor array: MQ-136, MQ-137, MQ-5, MQ-8; Signal processing unit: N/A | Support Vector Machine Regression Technique (SVR) [98] | R-squared (R2): 0.981; Root Mean Square Error (RMSE): 0.012 | Estimation of the microbial population in seafood |
| [99] | IoT-enabled e-nose with image processing capabilities; Sensor array: N/A; Signal processing unit: N/A | A nonparametric kernel-based modeling + hidden Markov model | Quality model indices closely align with the manual results provided by quality assurance experts | Fish origin verification, fish quality assessment |
| [100] | Sensor array: MQ-1, MQ-2 and two MQ-135; Signal processing unit: ESP32 microcontroller | KNN | Accuracy: 98% (fresh/less fresh/ not fresh) | Freshness and quality of crabs |
| Naïve Bayes [101] | Accuracy: 91% (fresh/less fresh/ not fresh) | |||
| SVM | Accuracy: 87% for SVM (fresh/less fresh/not fresh) | |||
| [102] | Sensor array: TGS2620, TGS2611, TGS822, TGS832, TGS2602, TGS2600, TGS826, TGS825; Signal processing unit: N/A; Preheating process before using the sensors | PCA | Cumulative variance of the principal component: 95% (fresh/contaminated) | Tuna quality assessment (Pseudomonas aeruginosa bacteria) |
| SVM | Accuracy: 99% (fresh/contaminated) | |||
| [103] | Sensor array: MQ-2, MQ-3, MQ-4, MQ-5, MQ-6, MQ-7, MQ-8, MQ-9; Signal processing unit: N/A | Linear Regression | R2: 0.98; Accuracy: 93.75% | Prawn quality assessment |
| Electronic Nose Systems for Vegetables and Fruits Quality and Safety | ||||
| [104,105] | Sensor array: MQ-3, MQ-6, MQ-8, MQ-135; Signal processing unit: ADC for Raspberry Pi 4/ Raspberry Pi 3 | CNN | Accuracy: 86% (ripe/not ripe/unknown) | Identification of the ripening stage of tomato fruits |
| [106] | Sensor array: MQ-135, MQ-136, TGS822, TGS2600, TGS2602, TGS2603, TGS2610, TGS2611, DHT22; Signal processingunit: N/A | Random Forest | Accuracy: 94% (good/good/fair/ poor) | Identification of the ripening stage of tomato fruits |
| KNN | Accuracy: 83% (good/good/fair/ poor) | |||
| ANNs | Accuracy: 79% (good/good/fair/ poor) | |||
| SVM | Accuracy: 64% (good/good/fair/ poor) | |||
| [107,108] | Sensor array: MQ-135, MQ-4; Signal processing unit: Gizduino micro- controller [109] | ANNs | Accuracy: 93.33% (not spoiled/ partially spoiled/ spoiled) | Tomato puree quality assessment |
| Fuzzy logic technique [110] | Accuracy: 90% (not spoiled/ partially spoiled/ spoiled) | |||
| [111] | Sensor array: TGS2620, TGS823, DHT22; Signal processing unit: Arduino microcontroller | PCA + t-distributed Stochastic Neighbor Embedding [112] + k-Means [113] + Long Short-Term Model [114] | Accuracy: 99.46% (fresh/half-spoiled/spoiled) | Broccoli quality assessment |
| [115] | Sensor array: TGS880, TGS822, TGS826, TGS2602, TGS2600; Signal processing unit: ATmega8 [116] microcontroller with an integrated ADC | PCA + Centroid link- and completely-link cluster analyses | Similarity levels >93% for of the samples tested (fresh/half/ completely contaminated) | Broccoli quality assessment (Staphylococcus, Salmonella and Shigella) |
| [117] | Sensor array: MQ-2, DHT11; Signal processing unit: Arduino Uno microcontroller and Node MCU [118] IoT platform | Linear Regression, Random Forest, SVR | Best performance with a value of Mean Squared Error (MSE): 0.1207 for Random Forest | Banana freshness assessment |
| [119] | Sensor array: TGS2600, TGS2602,TGS2603, TGS2610, TGS2611, TGS2612, TGS2620; Signal processing unit: NI DAQ card, USB-6009 [120] | PCA + KNN | Accuracy: 98.10% (unripe/half-ripe/fully ripe/overripe) | Identification of the ripening stage of banana |
| PCA + SVM | Accuracy: 95.24% (unripe/half-ripe/fully ripe/overripe) | |||
| LDA + KNN | Accuracy: 90.48% (unripe/half-ripe/fully ripe/overripe) | |||
| LDA + SVM | Accuracy: 86.67% (unripe/half-ripe/fully ripe/overripe) | |||
| [121] | Sensor array: MQ-2, MQ-3, MQ-4, MQ-5, MQ-7, MQ-8, MQ-135 sensors; Signal processing unit: Arduino Due [122] microcontroller | SVM | Accuracy: 99% (rotten/fresh) | Avocado fruits quality assessment |
| [123] | Sensor array: MQ-136, MQ-4, MQ-137, MQ-3, MQ-2, MQ-135, MQ-131, MQ-8, MQ-9; Signal processing unit: Raspberry Pi computer | PCA + KNN | Accuracy: 92% (spoiled/not spoiled) | Fruits (banana, pechay, carrot, grape) quality assessment |
| [124] | Sensor array: eight BME688 gas sensors [125]; Signal processing unit: Adafruit Huzzah32 (ESP32) development board [126] | Neural Networks [127] | Accuracy: 76% (spoiled/not spoiled) | Fruits and vegetables quality assessment |
| Electronic Nose Systems for Spices’ Quality and Safety | ||||
| [128,129] | Sensor array: TGS800, TGS813, TGS823, TGS2602, TGS2610, TGS2611, TGS2620, MQ-135; Signal processing unit: ADCs of a Programmable Interface Controller (PIC) microcontroller | Random Forest | Accuracy: 100% (nutmeg/ clove/cinnamon) | Identification of nutmeg, clove, and cinnamon |
| [130] | Sensor array: TGS2600, TGS2602, TGS2610, TGS813, TGS822, MQ-138, MQ-2 MQ-8; Signal proc. unit: AD7606 analog-to- digital data acquisition system [131] and S3C6410-based Linux platform [132] | PCA + SVM | Accuracy: 95% | Authenticity of star anise |
| Electronic Nose Systems for Oils’ Quality and Safety | ||||
| [133] | Sensor array: eight TGS and MQ sensors, and one temperature and relative humidity sensor; Signal proc. unit: RPi computer | Clustering technique [134] | Identification of three classes of palm oil: never heated/heated for 10 to 30 h/heated for 40 to 60 h | Palm oil quality assessment |
| [135] | Sensor array: MICS-6814 MOS sensor [136], MCP9700 temperature sensor [137]; Signal processing unit: ADS1015, PIC18F45K22, FT230XS USB/UART converter | ANNs | Accuracy: 99.49% (degummed/extraction/filtered/marketed) | Sunflower oil quality assessment |
| [138] | Sensor array: MQ-3, MQ-4, MQ-7, MQ-8, MQ-135, MQ-137, MQ-138, MG-811; Signal processing unit: N/A | ANNs (classification) | Accuracy: 86.5% | Extra-virgin olive oil quality assessment |
| ANNs (regression) | Correlation coefficient: 0.93; Slope 0.90 | |||
| [139] | Sensor array: MQ-2, MQ-3, MQ-4, MQ-5, MQ-7, MQ-8, MQ-9, MQ-135; Sensor processing unit: Arduino Nano microcontroller | Discrete Fourier transform data analysis [140] | Accuracy: 91% (extra virgin/virgin); Accuracy: between 67% and 77% (extra virgin/virgin/blend /pomace/fresh air) | Olive oil quality assessment |
| [141] | Sensor array: MQ-3, TGS822, MQ-136, MQ-9, TGS813, MQ-135, TGS2602, TGS2620; Sensor processingunit: N/A | PCA | Total variance of the data for distilled water extracts from mint plants: 95%; Total variance of the data for mint essential oil: 89% | Mint essential oil and mint distilled water extracts quality assessment |
| LDA | Accuracy for the classification of mint essential oil: 91.33%; Accuracy for mint distilled water extracts: 86.67% | |||
| ANNs | Accuracy for the classification of distilled water extracts 100%; Accuracy for the classification of mint essential oil 96.7% | |||
| [142] | Sensor array: MQ-9, MQ-4, MQ-135, MQ-8, TGS2620, MQ-136, TGS813, TGS822, MQ-3; Signal proc. unit: N/A | PCA | Accuracy: 98% | Identification of essential oils from herbs and fruits |
| LDA and Quadratic Discriminant Analysis | Accuracy: 100% (essential oil emissions from herbal leaves/fruits); Accuracy: 100% for Quadratic Discriminant Analysis and 98.9% for LDA (mango/lemon/orange /mint/tarragon/thyme) | |||
| SVM | Accuracy: 100% (essential oil emissions from herbal leaves/fruits); Accuracy: 98.9% (mango/lemon/orange /mint/tarragon/thyme) | |||
| [143] | Sensor array: six different polymeric gas sensors (polymeric nanocom- posites of polyaniline with multiwalled carbon nanotubes and graphene oxide); Signal processing unit: N/A | PCA | Accuracy: 99.85% | Authenticity of clove oil |
| Interactive Document Map multivariate projection techniques | Accuracy: 99.81% | |||
| LDA | Accuracy: 98.30% | |||
| Electronic Nose Systems for Coffee and Tea Quality and Safety | ||||
| [144] | Sensor array: MQ-7, MQ-3, MQ-135, TGS2600, TGS2602, TGS2610, TGS2611, TGS2620, DHT22; Signal processing unit: N/A | Extreme Gradient Boosting [145] | Accuracy rates between 82% and 95% (sixteen classes of coffee) | Authenticity of coffee |
| SVM | Accuracy rates between 81% and 95% (sixteen types of coffee) | |||
| CNN | Accuracy rates between 86% and 98% (sixteen types of coffee) | |||
| CNN + Long Short-Term Memory (LSTM) [146] | Accuracy rates between 83% and 98% (sixteen types of coffee) | |||
| [147] | Sensor array: carbon nanotube-based multichannel with 64 interdigital electrodes; Sensor processing unit: N/A | LDA | Accuracy: 97.4% (three different coffee aromas) | Authenticity of coffee |
| [148] | Sensor array: four sensors (SnO2_bs1, ZH0504, SnO2 Au_bs2, SU0303) and two nanowire sensors (Sn-NW1, Sn-NW2); Sensor processing unit: N/A | PCA | N/A (four classes of roasted coffee beans) | Analysis of different methods of coffee roasting |
| [149] | Sensor array: TGS821, TGS2444, TGS823, TGS2600, TGS2602, TGS2610, TGS826, TGS2620; Signal processing unit: NI DAQ card, USB-6009 | PCA | Accuracy: 95% (four acidity levels of coffee drinks) | Coffee drinks quality assessment |
| Radial Basis Function Neural Network [150] | Accuracy: 94.75% (to predict the scores of acidity level) | |||
| [151] | Sensor array: six sensing units (nanocomposites that stem from the combination of ZnO, In2O3, and ZnO/In2O3 nanoparticles with polypyrrole and poly(styrenesulfonate)); Signal processing unit: N/A | PCA + Euclidean distances by dendrograms | N/A (seventeen classes of coffee) | Authenticity of coffee |
| [152] | Sensor array: eight BME688 sensors; Signal processing unit: Adafruit Huzzah32 (ESP32) development board | Random Forest | MSE: 0.062 | Authenticity of coffee |
| Stochastic Gradient Descent [153] | Accuracy: 70.10% (two classes of coffee) | |||
| Adam Optimizer [154] | Accuracy: 67.70% (two classes of coffee) | |||
| [155] | Sensor array: TGS832, TGS823, TGS2600, TGS2610, TGS2611; Signal processing unit: PCI6035E data acquisition card [156] | Bayesian classification [157] | Classification error in percentage 30.91% (four classes of tea) | Black tea quality assessment |
| Electronic Nose Systems for Diary Quality and Safety | ||||
| [158] | Sensor array: TGS2600, TGS822, TGS2611, TGS826, TGS2602, TGS832, TGS2620; Signal processing unit: Arduino microcontroller | PCA + LDA + SVM | Accuracy: 85% | Identification of milk source |
| PCA + LDA + Logistic Regression [159] | Accuracy: 81.50% | |||
| PCA + LDA + Random Forest | Accuracy: 80.50% | |||
| Electronic Nose Systems for Alcoholic Beverage Quality and Safety | ||||
| [160] | Sensor array: MQ-2, MQ-135, TGS825, WSP-2110, MP-503, TGS2602, WSP-1110, MQ-138, MQ-137, MQ-136; Sensor processing unit: N/A | Convolution Dot-Product Attention Mechanism [160], Residual network (ResNet50 mode) [161] | Accuracy: 98.47% (ten production origins of rice wines) | Identification of the origins of rice wines |
| [162] | Sensor array: TGS2600, TGS2602, TGS2603, TGS2610, TGS2611, TGS2620, TGS813, TGS822; Sensor processing unit: N/A | LDA + PCA + CNN-LSTM | Accuracy: 98% (whiskey/brandy /gin/vodka/tequila) | Identification of various types of spirit samples |
| [163] | Sensor array: TGS2600, TGS2603, TGS2610D, TGS2611C, TGS2620; Signal processing unit: N/A | Linear Discriminant | Accuracy: 69.23% (six brands of whiskey); Accuracy: 100% (whiskey regions of origin) | Authenticity of whiskey |
| SVM | Accuracy: 82.05% (six brands of whiskey); Accuracy: 98.72% (whiskey regions of origin) | |||
| KNN | Accuracy: 61.54% (six brands of whiskey); Accuracy: 92.31% (whiskey regions of origin) | |||
| Bagged Tree [91] | Accuracy: 74.36% (six brands of whiskey); Accuracy: 94.87% (whiskey regions of origin) | |||
| Subspace Discriminant [164] | Accuracy: 70.51% (six brands of whiskey); Accuracy: 100% (whiskey regions of origin) | |||
| [165] | Sensor array: TGS2600, TGS2602, TGS2603, TGS2610, TGS2611, TGS2620, TGS813, TGS822, DHT22; Signal processing unit: N/A; | CNN-LSTM | Accuracy: 93% (three whiskey types) | Authentication of whiskey |
| CNN | Accuracy: 91% (three different types of whiskey) | |||
| LSTM | Accuracy: 91% (three different types of whiskey) | |||
| Recurrent Neural Networks [166] | Accuracy: 89% (three whiskey types) | |||
| [167] | Sensor array: eight MOS sensors with two different types of copper oxide heterojunctions, ZnO–CuO and NiO–CuO; Signal processing unit: N/A | Hierarchical Clustering Analysis [168] | Euclidean distance: 0.5 (four samples of Chinese Jing Wine) | Identification of the same liquors manufactured in different years |
| [169] | Sensor array: TGS825, TGS821, TGS826, TGS822, TGS842, TGS813, TGS2610, TGS2201; Signal processing unit: N/A | PCA + Signal-to-Noise Ratio | First two principal components captured 92.47% of data variance (thirteen varieties of Chinese liquor) | Identification of several types of liquors |
| [170] | Sensor array: MQ-3, MQ-6, MQ-9, MQ-135, MQ-136, MQ-137, MQ-138, MQ-139, SHT15 [171]; Signal processing unit: NI DAQ card, USB-6009 | PCA + Multi-Layer Perceptron (MLP) [172] | Accuracy: 100% (three distinct local Thai spirits) | Identification of local Thai craft spirits |
| PCA + k-Means | Accuracy: 72.23% (three distinct local Thai spirits) | |||
| [173] | Sensor array: MQ-3, MQ-4, MQ-7, MQ-8, MQ-135, MQ-136, MQ-137, MQ-138, MG811 [174], AM2320 [175]; Signal processing unit: microcontroller with an onboard ADC | ANNs | Correlation coefficient: 0.97 (to predict seventeen volatile aromatic compounds) | Beer quality assessment |
| # | Sensor | Target Gas | Detection Range [ppm] | Response and Resume Time [s] | Heater Consumption [mW] | Preheat Time [min/h/day] |
|---|---|---|---|---|---|---|
| 1 | BME688 | IAQ, bVOC, eCO2 bVOC: (5 ppm Ethane, 10 ppm Isoprene/2-methyl-1,3 Butadiene, 10 ppm Ethanol, 50 ppm Acetone, 15 ppm Carbon monoxide) | 0–500 (IAQ), bVOC, CO2 P: 300–100 hPa, H: 0–100% T: −40–85 °C | 1/3/300 | 0.16–21.6 | 30 min |
| 2 | MQ-2 | Flammable gas, smoke | 300–10,000 ppm (Flammable gas) | 60 | 950 | 48 h |
| 3 | MQ-3 | Alcohol, Benzine | 0.05–10 mg/L Alcohol | - | 750 | 24 h |
| 4 | MQ-4 | Methane | 300–10,000 ppm (CH4) | 60 | 950 | 48 h |
| 5 | MQ-5 | Liquefied petroleum gas, Methane | 300–10,000 ppm (CH4, C3H8) | 60 | 950 | 48 h |
| 6 | MQ-6 | Liquefied petroleum gas | 300–10,000 ppm (Propane) | 60 | 950 | 48 h |
| 7 | MQ-7 | Carbon monoxide | 20–2000 ppm (CO) | 60 | 350 | 48 h |
| 8 | MQ-8 | Hydrogen gas | 100–1000 ppm (H2 gas) | 60 | 950 | 48 h |
| 9 | MQ-9 | Carbon monoxide and Combustible gas (Methane and Liquefied petroleum gas) | 10–1000 ppm (CO) 100–10,000 ppm (Combustible gas) | 60 | 350 | 48 h |
| 10 | MQ-131 | Ozone | 10–1000 ppm (O3) | 110 | 950 | 48 h |
| 11 | MQ-135 | Ammonia gas, Sulfide, Benzene series steam | 10–1000 ppm (Ammonia gas, Toluene, Hydrogen, smoke) | 60 | 950 | 48 h |
| 12 | MQ-136 | Hydrogen sulfide gas | 1–200 ppm (H2S gas) | 60 | 950 | 48 h |
| 13 | MQ-137 | Ammonia gas | 5–500 ppm (NH3 gas) | 60 | 900 | 48 h |
| 14 | MQ-138 | Toluene, acetone, alcohol, hydrogen | 5–500 ppm | 60 | 900 | 48 h |
| 15 | MQ-139 | Freon | 10–1000 ppm | 180–300 | 900 | 48 h |
| 16 | ZE03-NH3 | CO, O2, NH3, H2S, NO2, O3, SO2, CL2, HF | 0–1000 ppm (CO), 0–25% vol (O2), 0–100 ppm (NH3), 0–100 ppm (H2S), 0–20 ppm (NO2), 0–10 ppm (HF), 0–20 ppm (SO2), 0–10 ppm (CL2), 0–20 ppm (O3) | 15–150 | 20 | - |
| 17 | ZE03-C2H4 | CO, O2, NH3, H2S, NO2, O3, SO2, CL2, HF, H2, PH3, HCL, C2H4 | - | 15–150 | 20 | - |
| 18 | MICS-6814 | Carbon monoxide, Nitrogen dioxide, Ethanol, Hydrogen, Ammonia, Methane, Propane, Iso-butane | 1–1000 ppm (CO), 0.05–10 ppm (NO2), 10–500 ppm (C2H5OH), 1–1000 ppm (H2), 1–500 ppm (NH3), CH4 > 1000 ppm, C3H8 > 1000 ppm, C4H10 > 1000 ppm | - | 43–76 | - |
| 19 | TGS2201 | Diesel exhaust, Gasoline exhaust | 0.1–10 ppm (NO, NO2) 10–1000 ppm (CO, H2, HC) | - | 505 | 7 d |
| 20 | TGS2444 | Ammonia gas, Hydrogen sulfide gas, Ethanol | 10–300 ppm of NH3, 10–100 ppm of H2S, 300–1000 ppm of Ethanol | 60–180 | 56 | 48 h |
| 21 | TGS2600 | Hydrogen, Ethanol | 1–30 ppm of H2 | - | 210 | 7 d |
| 22 | TGS2602 | VOCs, Ammonia, Hydrogen sulfide gas | 1–30 ppm of EtOH | - | 280 | 7 d |
| 23 | TGS2603 | Trimethylamine, Methyl mercaptan | 1–30 ppm of EtOH | - | 240 | 96 h |
| 24 | TGS2610 | Butane, Liquefied petroleum gas | 1–25 % LEL | - | 280 | 7 d |
| 25 | TGS2611 | Methane, Natural gas | 500–10,000 ppm | - | 280 | 7 d |
| 26 | TGS2612 | Methane, Propane, Iso-butane | 1–25 % LEL of each gas | - | 280 | 7 d |
| 27 | TGS2620 | Alcohol, Organic solvent vapors | 50–5000 ppm EtOH | - | 210 | 7 d |
| 28 | TGS800 | General air contaminants | 1–30 ppm | - | 660 | - |
| 29 | TGS813 | Combustible gases | 500–10,000 ppm of Methane | - | 835 | - |
| 30 | TGS821 | Hydrogen | 30–1000 ppm of H2 | - | 660 | - |
| 31 | TGS822/823 | Alcohol, Organic solvents | 50–5000 ppm of Ethanol | - | 660 | - |
| 32 | TGS825 | Hydrogen sulfide gas | 5–100 ppm of (H2) | - | 660 | - |
| 33 | TGS826 | Ammonia gas | 30–300 ppm of NH3 | - | 835 | - |
| 34 | TGS832 | R-134a | 100–3000 ppm of R-134a | - | 835 | - |
| 35 | TGS842 | Methane natural gas | 500–10,000 ppm of CH4 | - | 835 | - |
| 36 | TGS880 | Fumes from food (alcohol, odor) | 10–1000 ppm (Air and Ethanol) | - | 835 | - |
| 37 | WSP1110 Obsolete | NO2 sensor | 0.1–10 ppm NO2 | - | - | - |
| 38 | WSP2110 | Toluene, Methanal, Benzene, Alcohol, Acetone | 1–50 ppm NO2 | 70 | 300 | 120 h |
| 39 | MP503 | Alcohol, Smoke, Iso-butane, Methanal | 10–1000 ppm (Alcohol) | 60 | 300 | 48 h |
| 40 | MG811 | Carbon dioxide | 350–10,000 ppm (CO2) | 20 | 1200 | - |
| Commercial E-Nose | Paper | Data Analysis Techniques | Evaluation and Performance Metrics | Application Area |
|---|---|---|---|---|
| PEN3: A sensor array of ten different metal oxides single thick film sensors [177] | [183] | Recurrent Criss-Cross Attention Network [184] | Accuracy: 98% | Peanuts quality assessment |
| [185] | Statistical analysis on data collected by PEN3 (weight loss measurements and firmness analysis also performed) | Prove that ilmenite-grafted graphene oxide coating reduces postharvest losses | Postharvest preservation of fruits (bananas) | |
| [186] | PCA (e-nose and Headspace-Gas Chromatography-Ion Mobility Spectrometry) | Accuracy: 100% (genuine/fake) | Amomi fructus authenticity | |
| Partial Least Squares-Discriminant Analysis (PLS-DA) [187] (e-nose and Headspace-Gas Chromatography-Ion Mobility Spectrometry) | Accuracy: 97.96% (origin identification) | Amomi fructus origin identification | ||
| [188] | PCA + ANNs | Accuracy: 99% | Milk safety assessment | |
| [189] | Solid-Phase Microextraction [190] coupled with GC–MS and e-nose analysis | Not discussed | Development of structured lipids with enhanced flavor profiles for dairy products and functional food | |
| [191] | Dung Beetle Optimizer algorithm [192] combined with 10 different machine learning methods | Coefficient of determination > 0.895 | Prediction of the electronic sensory characteristics of fermented milk | |
| [193] | Proposed data augmentation model (e-nose + e-tongue) + CNN | Accuracy: 95.34% (four types of mixed solution); Accuracy: 97.78% (five brands of beer); Accuracy: 97.37% (five kinds of apple) | Quality of different food | |
| Fox 3000: Two sensor chambers equipped with twelve MOS sensors [178] | [178] | Random Forest | Accuracy: 95.30% | Mandarin orange quality assessment |
| Fox 4000: An injection system, sensor chambers with eighteen MOS sensors, a mass flow controller, and a micro-controller acquisition board [179] | [194] | PCA | Discrimination index: 93 (seven batches of hydrolysate) | Quality of baked goods (effects of enzymatic hydrolysis on soy protein concentrate) |
| [195] | PCA | PCA1: 94.54%, PCA2: 3.38% of the total variance (untreated sample/pasteurized sample/treated sample/sterilized sample in 0, 30 and 60 days of storage) | Shelf life of chicken products quality assessment | |
| [196] | PCA | Discrimination index: 90 (eight types of plum jam samples) | Evaluation of the characteristics of sugar-free plum jams | |
| [197] | PCA + CA + Partial Least Squares regression [198] (GC–MS and e-nose data) | Correlation coefficients > 0.98 (for 14 characteristic aroma-active compounds) | Mitten crab quality assessment | |
| FOODsniffer [180] | [199] | E-nose data analysis compared with microbiological and GC–MS analyses | FOODsniffer can anticipate the unacceptability conditions of salmon (at 22 °C, 10% of samples are `Not satisfactory’ when FOODSniffer is `Green’) | Salmon fillet and burger quality and safety assessment |
| [200] | E-nose data analysis (PCA) compared with physicochemical measurements of meat quality | PC1–71.13%, PC2: 83.70% of total variance | Meat quality assessment | |
| NeOse Pro: A gold-layer-based optoelectronic sensor array featuring sixty-three non-specific peptides [181] | [201] | PCA + Gas Chromatography with Ion Mobility Spectrometry (GC–IMS) | Completely separate one sample | Plant-based beverage quality assessment |
| PCA + e-nose | Completely separate seven samples | |||
| LDA + GC–IMS | Accuracy between 15.4% and 100% | |||
| LDA + e-nose | Accuracy between 96.2% and 100% | |||
| Cyranose@ 320: An array of thirty-two nanocomposite sensors [182] | [202] | Proposed e-nose pattern recognition algorithm | Accuracy: 80% at room temperature | Identification of Terfezia arenaria truffle |
| E-Nose | Paper | Data Analysis Techniques | Evaluation and Performance Metrics | Application Area |
|---|---|---|---|---|
| LibraNose: An array of eight QCM non-selective sensors coated with different polypyrrole derivatives—University of Rome Tor Vergata, Italy [203] | [209] | E-nose data analysis (PCA + Random Forest regression) | Accuracy: 92.8% (for predictions of B. thermosphacta) | Meat quality assessment |
| High Performance Liquid Chromatography + Random Forest regression | Accuracy: 100% (for predictions of Lactobacilli) | |||
| GC–MS + Random Forest regression | Accuracy: 93.9% (for predictions of Enterobacteriaceae) | |||
| GC–MS + kNN-R | Accuracy: 96.0% (for predictions of Pseudomonads) | |||
| [210] | PCA + Proposed data model based on Adaptive Fuzzy Logic System | Accuracy: 94.28% (fresh/semi-fresh/spoiled) | Monitoring of meat spoiling during storage | |
| [211] | PCA + Proposed Multi-Input Multi-Output Clustering-based Fuzzy Wavelet Neural Network model | Accuracy: 95.71% (fresh/semi-fresh/spoiled); RMSE: 0.2969 to predict the microbial load on meat surface | Meat quality assessment | |
| [212] | Proposed model based on ensemble-based (Bagging and Boosting) SVM | Accuracy: 84.1% (fresh/semi-fresh/spoiled) | Meat quality assessment | |
| Proposed model based on ensemble-based (Bagging and Boosting) SVM-regression | Accuracy: 85% to predict bacterial species counts | |||
| E-nose with an array of twelve QCM sensors—University of Rome Tor Vergata, Italy [204] | [204] | PLS-DA | 94% of the original data’s variation can be represented in a reduced-dimensional space; Accuracy: 100% (five different classes of sparkling wines) | Identification of rosé sparkling wines |
| [213] | PLS-DA | 85% of the original data’s variation can be represented in a reduced-dimensional space; Accuracy between 60% and 100% for the first stages of Botrytis cinerea infection (1, 2, 3 days) | Identification of noble rot (a fungus also known as Botrytis cinerea) in postharvest wine grapes | |
| E-nose with an array of eight QCM sensors—University of Rome Tor Vergata, Italy [205] | [205] | PCA + LDA | Accuracy: 71.4% (Aspergillus niger/ Aspergillus fumigatus/ Aspergillus flavus) | Identification of Aspergillus Species |
| E-nose with four gas sensors (BME680 [214], SGP30 [215], CCS811 [216], iAQ-Core [217]) —Industrial Engineering School of the University of Extremadura, Spain [206] | [206] | E-nose data analysis (PCA + PLS-DA) compared with GC–MS | PC1–83.5%, PC2–12.3% of the total variance; Accuracy: 100% (six classes of roasted coffee beans exposed to different heat treatment conditions) | Roasted coffee quality assessment |
| [218] | PCA + PLS-DA | Whole roasted almonds–R2: 0.89 for acrylamide and furfural, R2: 0.83 for hydroxymethylfurfural Ground roasted almonds–R2: 0.99 for acrylamide, R2: 0.98 for hydroxymethylfurfural, R2: 0.88 for furfural | Prediction of contaminants in roasted almonds | |
| Agrinose: An array of eight MOS sensors (AS-MLV-P2 [219], TGS2602, TGS2600, TGS2603, TGS2610, TGS2611, TGS8100 [220], TGS2620) —Institute of Agrophysics IA PAS, Poland [207] | [221] | Proposed model based on a three-parameter method based on the impregnation time, cleaning time, and maximum response of chemically sensing sensors + PCA compared with GC–MS | PC1 + PC2 describe 72.64% of the total variance and enable clear separation of different sample classes | Assessment of the suitability of bread for consumption after storage |
| [222] | Proposed model based on a three-parameter method based on the impregnation time, cleaning time, and maximum response of chemically sensing sensors + PCA compared with Fourier Transform Infrared Spectroscopy [223] and GC–MS | PC1 + PC2 describe 79.25% of the total variance and enable clear separation of different sample classes | Identification of rapeseed spoilage | |
| E-nose with nine MOS sensors (MQ-2, MQ-3, MQ-4, MQ-5, MQ-6, MQ-7, MQ-8, MQ-9, MQ-135)—Department of Biosystems Engineering, Bu-Ali Sina University, Iran [208] | [224] | PCA | Included 55%, 75%, 47%, and 53% of data for unprocessed whole/dried slices/powder/tablet | Garlic quality assessment |
| LDA | Accuracy: 90%, 93.33%, 88.89%, 60% (unprocessed whole/dried slices/powder/tablet) | |||
| SVM | Accuracy: 72.22%, 80.00%, 75.55%, 40% (unprocessed whole/dried slices/powder/tablet) | |||
| Backpropagation Neural Network [225] | Accuracy: 100%, 97.80%, 92.2%, 77.78% (unprocessed whole/dried slices/powder/tablet) |
| # | Sensor | Target Gas | Detection Range [ppm] | Response and Resume Time [s] | Heater Consumption [mW] | Preheat Time [min/h/Day] |
|---|---|---|---|---|---|---|
| 1 | BME688 | IAQ, bVOC, eCO2 bVOC: (5 ppm Ethane, 10 ppm Isoprene/2-methyl-1,3 Butadiene, 10 ppm Ethanol, 50 ppm Acetone, 15 ppm Carbon monoxide) | 0–500 (IAQ), bVOC, CO2 P: 300–1100 hPa, H: 0–100% T: −40–85°C | 1/3/300 | 0.16–21.6 | 30 min |
| 2 | SGP30 End of life | VOC, eCO2, Ethanol, Hydrogen sulfide gas | 0–60,000 ppb (VOC), 400–60,000 ppm (eCO2) 0– 1000 ppm (Ethanol, H2S) | 1 | 86.4 | 24 h |
| 3 | CCS811 | TVOC, eCO2 | 0–1187 ppb (TVOC), 400–8192 ppm (eCO2) | 0.25/1/10/60 | 1.2–46 | 48 h |
| 4 | iAQ-Core Obsolete | eCO2, TVOC | 450–2000 ppm (eCO2), 125–600 ppb (TVOC ) | 1/11 | 9–69 | - |
| 5 | AS-MLV-P2 Obsolete | CO, Butane, Methane, Ethanol, Hydrogen | 30–500 ppm (CO), 15–150 ppm (Butane), 250–4500 ppm (CH4), 10–200 ppm (Ethanol), 25–500 ppm (H) | 1/10 | 50 | 5 d |
| 6 | TGS8100 | Methane, Iso-butane, CO, Hydrogen, Ethanol | 1–100 ppm, 1–30 ppm (H2) | - | 15 | >1 h |
| Reference and Sensor Type/Technology | Target Compounds/ Application | Data Analysis Techniques | Key Features/Results |
|---|---|---|---|
| [226]: Silicon NanoWires + multi-walled carbon nanotube | Essential oils, alcoholic beverages, general food | PCA | Fast response time (20–30 s), high selectivity, dual surface, and chemical modification |
| [227]: Graphene junctions | Aflatoxin B1 | N/A | 1.2 V bias yields >3 µA current change; suitable for rapid e-nose integration |
| [228]: Plasmonic arrays + chemometrics + machine learning | Multiple VOCs in food | PCA + LDA | Uses Surface-Enhanced Raman Spectroscopy, mimics animal olfaction; machine learning enables multi-analyte detection |
| [229]: Memristor-based in-memory computing + MOS sensor array | Various gases (15 sensors) | CNN | 94% classification accuracy; 20.2 mW power; fast response time (<0.4 ms inference time); compact processing scheme |
| [230]: Graphene + Metal Phthalocyanines | Ammonia gas, interfering gases | PCA | 5-sensor array (Co-Pc, Ni-Pc, Zn-Pc, Fe-Pc, pristine); promising for food quality monitoring |
| [231]: Film Bulk Acoustic Resonator sensors | General gases; example: banana freshness | Real-time signal processing and pre-processing + Discriminative analysis | Miniaturized portable e-nose; 6–8× more sensitive than polymer-coated Film Bulk Acoustic Resonator; drift-compensated |
| [232]: Colorimetric Fe(II) complex | Ammonia gas | PCA + Hierarchical cluster analysis, SVM | Detects 105 ppb at room temp; reusable; no external energy needed |
| [233]: CNT + olfactory receptor (ODR-10) | Diacetyl in alcoholic beverages | Sensitivity and selectivity analysis | Detection limit of 10 fM; better than fluorescence assays and GC–IMS in classification |
| Dataset | Description | Paper | Data Analysis Techniques | Evaluation and Performance Metrics |
|---|---|---|---|---|
| [234,235] | 2220 sensor signal responses collected from twelve cuts of beef samples in four different degrees of freshness using eleven gas sensors | [236] | Proposed model based on 1D-CNN | Accuracy: 97.22% (excellent/good/ acceptable/spoiled) |
| [237] | ANNs | Accuracy: 99.9% (excellent/good/ acceptable/spoiled) | ||
| Linear Regression | Accuracy: 98.9% (excellent/good/ acceptable/spoiled)) | |||
| KNN | Accuracy: 98.8% (excellent/good/ acceptable/spoiled) | |||
| [238] | Proposed MLP model on Field Programmable Gate Array | Accuracy: 92.72% (excellent/good/ acceptable/spoiled) | ||
| [239] | Proposed approach based on Single Plurality Voting System model + Decision Tree | Accuracy: 91.13% (excellent/good/ acceptable/spoiled) | ||
| Proposed approach based on Single Plurality Voting System model + KNN | Accuracy: 88.69% (excellent/good/ acceptable/spoiled) | |||
| Proposed approach based on Single Plurality Voting System model + LDA | Accuracy: 80.73% (excellent/good/ acceptable/spoiled) | |||
| [240] | 420 samples for seven different mixtures of beef and pork collected from eight gas sensors | [241] | Proposed model based on a conventional Deep Extreme Learning Machine with an autoencoder for feature learning | Accuracy: 99.85% (seven combination mixtures of meat) |
| Proposed model based on SVM with a Radial Basis Function kernel | Accuracy: 93.48% (seven combination mixtures of meat) | |||
| Proposed model based on a conventional Deep Extreme Learning Machine with PCA for feature learning | Accuracy: 99.97% (seven combination mixtures of meat) | |||
| Proposed model based on PCA + SVM with a Radial Basis Function kernel | Accuracy: 96.88% (seven combination mixtures of meat) | |||
| [242,243] | Time series data for 235 wine samples collected from six gas sensors | [244] | Proposed model based on CNN | Accuracy: 99.2% (low quality/average quality/high quality) |
| [245] | 48,846 rows for rice quality acquired from nine gas sensors and four other sensors for related data | [245] | Proposed model based on KNN | R2: 0.7217; RMSE: 3.8043 |
| [246] | Gradient Tree Boosting | Accuracy: 96% (expired/non-expired) | ||
| [247] | Complement Naïve Bayes classifier | Accuracy: 98% (expired/non-expired) | ||
| Multinomial Naïve Bayes classifier | Accuracy: 97% (expired/non-expired) | |||
| Gaussian Naïve Bayes classifier | Accuracy: 82% (expired/non-expired) | |||
| Bernoulli Naïve Bayes classifier | Accuracy: 52% (expired/non-expired) | |||
| [248] | MLP | Accuracy: 99.84% (expired/non-expired) |
| Identified Gap | Recommended Solution in This Review |
|---|---|
| Low real-world deployment despite high lab accuracy | Provide case studies and benchmarking tables to bridge lab-to-field gaps |
| Sensor selectivity and sensitivity challenges | Develop gas-sensitive materials with enhanced selectivity and sensitivity for food VOCs, or design bio-inspired or biomimetic sensors that mimic natural senses to improve detection accuracy in food analysis |
| Sensor response time challenges | Design gas sensors with fast response times |
| Sensor drift and calibration challenges | Introduce adaptive/recalibrating machine learning models and emphasize real-time feedback control |
| Black-box nature of machine learning models used in classification | Recommend interpretable machine learning models and alignment with food safety regulations (i.e., Codex/ISO) |
| Lack of efficient multi-sensor (e-nose, e-tongue, e-eye) data fusion algorithms results in incomplete food profiling | Develop advanced data fusion frameworks using machine learning, hybrid fusion techniques, and synchronized pre-processing |
| Miniaturization and portability challenges | Recommend integration of micro-electro-mechanical systems/ nano-electro-mechanical systems technologies for compact, low-power devices |
| Lack of standardization in methodology and validation | Recommend universal protocols for data collection, validation, and sensor benchmarking |
| Lack support in user-friendly visualization of the odor classification and identification results | Introduce real-time data analysis platforms for on-site decision making |
Disclaimer/Publisher’s Note: The statements, opinions and data contained in all publications are solely those of the individual author(s) and contributor(s) and not of MDPI and/or the editor(s). MDPI and/or the editor(s) disclaim responsibility for any injury to people or property resulting from any ideas, methods, instructions or products referred to in the content. |
© 2025 by the authors. Licensee MDPI, Basel, Switzerland. This article is an open access article distributed under the terms and conditions of the Creative Commons Attribution (CC BY) license (https://creativecommons.org/licenses/by/4.0/).
Share and Cite
Sanislav, T.; Mois, G.D.; Zeadally, S.; Folea, S.; Radoni, T.C.; Al-Suhaimi, E.A. A Comprehensive Review on Sensor-Based Electronic Nose for Food Quality and Safety. Sensors 2025, 25, 4437. https://doi.org/10.3390/s25144437
Sanislav T, Mois GD, Zeadally S, Folea S, Radoni TC, Al-Suhaimi EA. A Comprehensive Review on Sensor-Based Electronic Nose for Food Quality and Safety. Sensors. 2025; 25(14):4437. https://doi.org/10.3390/s25144437
Chicago/Turabian StyleSanislav, Teodora, George D. Mois, Sherali Zeadally, Silviu Folea, Tudor C. Radoni, and Ebtesam A. Al-Suhaimi. 2025. "A Comprehensive Review on Sensor-Based Electronic Nose for Food Quality and Safety" Sensors 25, no. 14: 4437. https://doi.org/10.3390/s25144437
APA StyleSanislav, T., Mois, G. D., Zeadally, S., Folea, S., Radoni, T. C., & Al-Suhaimi, E. A. (2025). A Comprehensive Review on Sensor-Based Electronic Nose for Food Quality and Safety. Sensors, 25(14), 4437. https://doi.org/10.3390/s25144437