
Emoji-Driven Sentiment Analysis for Social Bot Detection with Relational Graph Convolutional Networks


Abstract
1. Introduction
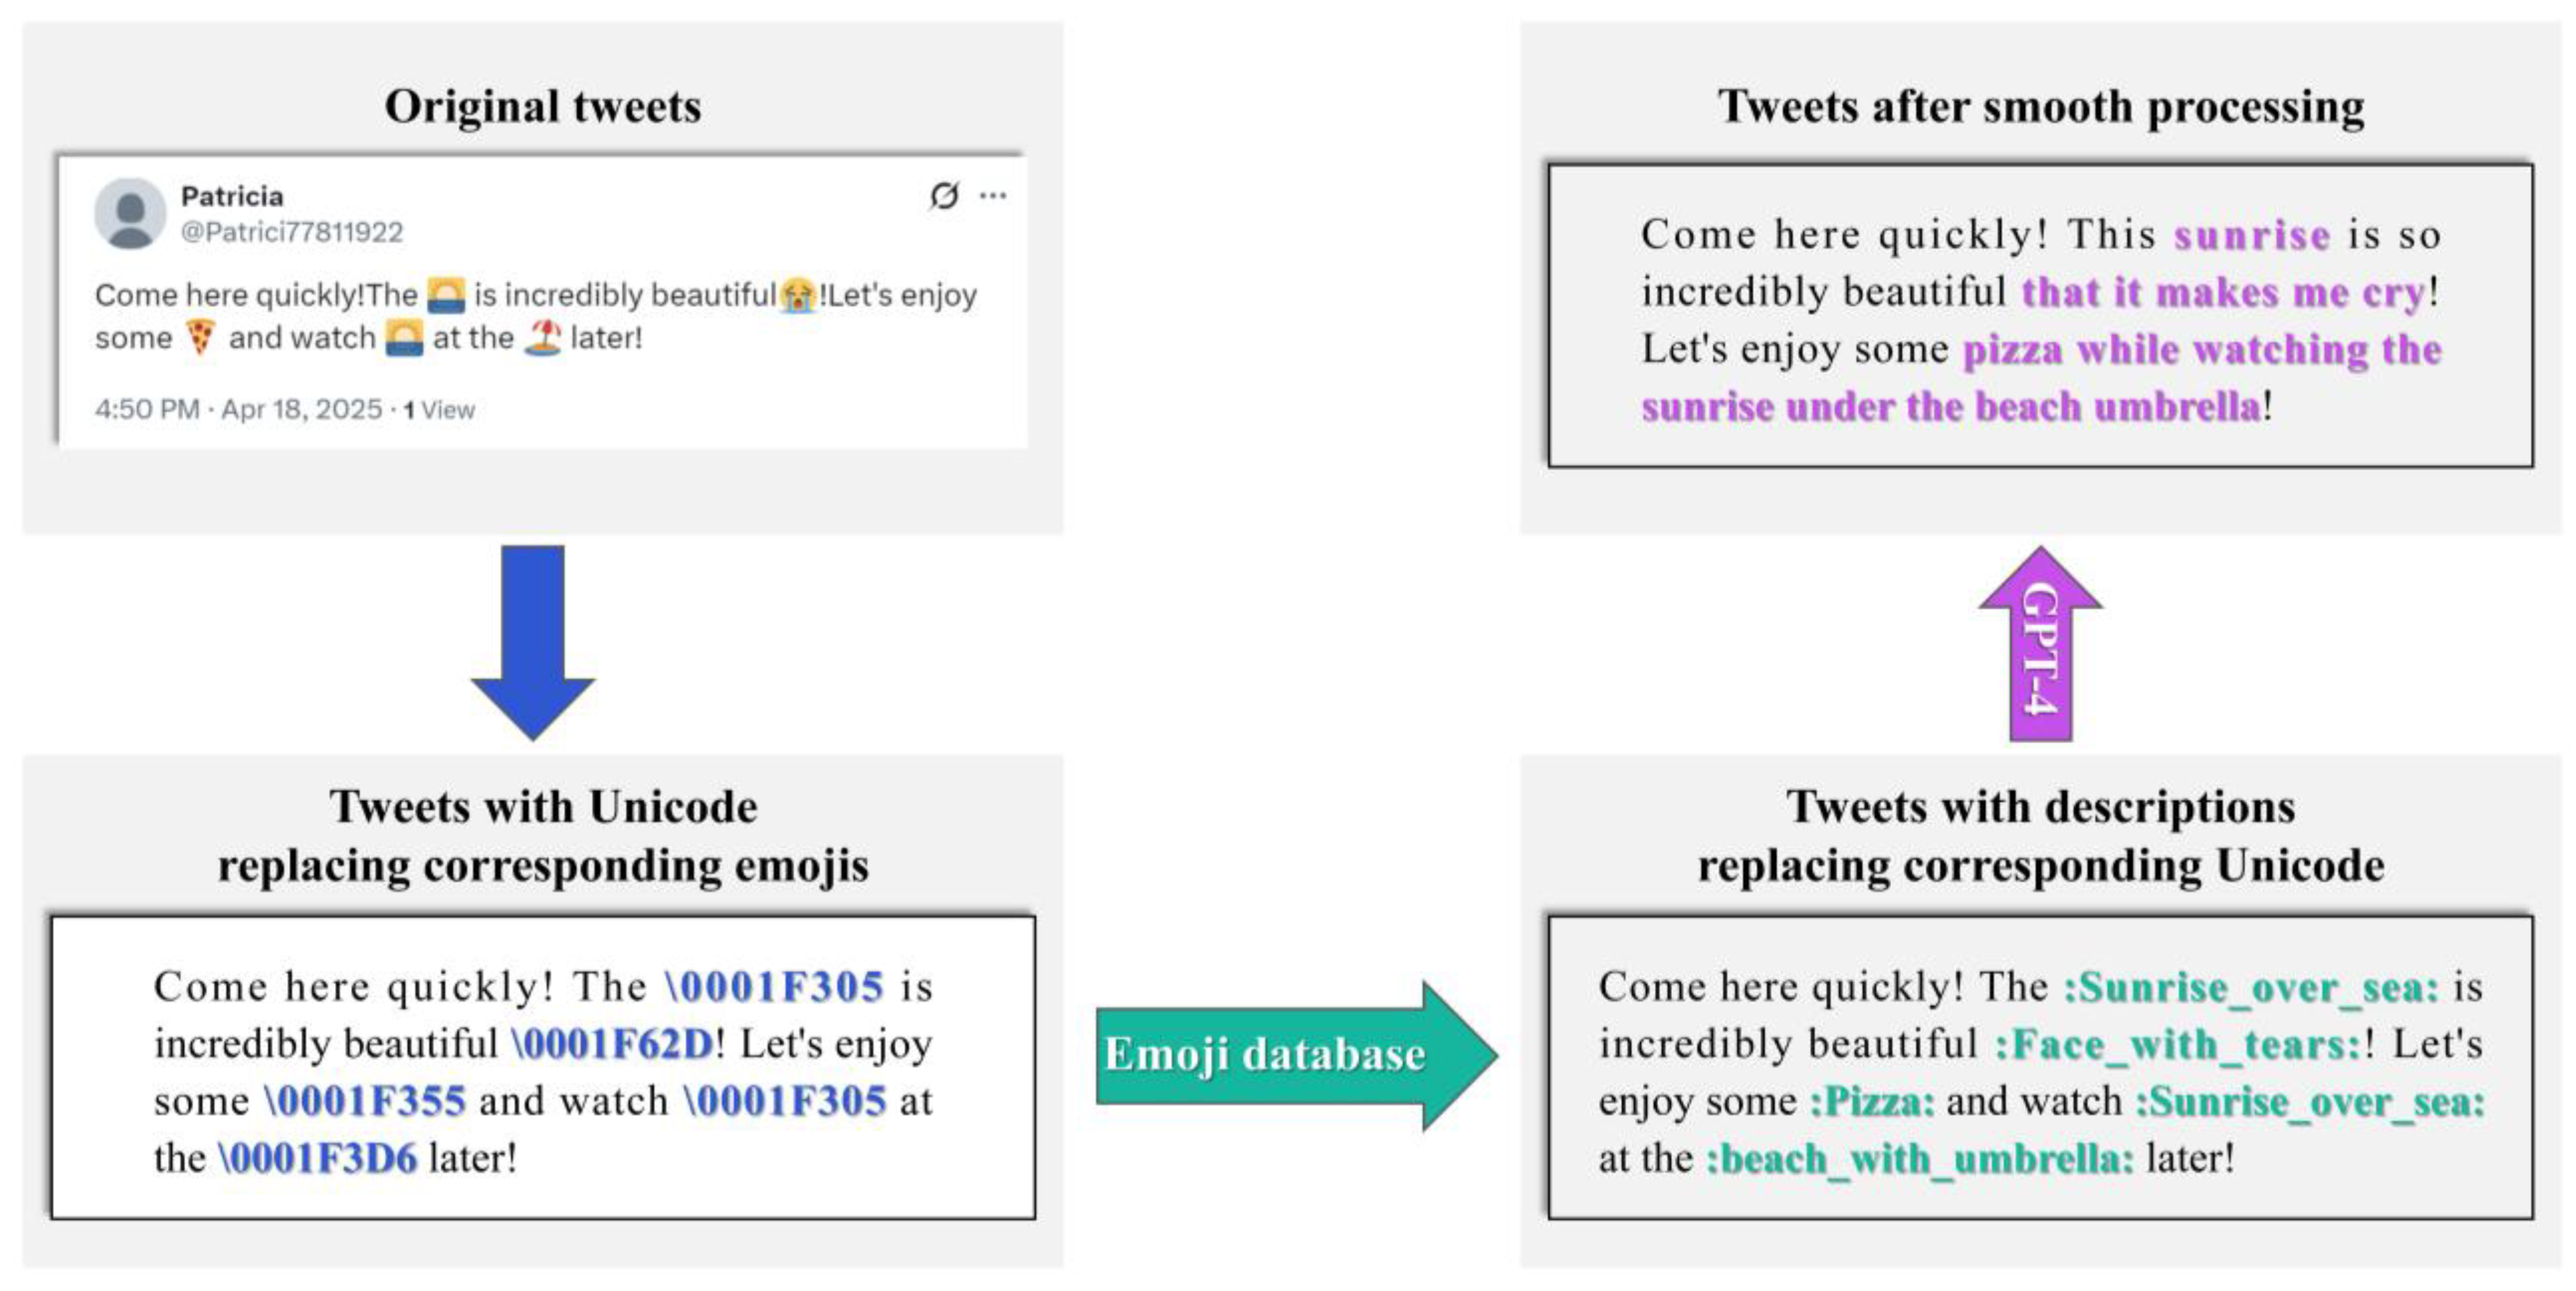
 and watch
  at the
  later!” as an example, when analyzed solely through its textual content, the meaning becomes ambiguous. However, integrating emojis with the text resolves semantic uncertainties, revealing a clear contextual narrative. This contrast demonstrates that emojis encode rich semantic information, thereby proving their irreplaceable value in tweet interpretation.
 ” as an example, if the emojis are ignored, it expresses the negative emotions of disappointment and chagrin after the plan is ruined. However, after adding the “” emojis, the sentiment of the sentence undergoes a reversal, conveying an easygoing and adaptable attitude of “Since it’s raining and the picnic can’t happen, might as well have a drink and then go to sleep”, thus transforming into a positive sentiment. To meet escalating demands for emotional articulation, the Unicode Consortium has expanded emoji categories through iterative updates. As illustrated in Figure 2, official data reveal a 35-fold increase in emoji diversity from 2005 to 2025 [18], with an annual growth rate of 42.7%. This expansion substantially elevates emojis’ research value in sentiment analysis.
- We utilize the Emoji Library to convert emojis into textual descriptions, refine the coherence of transformed tweets via GPT-4, and generate semantically and sentiment-enriched tweet embeddings using RoBERTa.
- We propose a seven-dimensional sentiment feature quantification framework, leveraging foundational sentiment metrics, including positive, negative, and neutral sentiment values and complexity measures, to further capture statistical discrepancies between bot accounts and genuine users in terms of sentiment polarity span, dynamic volatility, and expression consistency.
- An attention gating mechanism is developed to adaptively integrate sentiment features, user descriptions, tweet content, numerical attributes, and categorical features into a globally context-aware unified feature representation.
- To capture bot-specific behavioral patterns, a Relational Graph Convolutional Network (RGCN) is constructed to model user-following relationships based on graph topological structures.
- We conduct extensive experiments on the TwiBot-20 and Cresci-15 datasets, demonstrating our model’s superiority through significant improvements in accuracy, F1-score, and MCC over mainstream baselines.
2. Related Work
2.1. Content-Based Approaches
2.2. Behavior-Based Approaches
2.3. Deep Learning-Based Approaches
2.4. Graph Neural Network-Based Approaches
3. ESA-BotRGCN Model Architecture
3.1. Emoji Preprocessing
3.1.1. Emoji Mapping
3.1.2. Text Coherence Optimization
” becomes “Let’s go to the beach! :beach_with_umbrella:” after conversion, resulting in semantic discontinuity. To address this, this study introduces the GPT-4 model for semantic reconstruction; the prompt is: “You are a language analysis expert. Analyze the tweet provided to you. The emojis in the tweet have been converted into corresponding text label embeddings. Please make the tweet coherent without changing its original meaning, and ensure the length of the generated tweet does not exceed 200% of the original tweet.”. As illustrated in Figure 4, this process ensures that tweets fully express their semantic and emotional information. For instance, the aforementioned tweet is reconstructed as “Let’s go to the beach and enjoy the sun under an umbrella!”.3.1.3. Handling of Abnormal Emojis
3.2. Sentiment-Based Features Processing
3.2.1. Basic Sentiments and Complexity
3.2.2. Sentiment Polarity Span
3.2.3. Sentiment Volatility
3.2.4. Sentiment Consistency
3.3. User Node Feature Processing
3.3.1. User Description Feature
3.3.2. Tweet Content Feature
3.3.3. Numerical Features
3.3.4. Categorical Features
3.4. Features Fusion
3.4.1. Feature Alignment and Nonlinear Transformation
3.4.2. Single-Head Attention Weight Allocation
3.4.3. Context-Aware Feature Fusion
3.5. Heterogeneous Social Graph Modeling
3.5.1. Node Initialization
3.5.2. Relational Graph Convolution
3.5.3. Multi-Layer Perceptron (MLP) Enhancement
3.6. Learning and Optimization
3.6.1. Classifier Design
3.6.2. Loss Function
4. Experiments
4.1. Experimental Setup
4.1.1. Dataset
4.1.2. Evaluation Metrics
- Accuracy: Measures the overall proportion of correct classifications.
- 2.
- F1-score [49]: The harmonic mean of precision and recall, suitable for scenarios requiring balanced class distributions.
- 3.
- MCC (Matthews Correlation Coefficient) [50]: A statistical measure that synthesizes all four elements of the confusion matrix, robust to class imbalance.
4.1.3. Baseline Methods
- Lee et al. [51]: A Random Forest-based model that integrates multi-dimensional features such as user-following networks and tweet content for detection.
- Yang et al. [52]: Employs lightweight metadata combined with a Random Forest algorithm to achieve efficient tweet stream analysis.
- Kudugunta et al. [53]: Leverages a contextual Long Short-Term Memory (LSTM) network to jointly model tweet content and metadata for tweet-level bot detection.
- Wei et al. [54]: Utilizes a three-layer Bidirectional Long Short-Term Memory (BiLSTM) with word embeddings to identify social bots on Twitter.
- Miller et al. [55]: Treats bot detection as an anomaly detection problem rather than classification, introducing 95 lexical features extracted from tweet text.
- Cresci et al. [26]: Innovatively encodes user behaviors into DNA-like sequences and distinguishes bots from humans via Longest Common Subsequence (LCS) similarity.
- Botometer [7]: A widely used public Twitter detection tool that employs over 1000 features.
- Alhosseini et al. [56]: Detects social bots using a Graph Convolutional Neural Network (GCNN) by leveraging node features and aggregated neighborhood node features.
- SATAR [57]: A self-supervised representation learning framework capable of generalizing by jointly utilizing user semantics, attributes, and neighborhood information.
- BotRGCN [36]: Addresses bot detection by constructing a heterogeneous graph from Twitter user-follow relationships and applying an RGCN.
4.2. Comparative Experiments
4.2.1. Emoji Preprocessing Ablation Study
- Original tweets: Raw tweets without any emoji processing.
- Emoji-mapped tweets: Tweets where emojis are replaced with corresponding textual descriptions from the Emoji Library.
- GPT-4 optimized tweets: Emoji-mapped tweets further refined by GPT-4 for textual coherence.
- Qwen-2.5 Optimizes Tweets: Use Qwen-2.5, owned by Alibaba, to optimize the text coherence of tweets after mapping with the Emoji library, and keep the prompt consistent with that of GPT-4.
4.2.2. Sentiment Feature Ablation Study
- No sentiment features: Only user descriptions, tweet content, numerical attributes, and categorical features are used.
- Basic sentiment features: Incorporates positive, negative, and neutral sentiment polarities, as well as sentiment complexity.
- Advanced sentiment features: On the basis of basic sentiment features, three additional features are added—polarity span, volatility, and consistency.
4.2.3. Selection of Graph Neural Network Architecture and Its Layers
- Graph Attention Network (GAT): Dynamically assigns edge weights through an attention mechanism.
- Graph Convolutional Network (GCN): Models homogeneous social relationships without distinguishing node or edge types.
- Fully Connected Neural Network: Applies nonlinear transformations via Multi-Layer Perceptrons.
4.2.4. Ablation Experiment on Attention Mechanism
- Without-attention mechanism: Directly concatenate five types of feature vectors (sentiment features, user descriptions, tweet content, numerical features, and categorical features) to replace attention-weighted fusion.
- Complete-attention mechanism: Use the attention gating network proposed in Section 3.4 of this paper for dynamic feature fusion.
4.2.5. Statistical Significance Analysis of Different Feature Settings
- Without emotion and emojis: sentiment features and emoji preprocessing were removed, retaining only the other feature modalities.
- Use only sentiment features: Retain the seven-dimensional sentiment features and remove the text enhancement processing for emojis.
- Use only emojis: Perform emoji-to-text mapping and GPT-4 semantic optimization, but do not introduce sentiment features.
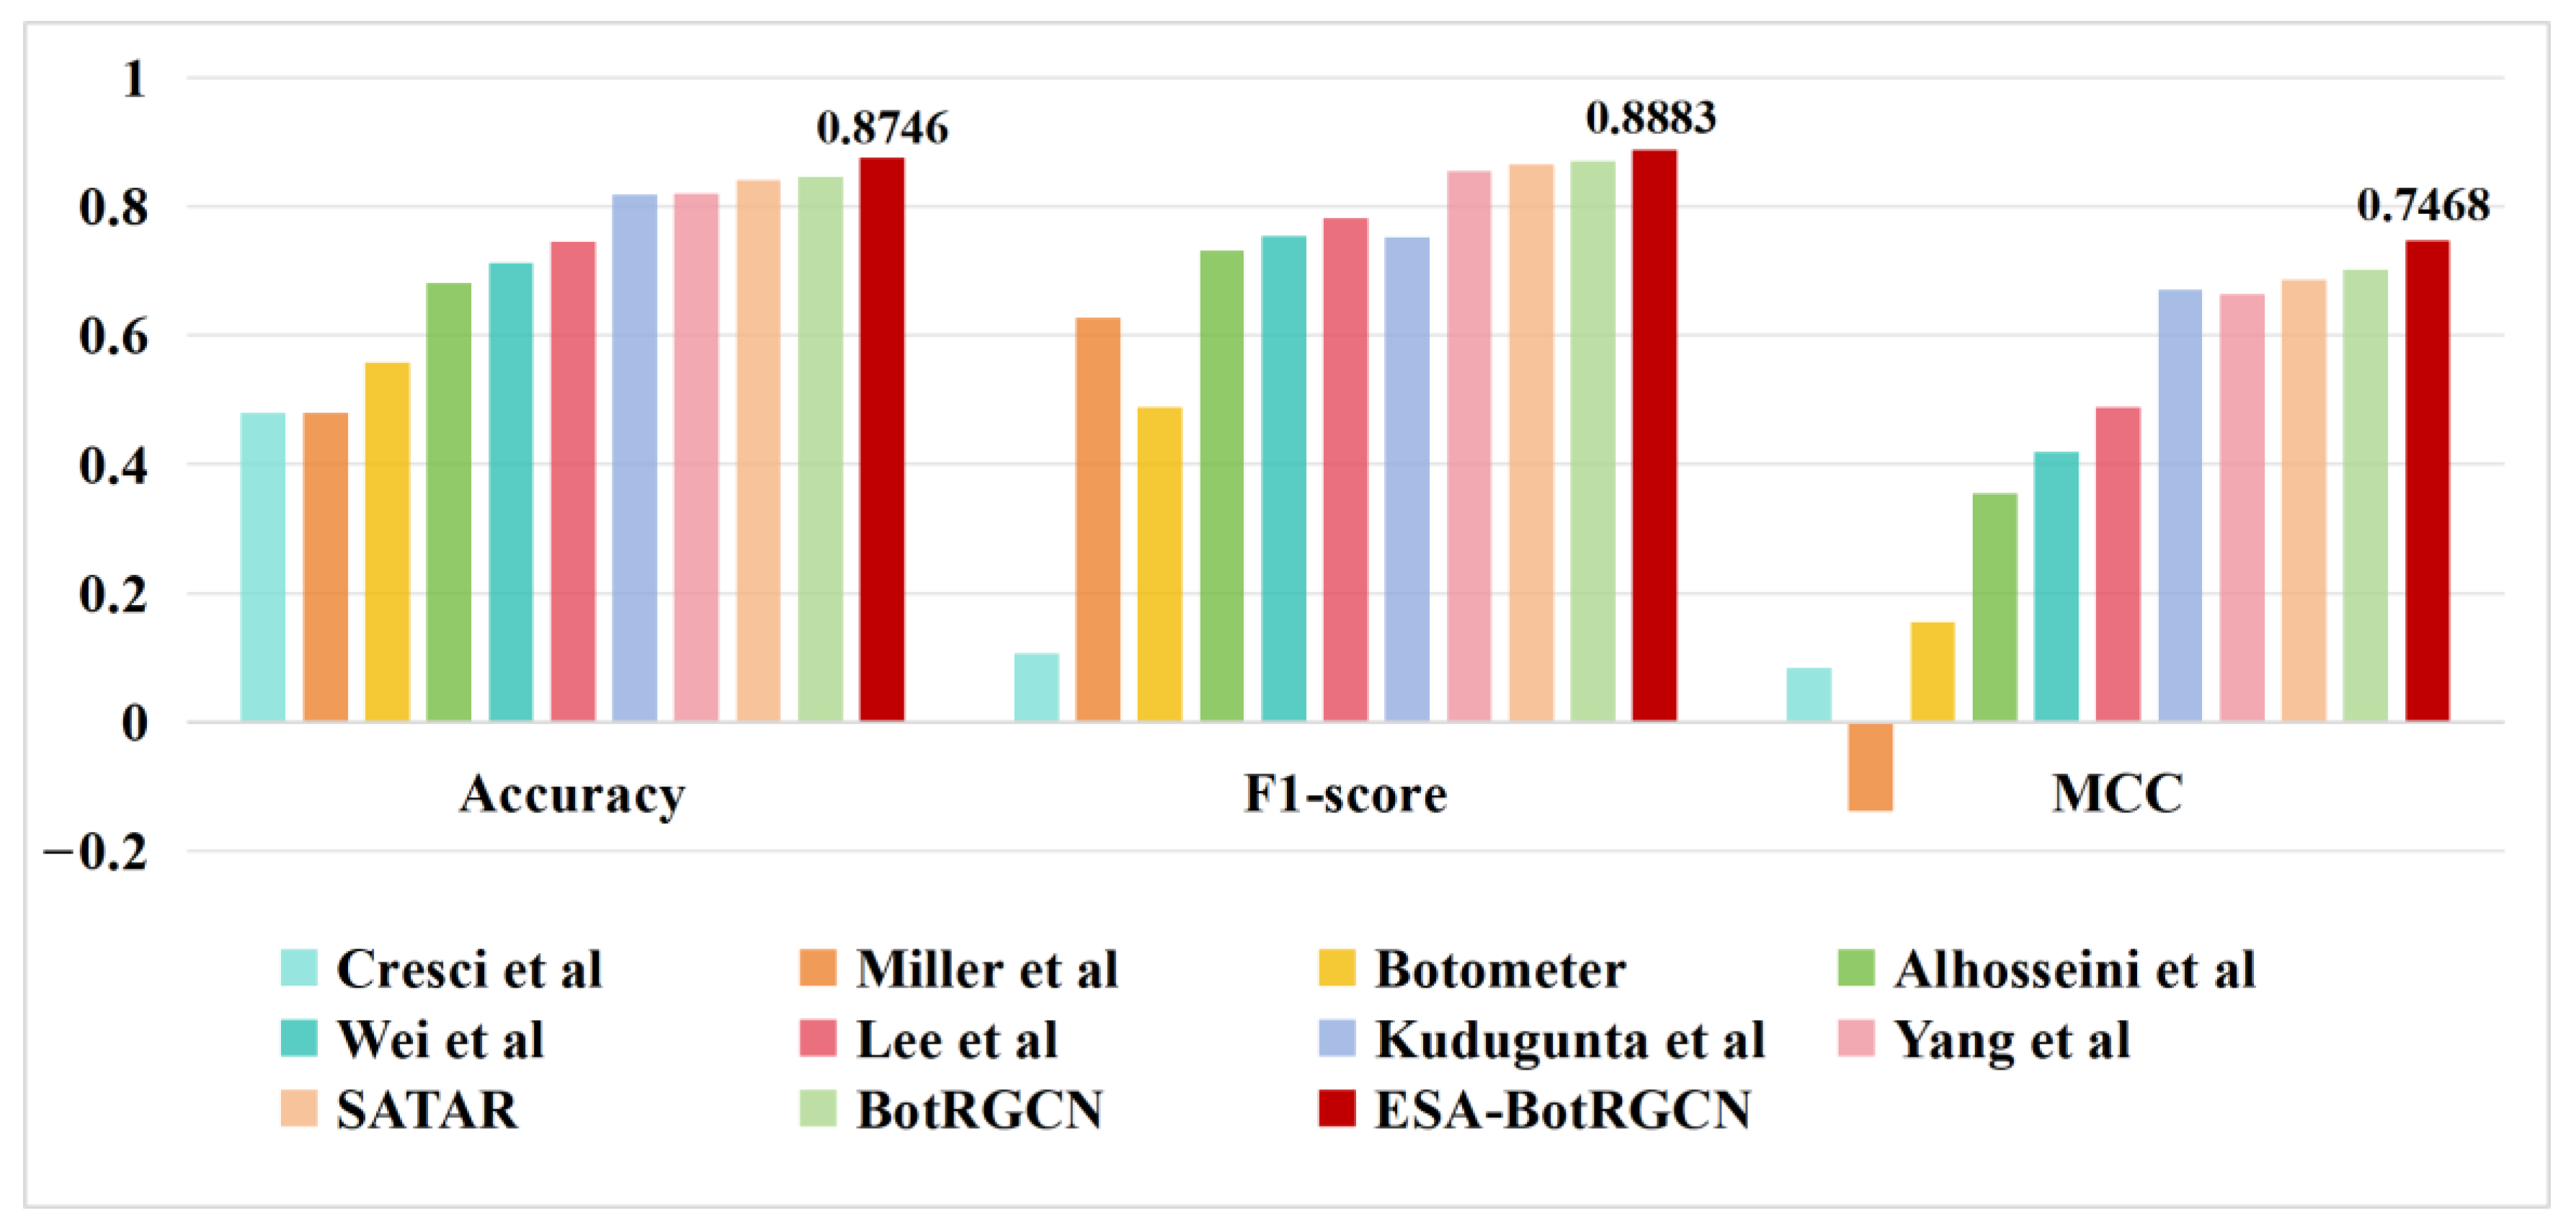
4.3. Performance Comparison
5. Conclusions
Author Contributions
Funding
Institutional Review Board Statement
Informed Consent Statement
Data Availability Statement
Conflicts of Interest
Abbreviations
| ESA-BotRGCN | Emoji-Driven Sentiment Analysis for Social Bot Detection with Relational Graph Convolutional Network |
| RGCN | Relational Graph Convolutional Network |
| MCC | Matthews Correlation Coefficient |
| CNNs | Convolutional Neural Networks |
| RNNs | Recurrent Neural Networks |
| GNN | graph neural network |
| URL | Uniform Resource Locator |
| LR | logistic regression |
| SVM | support vector machine |
| GB | gradient boosting |
| LCS | Longest Common Subsequence |
| LSTM | Long Short-Term Memory |
| BiGRU | bidirectional gated recurrent unit |
| UNK | unknown (placeholder for rare emojis) |
| MLPs | Multi-Layer Perceptrons |
| API | Application Programming Interface |
| TP | true positive |
| TN | true negative |
| FP | false positive |
| FN | false negative |
| BiLSTM | Bidirectional Long Short-Term Memory |
| GCNN | Graph Convolutional Neural Network |
| GAT | Graph Attention Network |
| GCN | Graph Convolutional Network |
| Adam | Adaptive Moment Estimation |
| Leaky-ReLU | Leaky Rectified Linear Unit |
References
- Krithiga, R.; Ilavarasan, E. A Comprehensive Survey of Spam Profile Detection Methods in Online Social Networks. J. Phys. Conf. Ser. 2019, 1362, 12111. [Google Scholar] [CrossRef]
- Meta Investor Platforms. Meta Reports Fourth Quarter and Full Year 2023 Results; Initiates Quarterly Dividend: New York, NY, USA, 2024. [Google Scholar]
- Varol, O.; Ferrara, E.; Davis, C.A.; Menczer, F.; Flammini, A. Online human-bot interactions: Detection, estimation, and characterization. Proc. Int. AAAI Conf. Web Soc. Media 2017, 11, 280–289. [Google Scholar] [CrossRef]
- Shafahi, M.; Kempers, L.; Afsarmanesh, H. Phishing through social bots on Twitter. In Proceedings of the 4th IEEE International Conference on Big Data, Big Data 2016, Washington, DC, USA, 5–8 December 2016; Institute of Electrical and Electronics Engineers Inc.: Washington, DC, USA, 2016; pp. 3703–3712. [Google Scholar]
- Hajli, N.; Saeed, U.; Tajvidi, M.; Shirazi, F. Social Bots and the Spread of Disinformation in Social Media: The Challenges of Artificial Intelligence. Br. J. Manag. 2022, 33, 1238–1253. [Google Scholar] [CrossRef]
- Chinnaiah, V.; Kiliroor, C.C. Heterogeneous feature analysis on twitter data set for identification of spam messages. Int. Arab. J. Inf. Technol. 2022, 19, 38–44. [Google Scholar] [CrossRef]
- Yang, K.-C.; Ferrara, E.; Menczer, F. Botometer 101: Social bot practicum for computational social scientists. J. Comput. Soc. Sci. 2022, 5, 1511–1528. [Google Scholar] [CrossRef]
- Weedon, J.; Nuland, W.; Stamos, A. Information Operations and Facebook; Facebook, Inc.: Menlo Park, CA, USA, 2017. [Google Scholar]
- Ferrara, E. Social bot detection in the age of ChatGPT: Challenges and opportunities. First Monday 2023, 28, 13185. [Google Scholar] [CrossRef]
- Yang, Y.; Yang, R.; Li, Y.; Cui, K.; Yang, Z.; Wang, Y.; Xu, J.; Xie, H. RoSGAS: Adaptive Social Bot Detection with Reinforced Self-supervised GNN Architecture Search. ACM Trans. Web 2023, 17, 1–31. [Google Scholar] [CrossRef]
- Cappallo, S.; Svetlichnaya, S.; Garrigues, P.; Mensink, T.; Snoek, C.G.M. New Modality: Emoji Challenges in Prediction, Anticipation, and Retrieval. IEEE Trans. Multimed. 2019, 21, 402–415. [Google Scholar] [CrossRef]
- Zhao, J.; Dong, L.; Wu, J.; Xu, K. MoodLens: An Emoticon-Based Sentiment Analysis System for Chinese Tweets; ACM: New York, NY, USA, 2012; pp. 1528–1531. [Google Scholar]
- Liu, K.-L.; Li, W.-J.; Guo, M. Emoticon Smoothed Language Models for Twitter Sentiment Analysis. Proc. AAAI Conf. Artif. Intell. 2021, 26, 1678–1684. [Google Scholar] [CrossRef]
- Alexander, H.; Bal, D.; Flavius, F.; Bal, M.; Franciska De, J.; Kaymak, U. Exploiting emoticons in polarity classification of text. J. Web Eng. 2015, 14, 22. [Google Scholar]
- Boia, M.; Faltings, B.; Musat, C.-C.; Pu, P. A :) Is Worth a Thousand Words: How People Attach Sentiment to Emoticons and Words in Tweets. In Proceedings of the 2013 International Conference on Social Computing, Alexandria, VA, USA, 8–14 September 2013; pp. 345–350. [Google Scholar]
- Wang, Q.; Wen, Z.; Ding, K.; Liang, B.; Xu, R. Cross-Domain Sentiment Analysis via Disentangled Representation and Prototypical Learning. IEEE Trans. Affect. Comput. 2025, 16, 264–276. [Google Scholar] [CrossRef]
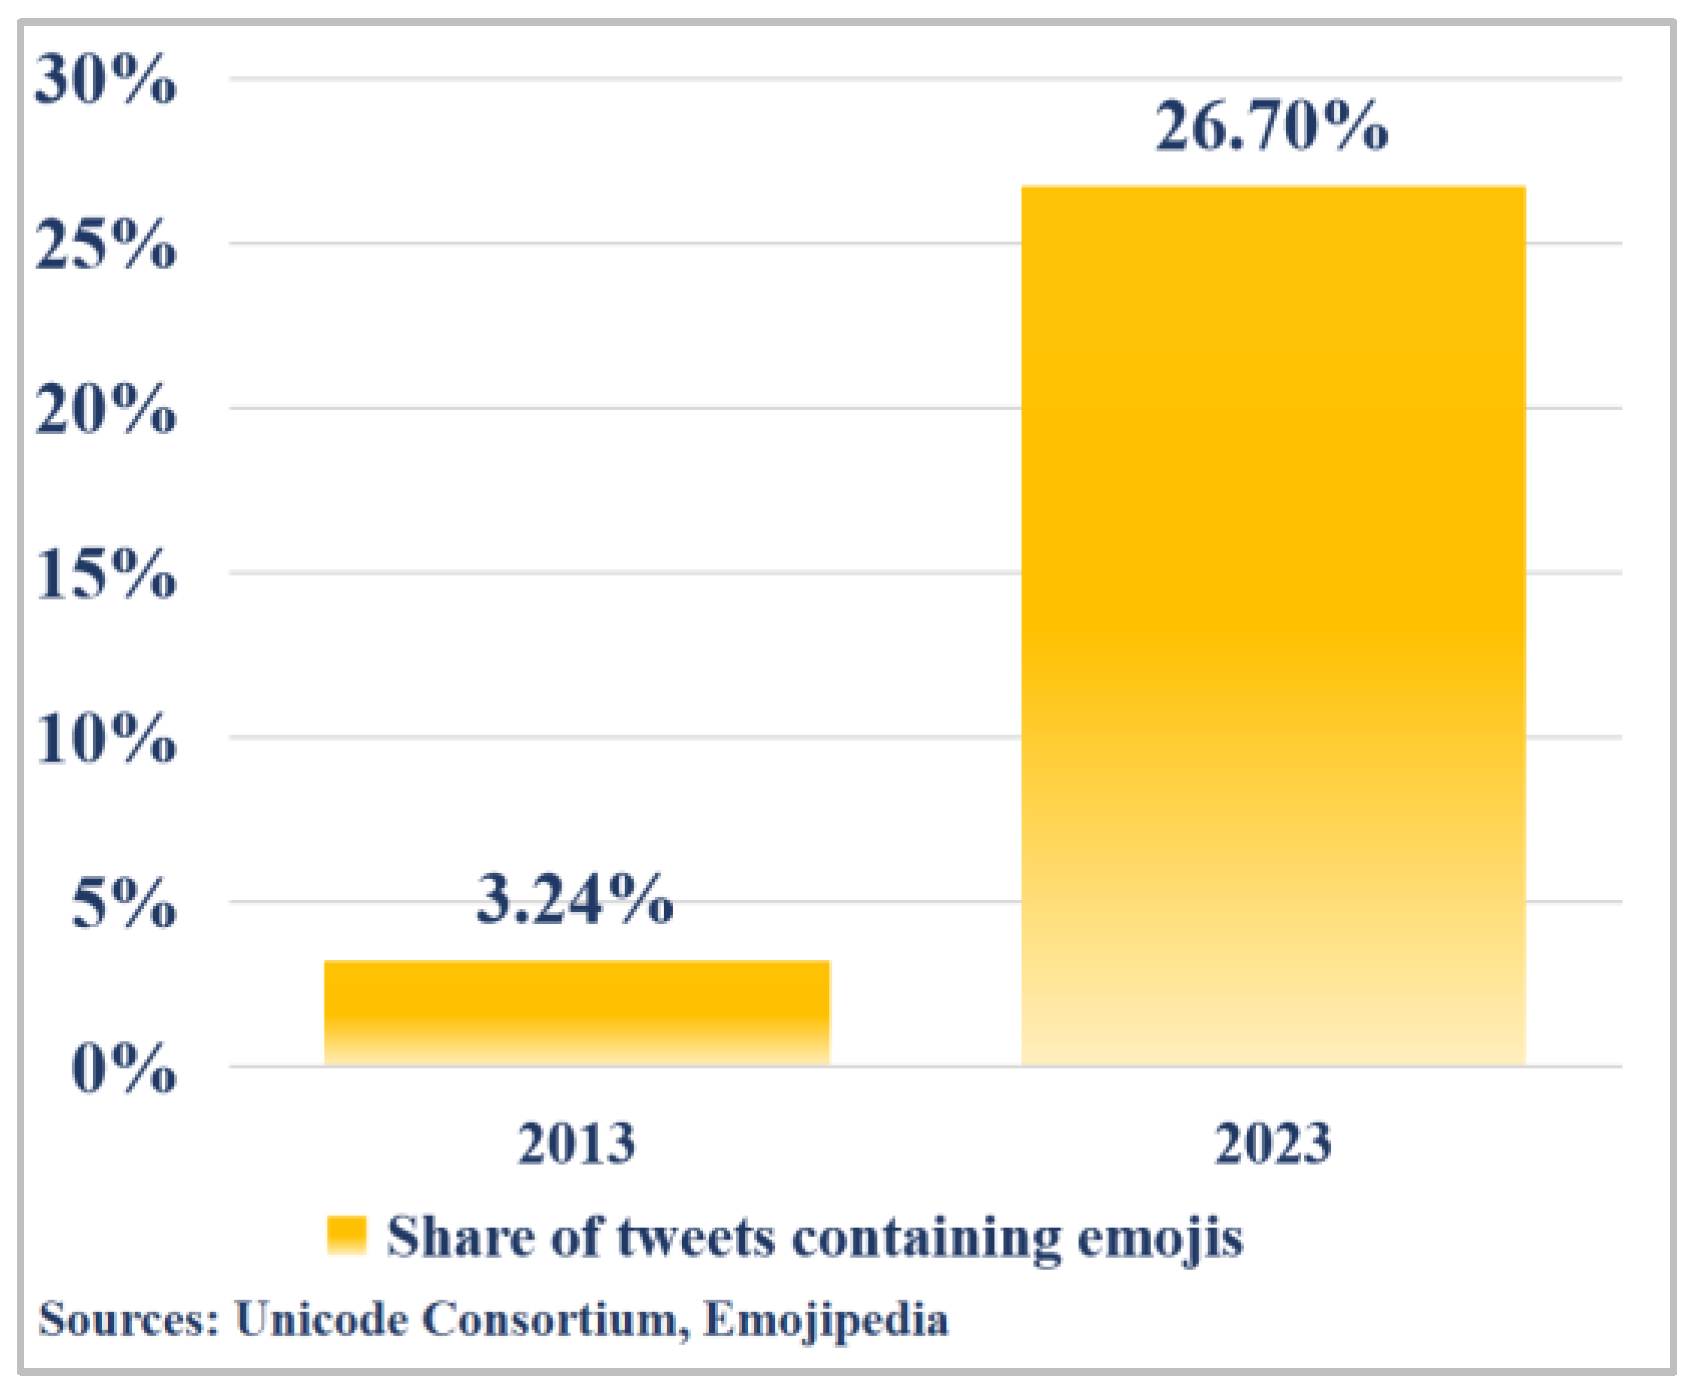
- Share of Posts on Twitter Containing Emojis Worldwide in July 2013 and March 2023. Available online: https://www.statista.com/statistics/1399380/tweets-containing-emojis/ (accessed on 2 July 2023).
- In 2025, Global Emoji Count Could Grow to 3790. Available online: https://www.statista.com/chart/17275/number-of-emojis-from-1995-bis-2019/ (accessed on 17 July 2024).
- Sivanesh, S.; Kavin, K.; Hassan, A.A. Frustrate Twitter from automation: How far a user can be trusted? In Proceedings of the 2013 International Conference on Human Computer Interactions (ICHCI), Chennai, India, 23–24 August 2013; pp. 1–5. [Google Scholar]
- Kantepe, M.; Ganiz, M.C. Preprocessing framework for Twitter bot detection. In Proceedings of the 2017 International Conference on Computer Science and Engineering (UBMK), Antalya, Turkey, 5–8 October 2017; pp. 630–634. [Google Scholar]
- Sayyadiharikandeh, M.; Varol, O.; Kai-Cheng, Y.; Flammini, A.; Menczer, F. Detection of Novel Social Bots by Ensembles of Specialized Classifiers. arXiv 2020. [Google Scholar] [CrossRef]
- Grimme, C.; Preuss, M.; Adam, L.; Trautmann, H. Social Bots: Human-Like by Means of Human Control? Big Data 2017, 5, 279–293. [Google Scholar] [CrossRef]
- Grimme, C.; Assenmacher, D.; Adam, L. Changing Perspectives: Is It Sufficient to Detect Social Bots? In Proceedings of the Social Computing and Social Media, Las Vegas, NV, USA, 15–20 July 2018; Meiselwitz, G., Ed.; Springer International Publishing AG: Cham, Switzerland, 2018; Volume 10913, pp. 445–461. [Google Scholar]
- Xin, R.; Zhenyu, W.; Haining, W.; Jajodia, S. Profiling Online Social Behaviors for Compromised Account Detection. IEEE Trans. Inf. Forensics Secur. 2016, 11, 176–187. [Google Scholar] [CrossRef]
- Amato, F.; Castiglione, A.; De Santo, A.; Moscato, V.; Picariello, A.; Persia, F.; Sperlí, G. Recognizing human behaviours in online social networks. Comput. Secur. 2018, 74, 355–370. [Google Scholar] [CrossRef]
- Cresci, S.; Di Pietro, R.; Petrocchi, M.; Spognardi, A.; Tesconi, M. DNA-Inspired Online Behavioral Modeling and Its Application to Spambot Detection. IEEE Intell. Syst. 2016, 31, 58–64. [Google Scholar] [CrossRef]
- Cresci, S.; Pietro, R.D.; Petrocchi, M.; Spognardi, A.; Tesconi, M. Social Fingerprinting: Detection of Spambot Groups Through DNA-Inspired Behavioral Modeling. IEEE Trans. Dependable Secur. Comput. 2018, 15, 561–576. [Google Scholar] [CrossRef]
- Peng, H.; Zhang, J.; Huang, X.; Hao, Z.; Li, A.; Yu, Z.; Yu, P.S. Unsupervised Social Bot Detection via Structural Information Theory. ACM Trans. Inf. Syst. 2024, 42, 1–42. [Google Scholar] [CrossRef]
- Ilias, L.; Roussaki, I. Detecting malicious activity in Twitter using deep learning techniques. Appl. Soft Comput. 2021, 107, 107360. [Google Scholar] [CrossRef]
- Wu, Y.; Fang, Y.; Shang, S.; Wei, L.; Jin, J.; Wang, H. Detecting Social Spammers in Sina Weibo Using Extreme Deep Factorization Machine; Zhang, Y., Wang, H., Zhou, R., Beek, W., Huang, Z., Eds.; Springer International Publishing AG: Cham, Switzerland, 2020; Volume 12342, pp. 170–182. [Google Scholar]
- Wu, Y.; Fang, Y.; Shang, S.; Jin, J.; Wei, L.; Wang, H. A novel framework for detecting social bots with deep neural networks and active learning. Knowl.-Based Syst. 2021, 211, 106525. [Google Scholar] [CrossRef]
- Arin, E.; Kutlu, M. Deep Learning Based Social Bot Detection on Twitter. IEEE Trans. Inf. Forensics Secur. 2023, 18, 1763–1772. [Google Scholar] [CrossRef]
- Fazil, M.; Sah, A.K.; Abulaish, M. DeepSBD: A Deep Neural Network Model With Attention Mechanism for SocialBot Detection. IEEE Trans. Inf. Forensics Secur. 2021, 16, 4211–4223. [Google Scholar] [CrossRef]
- Najari, S.; Salehi, M.; Farahbakhsh, R. GANBOT: A GAN-based framework for social bot detection. Soc. Netw. Anal. Min 2022, 12, 1–11. [Google Scholar] [CrossRef]
- Feng, S.; Wan, H.; Wang, N.; Tan, Z.; Luo, M.; Tsvetkov, Y. What Does the Bot Say? Opportunities and Risks of Large Language Models in Social Media Bot Detection. In Proceedings of the 62nd Annual Meeting of the Association for Computational Linguistics (Volume 1: Long Papers), Bangkok, Thailand, 11–16 August 2024. [Google Scholar]
- Feng, S.; Wan, H.; Wang, N.; Luo, M. BotRGCN: Twitter bot detection with relational graph convolutional networks. In Proceedings of the 2021 IEEE/ACM International Conference on Advances in Social Networks Analysis and Mining, Eindhoven, The Netherlands, 8–11 November 2021; Cuzzocrea, A., Coscia, M., Shu, K., Eds.; ACM: New York, NY, USA, 2021; pp. 236–239. [Google Scholar]
- Feng, S.; Tan, Z.; Li, R.; Luo, M. Heterogeneity-Aware Twitter Bot Detection with Relational Graph Transformers. Proc. AAAI Conf. Artif. Intell. 2022, 36, 3977–3985. [Google Scholar] [CrossRef]
- Li, S.; Yang, J.; Liang, G.; Li, T.; Zhao, K. SybilFlyover: Heterogeneous graph-based fake account detection model on social networks. Knowl.-Based Syst. 2022, 258, 110038. [Google Scholar] [CrossRef]
- Peng, H.; Zhang, Y.; Sun, H.; Bai, X.; Li, Y.; Wang, S. Domain-Aware Federated Social Bot Detection with Multi-Relational Graph Neural Networks. In Proceedings of the 2022 International Joint Conference on Neural Networks (IJCNN), Padua, Italy, 18–23 July 2022; pp. 1–8. [Google Scholar]
- Wang, X.; Wang, K.; Chen, K.; Wang, Z.; Zheng, K. Unsupervised twitter social bot detection using deep contrastive graph clustering. Knowl.-Based Syst. 2024, 293, 111690. [Google Scholar] [CrossRef]
- Wang, B.; Huang, S.; Liang, B.; Tu, G.; Yang, M.; Xu, R. What do they “meme”? A metaphor-aware multi-modal multi-task framework for fine-grained meme understanding. Knowl.-Based Syst. 2024, 294, 111778. [Google Scholar] [CrossRef]
- Ma, X.; Yan, Z.; Li, Y. Social robot detection based on user behavioral representation. Inf. Sci. 2025, 690, 121537. [Google Scholar] [CrossRef]
- Borg, A.; Boldt, M. Using VADER sentiment and SVM for predicting customer response sentiment. Expert Syst. Appl. 2020, 162, 113746. [Google Scholar] [CrossRef]
- Cauteruccio, F.; Kou, Y. Investigating the emotional experiences in eSports spectatorship: The case of League of Legends. Inf. Process. Manag. 2023, 60, 103516. [Google Scholar] [CrossRef]
- Mardjo, A.; Choksuchat, C. HyVADRF: Hybrid VADER-Random Forest and GWO for Bitcoin Tweet Sentiment Analysis. IEEE Access 2022, 10, 101889–101897. [Google Scholar] [CrossRef]
- Schlichtkrull, M.; Kipf, T.N.; Bloem, P.; van den Berg, R.; Titov, I.; Welling, M. Modeling Relational Data with Graph Convolutional Networks; Navigli, R., Gangemi, A., Hollink, L., Vidal, M.-E., Alam, M., Hitzler, P., Tordai, A., Troncy, R., Eds.; Springer International Publishing AG: Cham, Switzerland, 2018; Volume 10843, pp. 593–607. [Google Scholar]
- Feng, S.; Wan, H.; Wang, N.; Li, J.; Luo, M. TwiBot-20: A Comprehensive Twitter Bot Detection Benchmark; ACM: New York, NY, USA, 2021; pp. 4485–4494. [Google Scholar]
- Cresci, S.; Di Pietro, R.; Petrocchi, M.; Spognardi, A.; Tesconi, M. Fame for sale: Efficient detection of fake Twitter followers. Decis. Support Syst. 2015, 80, 56–71. [Google Scholar] [CrossRef]
- Lipton, Z.C.; Elkan, C.; Narayanaswamy, B. Thresholding Classifiers to Maximize F1 Score. arXiv 2014. [Google Scholar] [CrossRef]
- Chicco, D.; Jurman, G. The advantages of the Matthews correlation coefficient (MCC) over F1 score and accuracy in binary classification evaluation. BMC Genom. 2020, 21, 6. [Google Scholar] [CrossRef]
- Lee, K.; Eoff, B.D.; Caverlee, J. Seven Months with the Devils: A Long-Term Study of Content Polluters on Twitter. In Proceedings of the 5th International AAAI Conference on Weblogs and Social Media, ICWSM 2011, Barcelona, Spain, 17–21 July 2011; AAAI Press: Barcelona, Spain, 2011; pp. 185–192. [Google Scholar]
- Yang, K.-C.; Varol, O.; Hui, P.-M.; Menczer, F. Scalable and Generalizable Social Bot Detection through Data Selection. Proc. AAAI Conf. Artif. Intell. 2020, 34, 1096–1103. [Google Scholar] [CrossRef]
- Kudugunta, S.; Ferrara, E. Deep neural networks for bot detection. Inf. Sci. 2018, 467, 312–322. [Google Scholar] [CrossRef]
- Wei, F.; Nguyen, U.T. Twitter Bot Detection Using Bidirectional Long Short-Term Memory Neural Networks and Word Embeddings. In Proceedings of the 2019 First IEEE International Conference on Trust, Privacy and Security in Intelligent Systems and Applications (TPS-ISA), Los Angeles, CA, USA, 12–14 December 2019; pp. 101–109. [Google Scholar]
- Miller, Z.; Dickinson, B.; Deitrick, W.; Hu, W.; Wang, A.H. Twitter spammer detection using data stream clustering. Inf. Sci. 2014, 260, 64–73. [Google Scholar] [CrossRef]
- Alhosseini, S.A.; Najafi, P.; Tareaf, R.B.; Meinel, C. Detect me if you can: Spam bot detection using inductive representation learning. In Proceedings of the 2019 World Wide Web Conference, WWW 2019, San Francisco, CA, USA, 13–17 May 2019; Association for Computing Machinery: San Francisco, CA, USA, 2019; pp. 148–153. [Google Scholar]
- Feng, S.; Wan, H.; Wang, N.; Li, J.; Luo, M. SATAR: A Self-Supervised Approach to Twitter Account Representation Learning and Its Application in Bot Detection. In Proceedings of the 30th ACM International Conference on Information & Knowledge Management, New York, NY, USA, 1–5 November 2021; ACM: New York, NY, USA, 2021; pp. 3808–3817. [Google Scholar]
- Mazza, M.; Cresci, S.; Avvenuti, M.; Quattrociocchi, W.; Tesconi, M. RTbust: Exploiting Temporal Patterns for Botnet Detection on Twitter. In Proceedings of the 10th ACM Conference on Web Science, New York, NY, USA, 27–30 May 2018; ACM: New York, NY, USA, 2019; pp. 183–192. [Google Scholar]
- Shi, S.; Qiao, K.; Yang, J.; Song, B.; Chen, J.; Yan, B. RF-GNN: Random Forest Boosted Graph Neural Network for Social Bot Detection. arXiv 2023. [Google Scholar] [CrossRef]
- Hayawi, K.; Mathew, S.; Venugopal, N.; Masud, M.M.; Ho, P.-H. DeeProBot: A hybrid deep neural network model for social bot detection based on user profile data. Soc. Netw. Anal. Min. 2022, 12, 43. [Google Scholar] [CrossRef]
- Khosla, P.; Teterwak, P.; Wang, C.; Sarna, A.; Tian, Y.; Isola, P.; Maschinot, A.; Liu, C.; Krishnan, D. Supervised Contrastive Learning. arXiv 2020. [Google Scholar] [CrossRef]


| Emoji | Text Mapping | Emoji | Text Mapping |
|---|---|---|---|
 | 1st_Place_Medal |  | Face_Hand over Mouth |
 | OK_Hand |  | Face_Tears of Joy |
 | P_Button |  | Face_Teeth Bared |
 | Sparkling_Heart |  | Winking Face_Tongue |
 | Thumbs_Up |  | Crying Face |
| Feature Type | Feature Description |
|---|---|
| Emoji_avg_per_tweet | Number of emojis in each tweet |
| Emoji_variety_per_tweet | Variety of emojis in each tweet |
| Top_emoji_percentage | Proportion of the most commonly used emoji |
| URL_Usage_percentage | Proportion of tweets containing URLs |
| Followers_count | Number of account fans |
| Friends_count | Number of accounts concerned |
| Favourites_count | Number of likes |
| Statuses_counts | Number of tweets published by users |
| Active_days | Active days |
| Screen_name_length | Length of account name |
| Feature Type | Feature Description |
|---|---|
| protected | Whether the account is set as private |
| geo_enabled | Enable geographic location or not |
| verified | Whether the account is verified |
| contributors_enabled | Allow account sharing or not |
| is_translator | Translator or not |
| is_translation_enabled | Translation or not |
| profile_background_tile | Whether the background is tiled |
| profile_use_background_image | Whether the user uploads the background image |
| has_extended_profile | Whether there are extension files |
| default_profile | Whether to use the default theme background |
| default_profile_image | Is the default profile image being used |
| Selected Tweets | Accuracy | F1-Score | MCC |
|---|---|---|---|
| Original tweets | 0.8648 | 0.8793 | 0.7282 |
| Emoji-to-text mapped tweet | 0.8694 | 0.8839 | 0.7388 |
| Emoji-to-text mapped and Coherence-improved tweet by Qwen-2.5 | 0.8731 | 0.8866 | 0.7429 |
| Emoji-to-text mapped and Coherence-improved tweet by GPT-4 | 0.8746 | 0.8883 | 0.7468 |
| Selected Features | Accuracy | F1-Score | MCC |
|---|---|---|---|
| No sentiment feature | 0.8639 | 0.8783 | 0.7263 |
| Basic sentiment features | 0.8664 | 0.8816 | 0.7322 |
| Advanced sentiment features | 0.8746 | 0.8883 | 0.7468 |
| GNN Architecture | Accuracy | F1-Score | MCC |
|---|---|---|---|
| GAT | 0.7413 | 0.7544 | 0.4824 |
| GCN | 0.7473 | 0.7666 | 0.4910 |
| Neural Network | 0.8605 | 0.8762 | 0.7200 |
| ESA-BotRGCN | 0.8746 | 0.8883 | 0.7468 |
| Experiment Configuration | Accuracy | F1-Score | MCC |
|---|---|---|---|
| No-attention mechanism | 0.8564 | 0.8721 | 0.7147 |
| Full-attention mechanism | 0.8746 | 0.8883 | 0.7468 |
| Comparison Group | t-Value | p-Value | Significance |
|---|---|---|---|
| Emoji Only vs. Full ESA-BotRGCN | −8.09 | 0.000045 | Significant |
| Sentiment Only vs. Full ESA-BotRGCN | −9.25 | 0.000099 | Significant |
| No Sentiment and Emoji vs. Full ESA-BotRGCN | −16.8 | 0.00000 | Extremely significant |
| Method | Accuracy | F1-Score | MCC |
|---|---|---|---|
| Lee et al. [51] | 0.7456 | 0.7823 | 0.4879 |
| Yang et al. [52] | 0.8191 | 0.8546 | 0.6643 |
| Kudugunta et al. [53] | 0.8174 | 0.7517 | 0.6710 |
| Wei et al. [54] | 0.7126 | 0.7533 | 0.4193 |
| Miller et al. [55] | 0.4801 | 0.6266 | −0.1372 |
| Cresci et al. [27] | 0.4793 | 0.1072 | 0.0839 |
| Botometer [7] | 0.5584 | 0.4892 | 0.1558 |
| Alhosseini et al. [56] | 0.6813 | 0.7318 | 0.3543 |
| SATAR [57] | 0.8412 | 0.8642 | 0.6863 |
| BotRGCN [36] | 0.8462 | 0.8707 | 0.7021 |
| ESA-BotRGCN | 0.8746 | 0.8883 | 0.7468 |
| Method | Accuracy | F1-Score | MCC |
|---|---|---|---|
| Botometer [7] | 0.7259 | 0.7122 | 0.3159 |
| Mazza et al. [58] | 0.7200 | 0.7074 | 0.6868 |
| RF-GNN [59] | 0.9574 | 0.9547 | 0.9122 |
| BotRGCN [36] | 0.9452 | 0.9430 | 0.8927 |
| DeeProBot [60] | 0.8427 | 0.8559 | 0.8263 |
| SCL [61] | 0.8645 | 0.8868 | 0.8477 |
| BotDCGC [40] | 0.9334 | 0.9275 | 0.8861 |
| ESA-BotRGCN | 0.9725 | 0.9783 | 0.9326 |
Disclaimer/Publisher’s Note: The statements, opinions and data contained in all publications are solely those of the individual author(s) and contributor(s) and not of MDPI and/or the editor(s). MDPI and/or the editor(s) disclaim responsibility for any injury to people or property resulting from any ideas, methods, instructions or products referred to in the content. |
© 2025 by the authors. Licensee MDPI, Basel, Switzerland. This article is an open access article distributed under the terms and conditions of the Creative Commons Attribution (CC BY) license (https://creativecommons.org/licenses/by/4.0/).
Share and Cite
Zeng, K.; Li, Z.; Wang, X. Emoji-Driven Sentiment Analysis for Social Bot Detection with Relational Graph Convolutional Networks. Sensors 2025, 25, 4179. https://doi.org/10.3390/s25134179
Zeng K, Li Z, Wang X. Emoji-Driven Sentiment Analysis for Social Bot Detection with Relational Graph Convolutional Networks. Sensors. 2025; 25(13):4179. https://doi.org/10.3390/s25134179
Chicago/Turabian StyleZeng, Kaqian, Zhao Li, and Xiujuan Wang. 2025. "Emoji-Driven Sentiment Analysis for Social Bot Detection with Relational Graph Convolutional Networks" Sensors 25, no. 13: 4179. https://doi.org/10.3390/s25134179
APA StyleZeng, K., Li, Z., & Wang, X. (2025). Emoji-Driven Sentiment Analysis for Social Bot Detection with Relational Graph Convolutional Networks. Sensors, 25(13), 4179. https://doi.org/10.3390/s25134179