1. Introduction
In recent years, unmanned aerial vehicles (UAVs), commonly known as drones, have witnessed a significant surge in use. Driven by their proven efficiency and precision in accomplishing border surveillance and rescue missions, they have been adopted for civilian applications in numerous fields, including agriculture, delivery services, wildlife tracking, the film industry, and beyond [
1]. Currently, the size of the unmanned aerial vehicle market is estimated at USD 12.39 billion in 2025, and it is expected to reach USD 20.72 billion by 2030 [
2]. These devices are characterized by a diverse set of properties depending on their specific applications, including size, velocity, mobility models, computational capabilities, and battery capacity. Meanwhile, some models are equipped with complementary components, such as an inertial measurement unit (IMU), visual odometry, and optical flow sensors, to expand their functions.
The growing reliance on UAVs is accompanied by significant security and privacy concerns. These systems are highly vulnerable to a wide range of cyberattacks that threaten their integrity, confidentiality, and availability. A systematic classification of cyberattacks against UAVs was presented at four different levels [
3]. At the software level, the threats include malicious software and operating system attacks. The hardware level is targeted by hijacking attempts and physical collisions. The communication level faces risks such as denial-of-service (DoS) attacks and node misbehavior. Finally, at the sensor level, UAVs are susceptible to false sensor data injection and GPS jamming. These attacks can severely compromise UAV operations, leading to mission failures, data breaches, and even physical damage.
Our study focuses on sensor-based vulnerabilities, specifically those threatening UAVs’ navigational system, which may be leveraged into hardware-level threats. The complexity of managing UAV flights in dynamic environments, such as in cyberattack situations, requires control systems to continuously interact with multiple sensors over time for the purpose of detecting and isolating raised disturbances. This introduces nonlinearity challenges in modeling motion behavior based on control inputs. Therefore, essential security actions involve learning-based and state-estimation-based methods. In [
4], the authors designed a neural network model empowered with an extended Kalman filter for the online detection and isolation of a cyberattack that affects UAVs’ navigation system, specifically involving the injection of false data (FDI) into the inertial measurement unit (IMU) sensor. Ref. [
5] introduced a real-time health monitoring framework to detect potential anomalies in the aircraft engine system. Their approach consists initially of applying kernel principal component analysis (KPCA) to extract highly correlated flight variables. This step is critical in reducing computational overhead and preventing overfitting. Then, they trained a support vector regression (SVR) model that predicts flight behavior, which was compared to healthy flights using statistical bounds to identify abnormalities. The work of [
6] addressed the challenges of ensuring resilient formation control in the context of drones, where communication may be lost or compromised in adversarial environments. They proposed an approach that integrates Graph Attention Networks (GANs) with deep reinforcement learning (DRL) and leverages neighboring nodes to deceive DoS attacks. The researchers in [
7] proposed a state-estimation-based method for the real-time detection and isolation of three main types of cyberattacks, namely random attacks, false data injection attacks, and DoS attacks. Their approach is scalable to any nonlinear aerial system.
In addition, UAVs typically rely on the GPS as their primary navigation system, continuously tracking signals from at least four satellites to accurately determine their precise spatial position at any given time. However, in some cases, these signals are affected by the ionosphere and environmental conditions, producing signal noise or, in more serious scenarios, complete signal loss. In addition, civilian GPS signals remain unsecured and could easily be intercepted and retransmitted. Third-party actors with bad intentions can build receiver–spoofer devices using only commonly available low-cost components to deceive GPS receivers. As a result, this might cause instability in determining the real-time position of GPS assets in general, and disrupt UAVs’ aerial navigation in particular.
Therefore, many cybersecurity researchers showed interest in implementing effective countermeasures to deal with the danger posed by such attacks. The study presented in [
8] conducted a systematic review of the literature exploring the existing research dimensions on GPS spoofing attacks in the context of UAVs and flying ad hoc networks. They investigated the existing techniques for conducting different types of GPS spoofing and jamming mechanisms, their impact, and the potential to leverage these attacks as a defense concept, such as preventing civilian UAVs from accessing forbidden areas. Additionally, they explored the existing defense strategies proposed in the literature against these attacks.
Since our interest lies in security precautions and defense countermeasures against GPS spoofing attacks, we proceed in this work to follow the template established in [
8] to detect, mitigate, and prevent this threat. The existing countermeasures can be divided into several categories. Onboard device techniques consist of equipping UAVs with additional sensors to assist navigation and help to detect attacks. GPS signal processing techniques investigate anomalies in the characteristics of signals, such as signal strength and angle of arrival. Cryptography methods aim at establishing secure communication links between UAV nodes, satellites, and ground control stations to protect the integrity of signals. Game theory methods also contribute to the detection of GPS spoof attacks by modeling the interactions between targets and attackers as a strategic game, ultimately reaching an equilibrium, such as in the Stackelberg game. On the other hand, the relevance recently demonstrated by machine learning in various fields, such as healthcare [
9], agriculture [
10], and intelligent transportation systems [
11], has attracted considerable attention from cybersecurity researchers [
12,
13,
14]. This is due to its contribution to simplifying tasks, improving decision making, and enhancing overall quality of life, in addition to its ability to achieve high precision and automatically adapt to novel conditions. Therefore, numerous studies showed interest in designing machine learning and deep learning models to face GPS spoofing attacks threatening UAVs. They also provided datasets with different formats, demonstrating the impact of GPS spoofing on aerial navigation systems and helping cybersecurity researchers to combat this threat. The SatUAV dataset [
15] includes a large amount of high-resolution aerial photography captured from 13 cities around the world, where 605 realistic scene photos with heterogeneous ground features were taken using a real UAV, while an additional 362 photos were added to the dataset from the senseFly website. Log file GPS spoofing datasets [
16,
17] comprise high-dimensional sensor readings, primarily from GPS and IMU modules, collected during UAV flights in both benign and spoofed scenarios. They often require the implementation of advanced feature selection techniques due to their complexity. The OpenSky Network dataset [
18] contains samples of real-world Air Traffic Surveillance (ATS) data, distributed all over the globe. Another dataset provided by [
19] involves the characteristics of GPS signals extracted from an eight-channel GPS receiver mounted on a real UAV while performing real missions. It also contains three types of GPS spoofing attacks simulated using MATLAB.
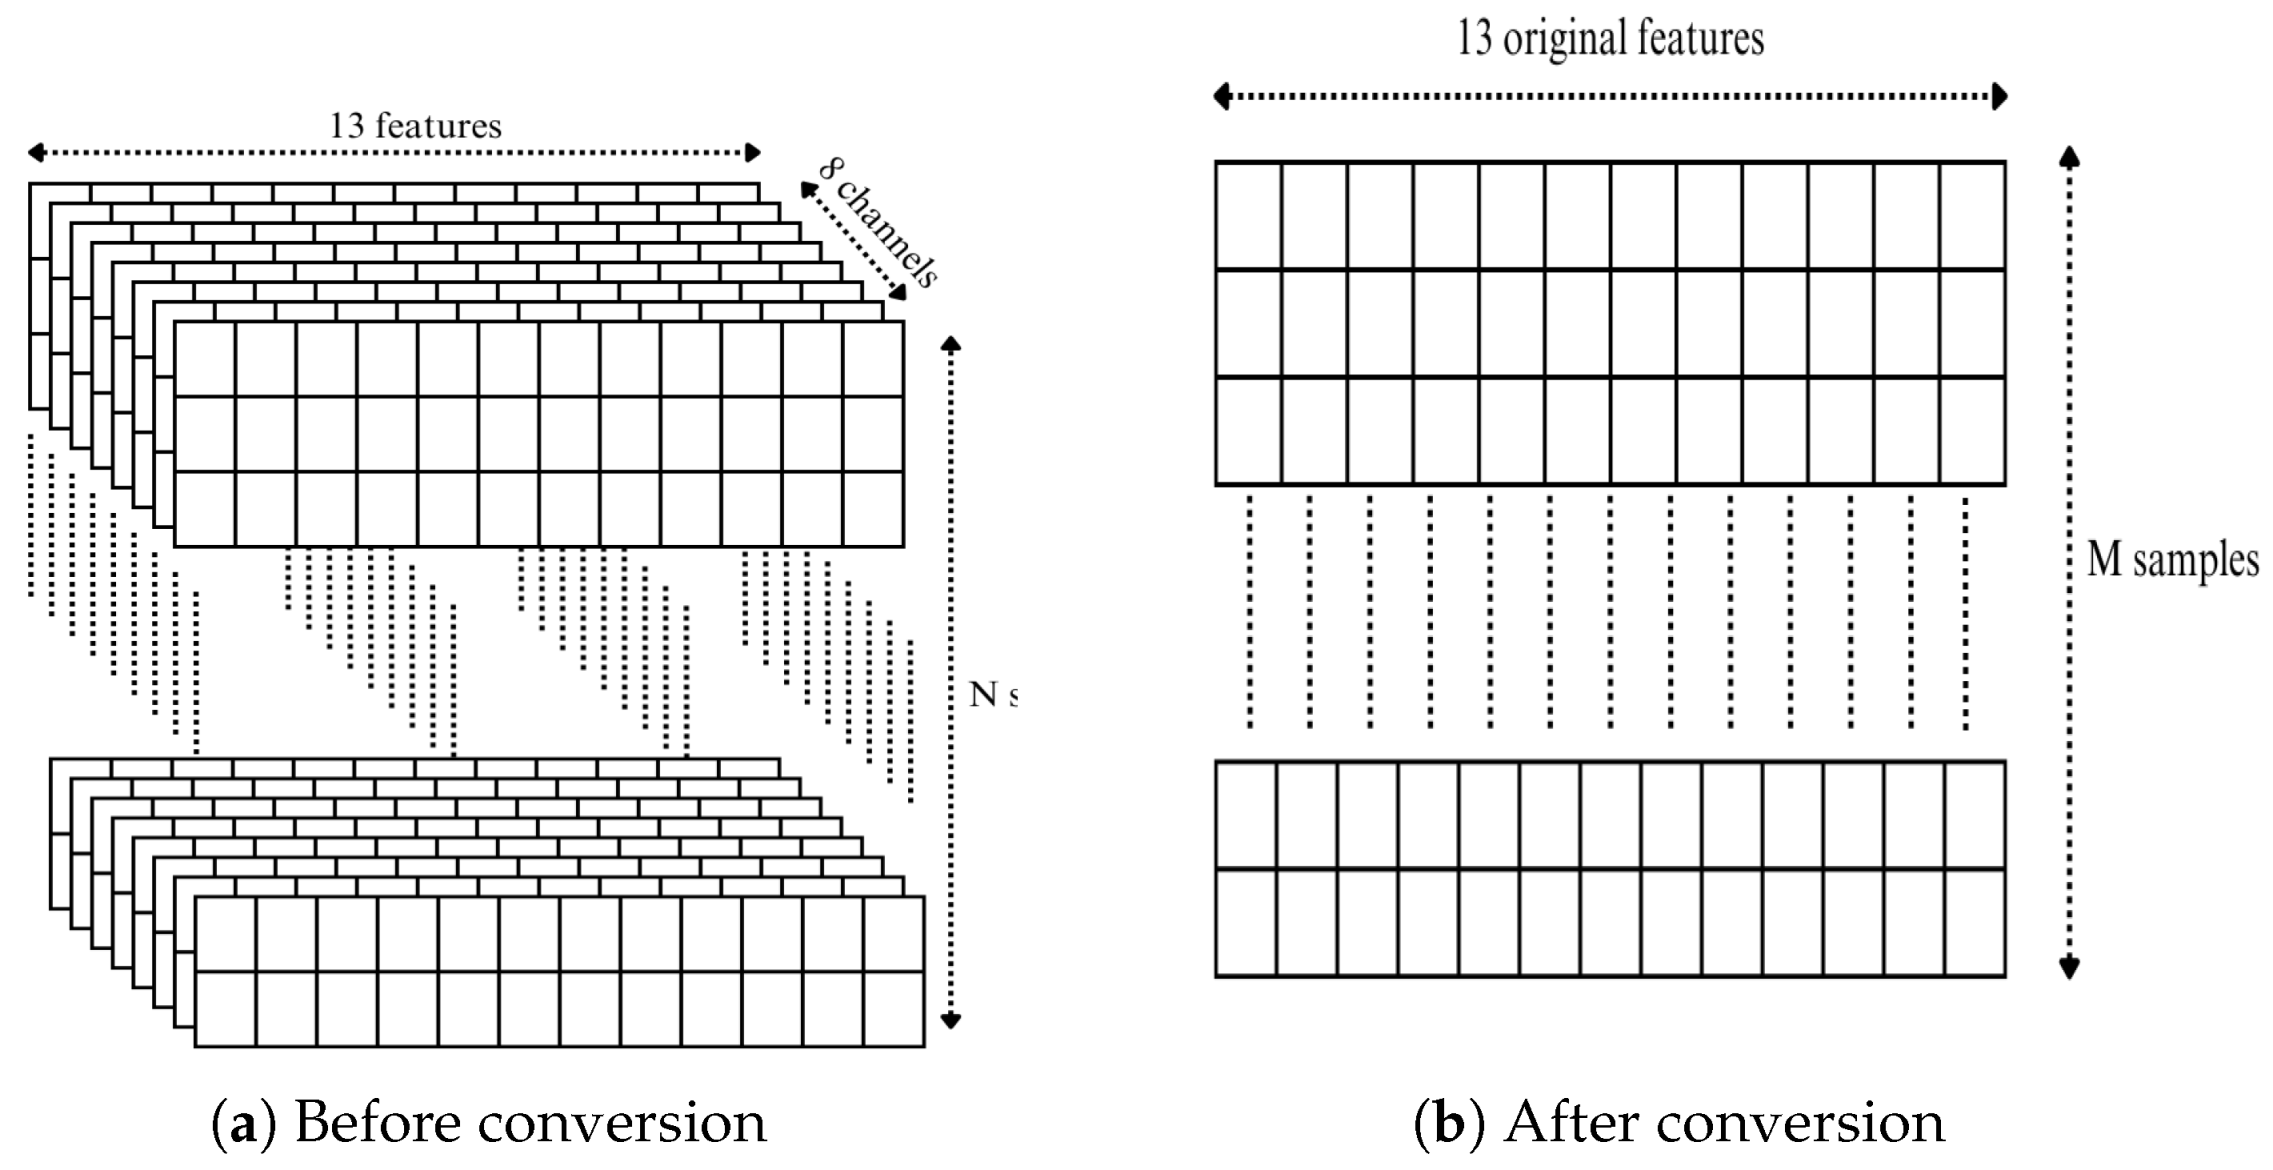
In this paper, we propose a supervised ML-based detection system to identify GPS spoofing attacks and classify each attack type according to its sophistication level. Tree-based machine learning algorithms are employed, namely a basic decision tree model, a bagging ensemble model known as random forest, and a boosting ensemble model named extreme gradient boosting. The dataset used contains 13 features collected from a multi-channel GPS receiver mounted on an autonomous vehicle through multiple missions. As a preprocessing step, our work involves handling non-stationary features and converting the original dataset dimensions into a more suitable format for our models. We conduct a comparison between the proposed classifiers and the existing work in terms of the accuracy, precision, recall, and F1-score metrics.
The remainder of this work is structured as follows: In
Section 2, we discuss previous works that address the problem. In
Section 3, we provide the methodology used to design our machine learning classifiers.
Section 4 presents the obtained results. Finally,
Section 5 concludes the paper.
4. Machine Learning Classifiers
We encountered in this study several challenges related to the dataset, including class imbalance, non-stationary features, varying numerical scales, and the multiclass nature of the problem. Unlike distance-based models such as k-Nearest Neighbor (k-NN), Support Vector Machines (SVMs), and neural networks, which are highly sensitive to feature scales and require standardization or normalization, decision tree-based models are able to natively handle features with varying ranges without rescaling. In addition, normalizing GPS signal data can sometimes disrupt the intrinsic relationships between features. For instance, , which reflects signal strength, directly affects the accuracy of pseudorange measurements.
To handle class imbalance, Ref. [
35] applied mode imputation by replacing missing values with the most frequent occurrence. However, this method risks over-representing certain values and introducing bias. Therefore, tree-based machine learning algorithms offer built-in mechanisms to highlight informative features through feature importance measures and incorporate class weighting to address class imbalance. This strategy preserves the original feature scales and their relationships while maintaining the integrity of the data.
In our study, to counteract the threat of GPS spoofing attacks, we investigate tree-based models, namely Decision Tree, Random Forest, and XGBoost, implemented using the commands from sklearn.tree import DecisionTreeClassifier, from sklearn.ensemble import RandomForestClassifier, and from xgboost import XGBClassifier, of the Python library Scikit-learn [
38].
4.1. Decision Tree
Decision trees were initially introduced by [
39]. They are non-parametric supervised machine learning algorithms used for both classification and regression tasks. They follow a hierarchical tree-based structure composed of a root node, internal nodes, branches, and leaf nodes. The mechanism of decision trees consists of generating a set of decision rules derived from features to estimate the target variable. Therefore, internal nodes apply criteria such as Gini impurity or entropy to determine the optimal feature split and obtain the best possible classification. However, this approach still suffers from overfitting in some instances.
In this study, we design a decision tree model employing Gini impurity to measure the quality of splits. The maximum tree depth is not specified; in this case, the tree will grow until all the leaves are pure. We set the minimum number of samples required to split an internal node to 2. Additionally, all the available features are considered during the training process to maximize the model’s learning capacity.
4.2. Random Forest
Random forest [
40] is an ensemble learning algorithm that constructs multiple decision trees, where each tree is trained on a random sample of the data considering random feature selection at each split. The final predictions are made using majority voting and averaging for the classification and regression tasks, respectively. This approach helps to avoid overfitting issues faced in single decision trees. Moreover, random forest provides feature importance scores; this capability is particularly valuable for understanding which GPS signal features contribute most to detect spoofing attacks. Nevertheless, employing a large number of individual decision trees within the ensemble can result in significant computational overhead.
Our random forest model comprises 100 decision trees, with bootstrap sampling to ensure diverse subsets for training each tree. As the previous explained decision tree, Gini impurity is employed, and the maximum depth of trees is not set. However, the square root of the total number of features is applied to reduce correlation between trees.
4.3. Extreme Gradient Boosting
Extreme gradient boosting [
41] is an advanced ensemble learning algorithm that builds gradient descent decision trees sequentially. For each iteration, it corrects shortcomings from previous models until reaching a final strong learner. In addition, it leverages parallel processing to accelerate computations, making it significantly faster. Furthermore, XGBoost integrates both L1 and L2 regularization to enhance generalization and mitigate overfitting. On the other hand, it may be memory-expensive when dealing with very large datasets or a high number of boosting cycles.
We construct an XGBoost model employing the softmax objective function to address the multiclass classification task. The number of classes is set to four. The model is configured with a default learning rate of 0.3 and 100 trees within the boosting process. In addition, the maximum depth is left unconstrained.
Table 8 summarizes the hyperparameters of the three models used in our experiments. It provides information on the configurations that led to the respective performances.
5. Evaluation and Results
In this section, we conduct an in-depth evaluation of our GPS spoofing attack detection system using datasets from the three missions. Initially, we assess the models’ performance on each mission independently using the Monte Carlo cross-validation technique, which involves running 50 randomized train–test splits.
For each case, the dataset is randomly divided into 70% for training and 30% for testing, taking into account variations in dataset size and class distribution. A feature importance analysis is also conducted on each dataset; this step allows identifying the most significant variables and discarding irrelevant features, consequently reducing the training overhead. However, it is important to highlight that stratified sampling is employed during the train–test split, ensuring a more balanced representation of each class in both subsets. Subsequently, all mission records are merged to create a unified dataset, enabling further evaluation of the model’s generalization capability. Finally, we compare the performance of our proposed models before and after feature selection.
The evaluation metrics used to measure the performance of our models are described as follows:
where C is the total number of classes. Accuracy measures the proportion of correct predictions made by the model throughout the dataset. Precision measures the correctness of positive predictions. Recall indicates how well the model finds all positive predictions. F1-score measures the harmonic mean of precision and recall. Since our contribution involves classifying four categories of GPS signals, we use macro-averaging to compute the evaluation metrics. This method treats all classes equally, including minorities, which is suitable for class-imbalanced datasets. Therefore, each metric is calculated independently for all classes, and then the results are averaged. Using these metrics is essential to confirm that the models do not overfit and maintain consistent performance across different training and testing sets in multiclass classification tasks.
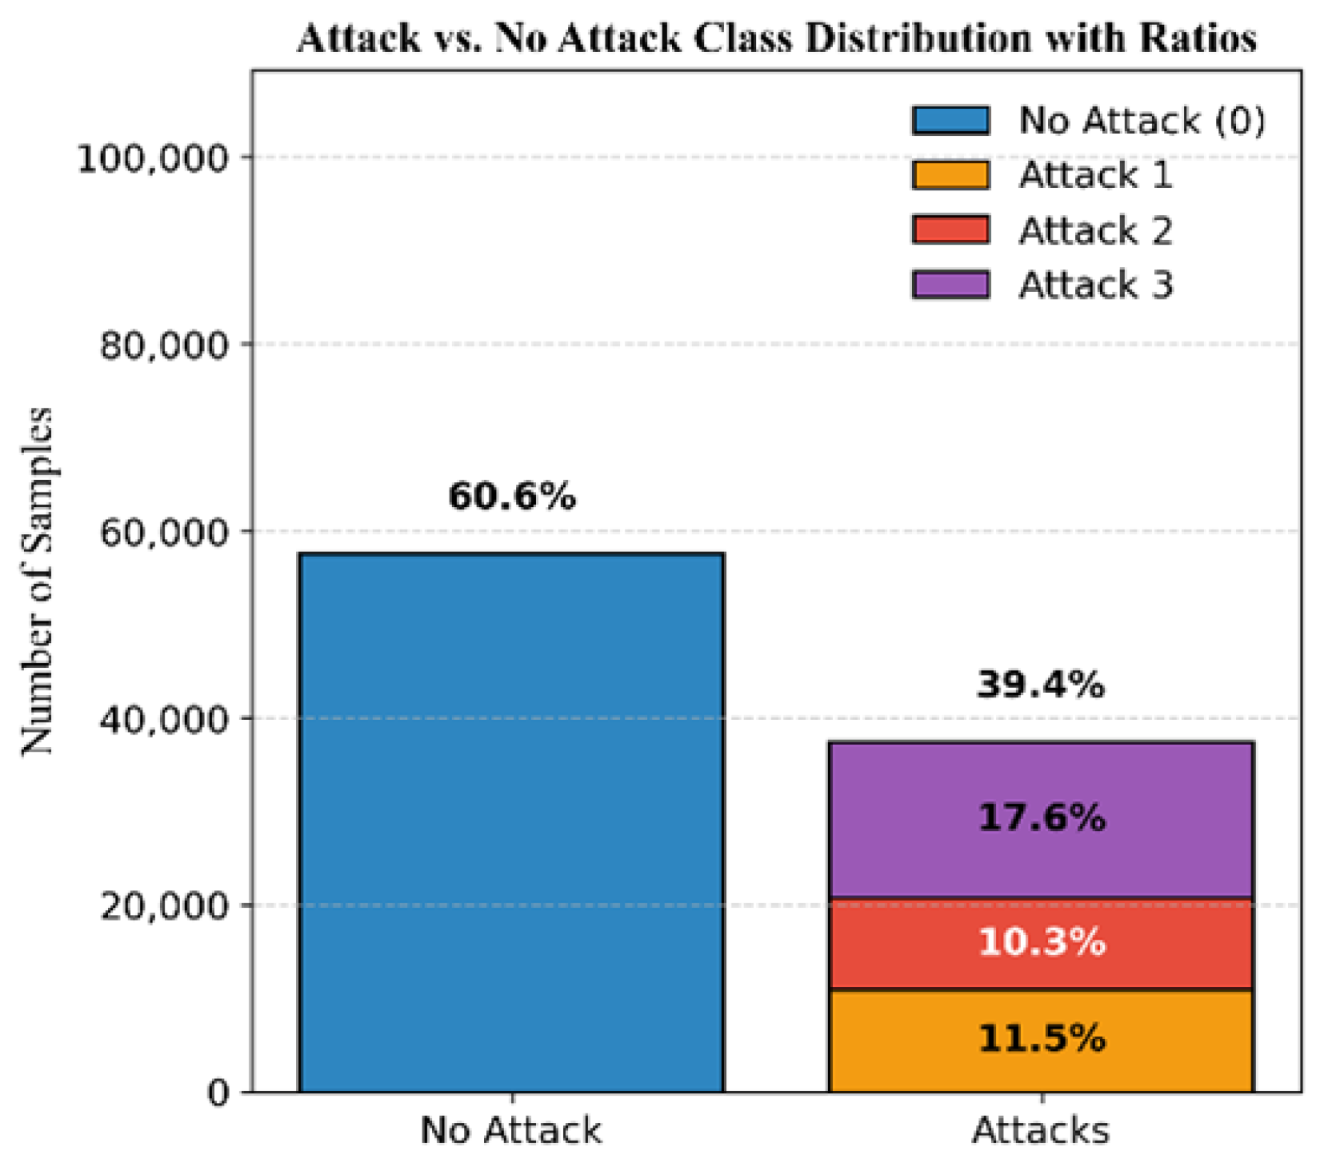
5.1. Mission 1
The dataset for Mission 1, as illustrated in
Figure 3, consists of 60.6% authentic signals and 39.4% attack signals. The attack samples are further classified into 11.5% simplistic attacks, 10.3% intermediate attacks, and 17.6% sophisticated attacks.
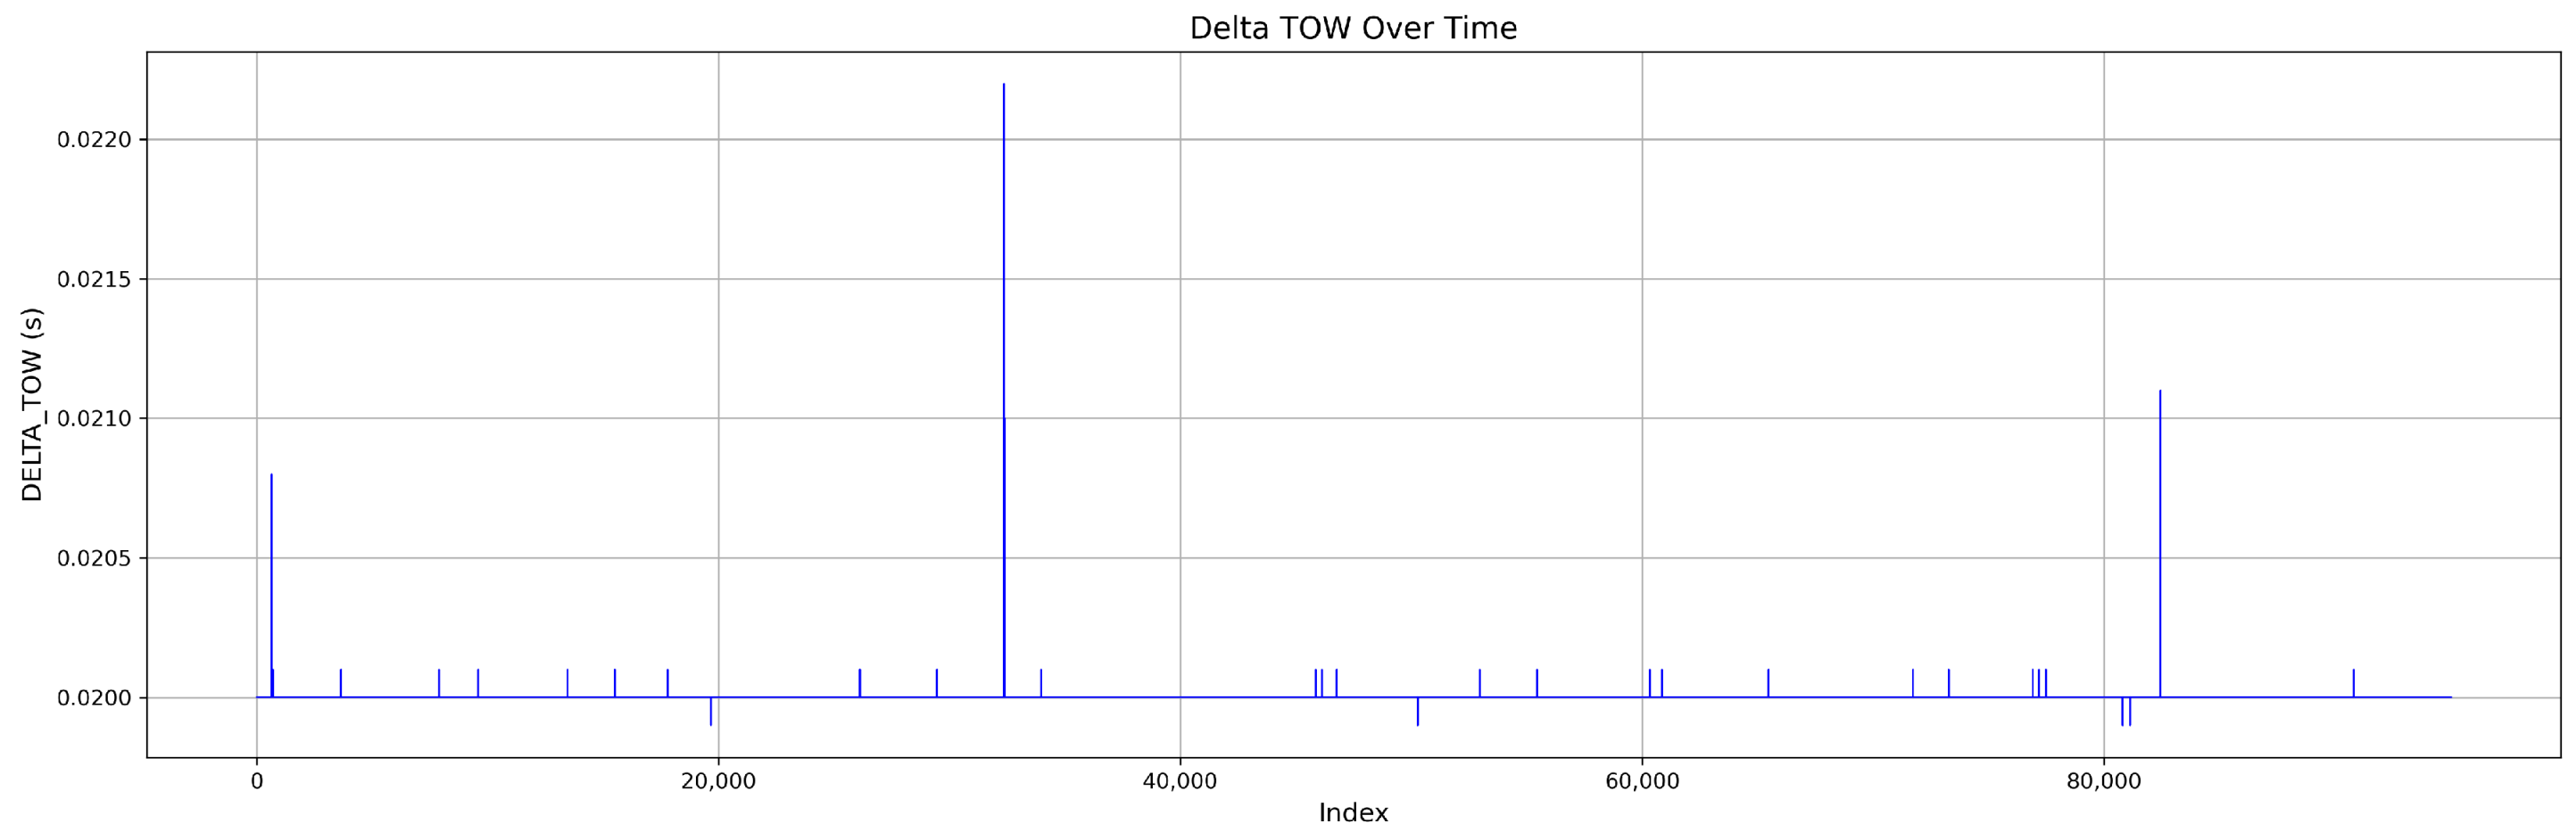
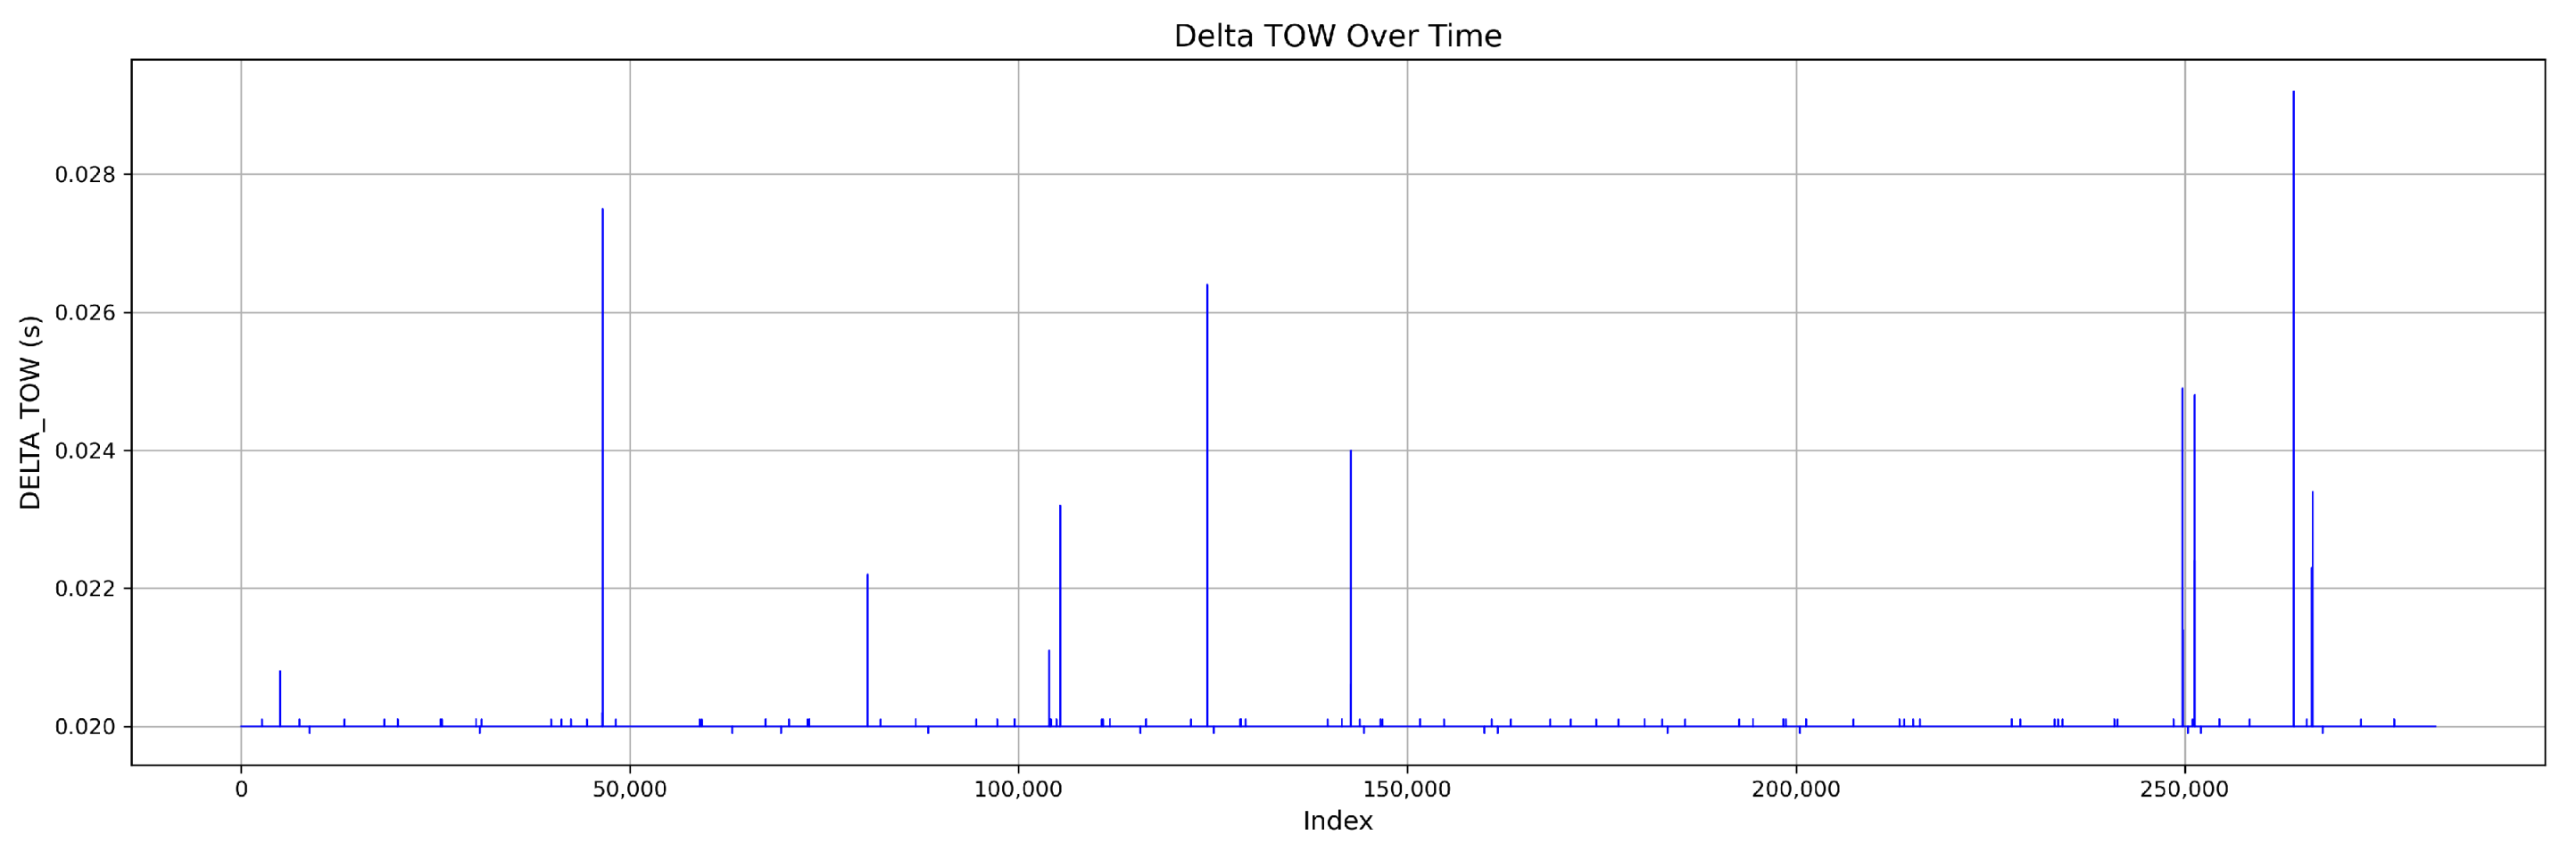
Figure 4 shows the DELTA_TOW curve over time.
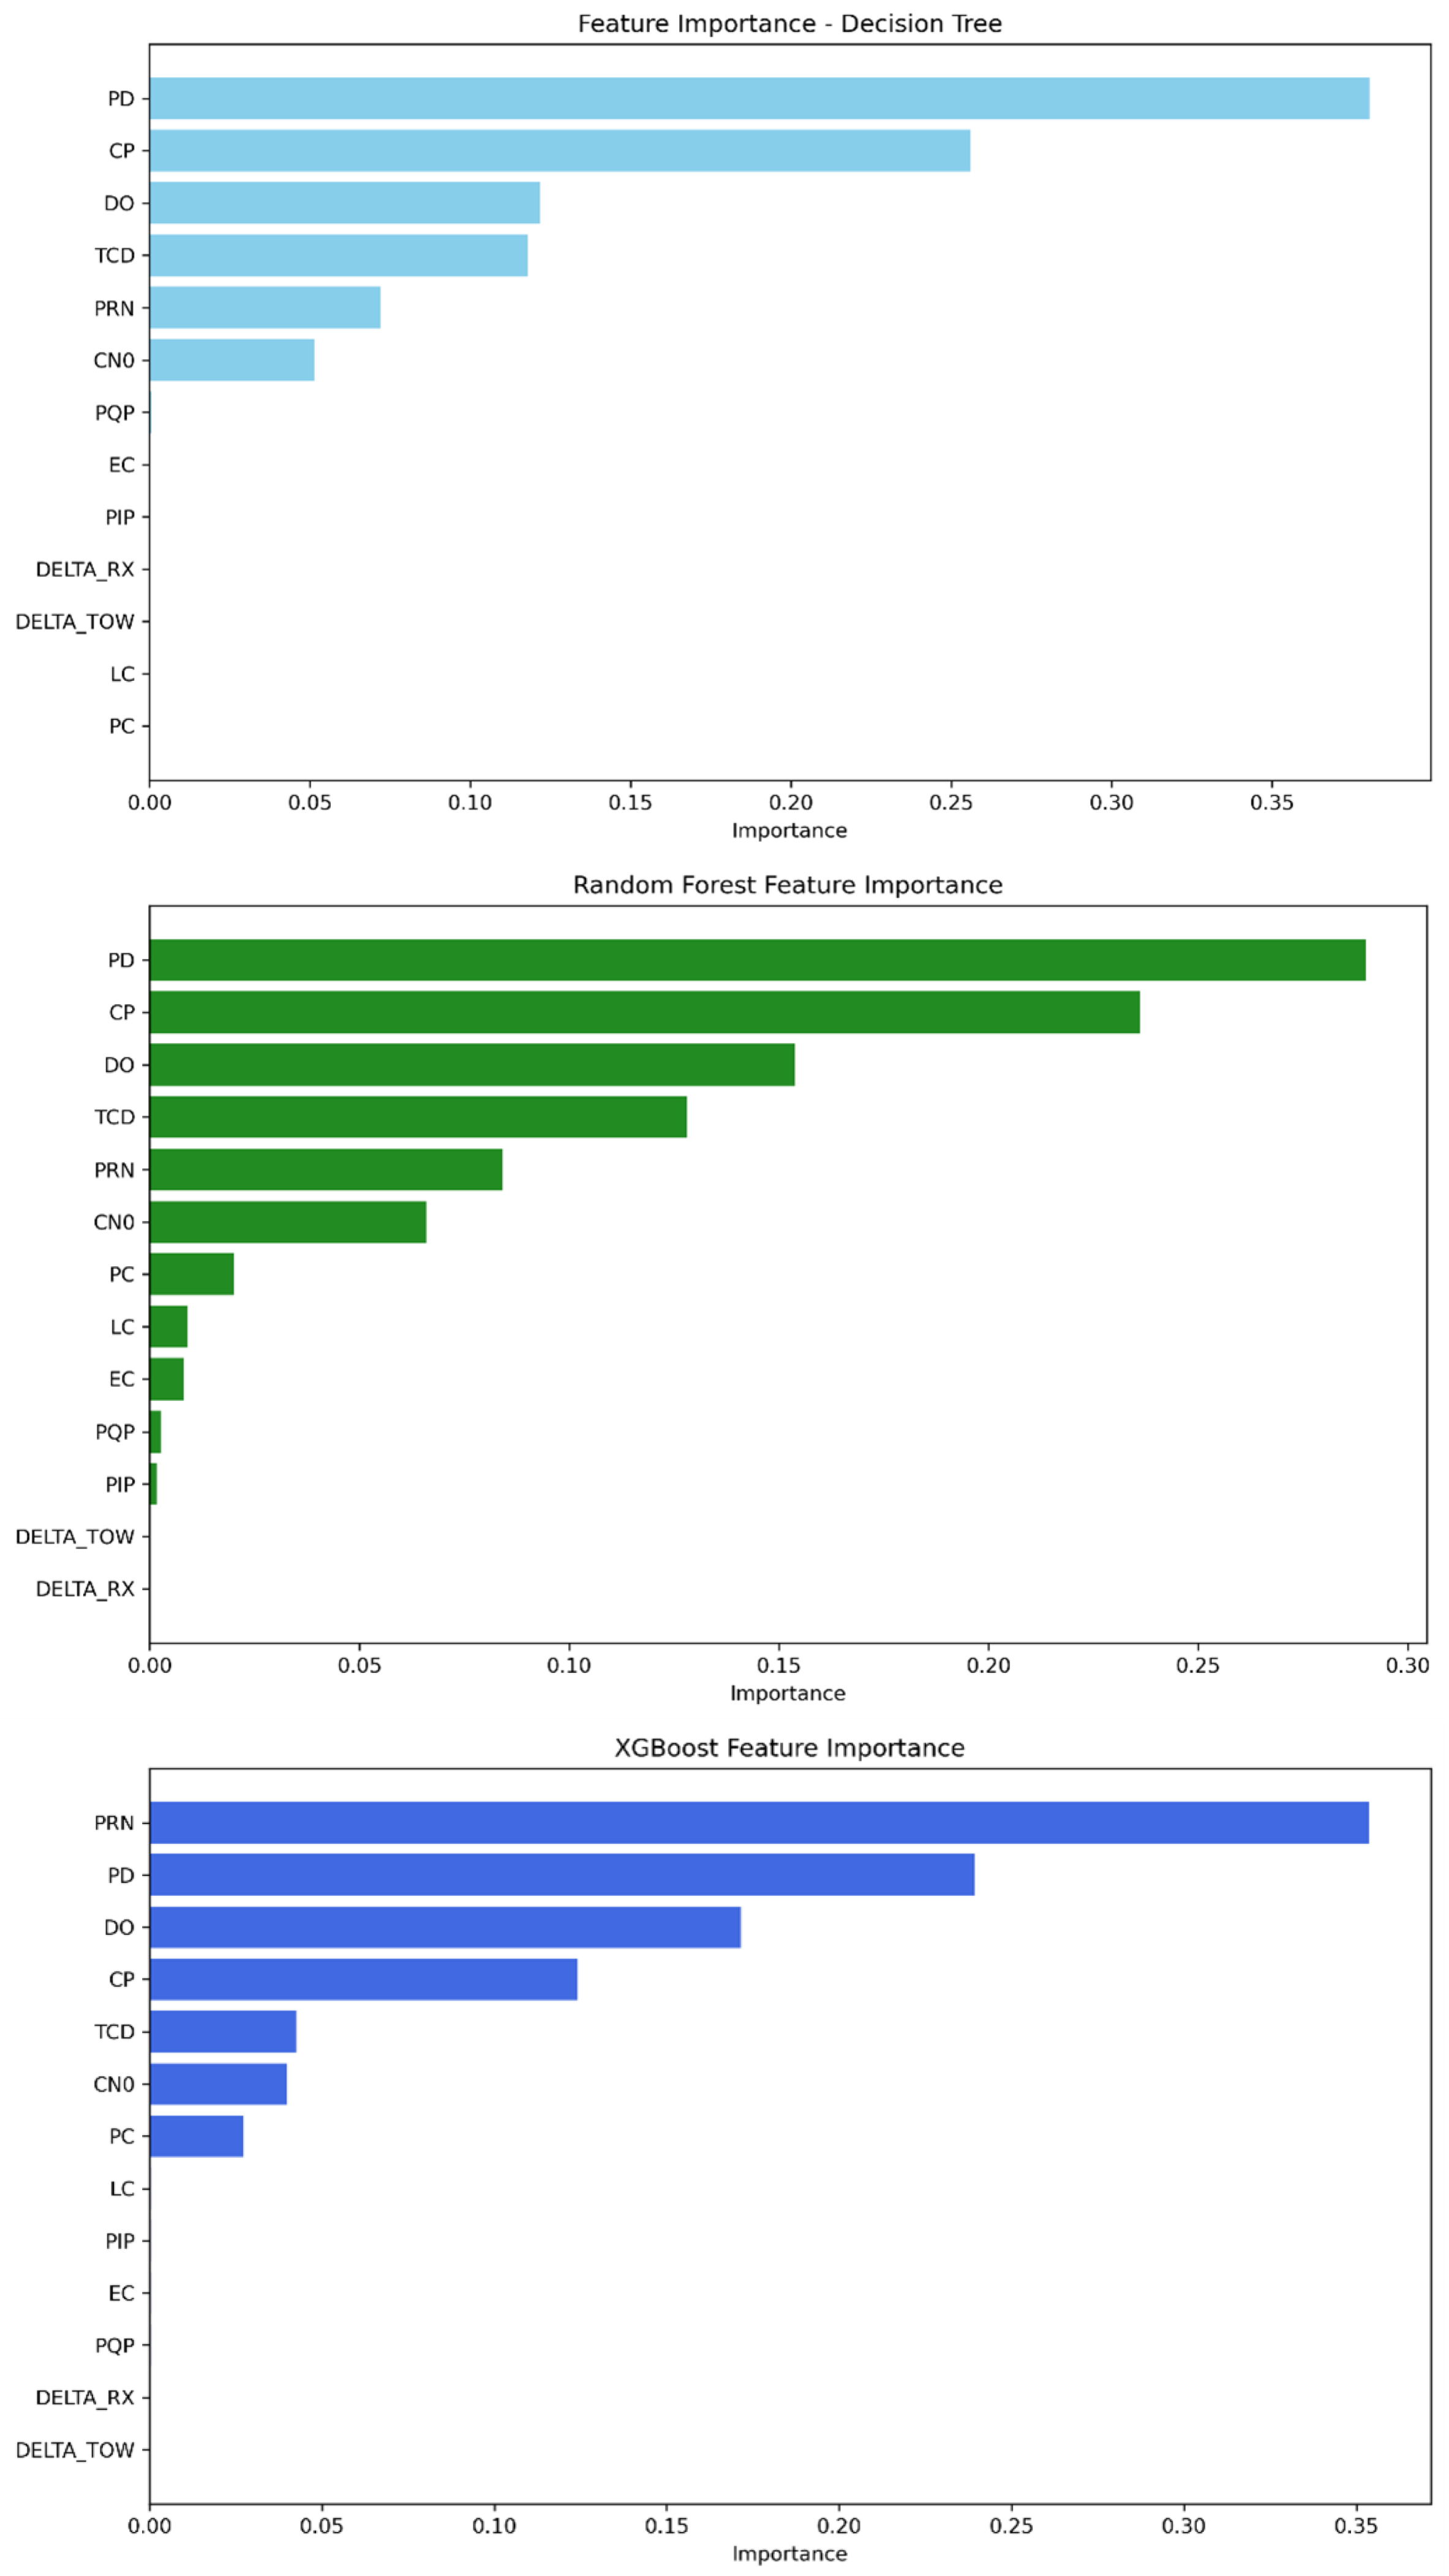
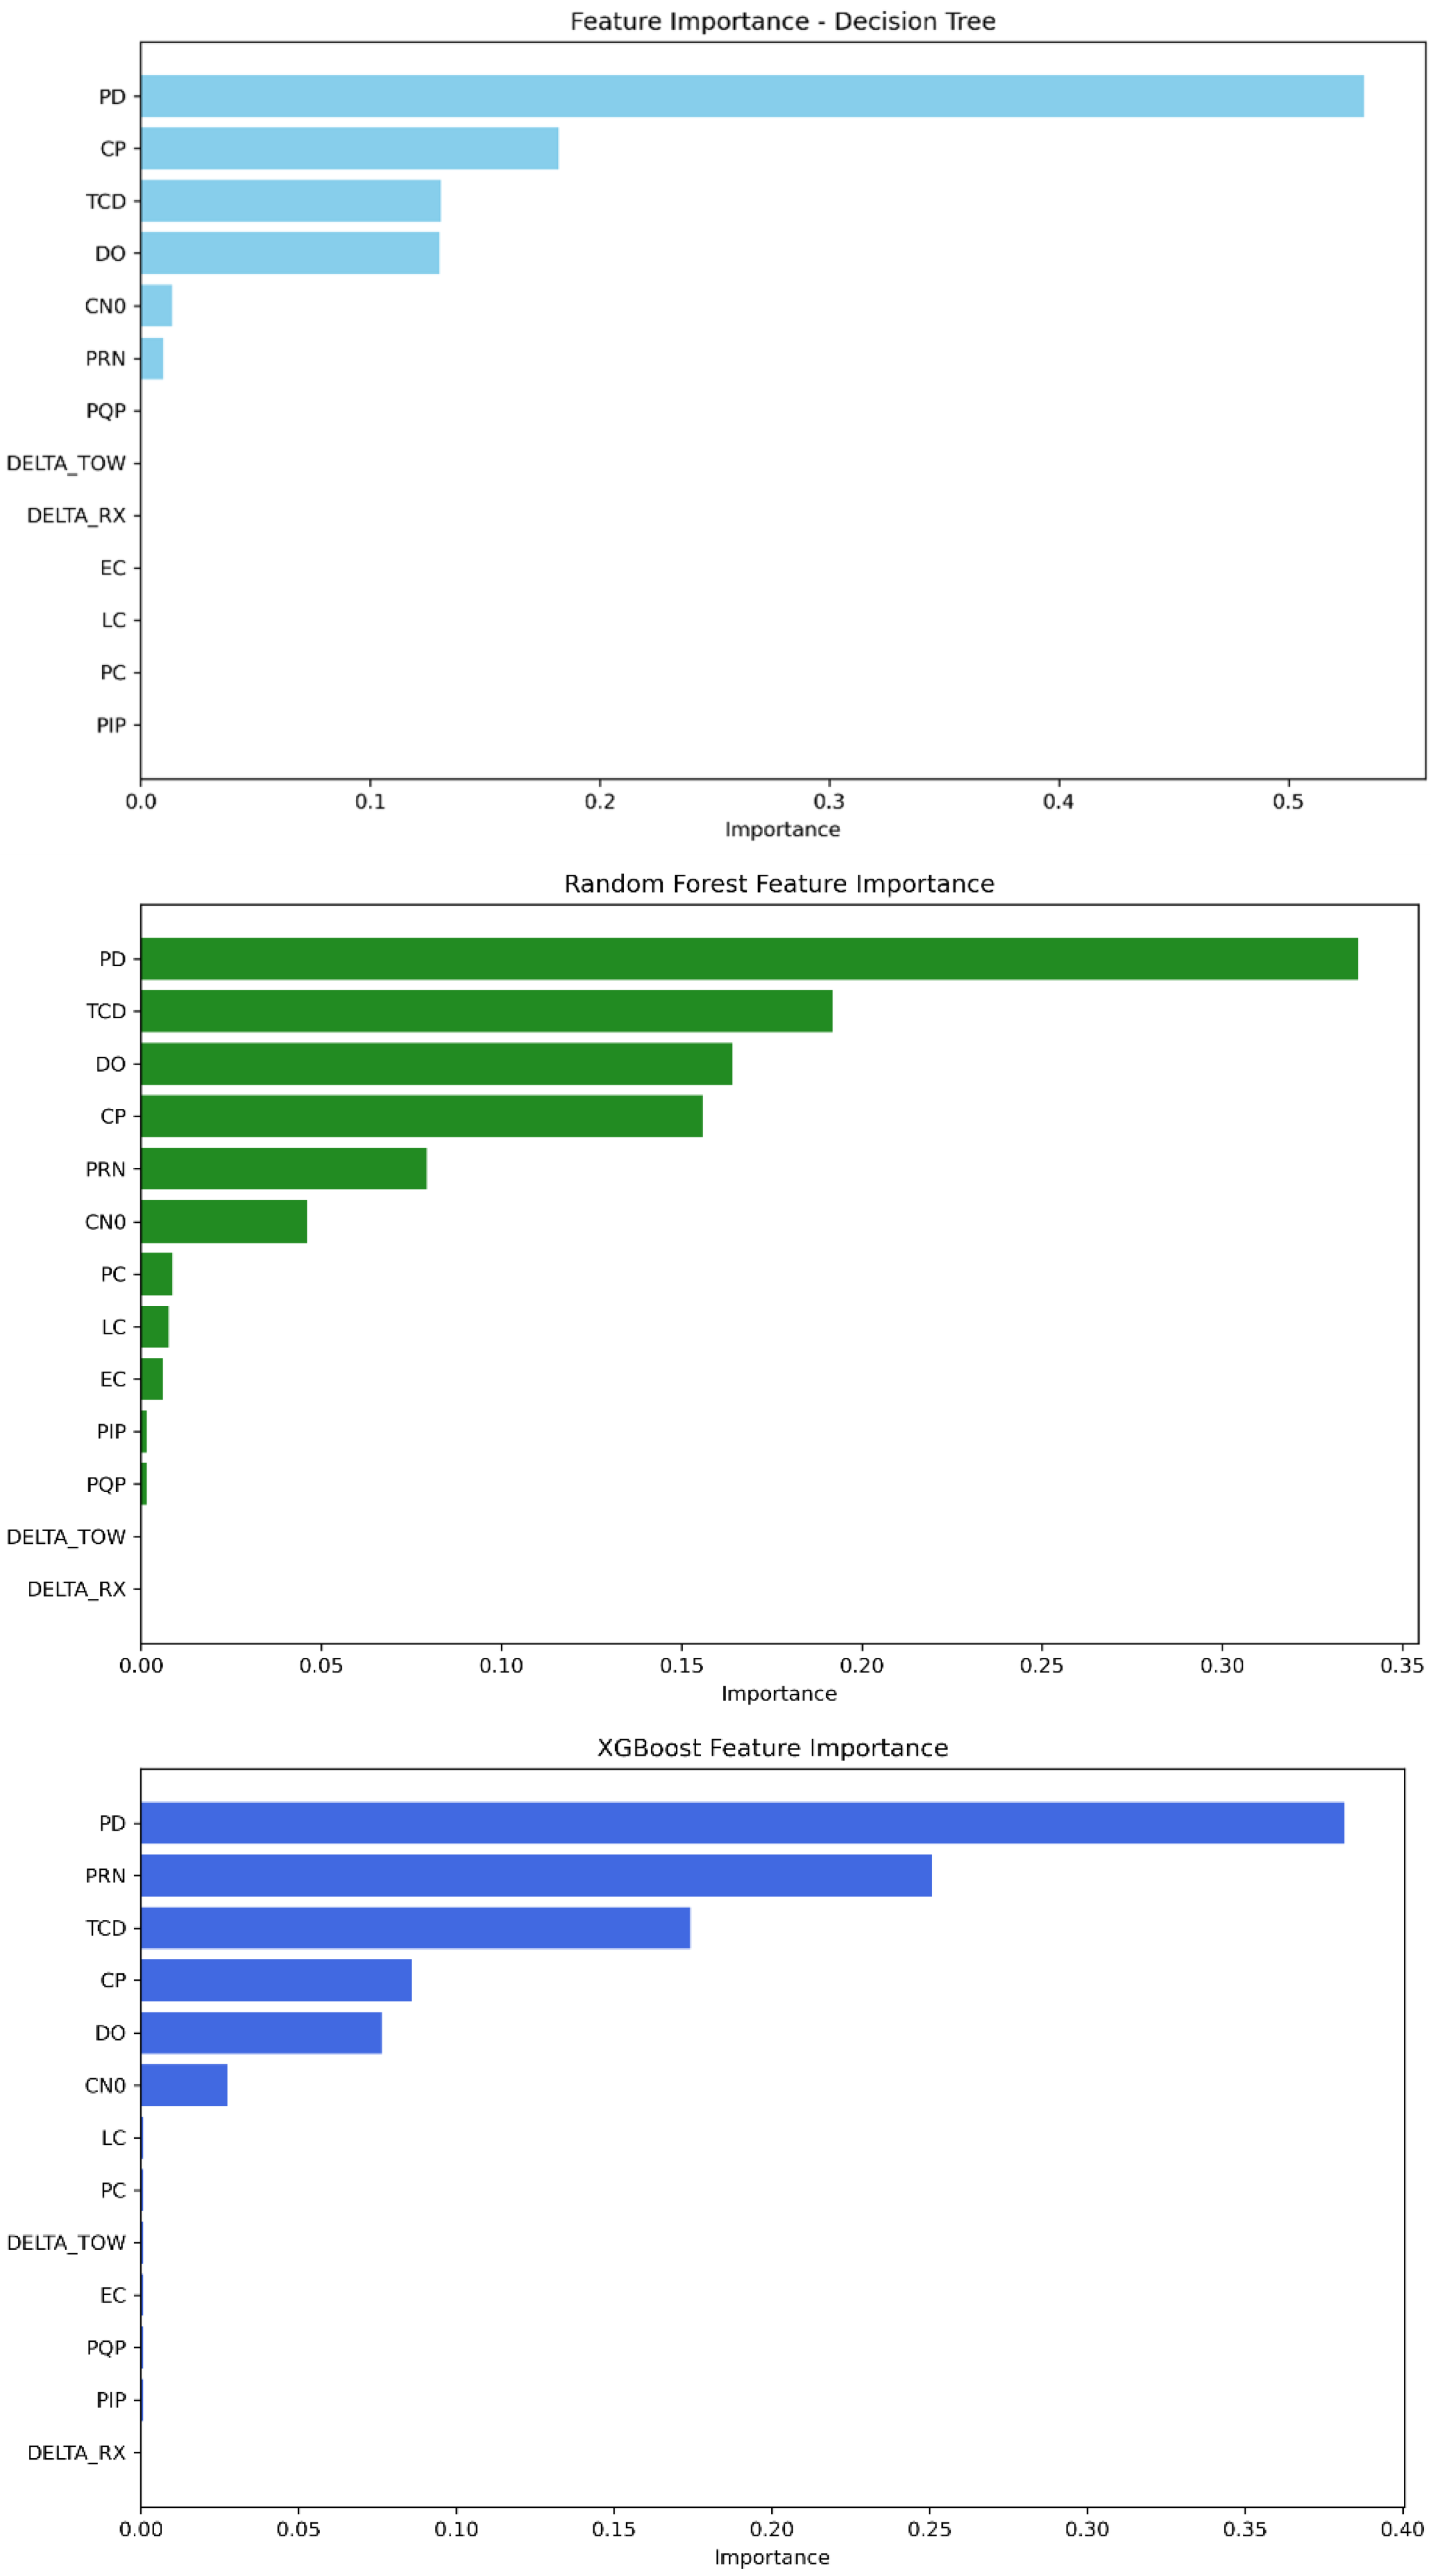
The feature importance parameter provided by our tree-based ML algorithms provides insight into the relevant features that strongly contribute to detecting GPS spoofing attacks regarding this dataset. As demonstrated in
Table 9 and
Figure 5, the features PD, CP, DO, TCD, PRN, and C/N0 are widely the most important for the three models, having the highest scores. Meanwhile, the remaining features have a low contribution score. Decision tree and random forest rely on PD as the feature with the highest score, followed by CP and then DO, TCD, PRN, and finally C/N0. The rest of the features converge to zero and can be neglected. The XGBoost model, on the other hand, depends first on the PRN feature, followed by PD, DO, CP, TCD, and C/N0 as the strongest features.
For this mission, the decision tree model achieved an average accuracy of 99.943%, a precision of 99.930%, a recall of 99.927%, and an F1-score of 99.929%. On the other hand, the random forest model demonstrated even stronger results, with an average accuracy of 99.979%, a precision of 99.977%, a recall of 99.973%, and an F1-score of 99.975%. Meanwhile, XGBoost recorded the lowest performance among the three models, with an accuracy value of 99.918%, a precision of 99.902%, a recall of 99.895%, and an F1-score of 99.898%. Despite this, the model remained stable and reliable.
5.2. Mission 2
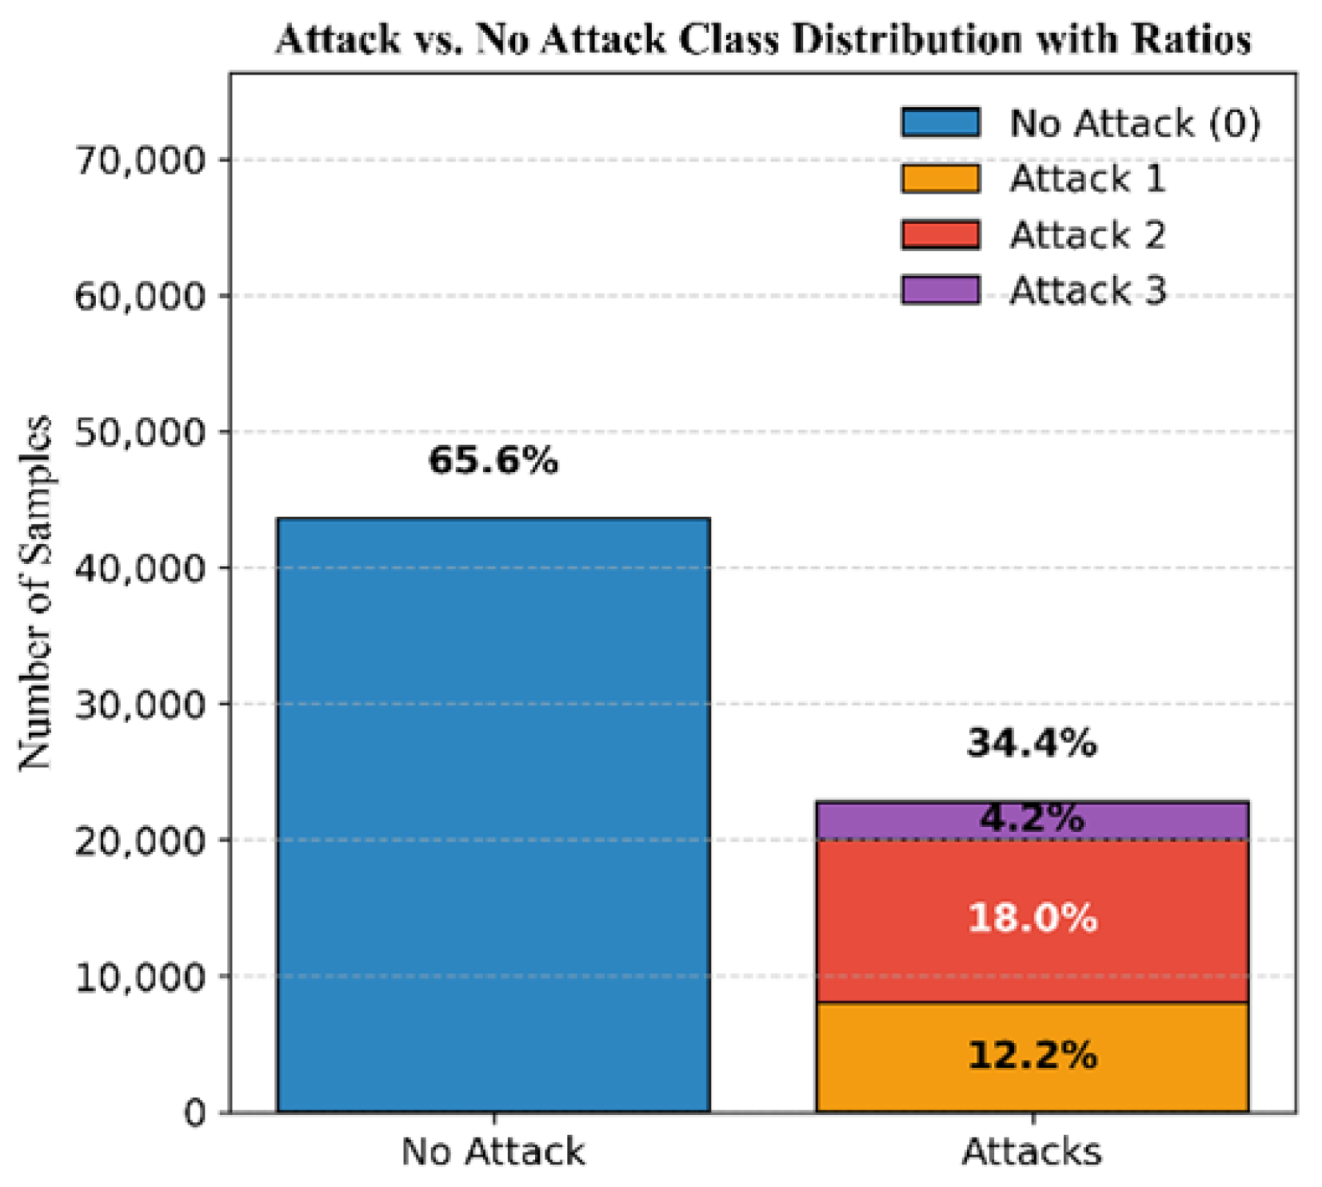
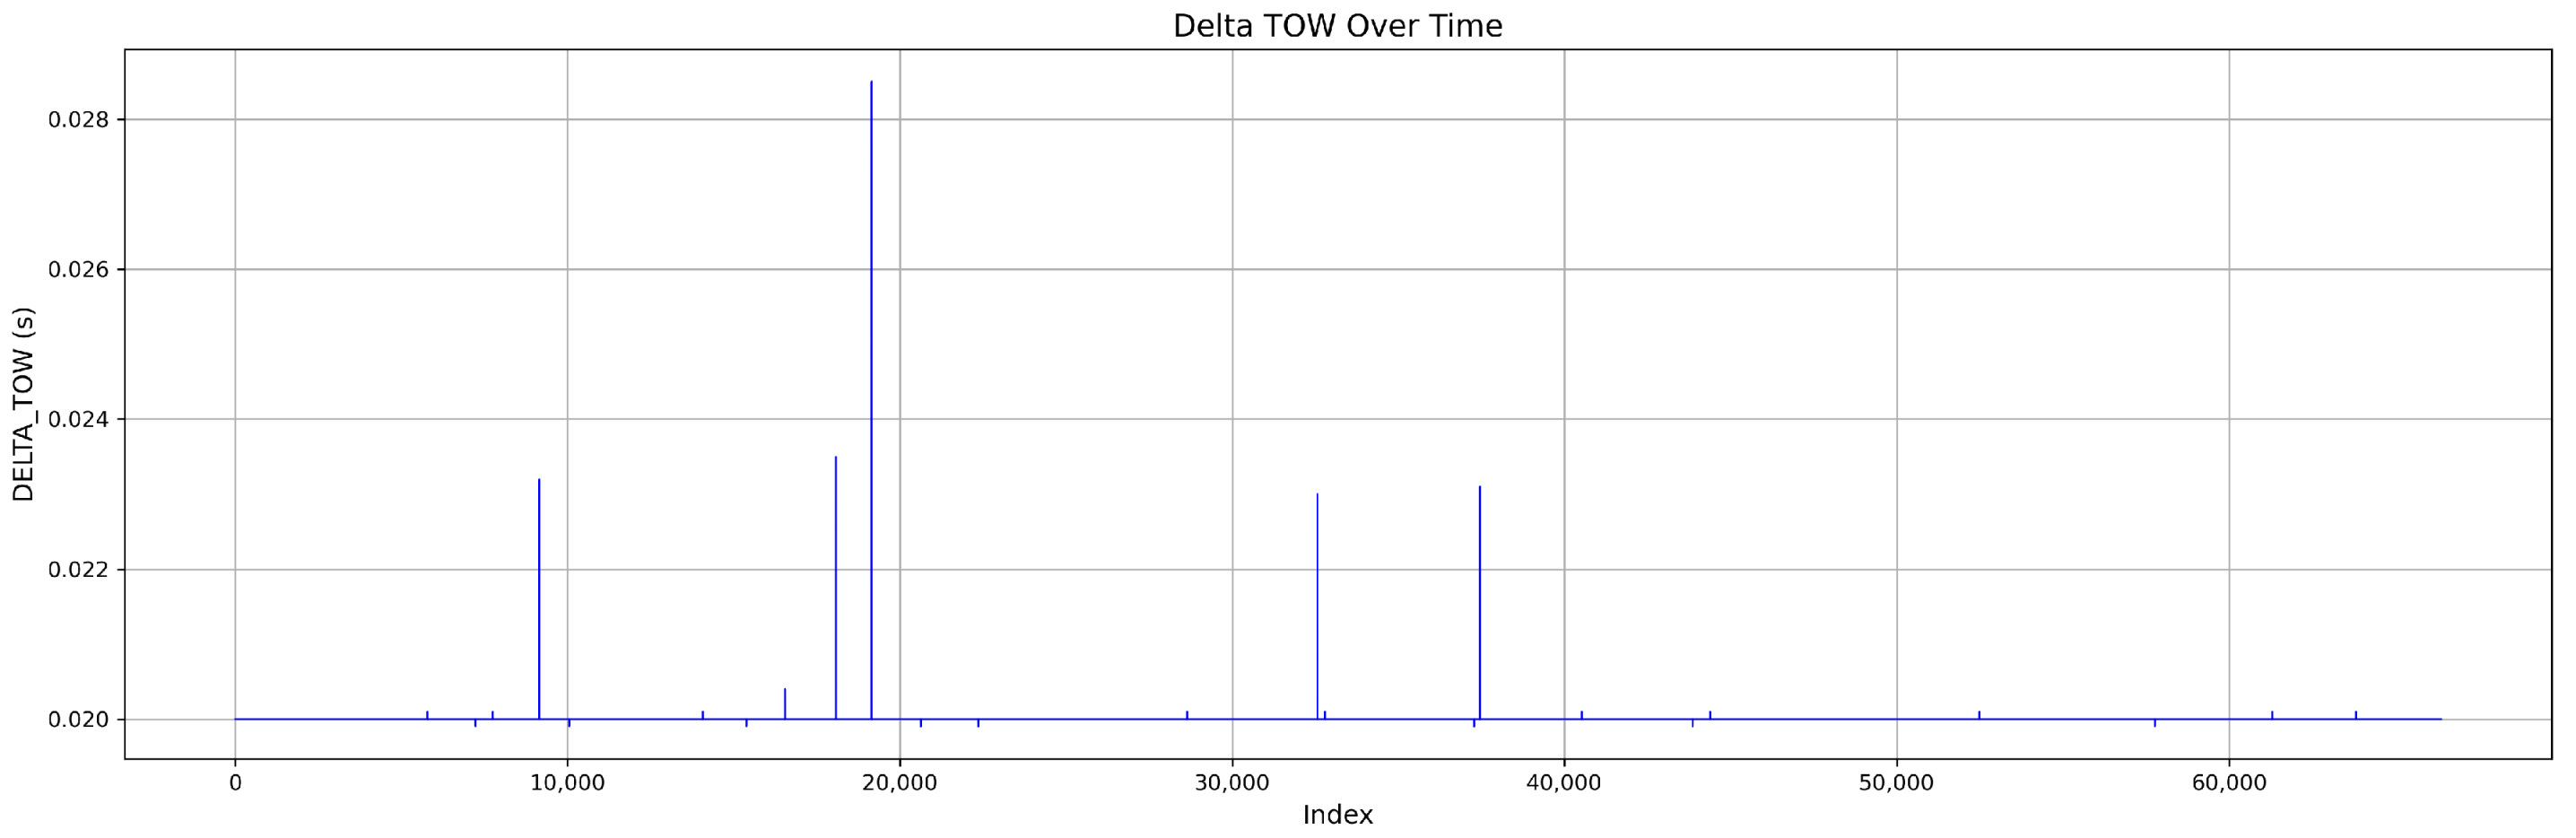
The dataset comprises 65.6% authentic signals and 34.4% attack signals, distributed as follows: 12.2% simplistic attacks, 18% intermediate attacks, and 4.2% sophisticated attacks; see
Figure 6. The DELTA_TOW values are illustrated in
Figure 7.
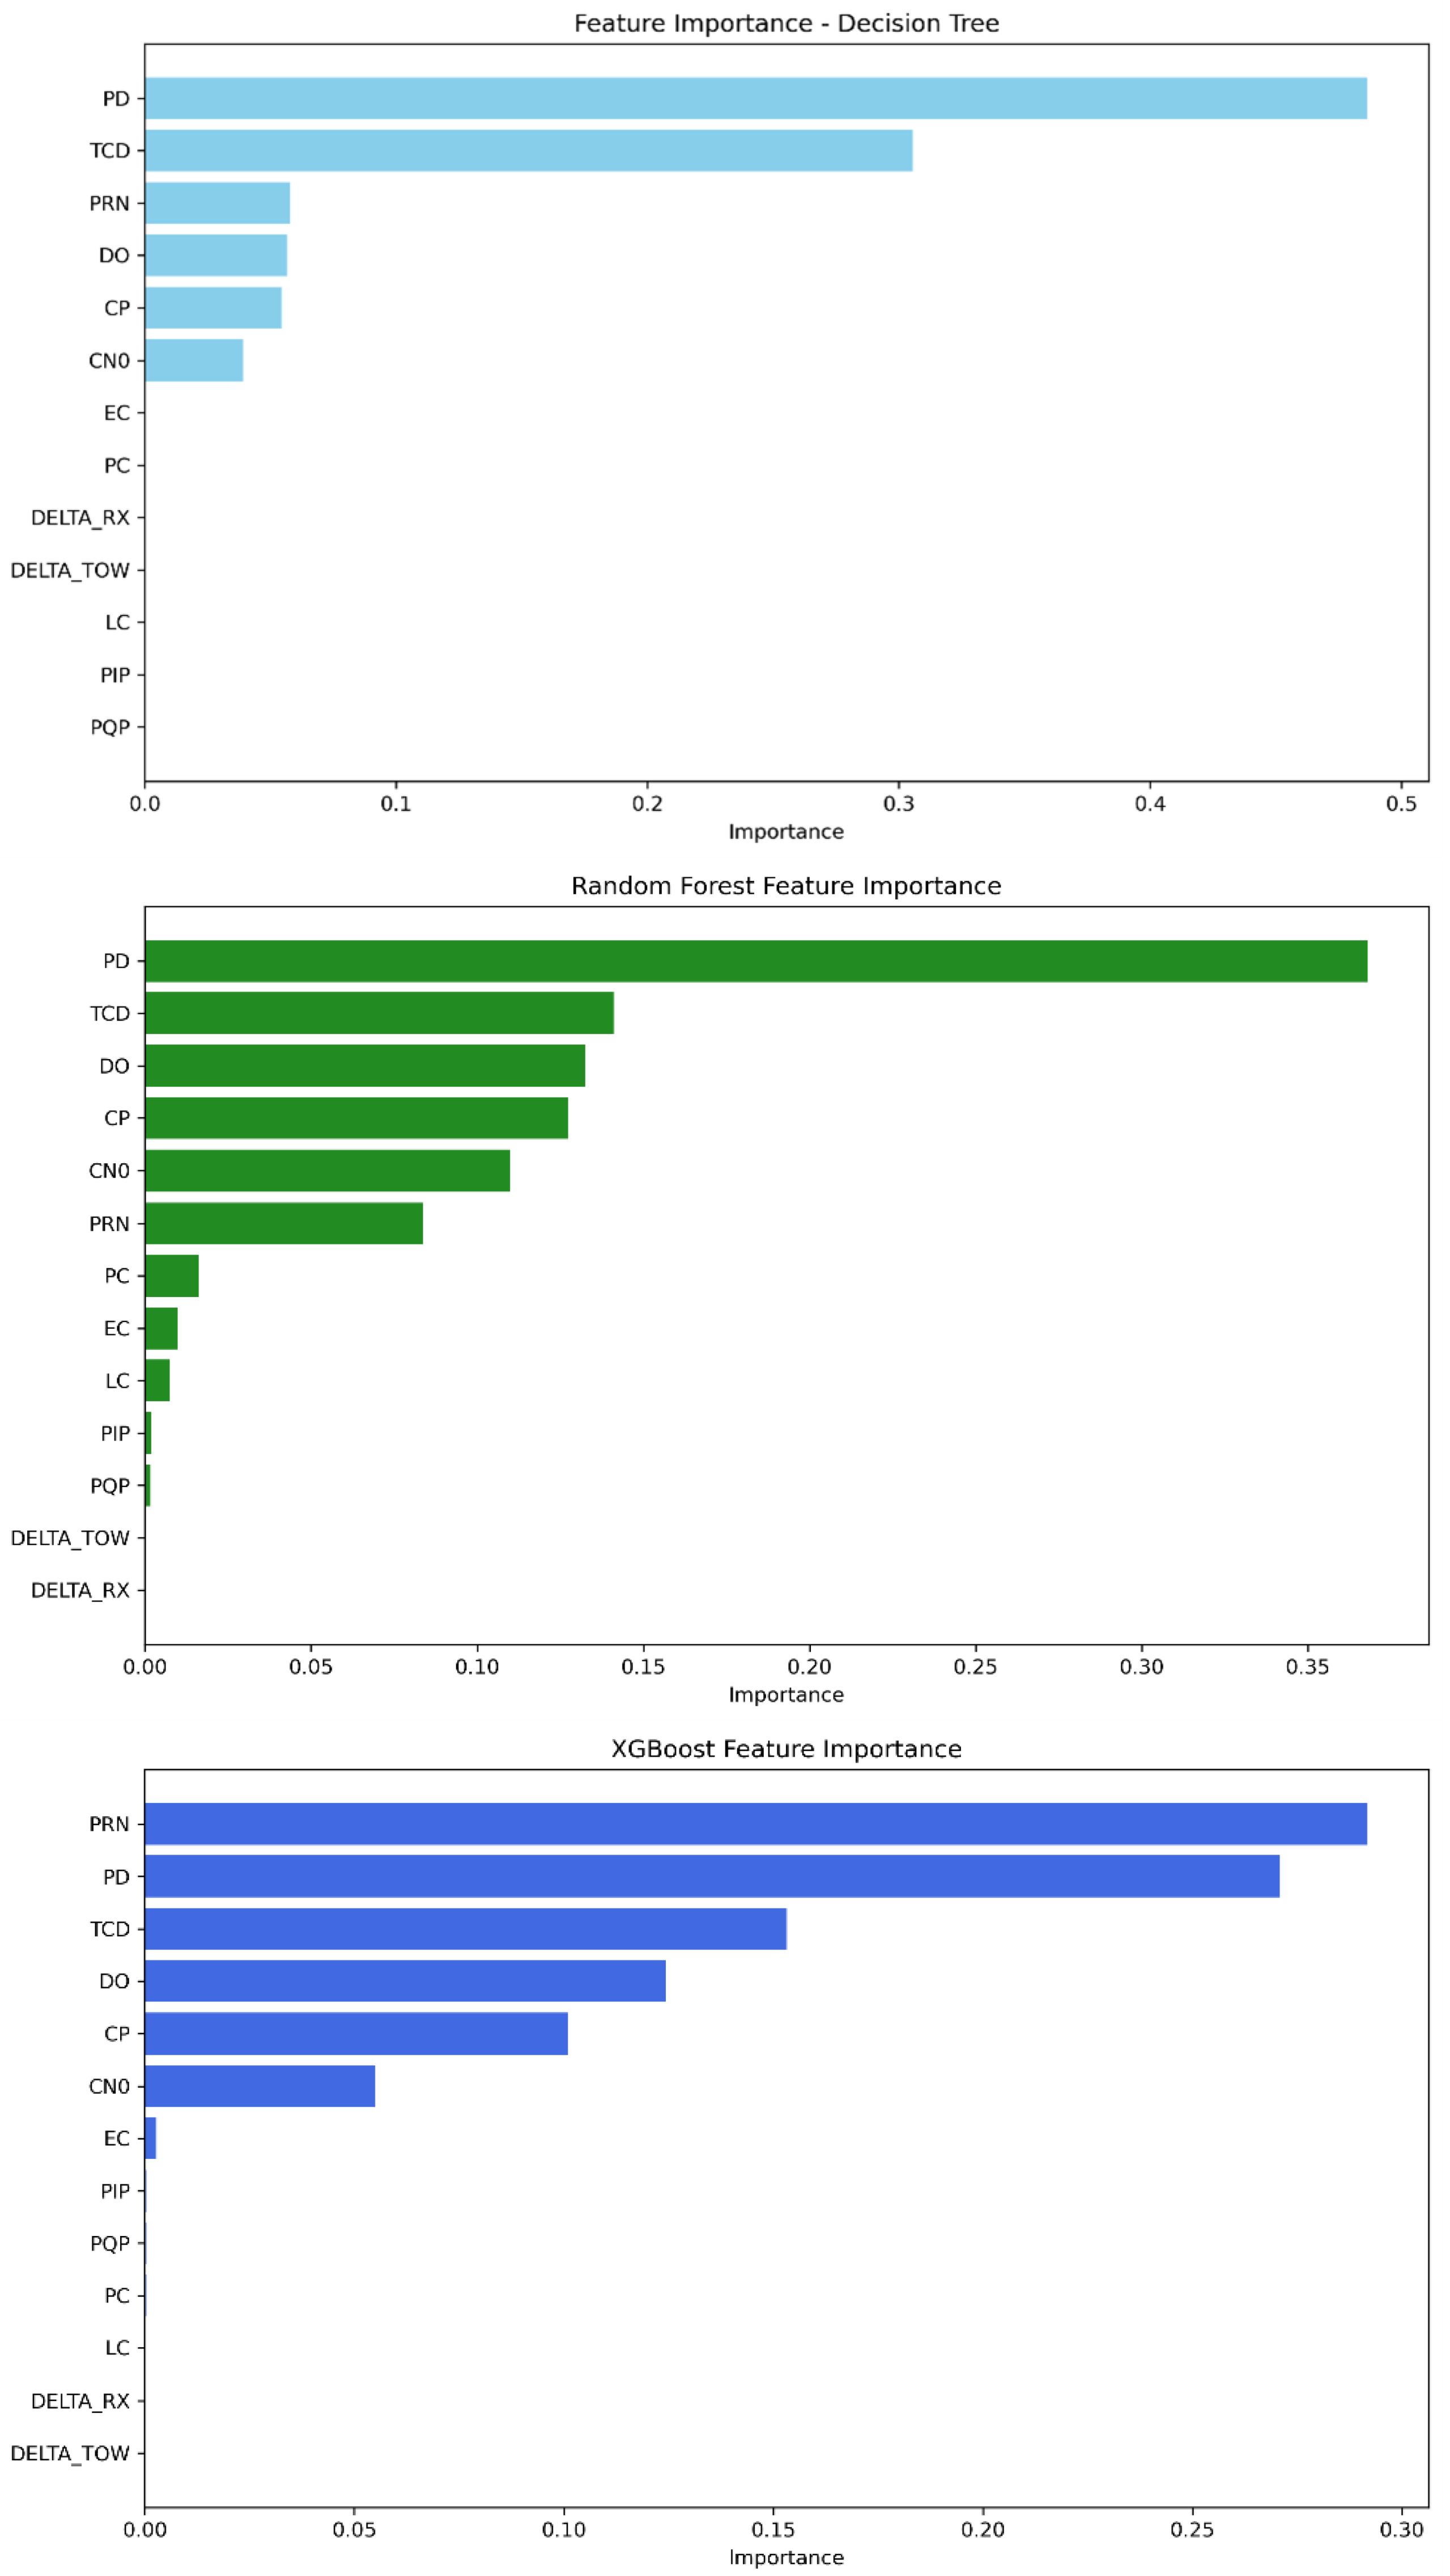
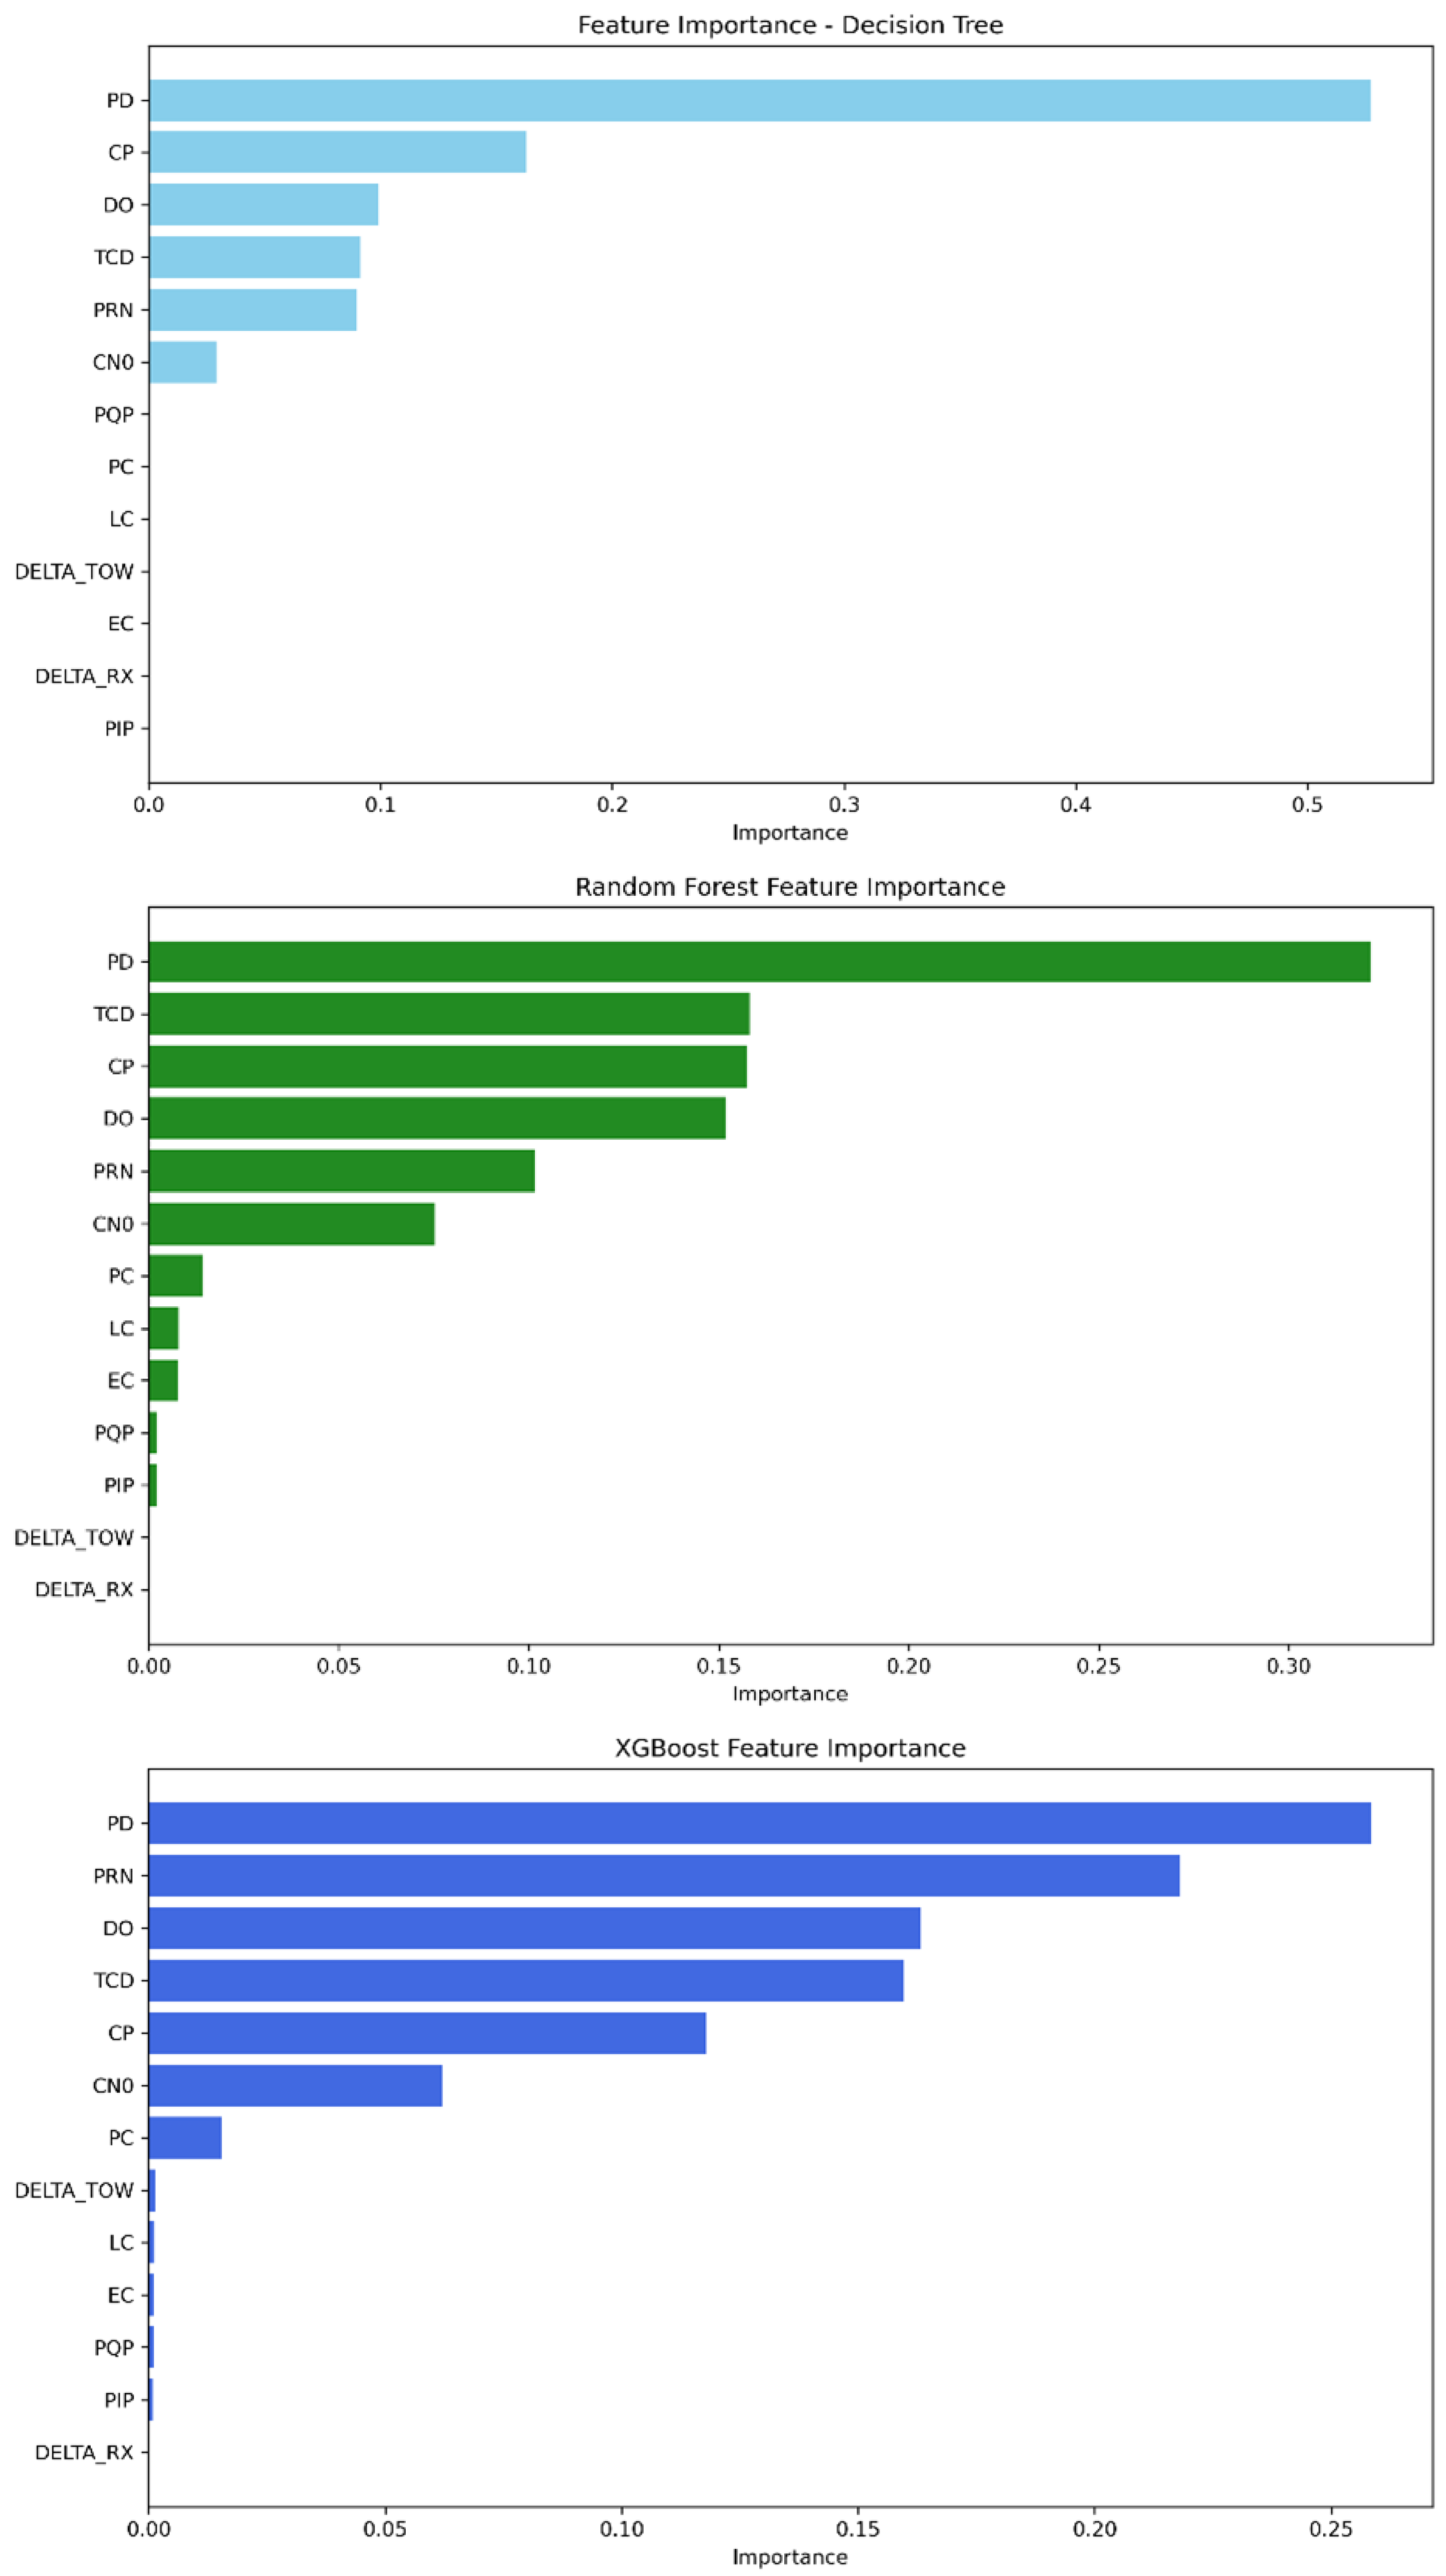
The feature importance analysis shows that, as in Mission 1, the strongest features in identifying which class a GPS signal is classified into are still PD, CP, DO, TCD, PRN, and C/N0; see
Figure 8. The feature importance scores of each model are presented in
Table 10. Therefore, the decision tree’s highest-scoring features are ordered as follows: PD remains the most important feature, followed by TCD, PRN, DO, CP, and C/N0. For random forest, the feature order is PD, TCD, DO, CP, C/N0, and PRN. Finally, XGBoost initially relies on PRN, then followed by PD, TCD, DO, CP, and C/N0.
The decision tree model achieved a mean accuracy of 99.965%, precision of 99.933%, recall of 99.953%, and F1-score of 99.943%, with minimal fluctuations in standard deviation. The random forest model outperformed decision tree, achieving an average accuracy of 99.984%, precision of 99.951%, recall of 99.979%, and F1-score of 99.965%. The XGBoost model scored the lowest performance, with an accuracy of 99.960%, precision of 99.919%, recall of 99.945%, and F1-score of 99.932%.
5.3. Mission 3
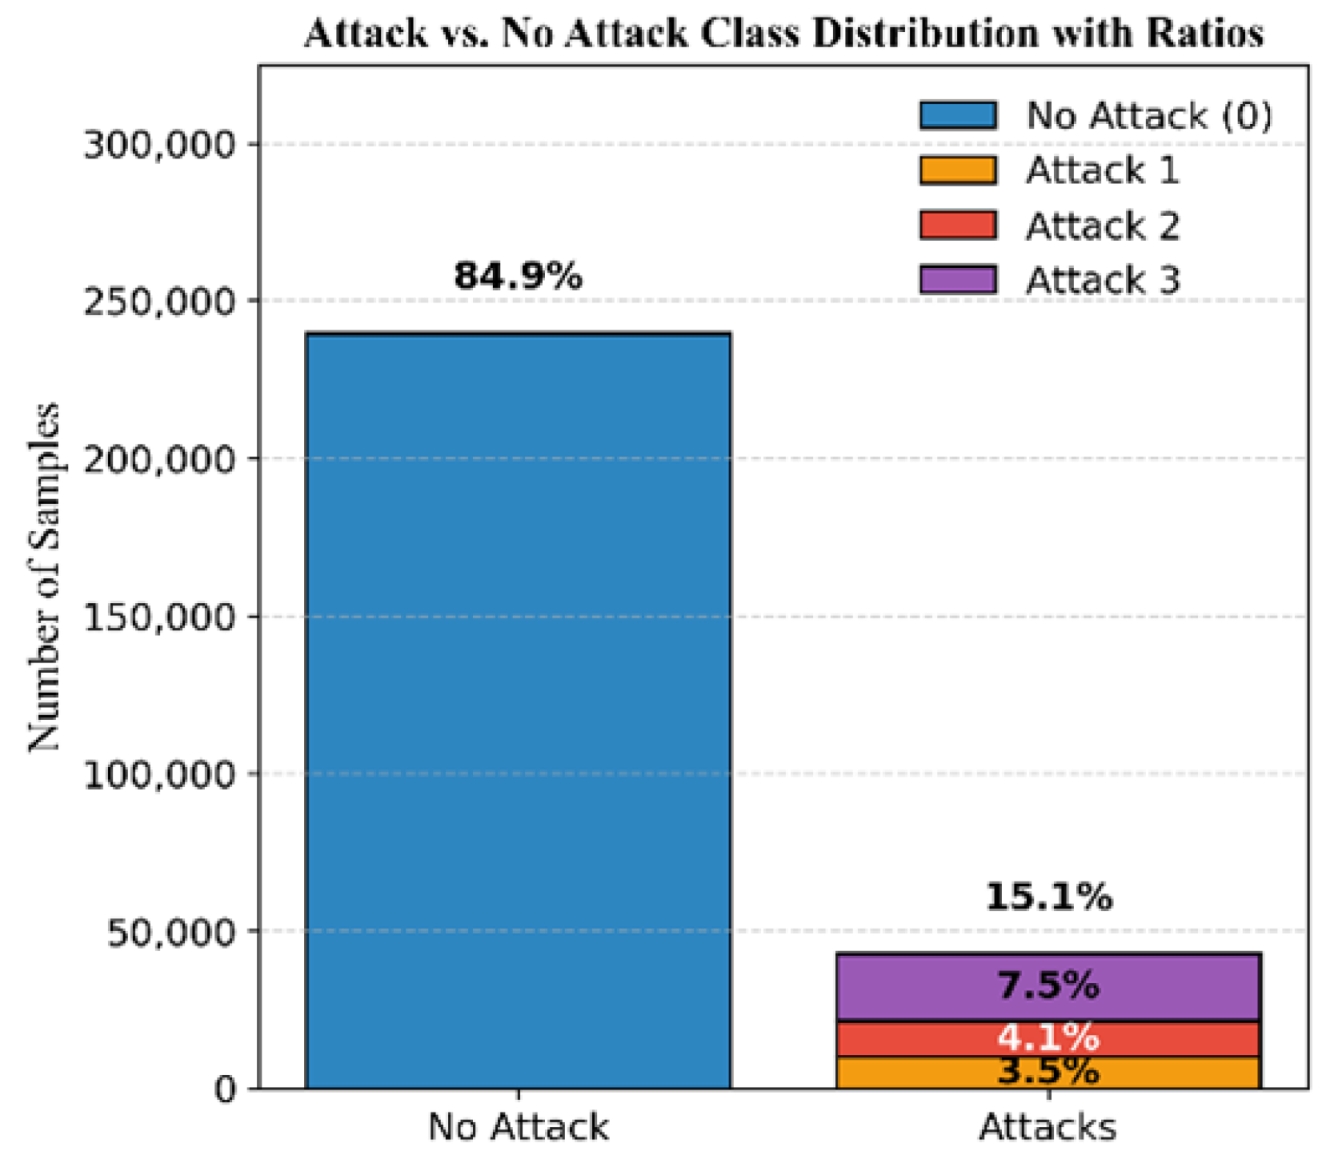
The dataset for Mission 3, illustrated in
Figure 9, consists of 84.9 % authentic signals and 15.1% attack signals. The attacks are categorized as 3.5% simplistic, 4.1% intermediate, and 7.5% sophisticated attacks.
Figure 10 demonstrates the DELTA_TOW values for this mission.
As shown in
Figure 11, the features PD, TCD, PRN, DO, CP, and C/N0 are the most significant among the others for the decision tree model. In random forest, the feature importance parameter displays PD, TCD, DO, CP, C/N0, and PRN with the highest importance scores. Furthermore, XGBoost’s best features are described as follows: PRN, PD, TCD, DO, CP, and C/N0. The scores obtained for each model can be found in
Table 11.
The decision tree model achieved an accuracy of 99.990%, precision of 99.978%, recall of 99.969%, and F1-score of 99.974%. The random forest model provided the highest performance, with an accuracy of 99.995%, precision of 99.991%, recall of 99.984%, and F1-score of 99.988%. Meanwhile, XGBoost demonstrated the lowest performance, with 99.894% accuracy, 99.769% precision, 99.764% recall, and 99.766% F1-score.
5.4. All Missions Combined
To further assess the generalization of our models, the datasets of all the missions are consolidated into a single one. The resulting distribution comprises 76.8% authentic signals and 23.2% attack signals, with 6.5% simplistic, 7.5% intermediate, and 9.2% sophisticated attacks; see
Figure 12.
The investigation of feature importance on the dataset comprising all the missions allows us to observe from
Figure 13 that the decision tree model relies on the PD feature as the most relevant, followed by CP, DO, TCD, PRN, and C/N0, while the remaining features converge to zero. The random forest model leverages PD as the main feature, accompanied by TCD, CP, DO PRN, and C/N0; however, the rest of the features could be ignored. For the XGBoost model, it depends mainly on PD, as in the two previous models, followed by PRN, DO, TCD, CP, and C/N0. The discussed scores for each model are presented in
Table 12.
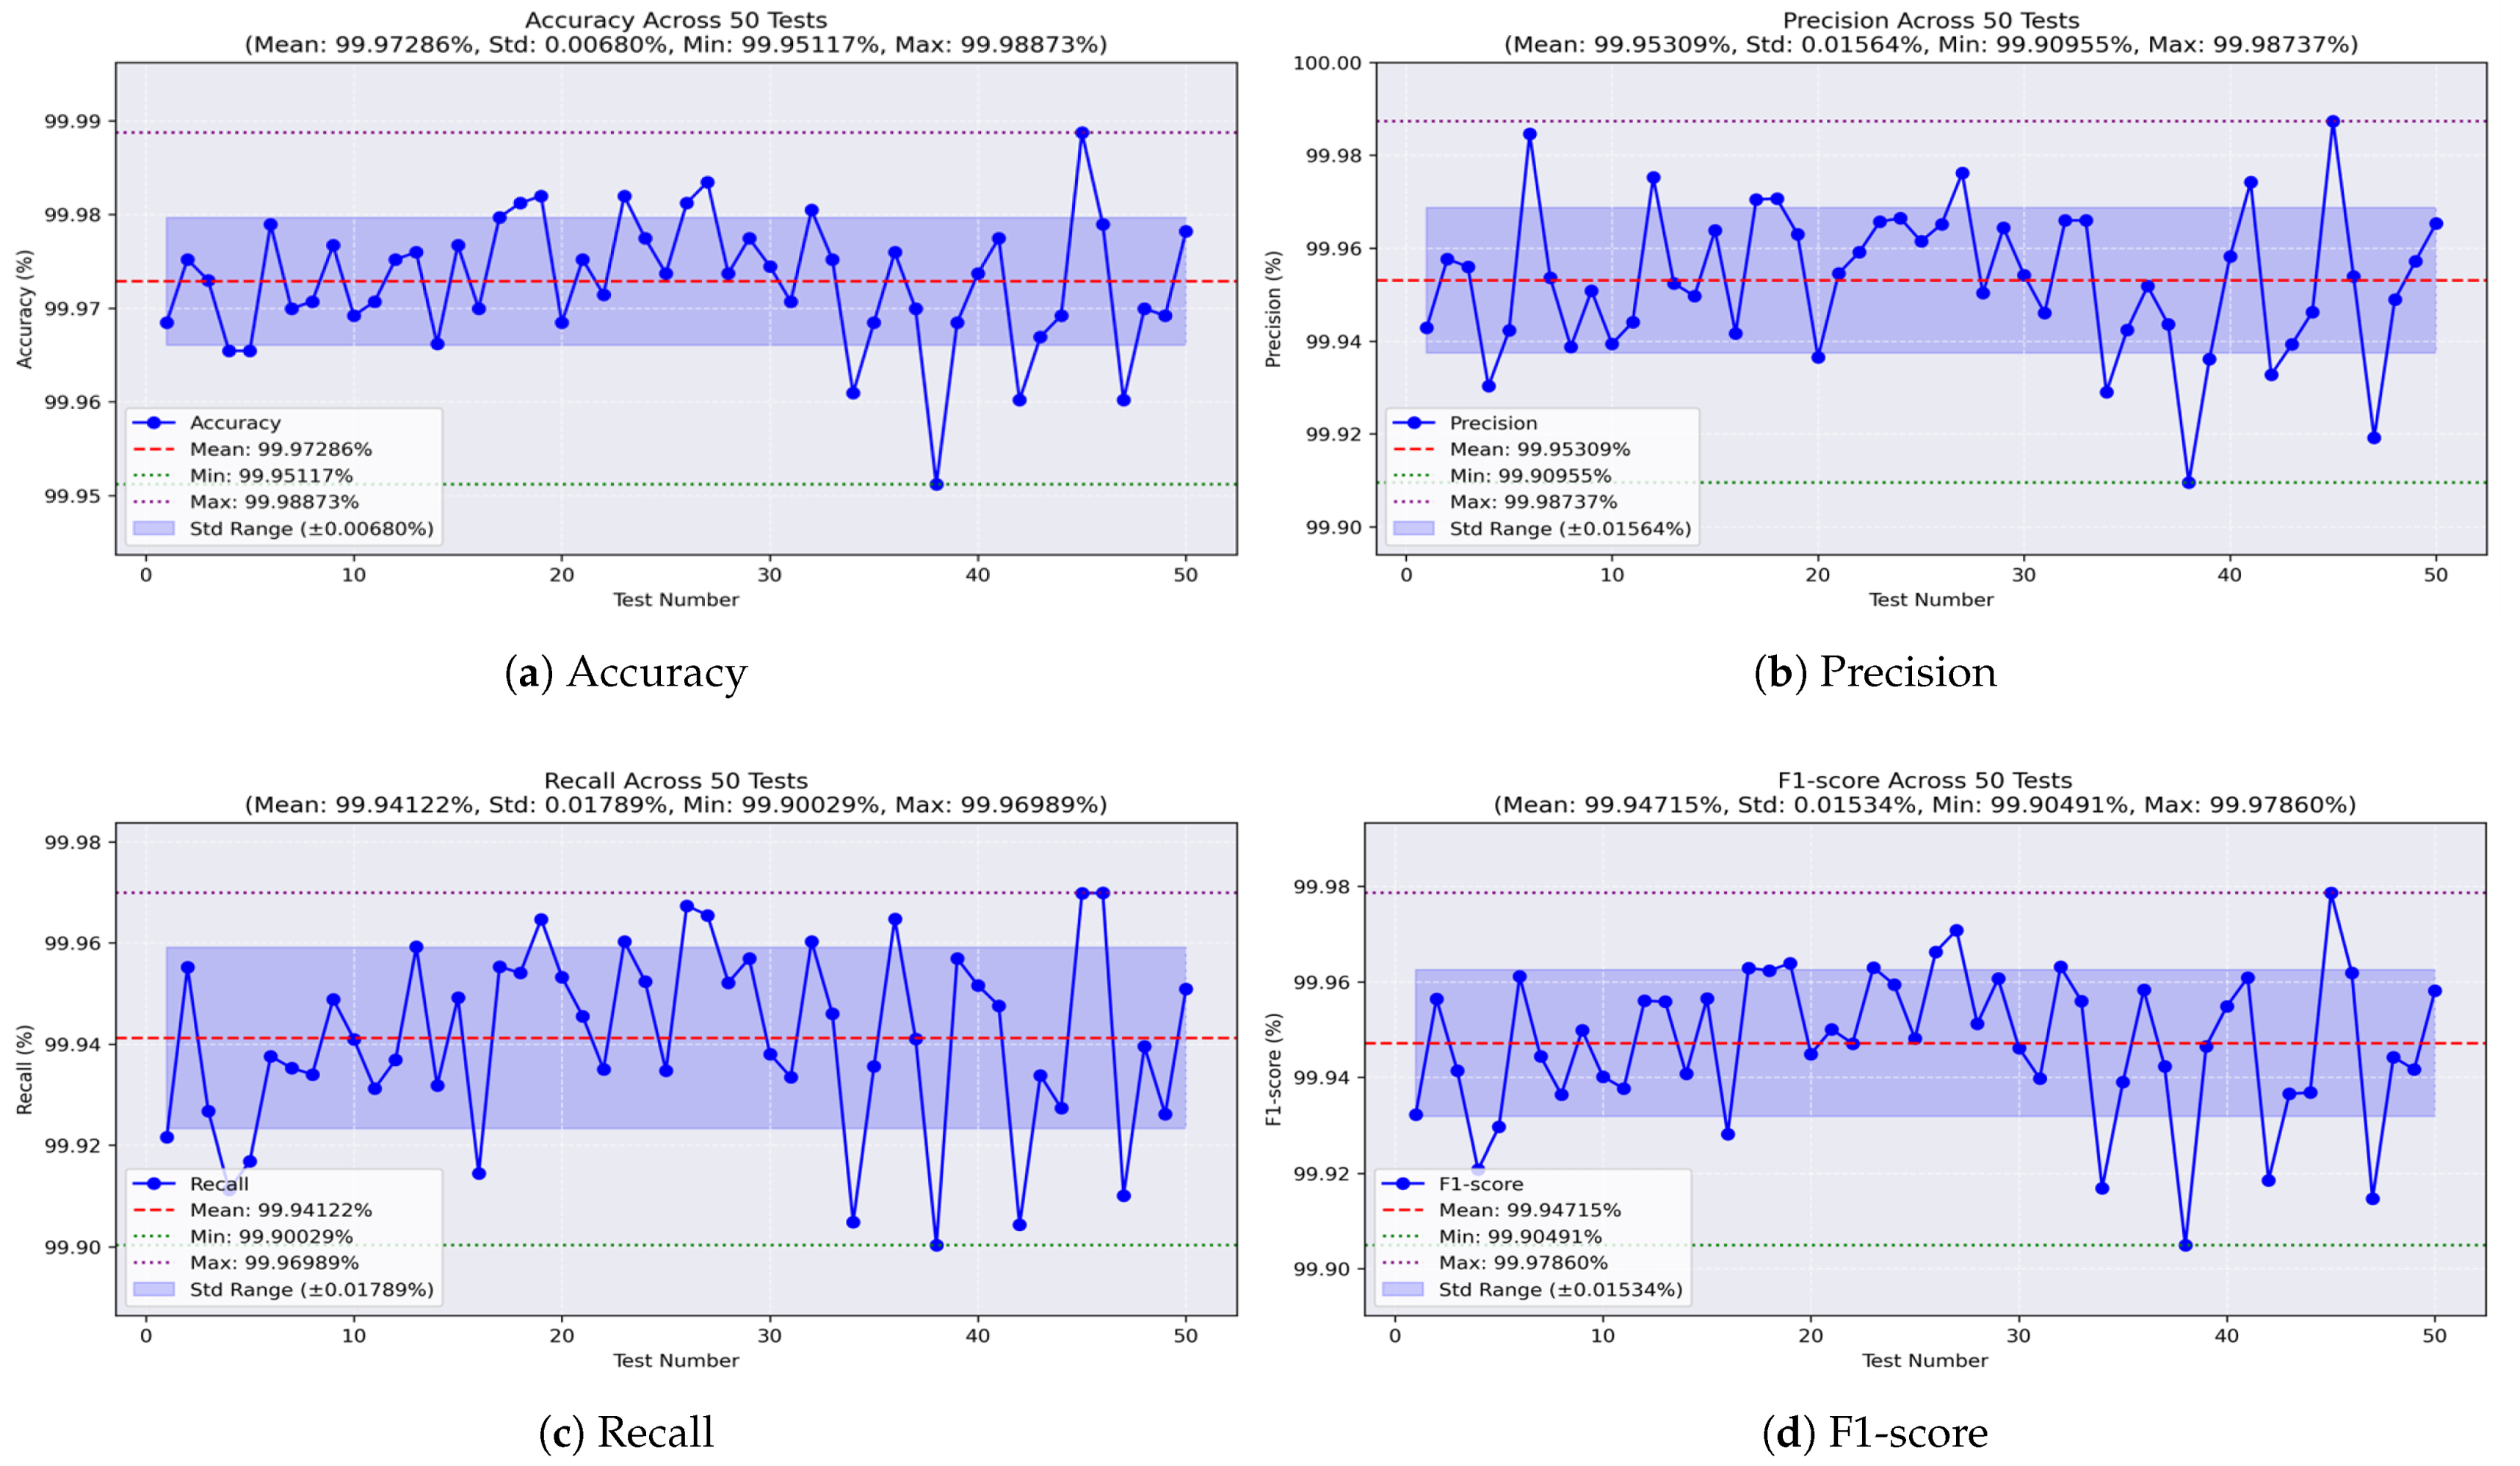
Through 50 independent runs of our models on the dataset comprising all the missions, we examine the behavior of each model across varying training and testing sets. Accordingly, we illustrate the results using curves that demonstrate the values of the evaluation metrics in each test. Initially, the analysis of the decision tree model, as illustrated in
Figure 14a, shows that the accuracy remains stable, with a small standard deviation (STD) of ±0.006. The worst accuracy observed was 99.951%, the best was 99.988%, and the average was 99.972%. The precision values, shown in
Figure 14b, range from a minimum of 99.909% to a maximum of 99.987%, with an average of 99.953% and an STD of ±0.015. For recall, the model achieved a minimum of 99.90% and a maximum of 99.969%, with an average of 99.941% and a low STD of ±0.017, as shown in
Figure 14c. Meanwhile, the F1-score, which represents the balance between precision and recall, achieved an average of 99.947%, with a worst value of 99.904%, a best of 99.978%, and a stable performance indicated by an STD of ±0.015, as shown in
Figure 14d.
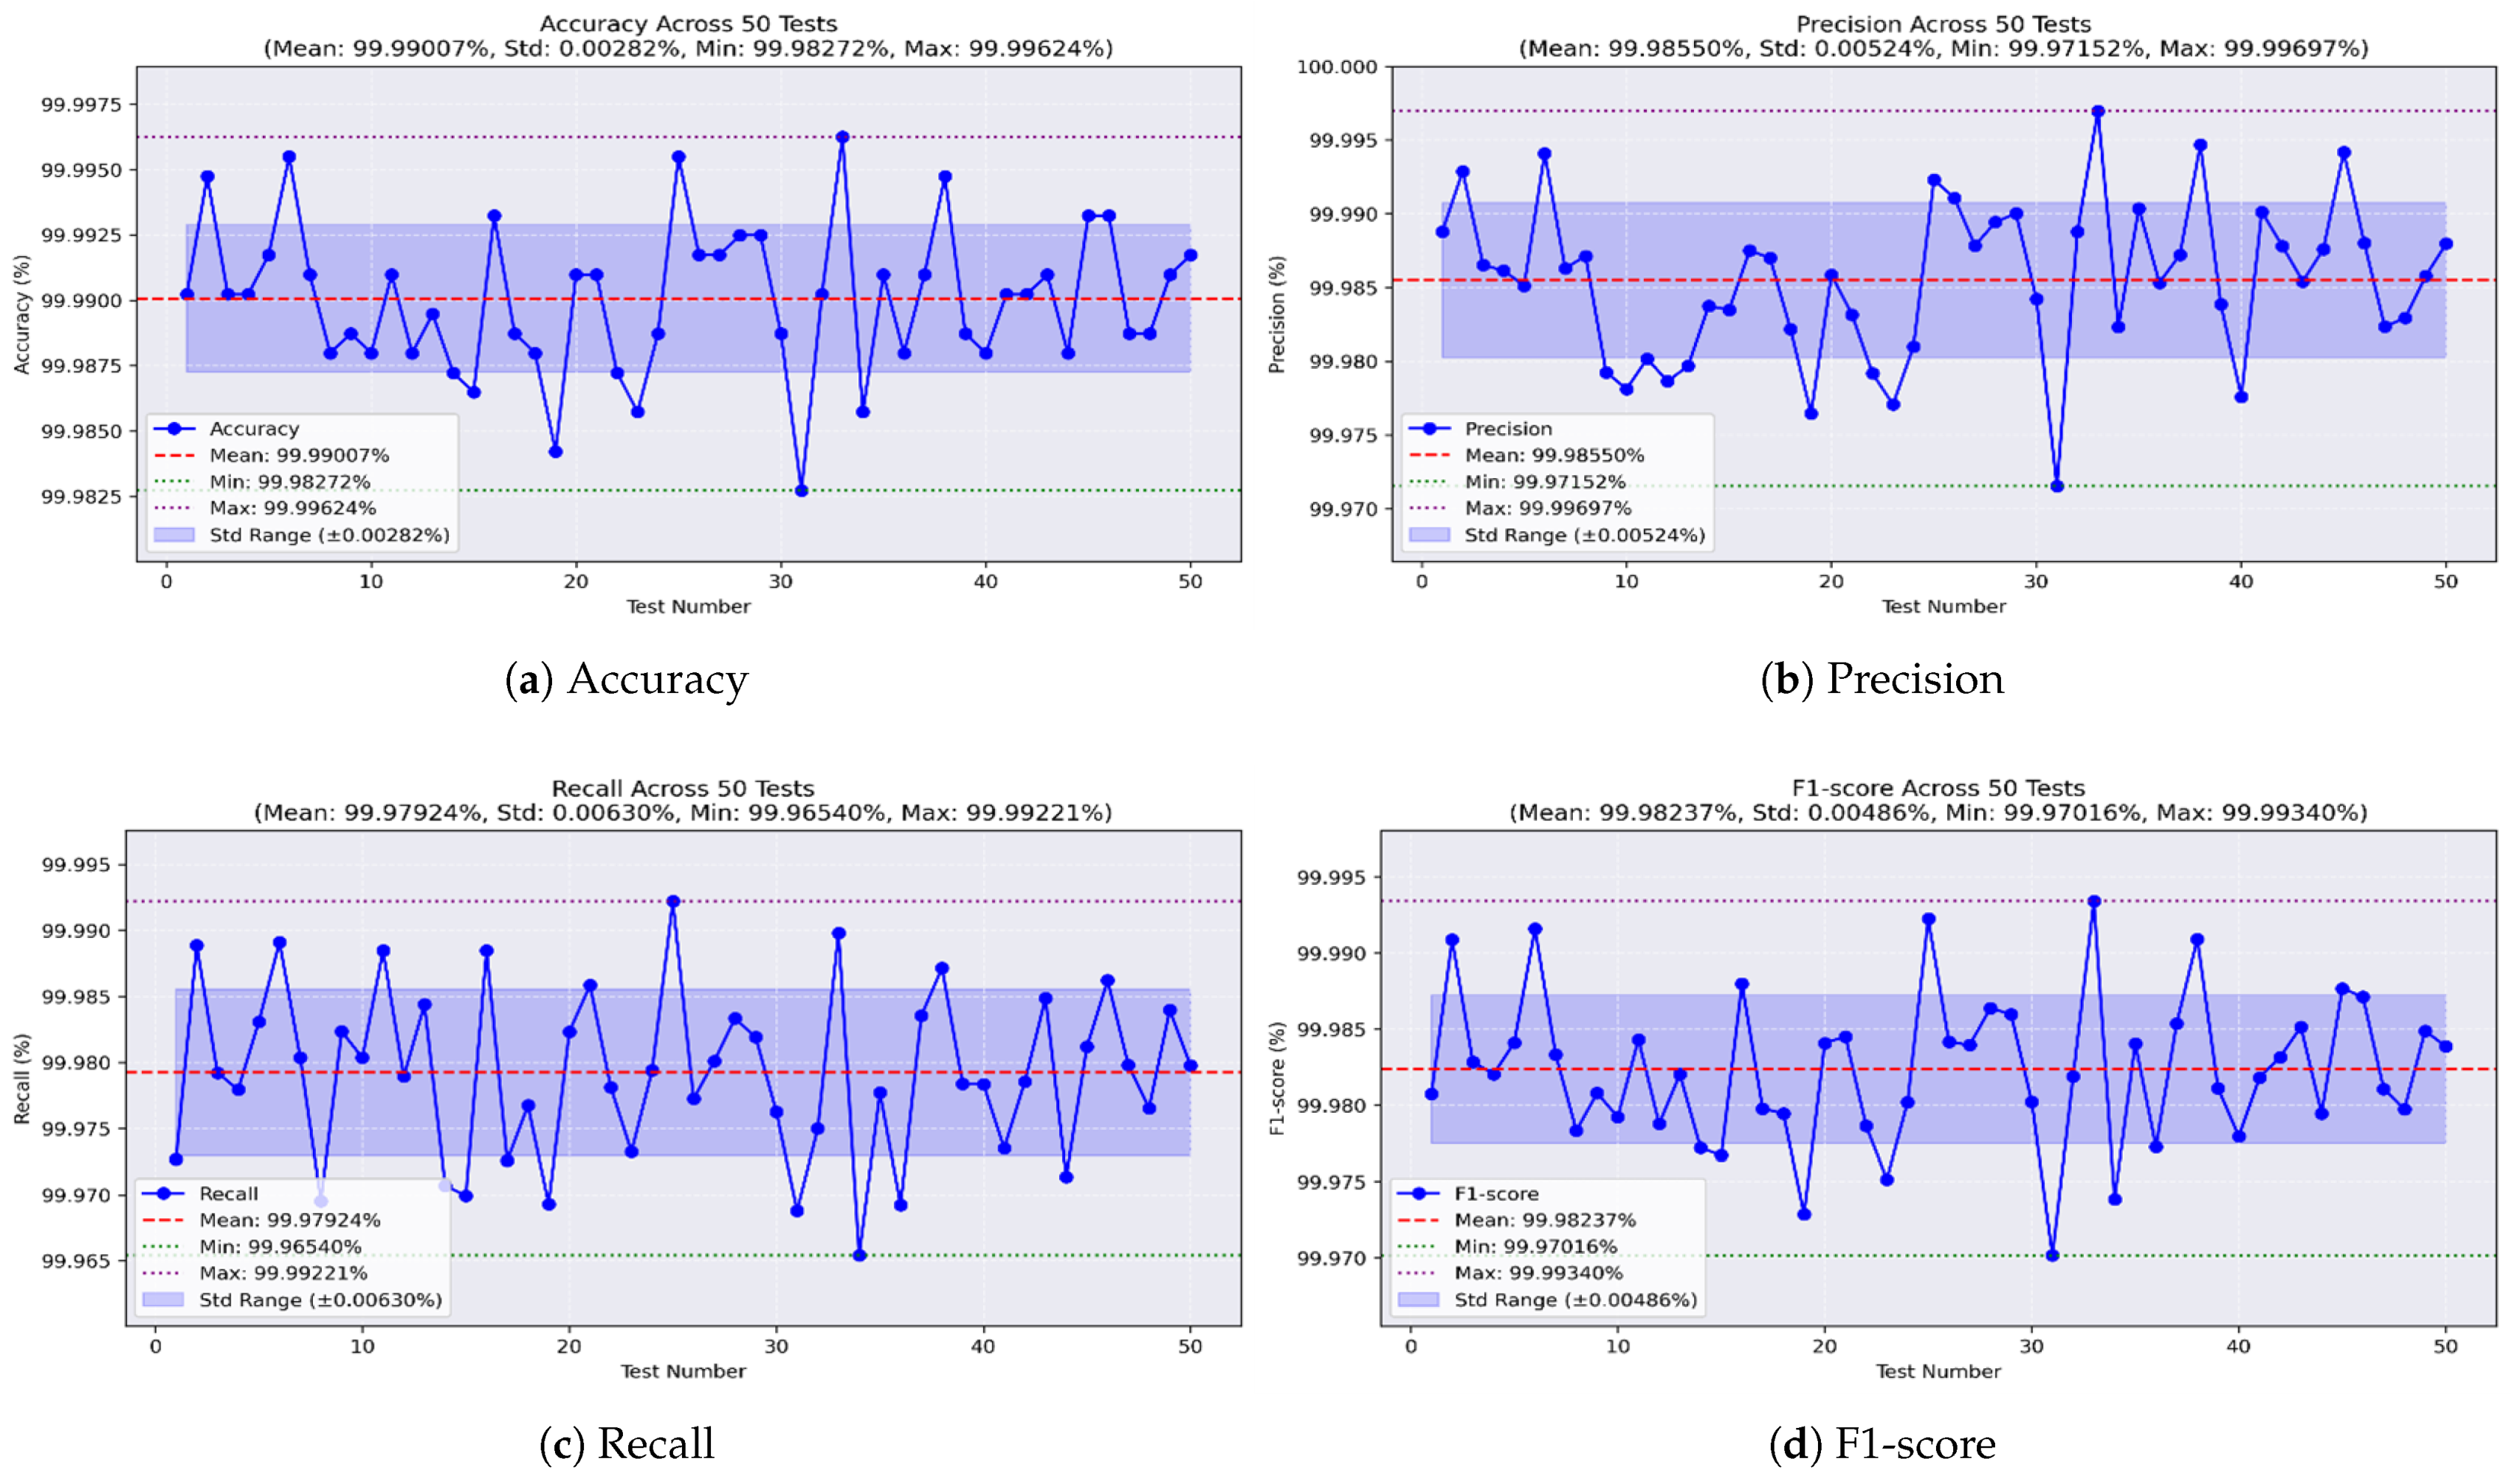
For the random forest model,
Figure 15a shows an impressive accuracy, reaching a maximum of 99.996% and a minimum of 99.982%, averaging 99.99% with a very low STD of ±0.002.
Figure 15b shows the precision values, ranging from 99.971% to 99.996%, with an average of 99.985% and a low STD of ±0.005. The recall, shown in
Figure 15c, reached a maximum of 99.992% and a minimum of 99.965%, with a mean of 99.979% and a stable STD of ±0.006. Furthermore, the F1-score achieved a best value of 99.993%, a worst value of 99.97%, and an average of 99.982%, with an STD of ±0.004, as shown in
Figure 15d.
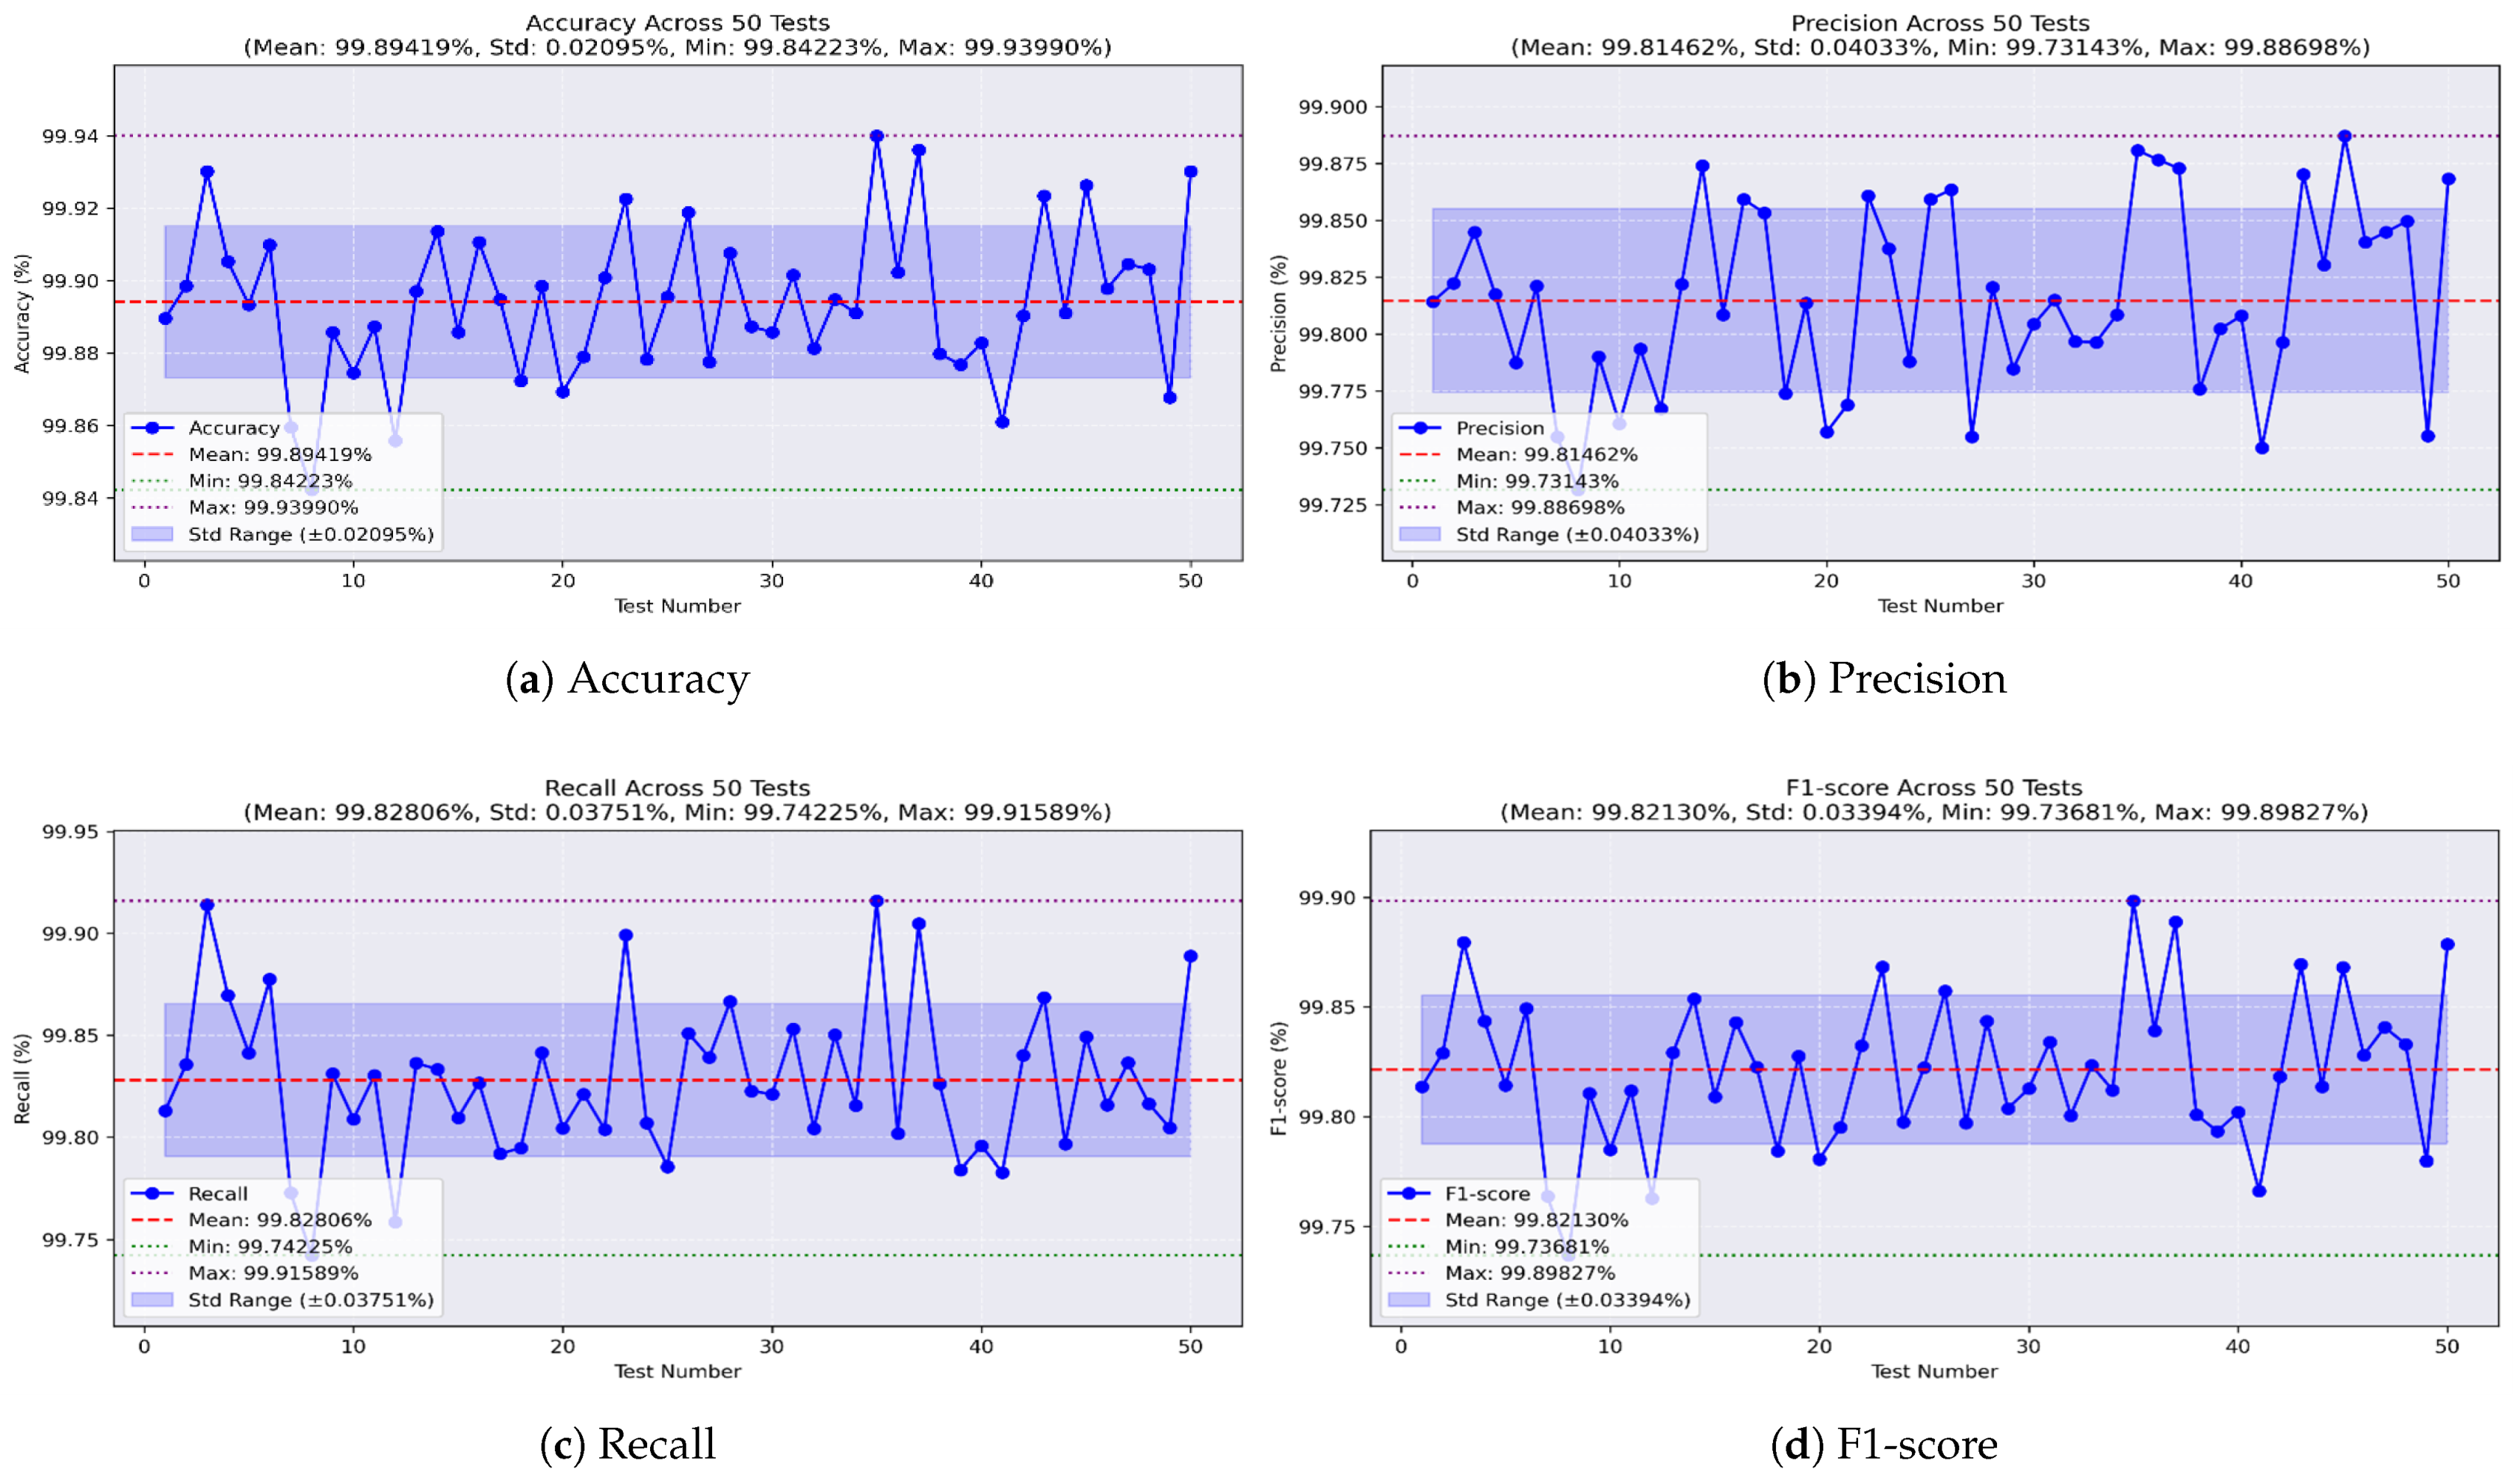
Lastly, the XGBoost model was found to be the least effective. As shown in
Figure 16a, it achieved a best accuracy of 99.939% and a worst of 99.842%, with a mean of 99.894% and an STD of ±0.02. Precision, shown in
Figure 16b, ranged from 99.731% to 99.886%, with an average of 99.814% and an STD of ±0.04.
Figure 16c shows the recall values, with a maximum of 99.915%, a minimum of 99.742%, a mean of 99.828%, and an STD of ±0.03. Finally, the F1-score, illustrated in
Figure 16d, had a mean of 99.821%, reaching a maximum of 99.898% and a minimum of 99.736%, with an STD of ±0.03.
As a consequence, all the models achieved high performance and demonstrated stable behavior. However, the random forest model delivered the highest overall results compared to the other models.
5.5. Feature Selection
In this section, we apply feature selection on the dataset comprising all the missions in order to extract the relevant features that reduce model complexity while maintaining the performance. Therefore, for each model, we set a threshold of 0.05 as the feature relevancy score and created
Table 13 to describe the status of each feature with respect to this threshold. Consequently, the features PRN, DO, PD, CP, and TCD exceed the threshold score and will therefore be preserved. Additionally, we observe that C/N0 is considered important for both the random forest and XGBoost models but not decision tree. Thus, we retained it as a relevant feature.
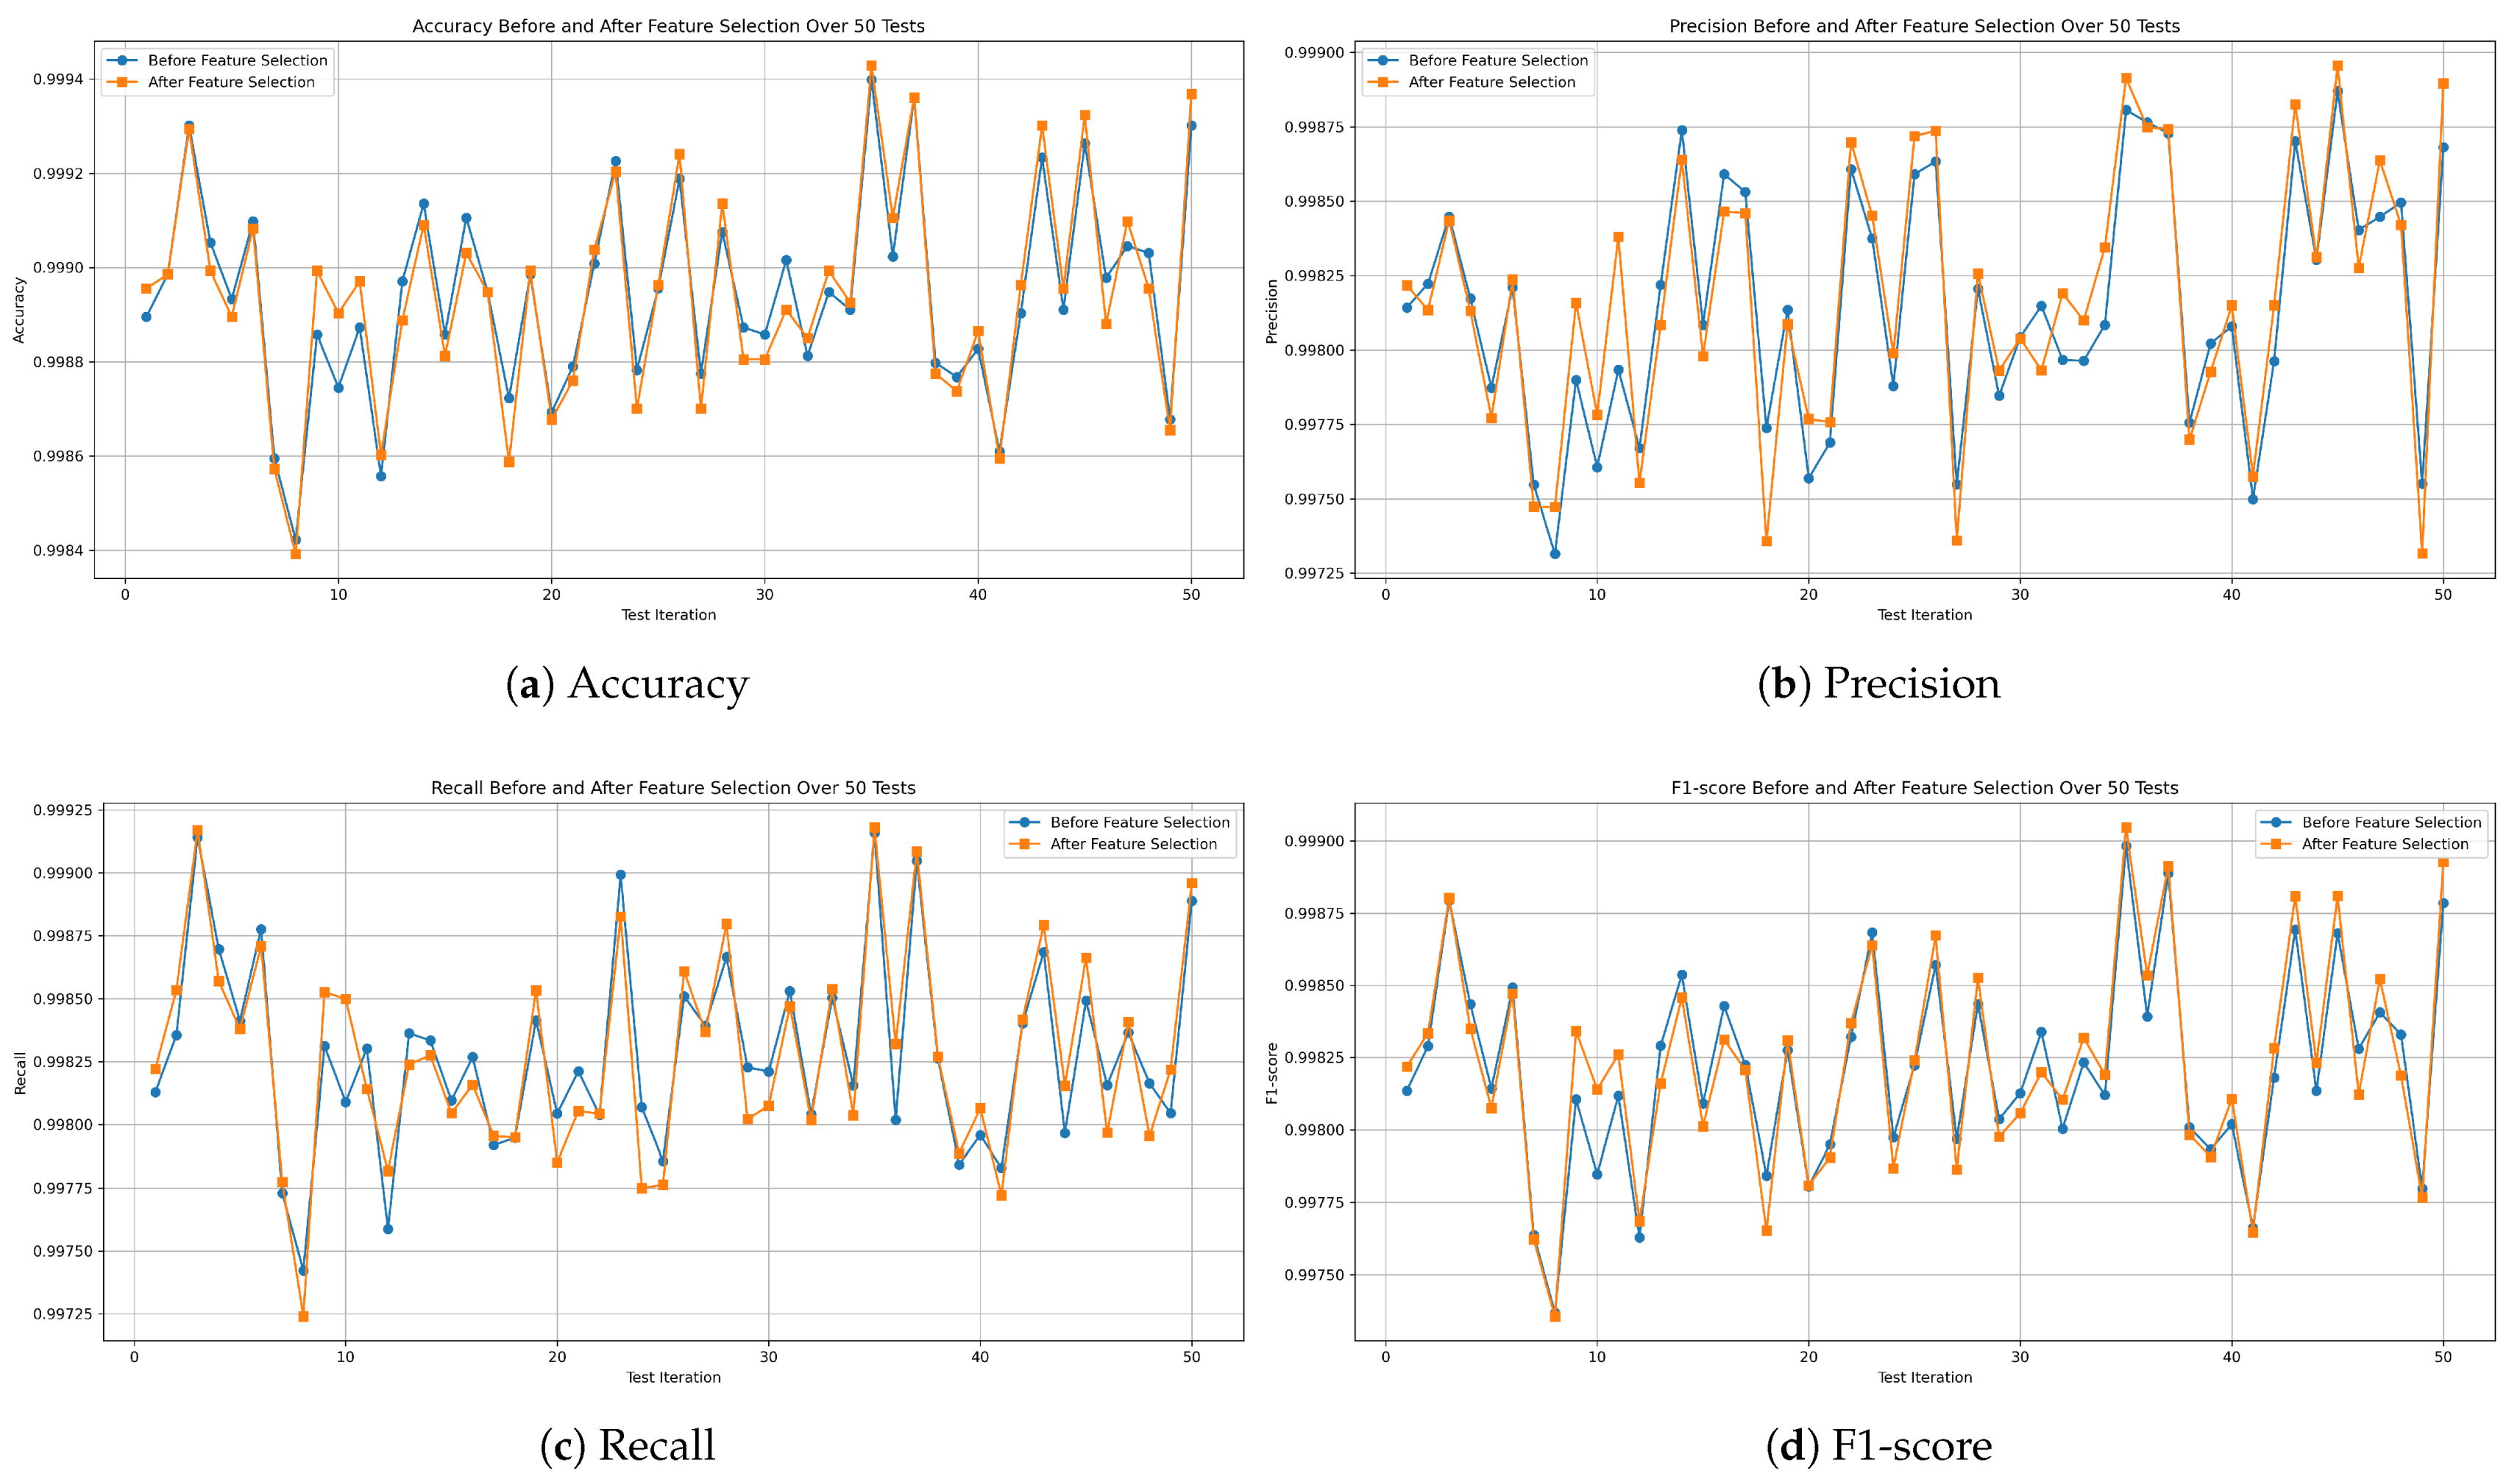
We ran 50 independent tests of our ML models on the all-missions dataset after the application of feature selection. The results obtained were subsequently summarized. The decision tree model acquired an average accuracy of 99.976%, a precision of 99.962%, a recall value of 99.947%, and F1-score of 99.954%. Random forest achieved 99.99% accuracy, 99.984% precision, 99.98% recall, and 99.982% F1-score. Finally, XGBoost obtained an average accuracy of 99.894% and precision of 99.817%; for the recall value, it obtained 99.828%, and F1-score of 99.822%.
Figure 17,
Figure 18 and
Figure 19 demonstrate the evaluation metric behavior of our proposed decision tree, random forest, and XGBoost models, respectively. This information was captured at each iteration of the 50 independent tests before and after applying feature selection on the combined missions dataset. As a consequence, this experiment proves that the performance of the three models remains consistent even after applying feature selection.
For additional investigation, we compare the time required for each model to fit the training data before and after feature selection using a system with Python 3.9 running on an Intel Core i5-8365U CPU with 16 GB RAM. Therefore, It is clear from
Table 14 that the training time is reduced after discarding irrelevant features. However, among the models, random forest exhibits the longest training time, whereas decision tree demonstrates the fastest convergence.
To summarize, these experimental results prove the efficiency of our models despite the presence of class imbalance and various dataset sizes. The random forest ensemble model based on bagging emerged as the best-performing approach, consistently achieving the best scores across all the dataset parameters, succeeded by the basic decision tree model, while the XGBoost ensemble method achieved the worst results. The results breakdown is presented in
Table 15. However, the random forest model showed the longest convergence time, in contrast to decision tree, which was faster. The feature importance parameter provided by tree-based ML models allowed the extraction of the most significant features in detecting GPS spoofing attacks, namely PRN, DO, PD, CP, TCD, and C/N0, consequently reducing the processing time.
Furthermore, our approach, which explores a GPS characteristic dataset to perform multiclass classification of GPS signals using tree-based models, outperforms the state-of-the-art methods based on binary classification [
36] and those leveraging satellite imagery datasets [
30] for detecting GPS spoofing attacks on UAVs. As shown in
Table 16, X refers to studies that do not consider multi-attack classification, while ✓ performs multi-attack classification.
5.6. Open Challenges
The promising findings presented by our approach still have significant limitations since the utilized dataset comprises simulated spoofing attacks. Such environments do not reflect the full complexity and uncertainty of real-world spoofing, which may not capture the impact of such a threat. Cyber-adversaries may employ adaptive, stealthy, or coordinated strategies that are difficult to reproduce in structured simulations. Furthermore, there exist external factors that may affect the performance of our ML models, which are not expressed in the dataset; these include urban obstructions, atmospheric disturbances, and electromagnetic interference. Therefore, generalizing our proposed approach to production UAV systems may be impractical. Consequently, it is essential to explore real-world datasets with more sophisticated and dynamic spoofing methods to validate UAVs’ resistance against GPS spoofing attacks.
Another critical issue relates to post-detection strategies. The current studies based on machine learning lack techniques enabling UAVs to predict their position and maintain navigation autonomy when reliable GPS signals are absent in order to prevent mission failure. Furthermore, the existing models are often trained on static datasets and lack adaptability to evolving spoofing tactics and dynamic environmental conditions. Developing adaptive and self-learning models that can continuously be updated based on real-time environmental feedback is crucial for improving the resilience of UAV navigation systems.
Consequently, it is imperative that researchers tackle these challenges in the future to provide resilient and operational GPS spoofing defense systems capable of ensuring the safety of UAVs in adversarial environments.
6. Conclusions
In this study, we tackled one of the most prevalent failures related to UAVs’ aerial navigation system, known as a GPS spoofing attack. Indeed, malicious GPS signals may disrupt UAV navigation systems, causing damage. In our study, we worked on a well-known dataset in this area. We extracted data sequences from three missions with different sizes. We handled thirteen features collected from eight channels of a GPS receiver. Then, we evaluated the efficiency of tree-based classifiers, namely decision tree, random forest, and XGBoost, over numerous independent tests in classifying authentic GPS signals against simplistic, intermediate, and sophisticated spoofed signals. Additionally, we leveraged the feature importance attribute of our tree-based models to extract the relevant features in detecting such attacks. Very interesting results were demonstrated by the random forest model, achieving an average accuracy of 99.99%, outperforming the existing methods in the literature. In addition to that, we were able to distinguish precisely between the attack types compared. This finding is very different from those in the literature. Indeed, none of the studied works were able to detect the attack type. However, despite the contribution provided in this work, many challenges require further investigation. In our future work, we intend to assess the generalization capability of our proposed models tuned on simulated GPS spoofing data, with real-world GPS spoofing attacks. We also aim to investigate mitigation spoofing mechanisms in order to help UAVs manage the security of their navigation.


