7.3. Significance of Password Variety
We first assessed the statistical significance of password composition variety between the SSH/Telnet, HTTP (valid requests only), and leaked password datasets (
Table 14). We performed pairwise chi-square tests on normalized percentual category data between the samples, as visualized in
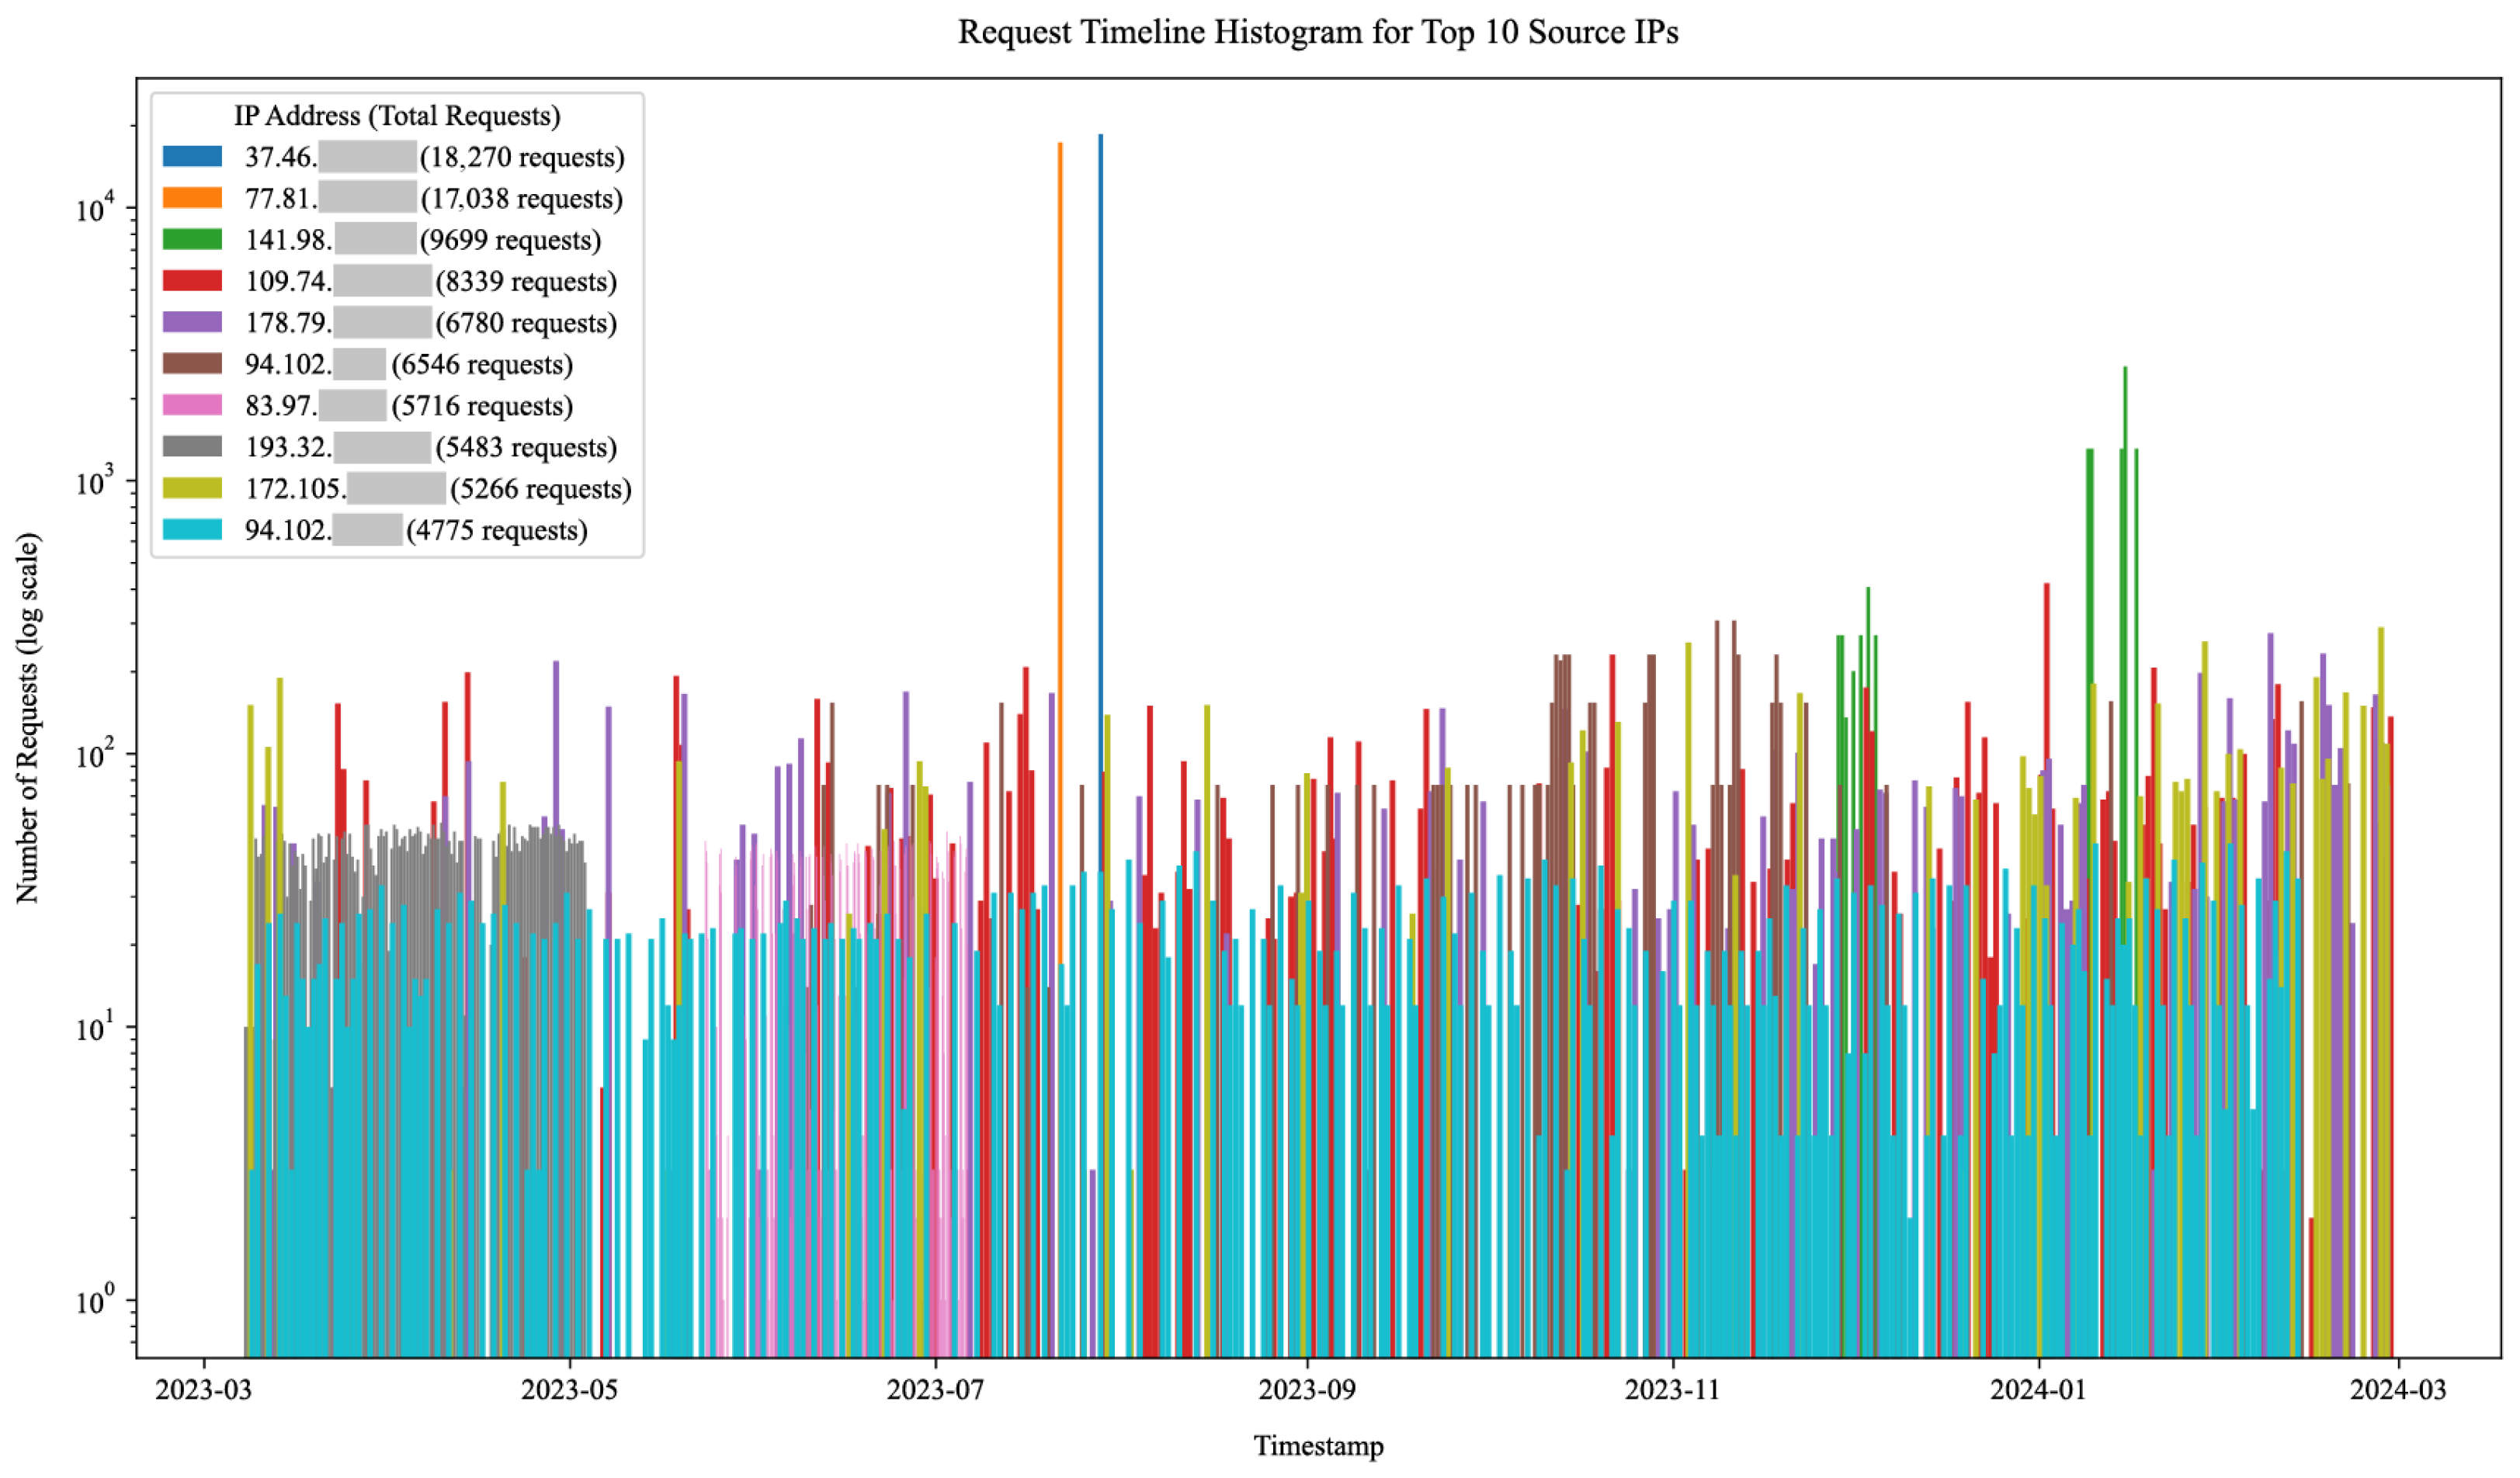
Figure 11,
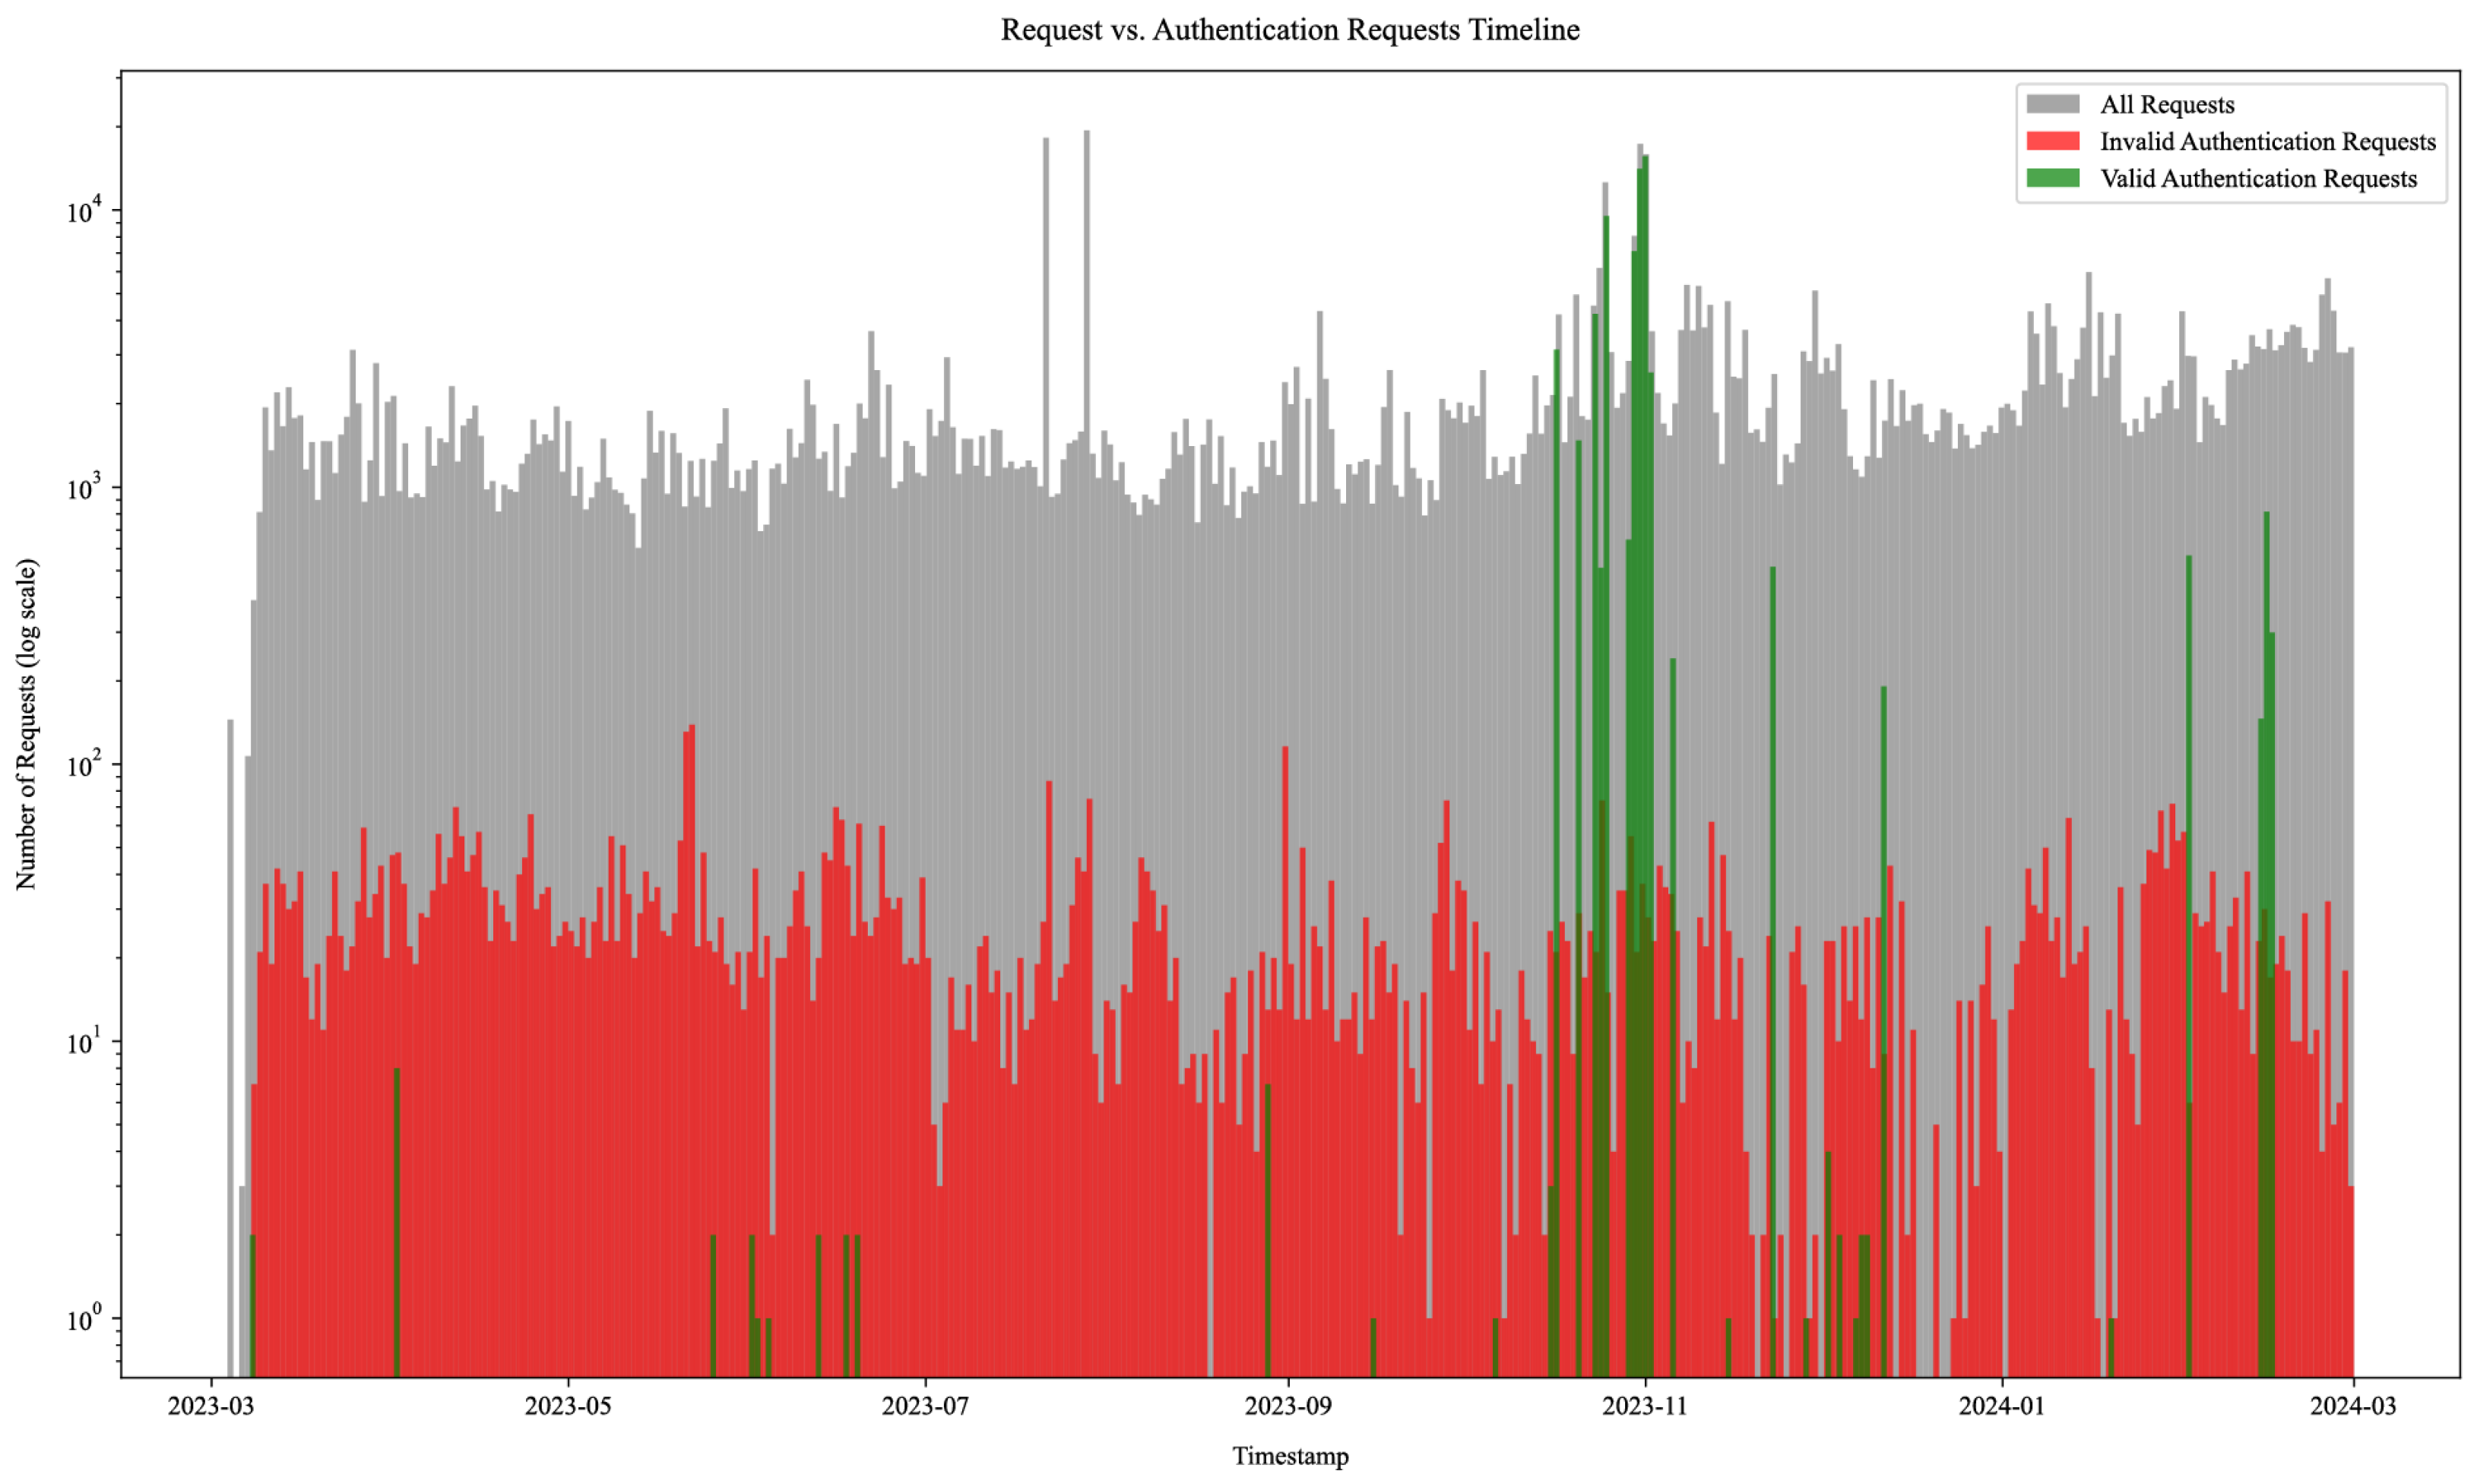
Figure 16 and
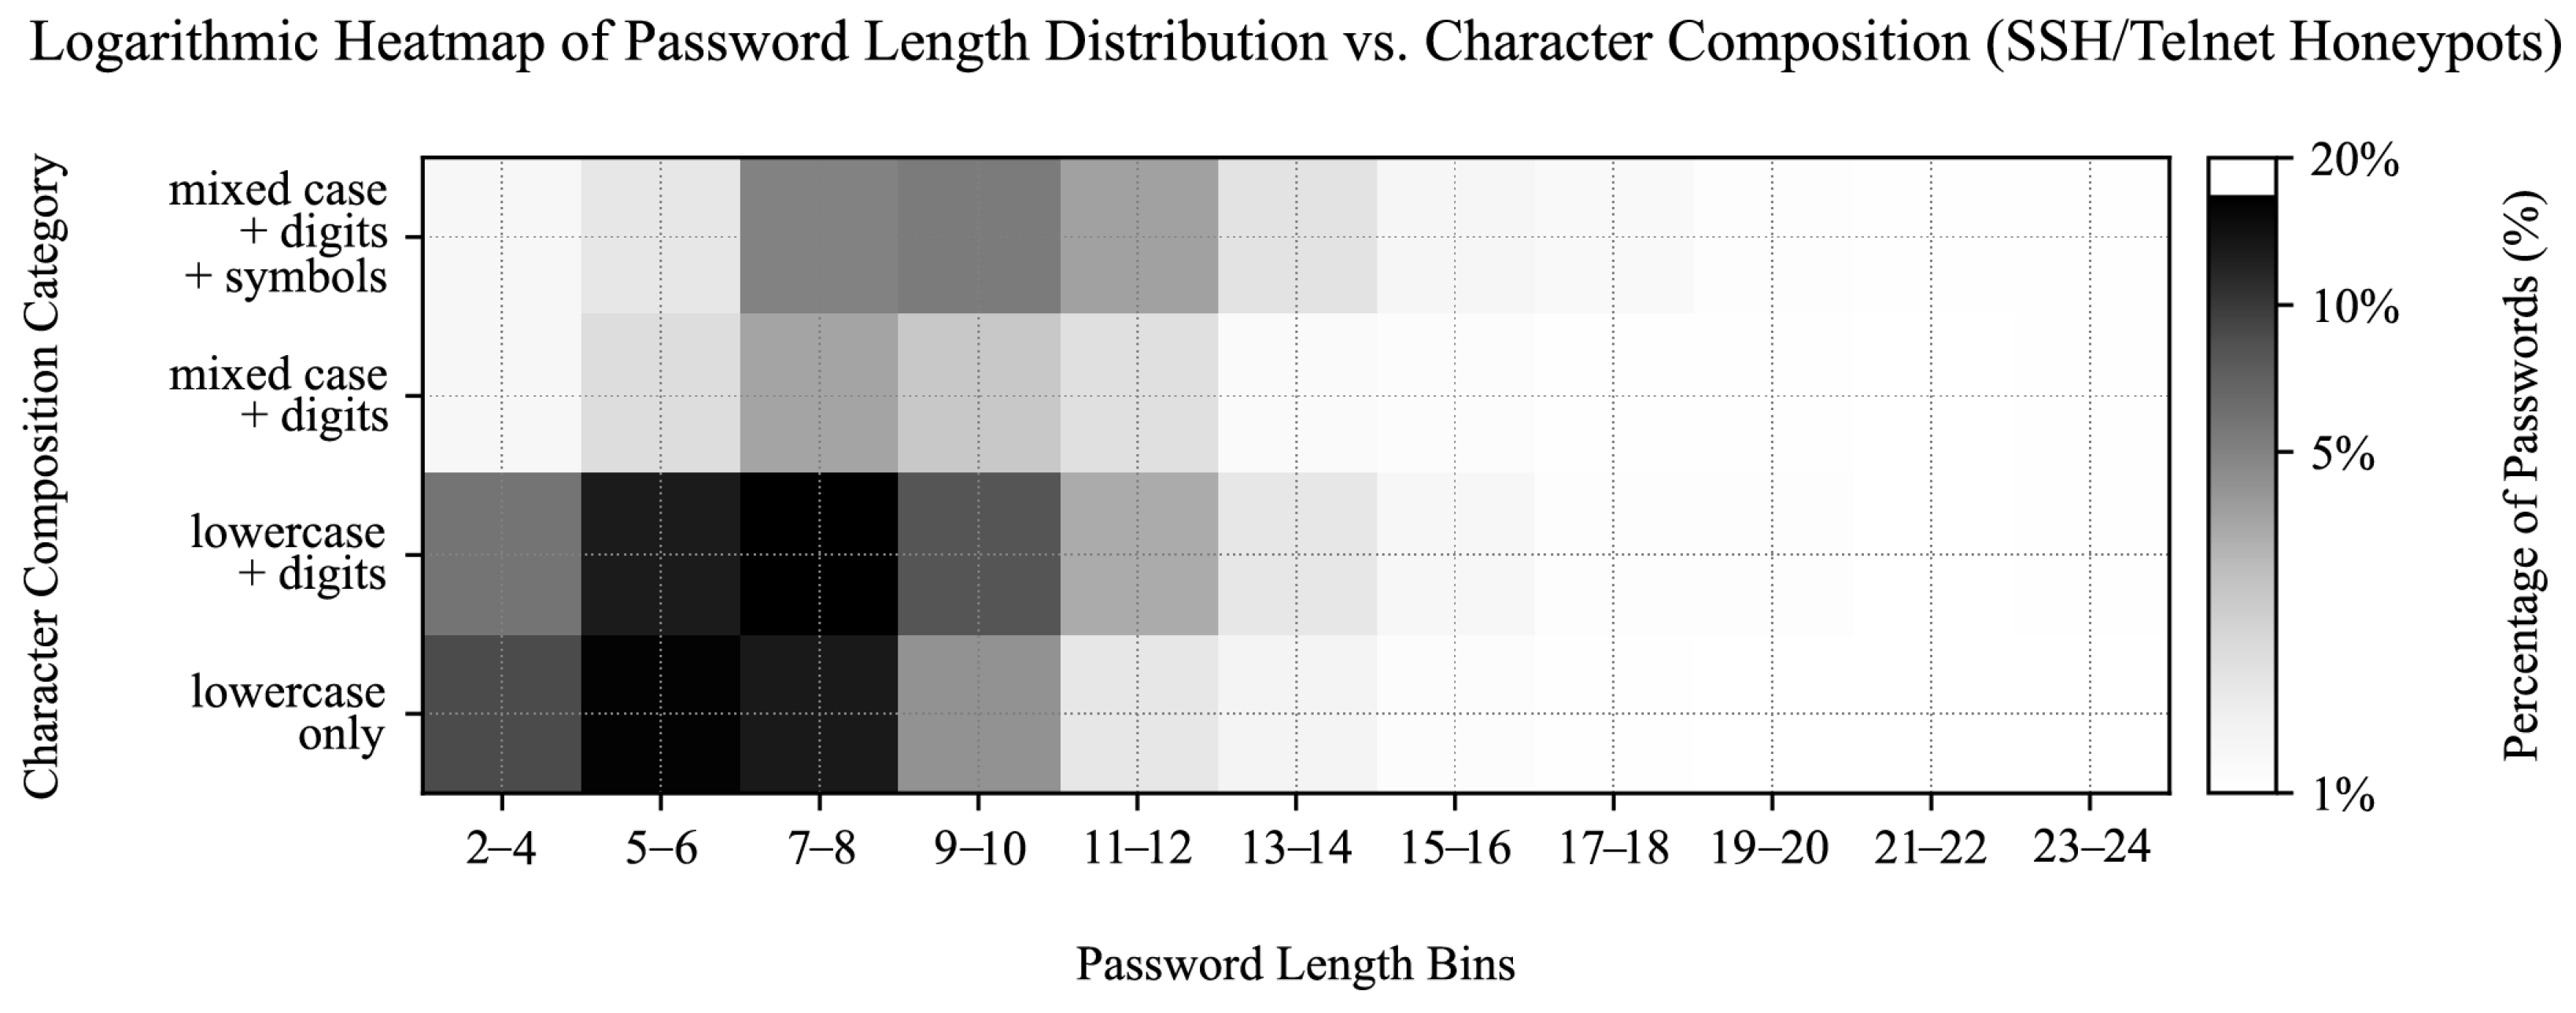
Figure 17.
The null hypothesis for each comparison was that the distributions of password lengths and character composition categories were the same between the datasets. In this case, the variables under comparison were password length bins and character composition categories, totaling 54 degrees of freedom ().
In all comparisons, the p-value (effectively 0.0) was well below the significance level , indicating that the observed differences between the datasets were statistically significant. However, due to the test’s sensitivity to large sample sizes, we also decided to estimate the effect sizes using Cramér’s V (), which were nearly negligible.
Next, we reviewed the password composition variety between the honeypot deployment sectors (critical infrastructure, academic institutions, and cloud services) for HTTP and SSH/Telnet honeypots (
Table 15).
The most substantial differences were found when comparing the HTTP dataset against the others. For the critical vs. academic comparison (HTTP: , SSH/Telnet: ) and critical vs. cloud comparison (HTTP: , SSH/Telnet: ), the high p-values indicated a failure to reject the null hypothesis, supported by negligible effect sizes with Cramér’s V values. Similarly, the academic vs. cloud deployment comparison (HTTP: , SSH/Telnet: ) showed almost identical distributions, with a Cramér’s V of 0.0172.
However, the datasets varied significantly in size, and large sample sizes can impact the test’s sensitivity to small variations. While we normalized the data to mitigate some of these concerns, the high degrees of freedom and uniformly high p-values indicate that such tests may have limited utility in distinguishing subtle differences between password distributions. Moreover, the assumption of independence among observations may not hold entirely, given the large potential for password reuse across attacks.
In terms of size, HTTP honeypots in the critical sector collected 632 passwords, compared to 30,152 and 31,007 passwords collected by HTTP honeypots in academic and cloud deployments, respectively. SSH and Telnet honeypots in academic environments collected 11,518,543 passwords, whereas SSH and Telnet honeypot cloud and critical sector deployments collected 5,293,968 and 1,057,708 passwords, respectively.
We conclude that while the datasets differ in their password length and composition patterns in inter-protocol deployments (e.g., SSH vs. HTTP) and in comparison with leaked data, the statistical analysis revealed no significant variations in password composition between any pair of sectors of the intra-protocol honeypot deployments (e.g., SSH/Telnet critical vs. SSH/Telnet academic, or HTTP critical vs. HTTP cloud, etc.). This, in turn, reflects the potential variations in the behavior and preferences of attackers (e.g., employment of different credentials stuffing wordlists and brute-force methods) when targeting different services but indicates similar password-guessing strategies across the honeypots of the same type (e.g., focusing on weak or systematic passwords), regardless of the targeted sector.
7.4. Dictionary, Leak, and Wordlist Coverage
To address the limitations of the above statistical tests, we focused on examining the origins of the usernames and passwords used in these attacks. We compared the collected datasets and introduced well-known wordlists and default account credentials to understand the the prevalence of dictionary entries and default (device or service) credentials in the real world, as well as the influence of widely circulated breached data on attacker strategies. Moreover, such comparisons may also allow us to attempt to indirectly estimate breached data contamination.
We compared the leaked data and honeypot password datasets against the preprocessed and deduplicated OPTED, WordNet, and Wiktionary (English) dictionaries, containing 111,597, 147,478, and 1,269,204 unique entries, respectively. We provided the diversity (deduplicated) and frequency (non-deduplicated) cross-comparisons between the dictionaries and the credential datasets in terms of full string matches as percentual coverages of datasets and Jaccard indices, also known as Intersection over Union (IoU). The results are displayed in
Table 16 (usernames) and in
Table 17 (passwords).
The results highlight the overlap between some of the collected credential datasets and modern dictionary-based wordlists, emphasizing the role of common words in username and password choices. For HTTP usernames, 37.95% of all unique username entries attempted during honeypot logins also appeared in the English Wiktionary. However, these entries only represented 0.05% of all unique words existing in the English Wiktionary. Moreover, the data reveal that many username attempts were often repeated, with 63.60% of total (non-unique) attempted username entries also matching an English Wiktionary entry.
SSH/Telnet usernames also exhibited great reuse, with 86.85% of all attempted usernames on honeypots matching an English Wiktionary entry. However, when deduplicated, only around 10.86% of unique SSH/Telnet usernames matched a word in the Wiktionary, covering 0.85% of its total entries (or over 5.02% of all WordNet entries). In both cases, the coverages are much smaller when the username sets are compared to the smaller WordNet dictionary and practically non-existent when compared to the much older OPTED dataset, indicating substantial differences between the dictionaries and their relevance.
Inversely, a large dataset of usernames from breached databases only matched 0.03% of its unique usernames against the Wiktionary, yet these matches covered nearly 37.50% of all words in the dictionary. While this inversion is expected due to the very large differences in dataset sizes, it also visualizes the frequency of dictionary-based attacks while at the same time showcasing their practical limits (in terms of small joint dictionary coverage during the full one-year of the attacks) or reveals the attacker wordlist specialization (e.g., many attackers employing only a select subset of dictionary words).
The calculated IoU values are given as a provisional metric for the similarity of unique sets. Due to the vast differences in dataset sizes, these values are very low, limiting the metric’s usefulness and indicating a large diversity between sets.
The password datasets followed a similar pattern, with 26.69% of unique HTTP passwords appearing in Wiktionary and covering 0.18% of its contents. SSH/Telnet passwords showed lower direct overlap but still exhibited 20.54% Wiktionary and 16.5% WordNet matches of the total password attempts. The leaked passwords had a substantial presence in the dictionaries, with 50.19% coverage of WordNet and 32.12% coverage of Wiktionary. The inverted coverages again indicate that the attackers frequently rely on partial subsets of English dictionaries to perform their attacks (or are unable to test more of dictionaries’ contents), whereas users, on the other hand, seldom employ unmodified dictionary words as passwords (yet cover much larger portions of dictionaries when doing so). We provided the passwords from all three datasets that most frequently matched the Wiktionary entries (
Table 18). Matches against some passwords, such as “qwerty,” “qwertyuiop,” and “asdfghjkl,” indicate the wide span of word entries in the Wiktionary.
We also compared the collected datasets to the Russian and German Wiktionaries. We extracted 466,924 unique words in Cyrillic from a Russian Wiktionary and 871,444 unique words from a German one. Set coverages and IoU metrics for these comparisons are given in
Table 19 and
Table 20. Non-deduplicated dataset comparisons were skipped where set intersections contained no elements. Also note that the English, Russian, and German Wiktionaries contained some intersecting elements (English ∩ Russian: 2 elements, IoU: 0.00, coverages: 0%; English ∩ German: 15,182 elements; IoU: 0.01, coverages < 1.75%; German ∩ Russian: 1 element, IoU: 0.00, coverages: 0%).
Next, we compared the collected credentials against five widely used wordlists: FastTrack (262 entries), a small set from the Social-Engineer Toolkit; John The Ripper (3545), focused on weak and common passwords; Nmap (4999), containing default credentials for network services; RockYou (14,344,392), a massive dataset from a well-known breach; and Wifite (203,808), targeting likely Wi-Fi and general authentication passwords.
Instead of opting for heavier collections (e.g., SecLists, Weakpass, and Probable Wordlists), each of these wordlists provided a unique perspective, ranging from small and targeted lists optimized for penetration testing (FastTrack, John, Nmap) to larger datasets derived from real-world password leaks (RockYou). Cross-comparison results are given in
Table 21. They indicate that widely used wordlists, such as John, Nmap, and RockYou, capture a significant portion of real-world passwords, with up to 100% of their entries appearing in leaked datasets. HTTP passwords show particularly high overlap with John (25.4% coverage, 0.22 IoU) and Nmap (58.06% coverage, 0.57 IoU), suggesting attackers frequently rely on these lists. SSH passwords have lower overall coverage, reflecting more variation in credential guessing.
We also compared the datasets with the default credential lists (pairs of usernames and passwords) obtained from sources listed in
Section 3.3. The comparison results are given in
Table 22.
These results reveal that credential pairs from the selected default account lists were used when attacking SSH, Telnet, and HTTP honeypots. Notably, the Mirai account list was used in its entirety when attempting connections to the SSH/Telnet honeypots. However, the A coverage values suggest that these lists were too limited, as attackers tested many other credential combinations as well. Similarly, while various well-known default credentials appeared in the leaked dataset, they accounted only for a small and insignificant fraction of the overall data.
Moreover, a detailed examination of the Nessus vulnerability scanner’s account check plugin revealed that the tool attempts to perform SSH and Telnet logins using randomly generated credentials of eight characters in length to assess whether the remote system accepts arbitrary login attempts. The plugin’s description attributes this check to the prevention of false positives, explicitly referencing Mocana SSH within the code. However, we hypothesize that this functionality may also serve as a rudimentary mechanism for identifying less sophisticated honeypots.
Lastly, we directly compared the HTTP, SSH, and Leaks datasets against each other. We compared full-string matches between usernames, passwords, and credential pairs. When comparing username data with leaks that included email addresses, we extracted the username handles from the emails and compared those directly.
The results in
Table 23 reveal that 90.35% of usernames and 72.52% of passwords used in HTTP attacks have been reused in attacks on SSH or Telnet honeypots. Moreover, 95.97% of usernames used in HTTP attacks and 83.45% of usernames found in SSH/Telnet attacks, as well as 91.27% of passwords found in HTTP attacks and 67.40% passwords found in SSH/Telnet attacks, also existed as entries in the leaked credentials database. However, these numbers were significantly lower when comparing credential pairs, where only 16.18% of HTTP username and password pairs were also used in SSH/Telnet attacks, 65.91% of HTTP accounts, and 25.24% of SSH/Telnet accounts also existed in leaked databases. The total number of attempted unique HTTP and SSH/Telnet credential pairs amounted to less than 0.01% of all unique accounts in the leaked database.
7.5. Personal Information, Patterns, and Mutations
We used a regular-expression-based approach to identify the potential personally identifiable information in the honeypot-collected datasets. Focusing primarily on email addresses and phone numbers, we identified 86 credential pairs in the SSH/Telnet dataset where the username followed a valid email address format. In contrast, no email-like usernames were found in the HTTP dataset.
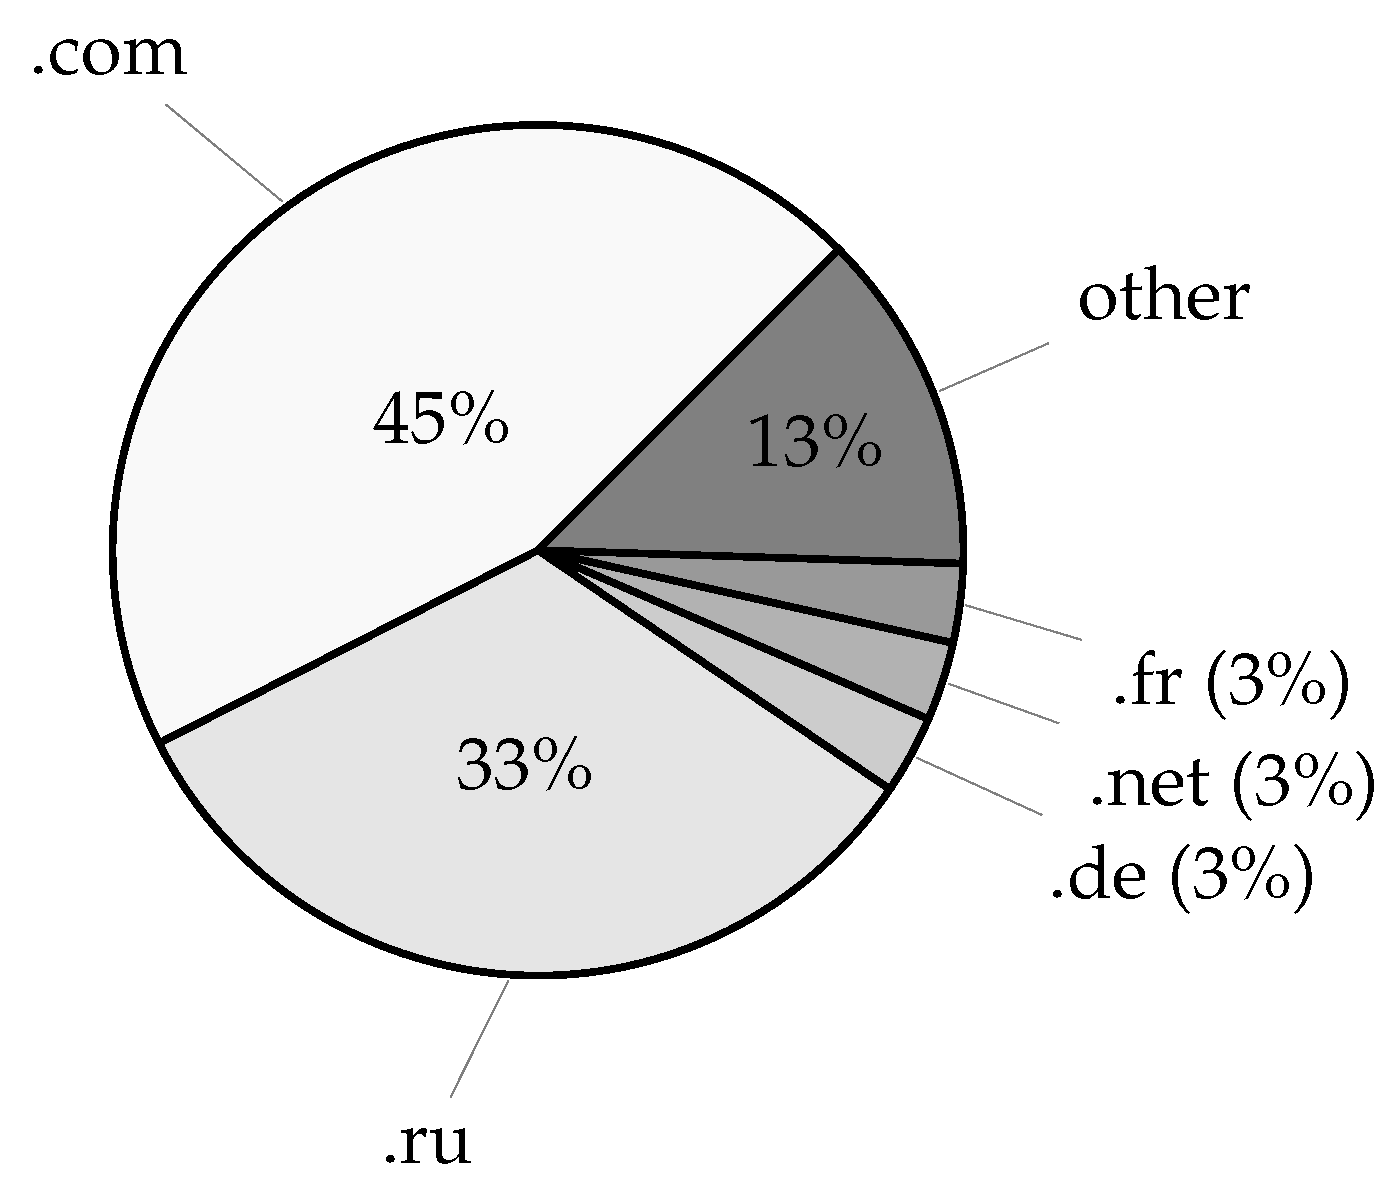
Among the matched SSH/Telnet account email addresses, 34 were unique, and each contained a distinct username handle. In total, the addresses were hosted on five different domains, all of which were registered under the .com TLD. The domain with the most email address matches appeared with 30 unique username handles, whereas the remaining 4 domains only had a single occurrence each. Only one of the addresses belonged to a widely recognized email provider, gmail.com.
To refine our domain-based matching of these accounts against the leaked credentials database, we began by excluding the gmail.com match (as we already knew that numerous Gmail accounts were present in the leaks) and analyzed the remaining four domains. This process revealed 2704 email address entries across 2 of the 4 remaining domains.
Importantly, we found one email address that was used as a login username in SSH honeypot attacks and was also present in the leaked credential database. This particular address appeared with five different password entries in the leaks database, none of which matched the three passwords attempted during the SSH logins. Notably, the attempted SSH passwords followed a string concatenation pattern, where numerical digits were appended to a base loweralpha password.
Furthermore, to match the potential phone numbers appearing in the submitted HTTP and SSH/Telnet passwords, we applied the same detection methodology as outlined in
Section 4.6. Out of all received unique usernames, 1.25% of HTTP and 0.19% of SSH/Telnet usernames consisted solely of digits. For passwords, this amounted to 4.25% and 6.02% for HTTP and SSH/Telnet, respectively. These percentages stayed consistent when including other potential number formatting characters, such as space, dash, and plus symbol in the regex pattern. Using Google’s libphonenumber, we did not find any phone numbers directly conforming to the E164 format. However, we did match 11 usernames and 301 passwords amongst the HTTP dataset and 948 usernames and 23,395 passwords amongst the SSH/Telnet dataset, which exhibited the potential for valid phone numbers when prefixed with the correct country codes and/or applying minor formatting substitutions.
When comparing the keywalk patterns generated in
Section 4.4 with the HTTP and SSH/Telnet credentials datasets, we discovered that 0.87% of unique HTTP usernames and 0.83% of unique HTTP passwords matched a keywalk pattern. For the SSH/Telnet datasets, these numbers amounted to 0.5% of distinct usernames and 0.28% of distinct passwords. For Dvorak keyboard layouts, we matched 0.60% of HTTP usernames, 0.44% of HTTP passwords, 0.29% of SSH/Telnet usernames, and 0.13% of SSH/Telnet passwords. Inversely, only 0.44% of all generated keywalk patterns were found in the valid HTTP passwords dataset and only 4.53% in the SSH/Telnet password dataset. This indicates a significant drop in keywalk coverage compared to the 38% of all generated keywalks found amongst the leaked passwords. In terms of attempt frequency, the most commonly attempted HTTP password keywalk patterns are listed in
Table 24, and the SSH/Telnet passwords followed a rather similar distribution. For usernames, the majority of keywalking matches were only two (HTTP) to three (SSH/Telnet) characters in length, making them unlikely username choices. For passwords, the average matched keywalk pattern length was seven characters, closely resembling the length of real-world passwords.
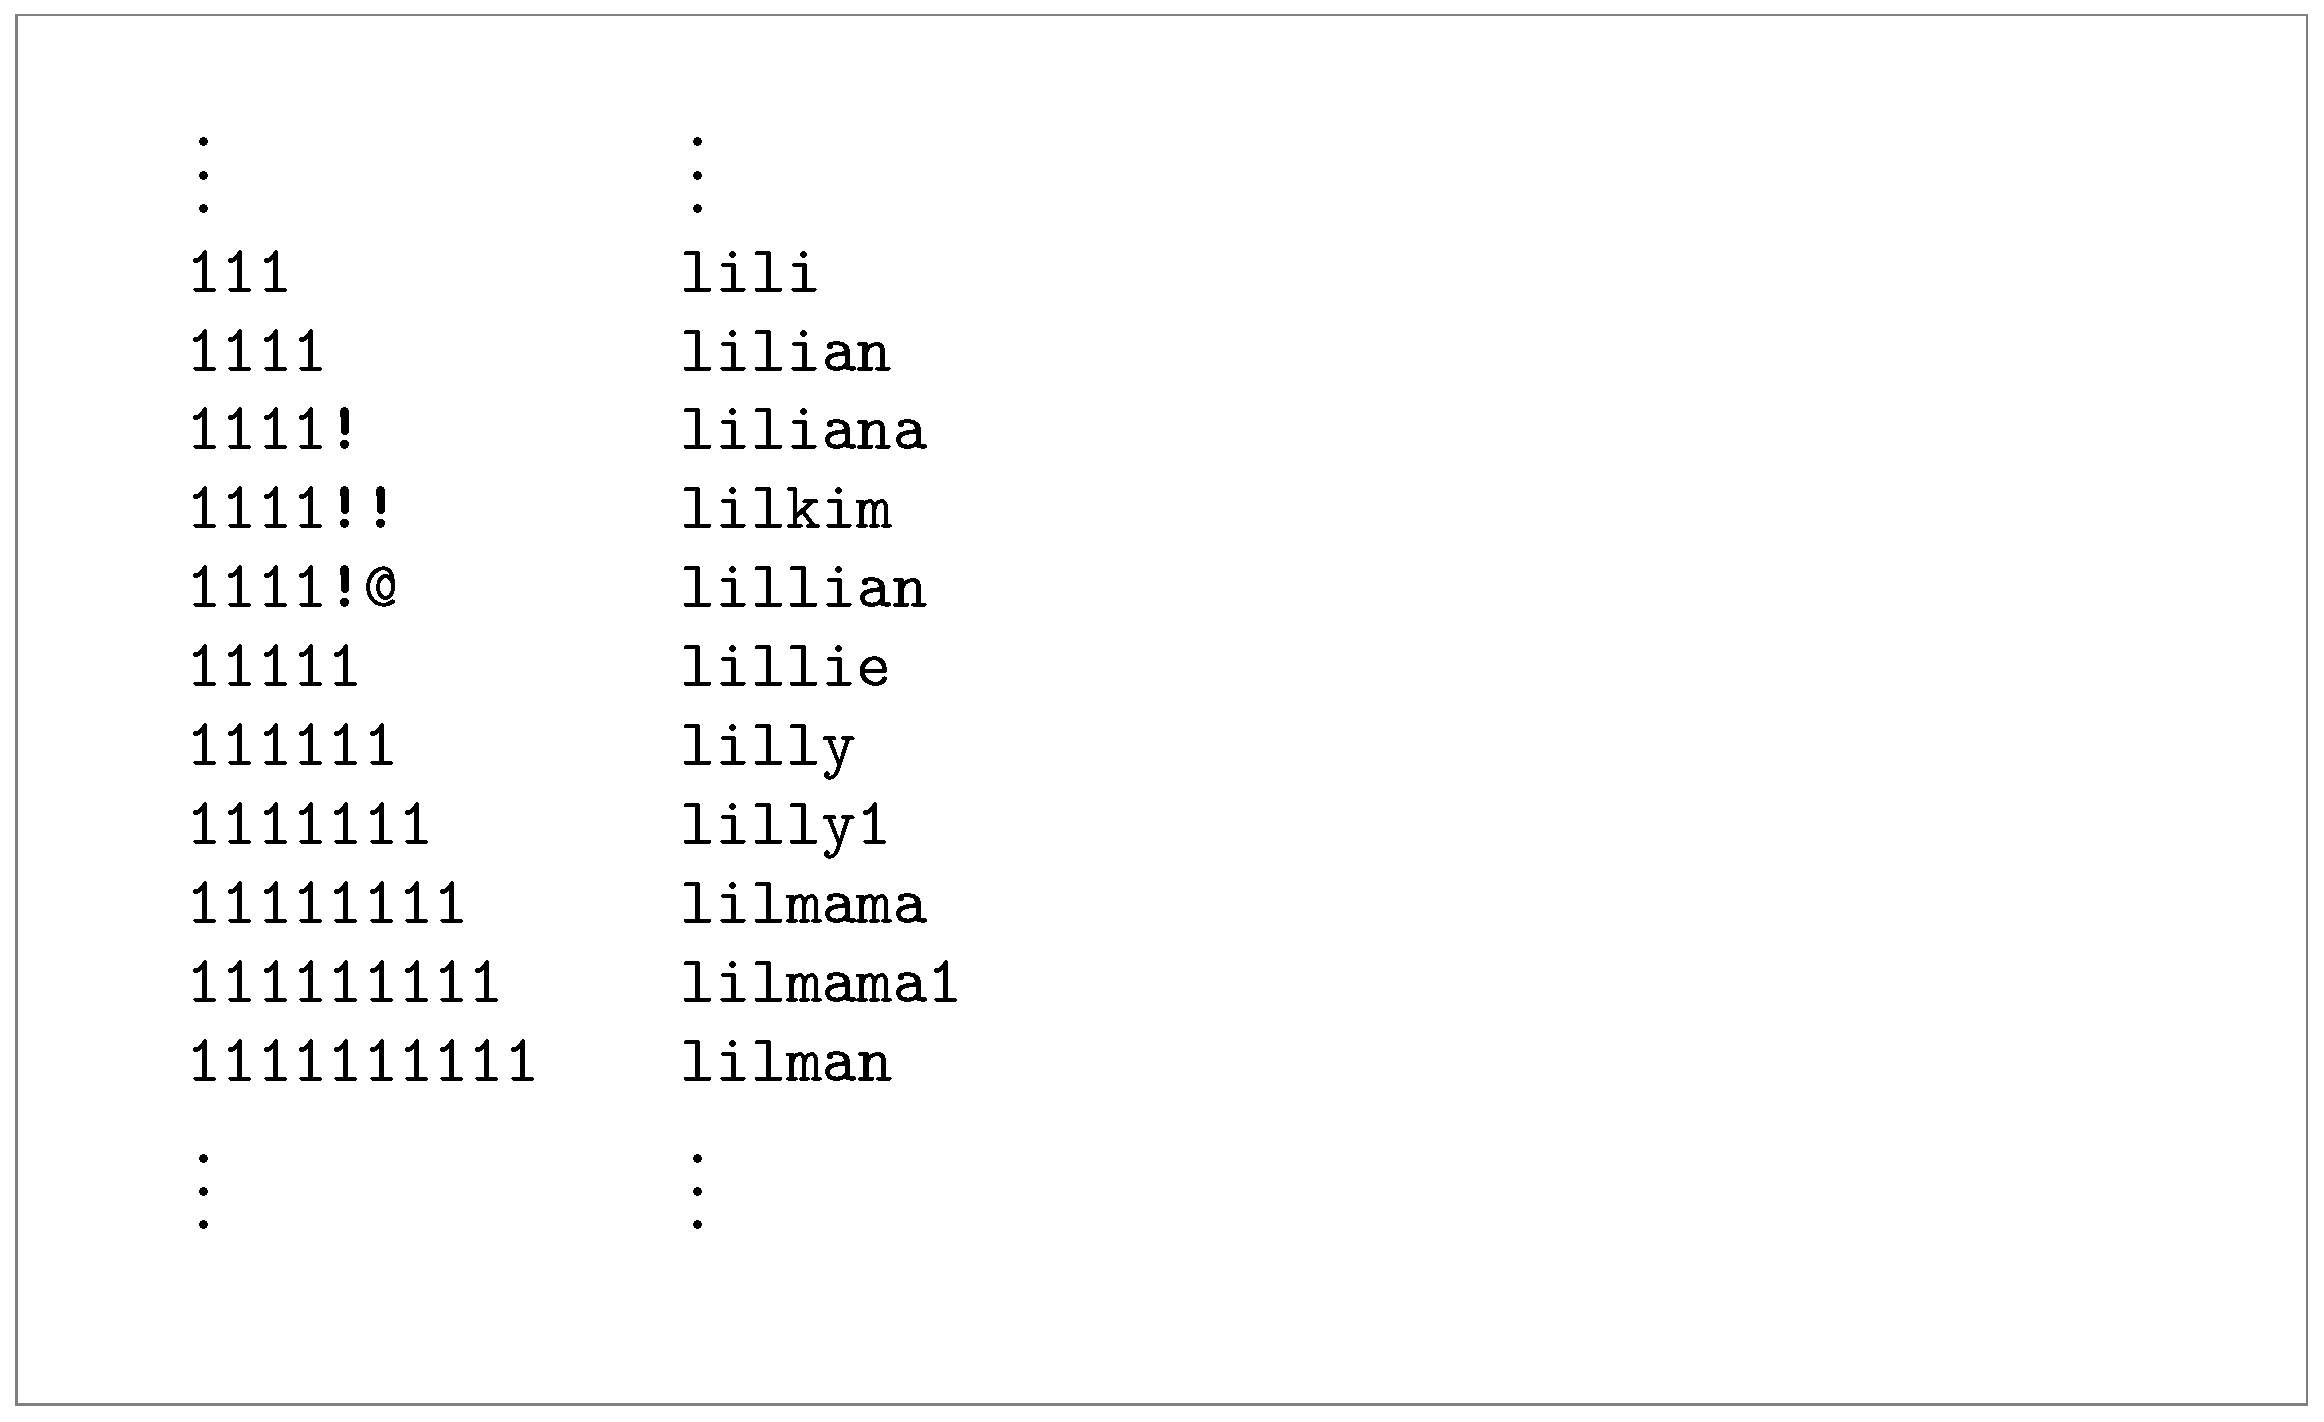
When reviewing password patterns, simple alphabetic sorting of all joint attempts captured on honeypots trivially reveals the generalized brute-force nature of the attacks (sorting excerpt in
Figure 18). However, such an approach hides the needle in the haystack even further, as it generalizes the attack data instead of focusing on specific attack characteristics, as in the previous analyses.
Additionally, we attempted to perform a rudimentary search-based password analysis to reveal any potential correlation between the user’s and attacker’s password choices and major world events. First, we reviewed how many usernames and passwords contained numbers representing years from 1950 to 2025 as substrings. In the HTTP dataset, 126 (0.20%) attempted login passwords (47 unique) contained a total of 37 unique year substrings. The majority of these matches consisted solely of digits, and only a few contained years appended to strings. The most commonly appearing was the year 2000, with 25 matches. The latest year in the dataset was 2020, with 13 occurrences. We did not find any year substrings in the HTTP usernames dataset, but we did find 5680 (0.03%) usernames containing year strings in the SSH/Telnet dataset (572 unique username values, 46 unique year numbers). The most commonly appearing year in the latter was 2015 (2674 appearances), followed by 2000 (786 appearances) and 2018 (369 appearances). The latest appearing year was 2024, with 15 occurrences. The vast majority of appearances were in the form of the concatenation of the year numbers to a loweralpha string.
Much larger year substring numbers were observed when analyzing SSH/Telnet passwords, where 5.94% of all passwords (1,075,788 attempts, 16,621 unique passwords) included a year number (spanning across all 76 years). Here, the most common substrings were 1987, 1986, and 1988, each with roughly 78,000 occurrences. The latest year was again 2025, with 419 occurrences. However, this large subset of matches only contained 126 entries (47 unique passwords) where the characters adjacent to year numbers were not digits, thus indicating that the majority of these matches came from purely numerical passwords. Moreover, only 95 attempts (37 unique passwords) contained four-digit-long years appended to the end of the string and 90 attempts (33 unique passwords) at the beginning. Out of the former, 16 unique passwords contained only the loweralpha character set with the year number appended, whereas out of the latter, only 12 prepended the year to a loweralpha-only string.
In the leaks database, we matched all 76-year substrings in 127,171,129 unique usernames (8.39%) and 88,446,354 unique passwords (8.02%). The vast majority of these credentials again included year matches with non-digit adjacent characters. From the leaked passwords dataset, 202,932,518 (5.07%) unique records were comprised of loweralpha characters and an appended year.
Next, we compared the leaks database against the top 230 Google Trends from the last decade (worldwide trending search keywords, case-insensitive, five characters or longer). There were very few substring matches amongst the attempted (non-unique) HTTP passwords. The top 10 included the following: “apple” (49 matches), “pokemon” (14), “hotmail” (14), “yahoo” (13), “samsung” (10), “google” (10), “lakers” (9), “cricket” (8), “youtube” (4), and “kickass” (4). Amongst the SSH/Telnet passwords, the most common substring match was again “apple” (14,834 attempts), followed by “google” (14,537), “video” (11,522), “samsung” (4589), “yahoo” (2227), “pokemon” (2159), “facebook” (1340), “lakers” (1246), “weather” (1060), and “amazon” (1034). There were also 322 username attempts containing “trump,” 163 containing “putin,” 63 containing “ukraine,” 60 containing “tiktok,” and 1 containing “coronavirus.” Amongst the HTTP usernames, the dataset only contained three login attempts with substring matches for “apple,” two attempts matching “samsung,” “video,” and “bing,” and one attempt containing “mail.” Amongst the SSH/Telnet usernames, the most common substring match was “games” (1838 occurrences), followed by “apple” (1470), “video” (147), “google” (113), “pokemon” (99), “tiktok” (70), “amazon” (52), “satta” (46), “samsung” (45), and “weather” (45). We also detected 12 login attempts with usernames containing “trump,” 5 containing “putin,” 2 containing “ukraine” and 1 containing “shein.” In the leaked username dataset, the most common substring match was “apple” (1,175,393 occurrences), followed by “games” (1,150,179), “google” (731,909), “yandex” (571,491), “video” (490,154), “facebook” (449,815), “amazon” (354,012), “yahoo” (347,768), “gmail” (317,825), and “hotmail” (302,382). We also detected relatively high occurrences of “pokemon” (212,049), “roblox” (200,554), “putin” (183,290), and “twitter” (152,849), whereas “craigslist” (11,744) “coronavirus” (712), and “chatgpt” (102) were matched far less often. In the leaked passwords dataset, the most frequently occurring substring was “gmail” (17,340,500 occurrences), followed by “hotmail” (16,149,820), “yahoo” (15,801,444), “apple” (1,967,599), “google” (1,235,855), “samsung” (1,204,717), “yandex” (1,200,807), “pokemon” (975,101), “facebook” (691,428), and “outlook” (640,507). “Putin” was a substring in passwords 83,876 times, “fortnite,” “ukraine,” and “deadpool” rounded off around 53,000 times, whereas “coronavirus” and “covid-19” were mentioned less than 3000 times. Given the obvious presence of product and service names and common abbreviations of Google searches in account passwords, we also compared e-mail address domains with passwords, where 15,221,988 unique records included the word “hotmail” both in the e-mail address domain as well as in the user’s password. This number was much lower for the substrings “facebook” (41,060), “apple” (7819), and “youtube” (810). The data suggested that the trends observed in the leaked data could potentially be leveraged to approximate the age and relevance of compromised data, albeit in a limited manner.
Further, we reviewed the incidence of password mutation (e.g., leetspeak, concatenation, etc.) by comparing the most common dictionary passwords against the rest of the dataset entries and calculating their edit distance. We compared select Wiktionary matches from the top 10 leaked passwords that were not considered keywalk patterns. We based the metric on Levenshtein distance to allow for variability in string length and to handle substitutions, as well as insertions, deletions, and transpositions, and we normalized it by the maximum length of either password to approximate the proportional similarity score. We then defined a 35% change as a cut-off point for basic mutations (as larger values often began to show base word shifts) and compared the results between HTTP, SSH/Telnet, and leaks datasets.
Table 25 reveals the incidence of password mutation for the words “password,” “monkey,” and “killer,” alongside the samples of the most common mutated passwords inside their metric bins.
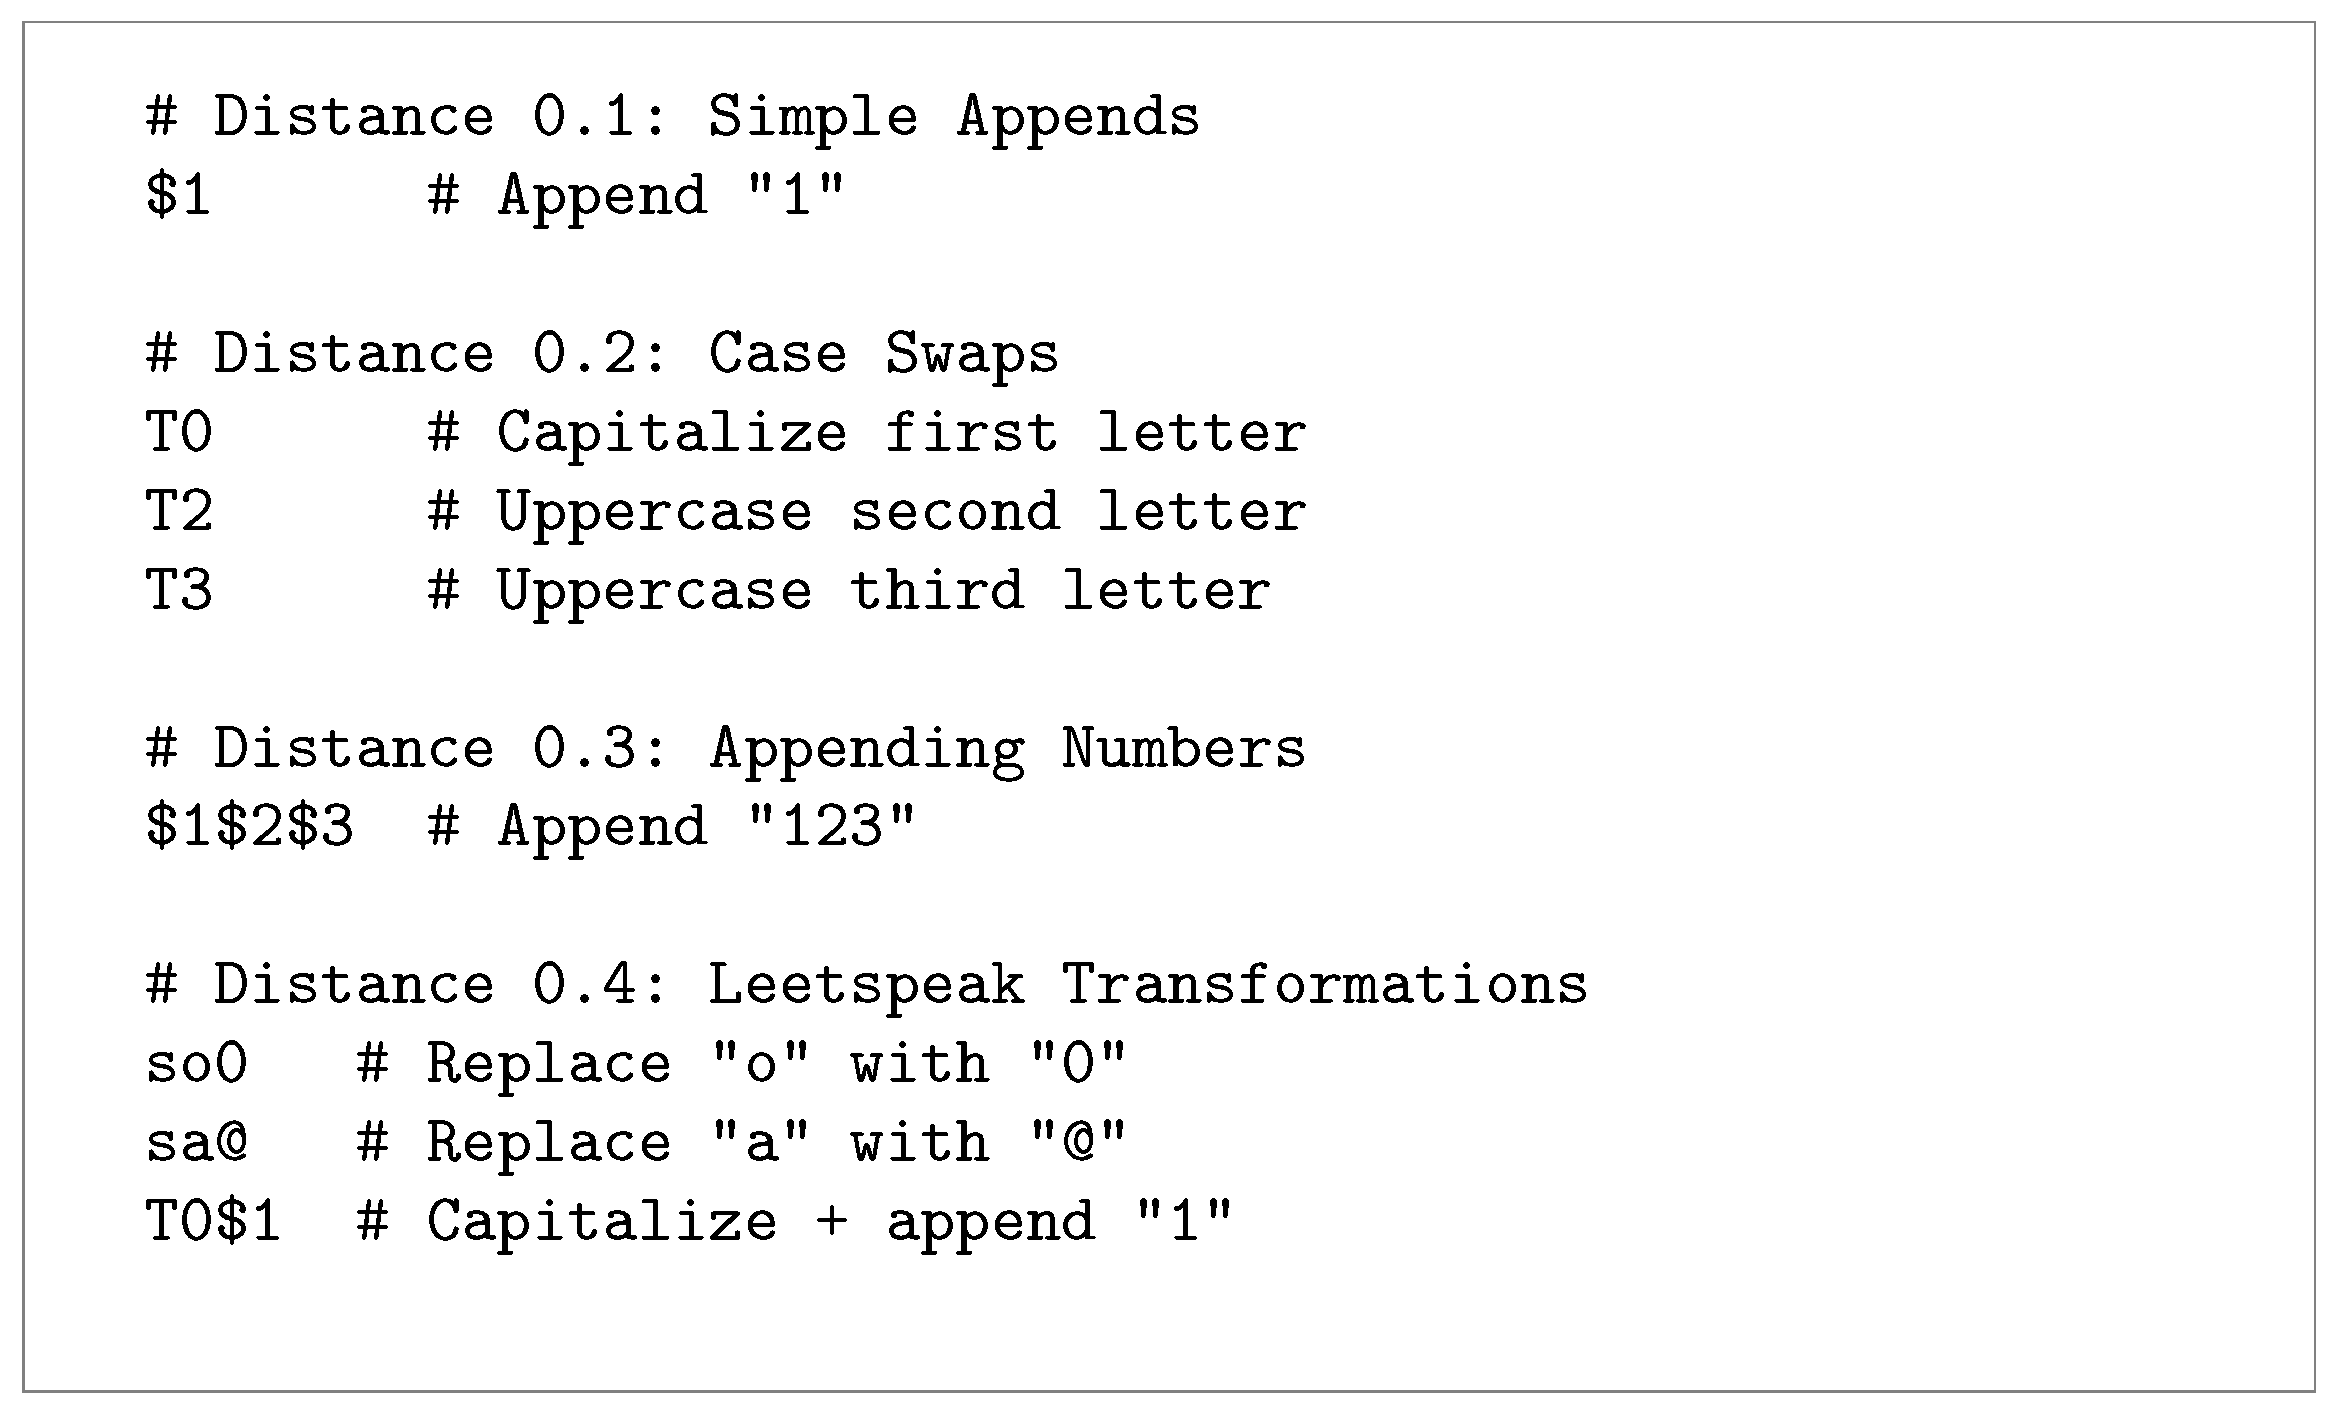
While password recovery software, such as hashcat, already features predefined mutation rulesets (e.g., best64, rockyou-30000, d3ad0ne, etc.), we believe that our results, when extended, could help generate new rules that are better optimized for real-world passwords (using newer and larger datasets in comparison to rockyou). Moreover, we believe that it is also viable to use our password datasets with neural network-based password generation approaches that could yield improvements in optimized password guessing, particularly given that previous studies have reported a scarcity of training data [
22].
For demonstrational purposes, we are attaching a rudimentary hashcat ruleset for producing mutated passwords based on the occurrence frequency of the top password mutations within the real-world leaks dataset, as shown in
Table 25. The rules in
Figure 19 are derived from the top mutations from the first three bins (allowing up to 35% modification) of the word “password”.


