
Obfuscated Malware Detection and Classification in Network Traffic Leveraging Hybrid Large Language Models and Synthetic Data

 ,
,  , ,
, ,  , and
, and
Abstract
1. Introduction
1.1. AI in Malware Detection and Classification Paradigm
1.2. Challenges with Malware Detection and Classification
1.3. Contributions of the Current Study
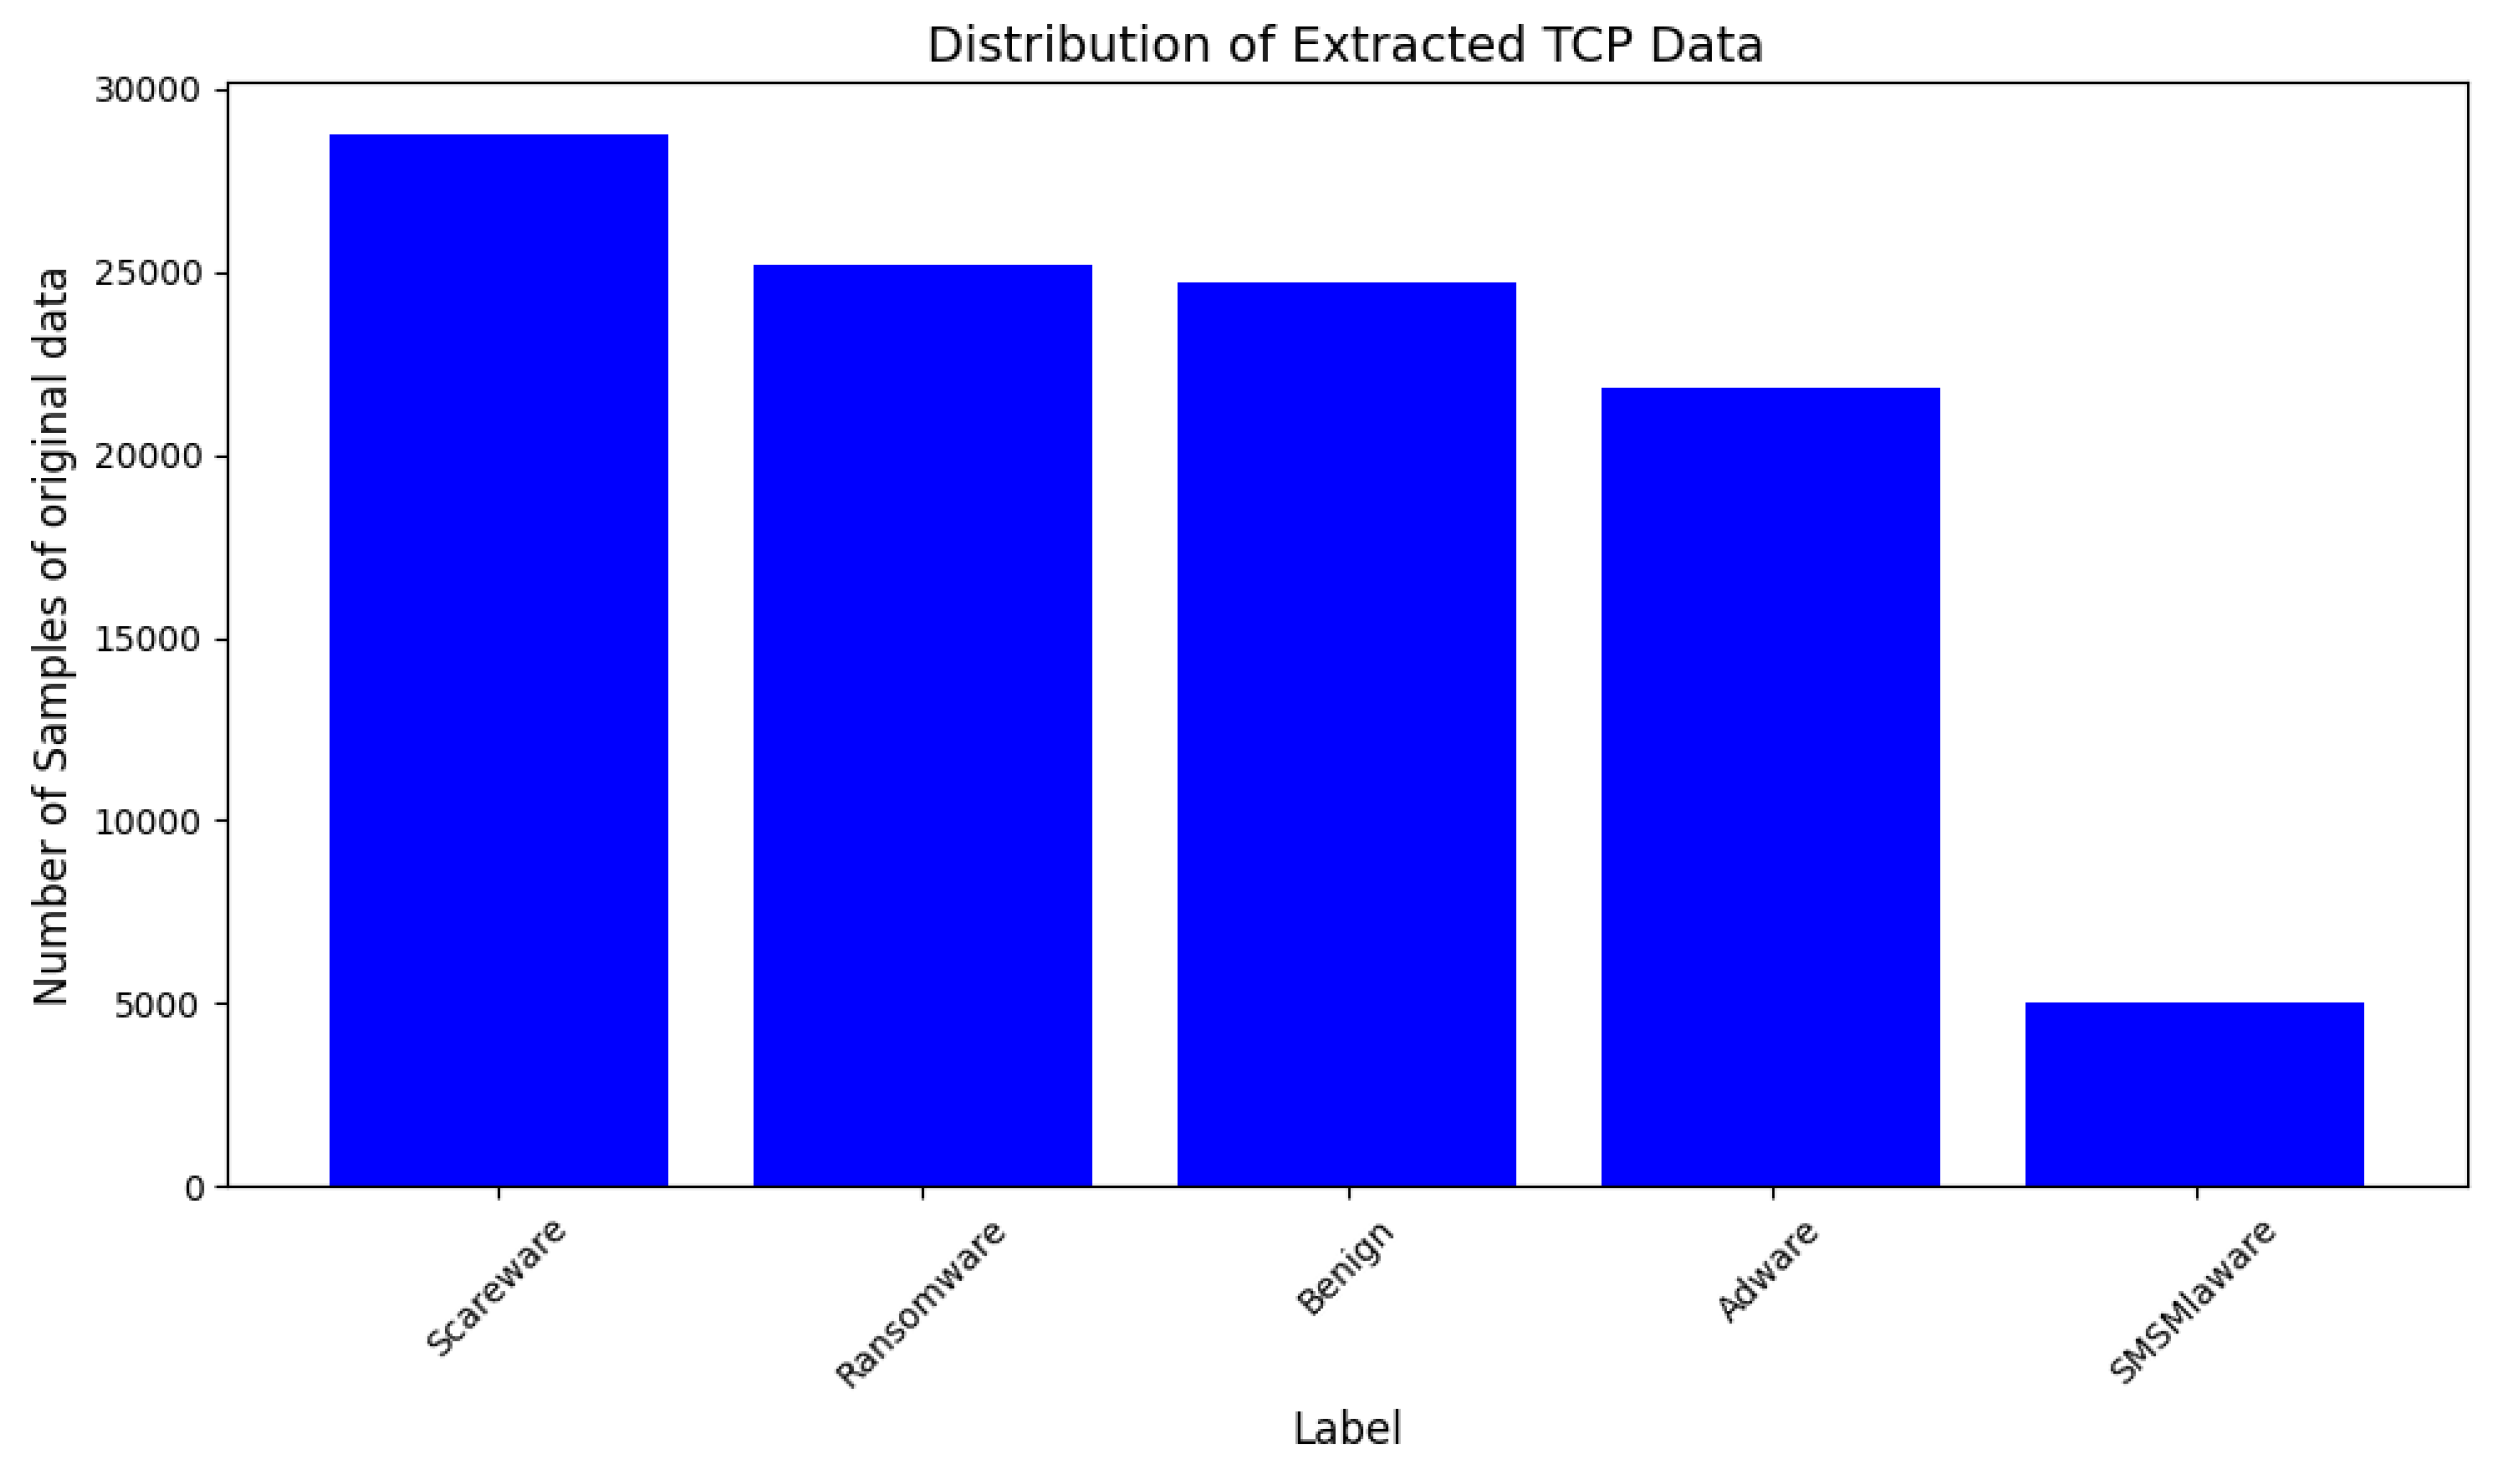
- A custom dataset is prepared by extracting the TCP data flow from network traffic and unpacking packet data from a benchmark dataset. The features are then analyzed and transformed into a labeled dataset for the transformer model.
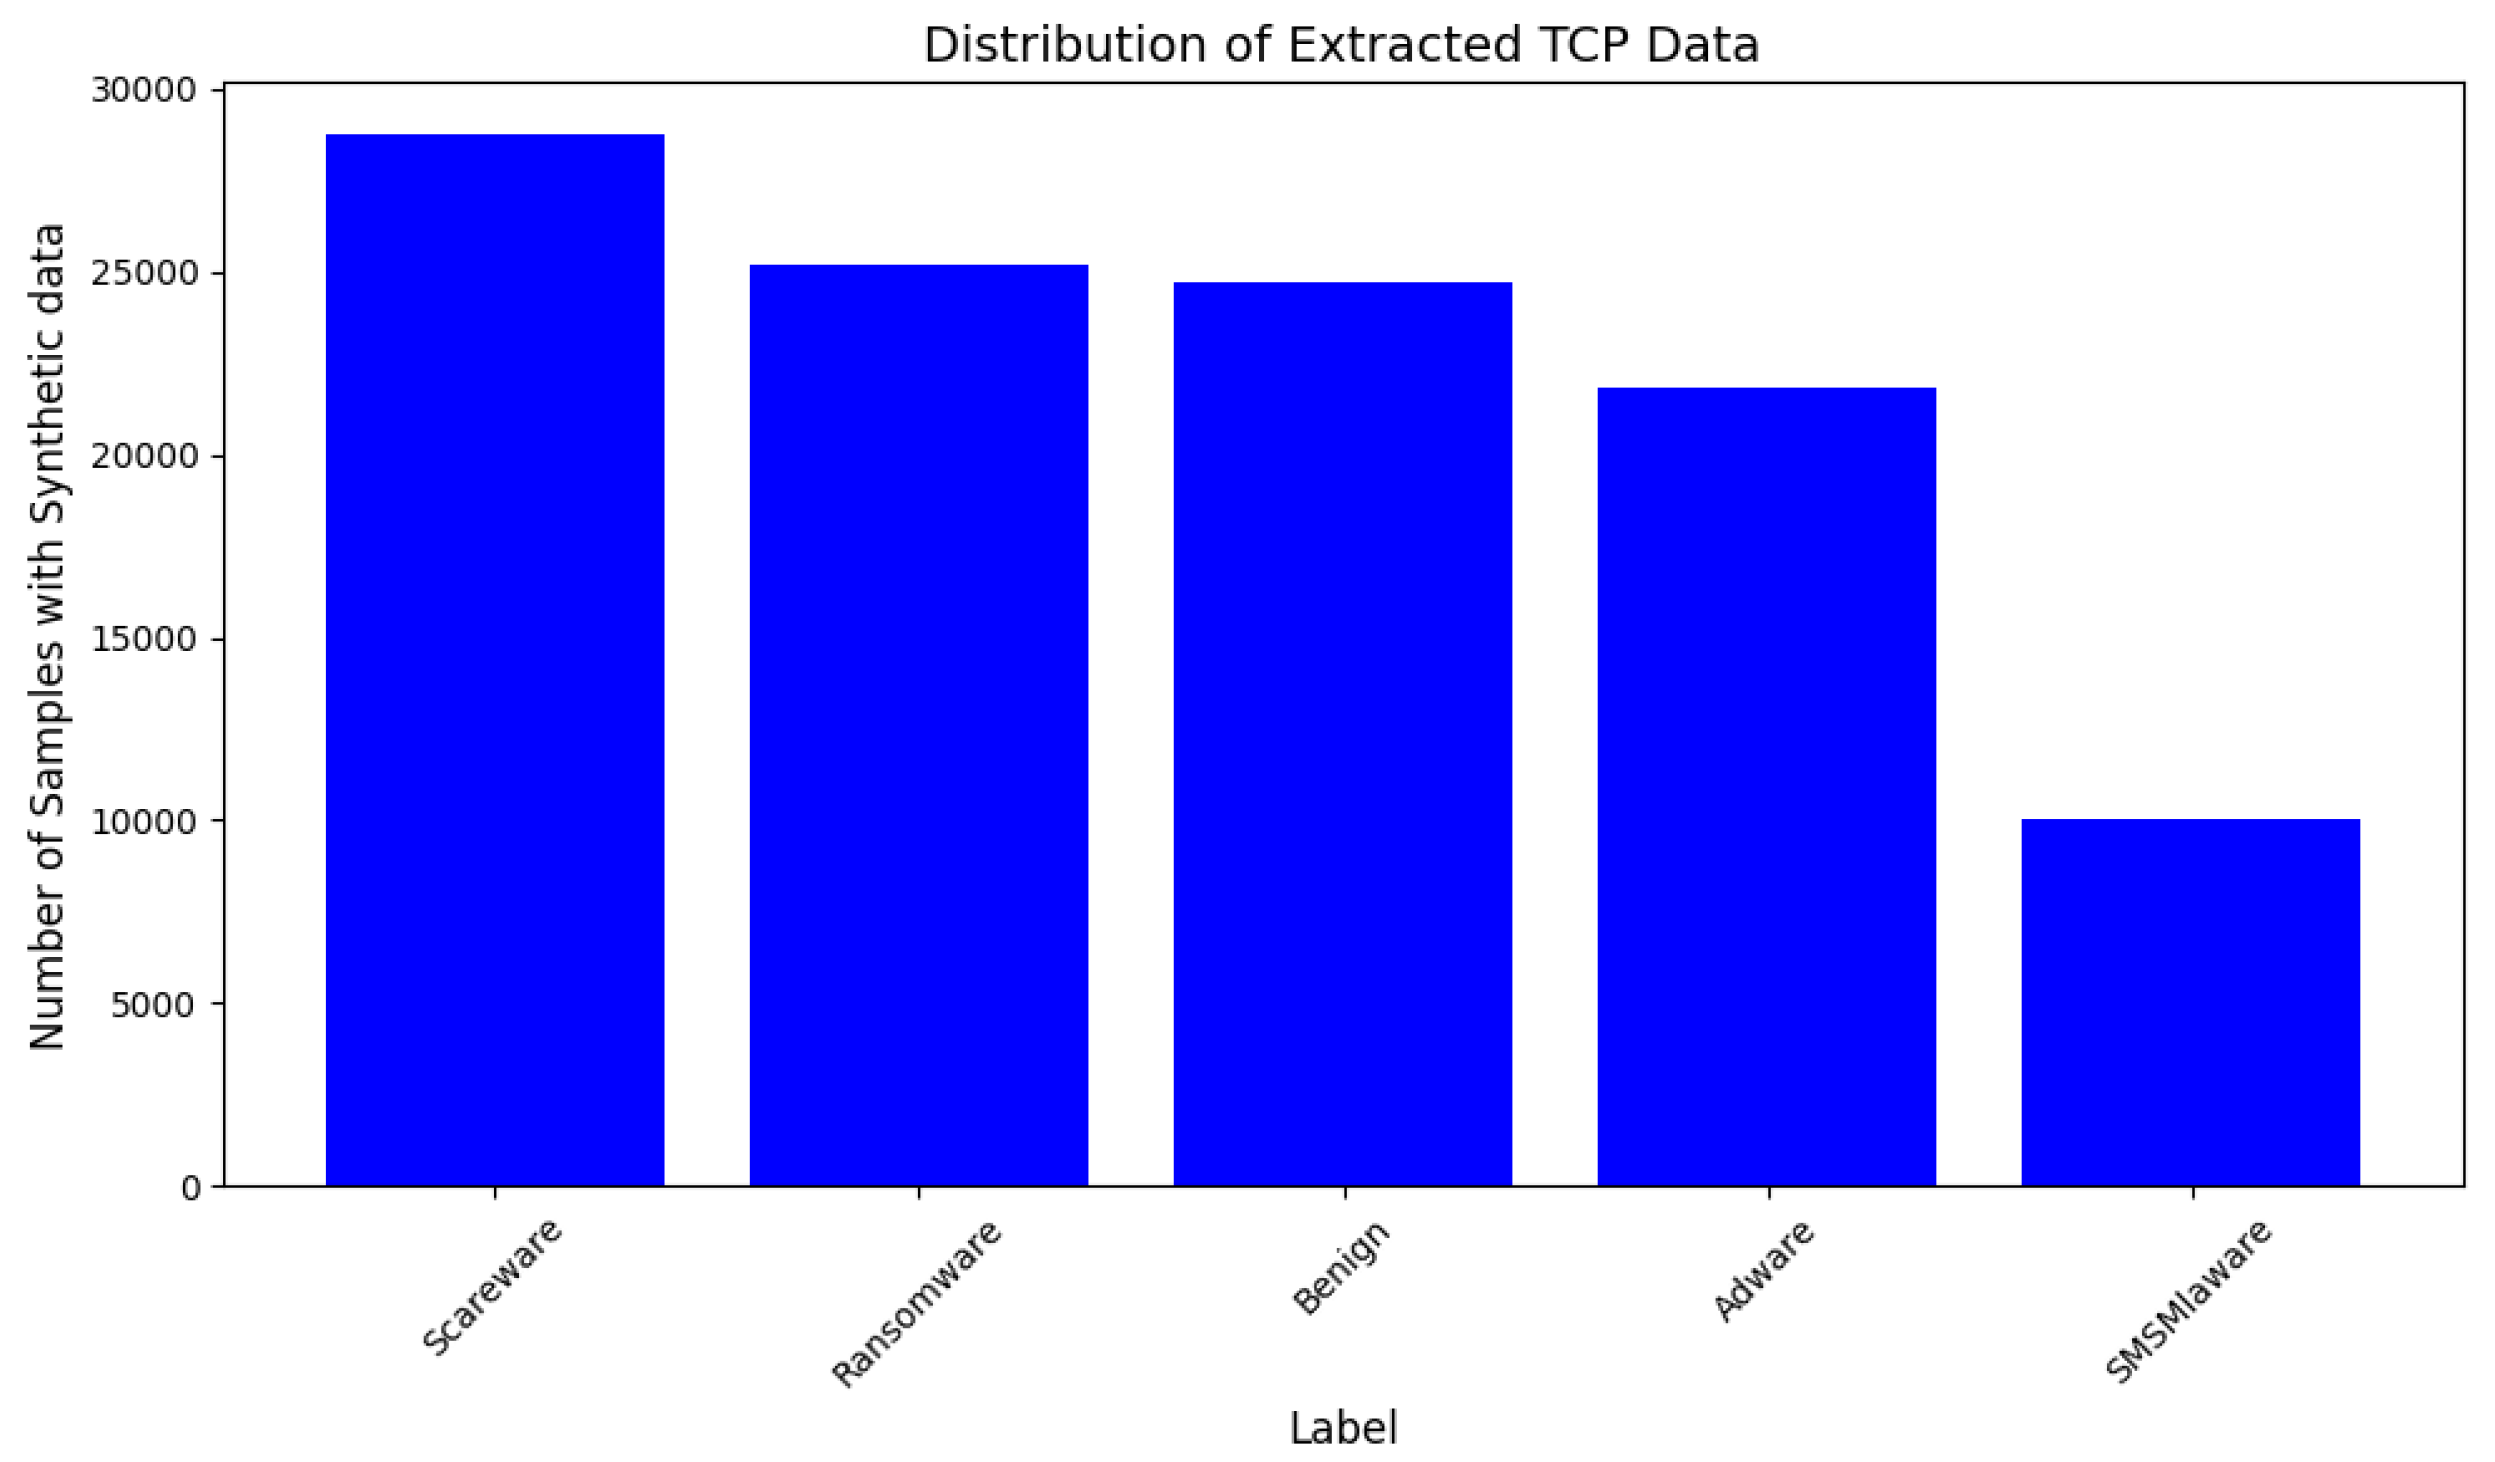
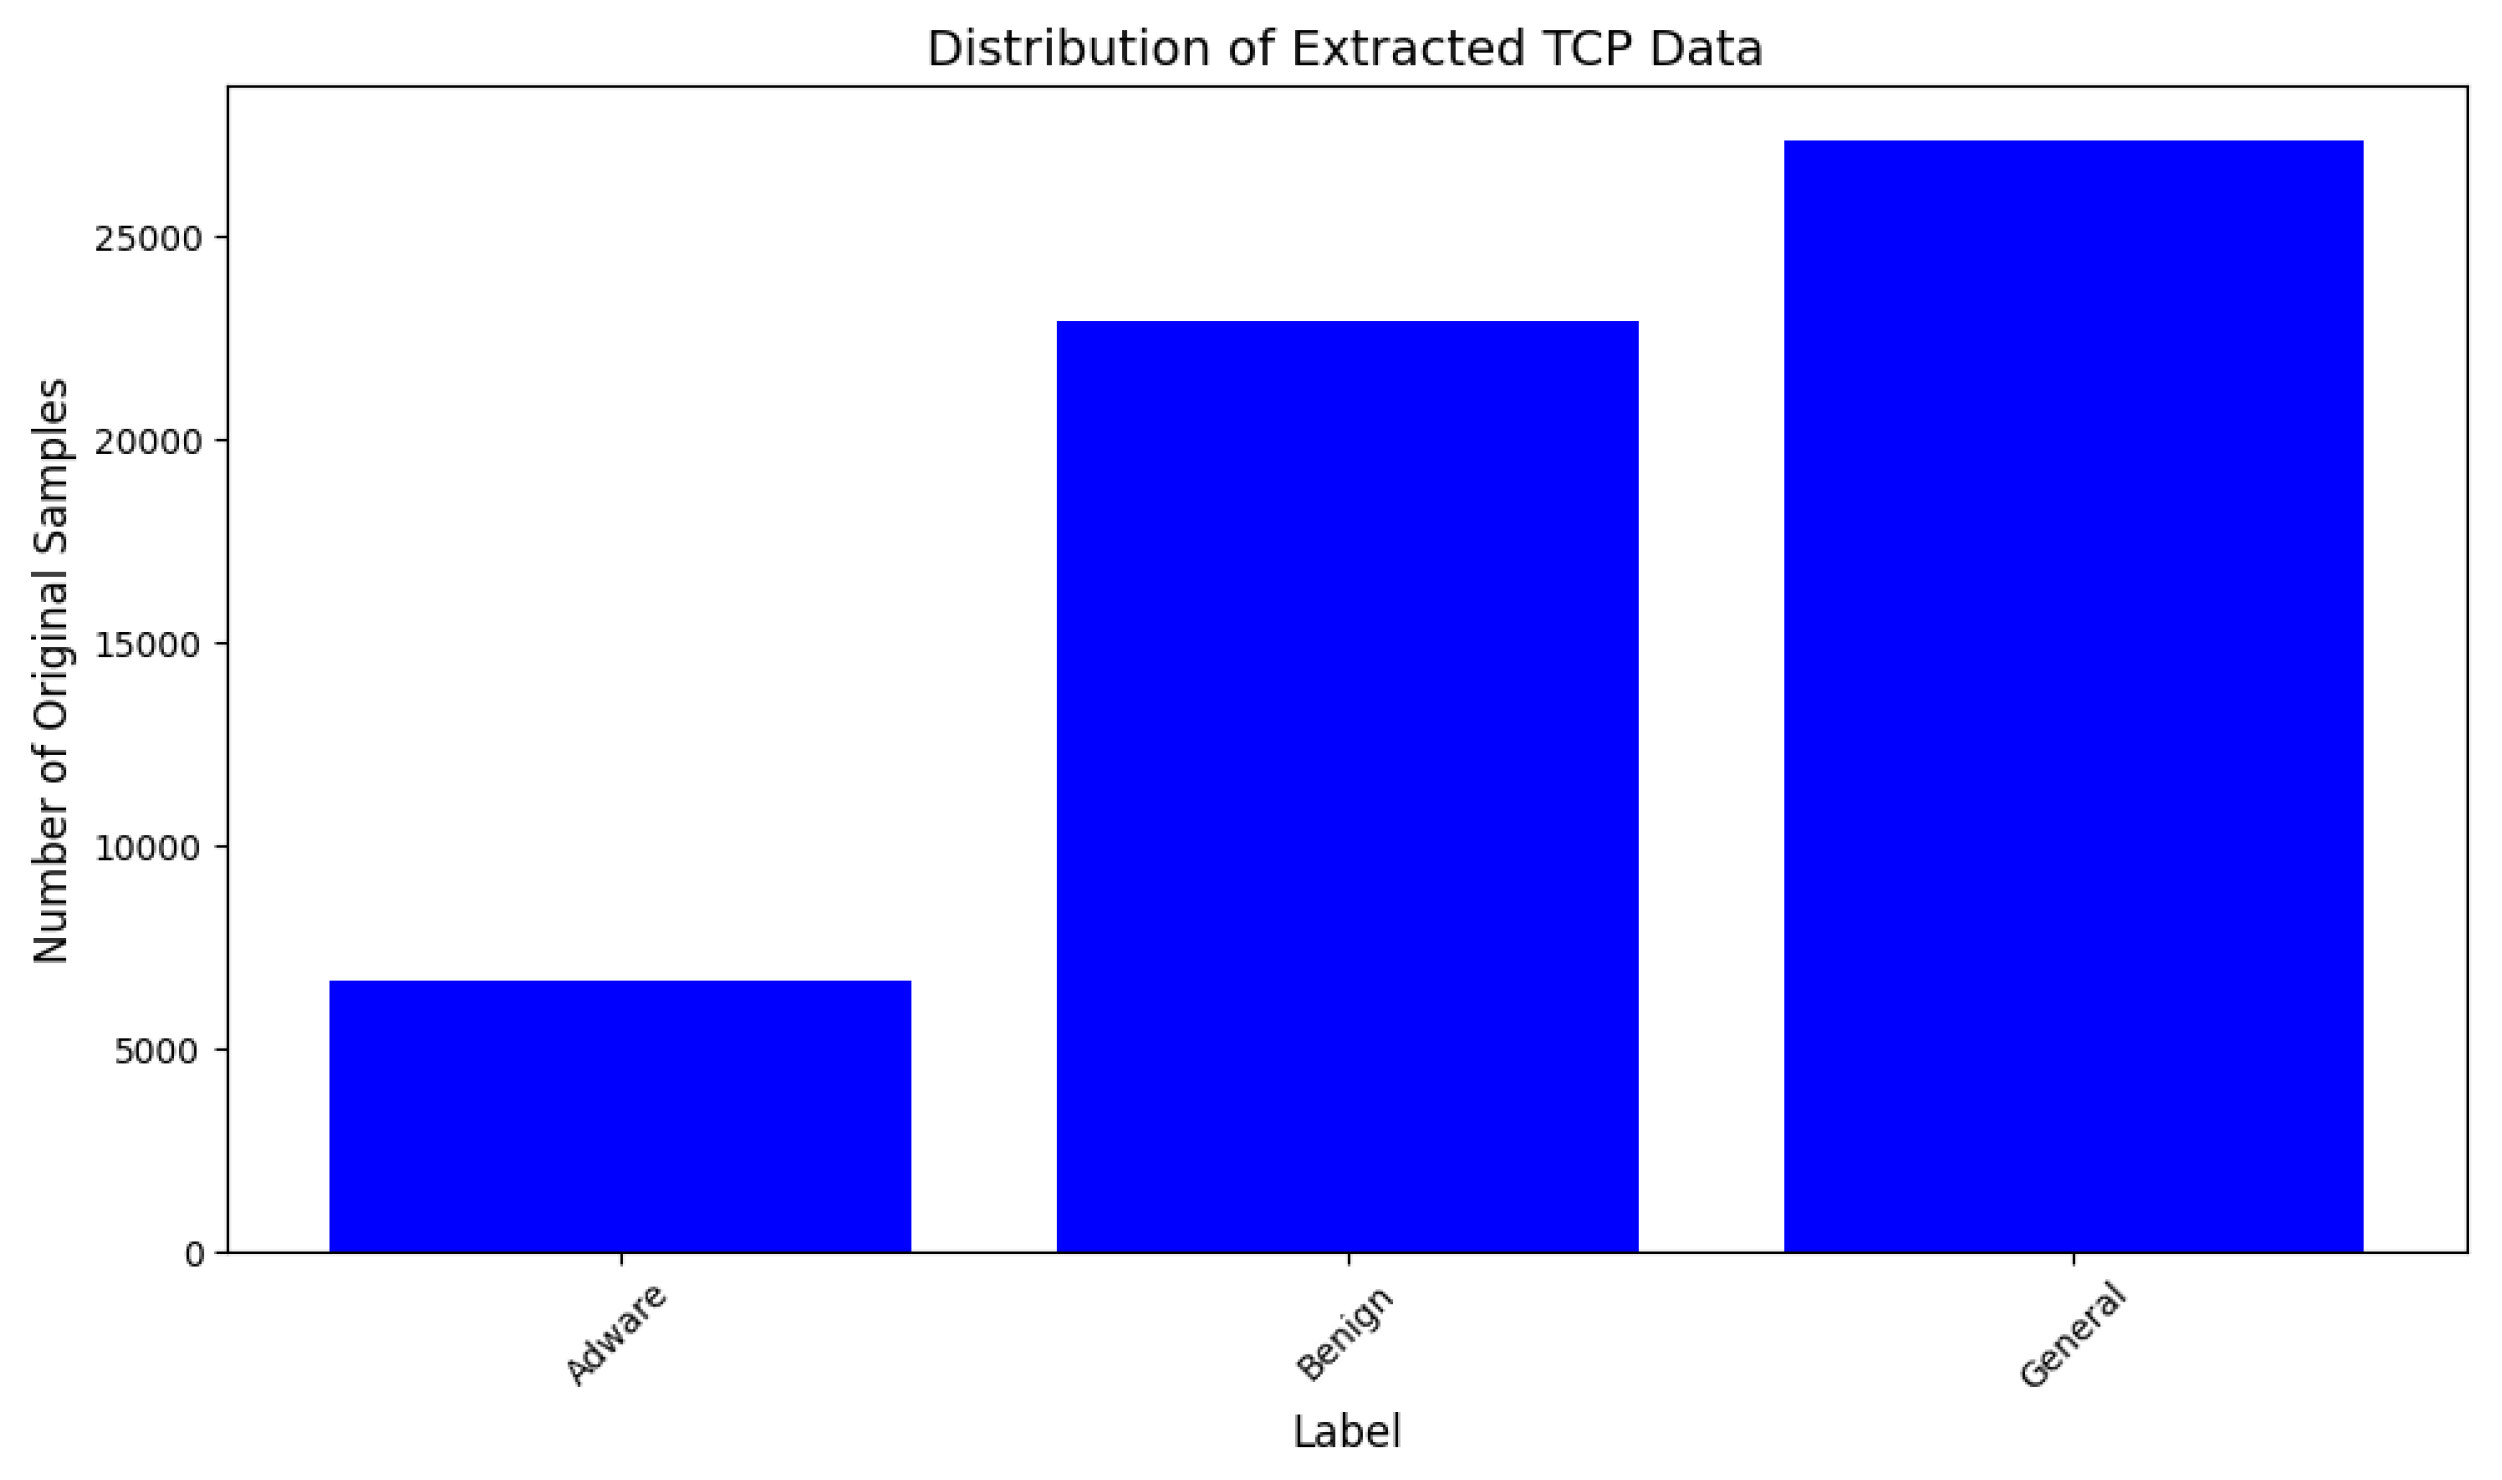
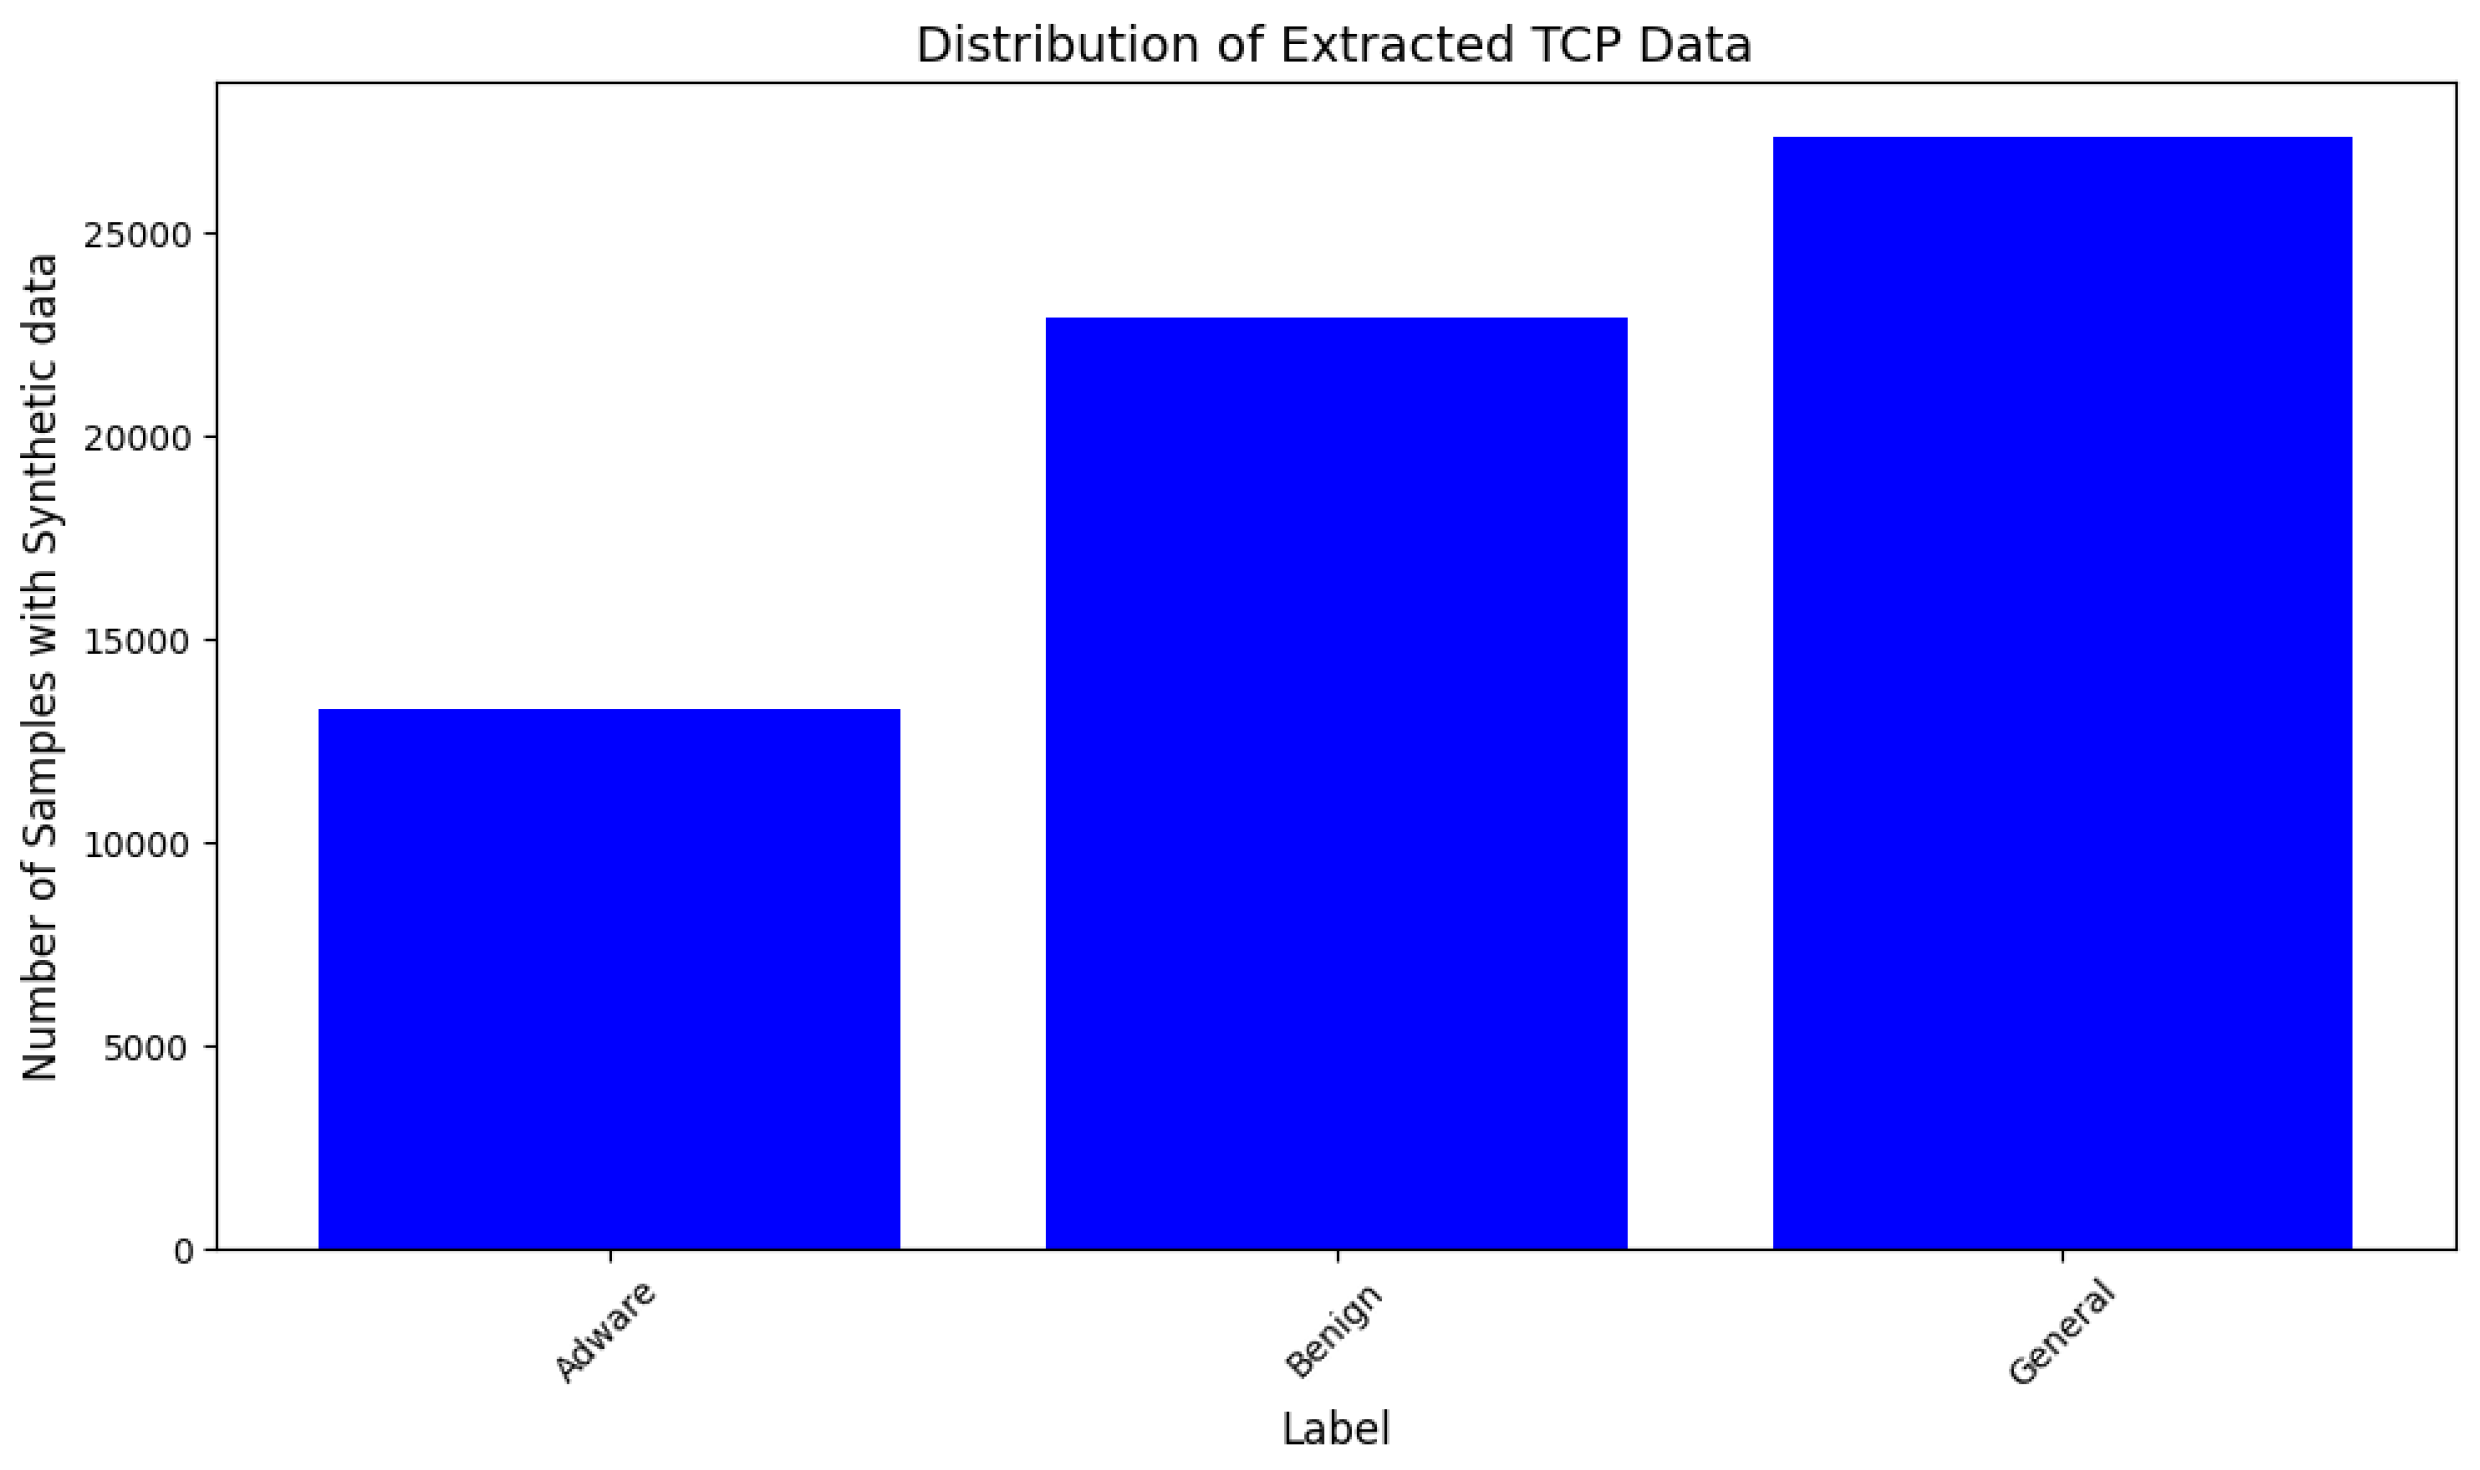
- TCP synthetic data are created by generating contextual word embeddings for sentence augmentation at level 2. A transformer-based GPT-2 model is developed to address the challenge of scarcity in malware data.
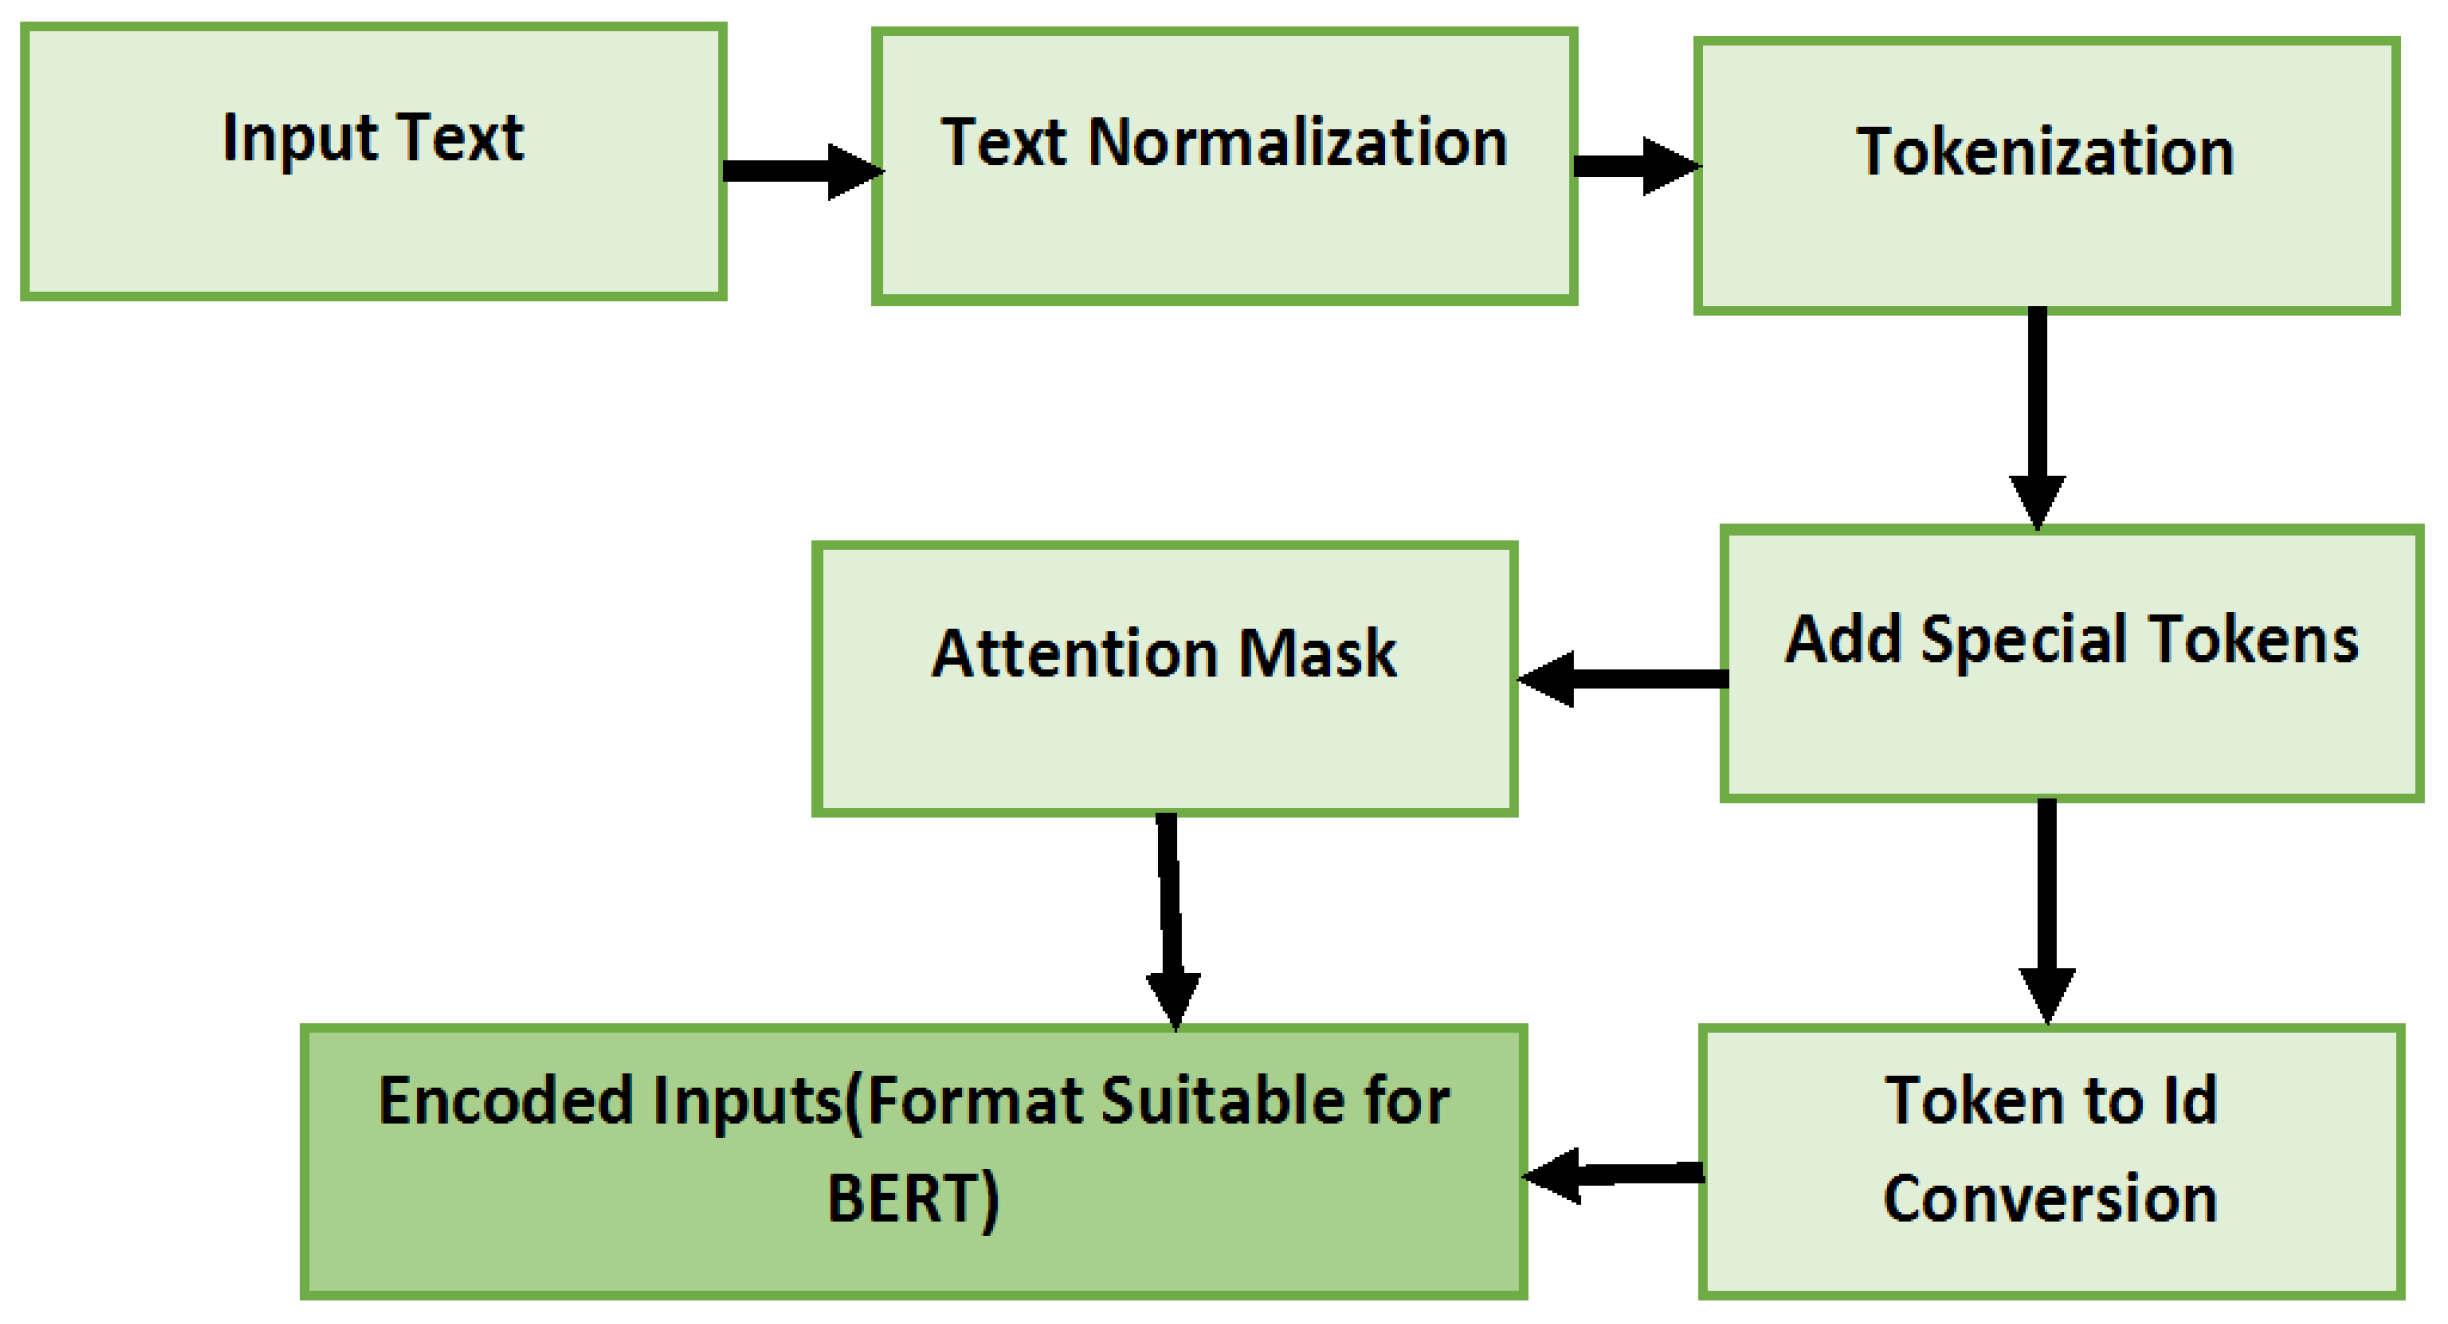
- An adapted BERT model is developed by incorporating classification layers for malware detection and classification. The features are extracted as word embeddings using a BERT Tokenizer.
2. Related Work
2.1. Transformers/LLMs in Malware Detection
2.2. Dataset Preparation for Malware Detection
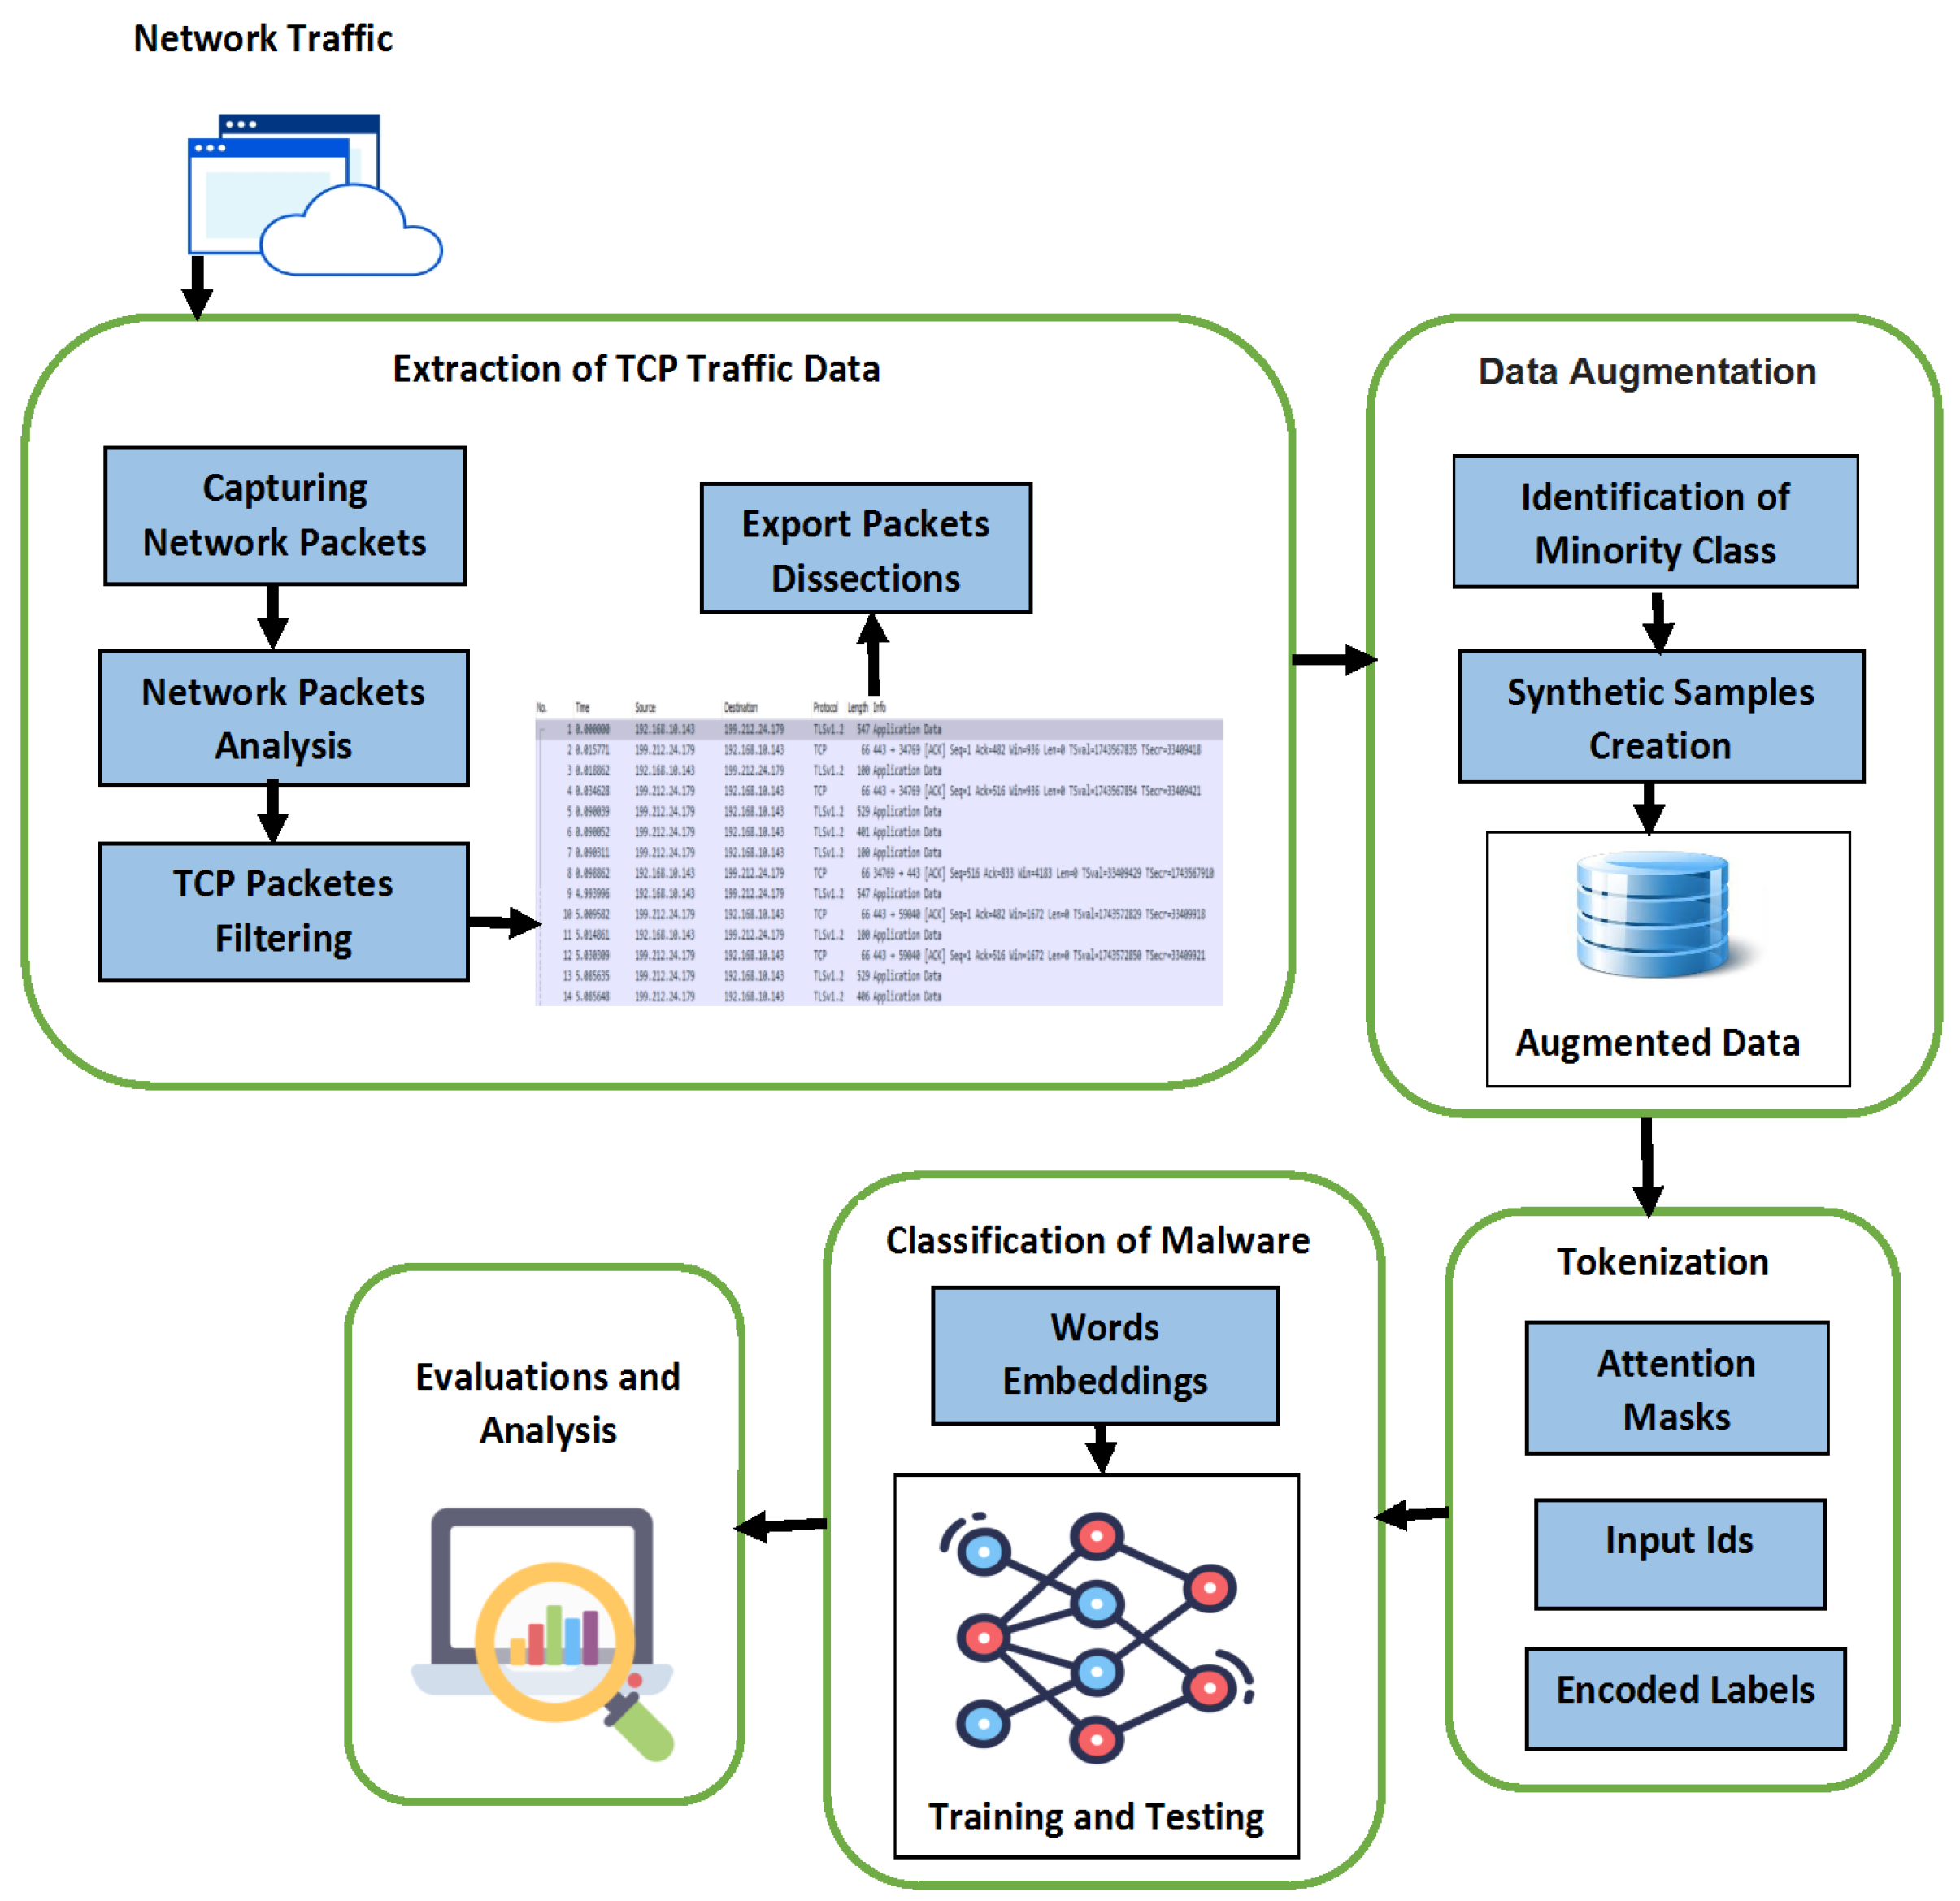
3. Methodology
3.1. Extraction of TCP Traffic Data
| Algorithm 1 Extraction of TCP Traffic Data |
Input: Network Traffic Data Pc Output: TCP Traffic Data TCP_Pc Initialization: 1: TCP_Pc = {} 2: For each packet Pc_i in Pc do: 3: Protocol = ExtractProtocol(Pc_i) 4: If Protocol == ‘TCP’ then: 5: Add Pc_i to TCP_Pc 6: Return TCP_Pc |
3.2. Synthetic Sample Generator and Data Augmentation
| Algorithm 2 Synthetic Sample Generator and Data Augmentation |
Input: TCP Traffic Data TCP_Pc Output: Augmented Traffic Data Aug_Pc Initialization: 1: Aug_Pc = {} 2: For each Class C_Pc in TCP_Pc do: 3: Packet_Pc = Count C_Pc 4: If Packet_Pc < ‘Threshold’ 5: AugPacket_Pc = Generate2Samples for Packet_Pc then: 6: Aug_Pc = AugPacket_Pc U TCP_Pc 7: Return Aug_Pc |
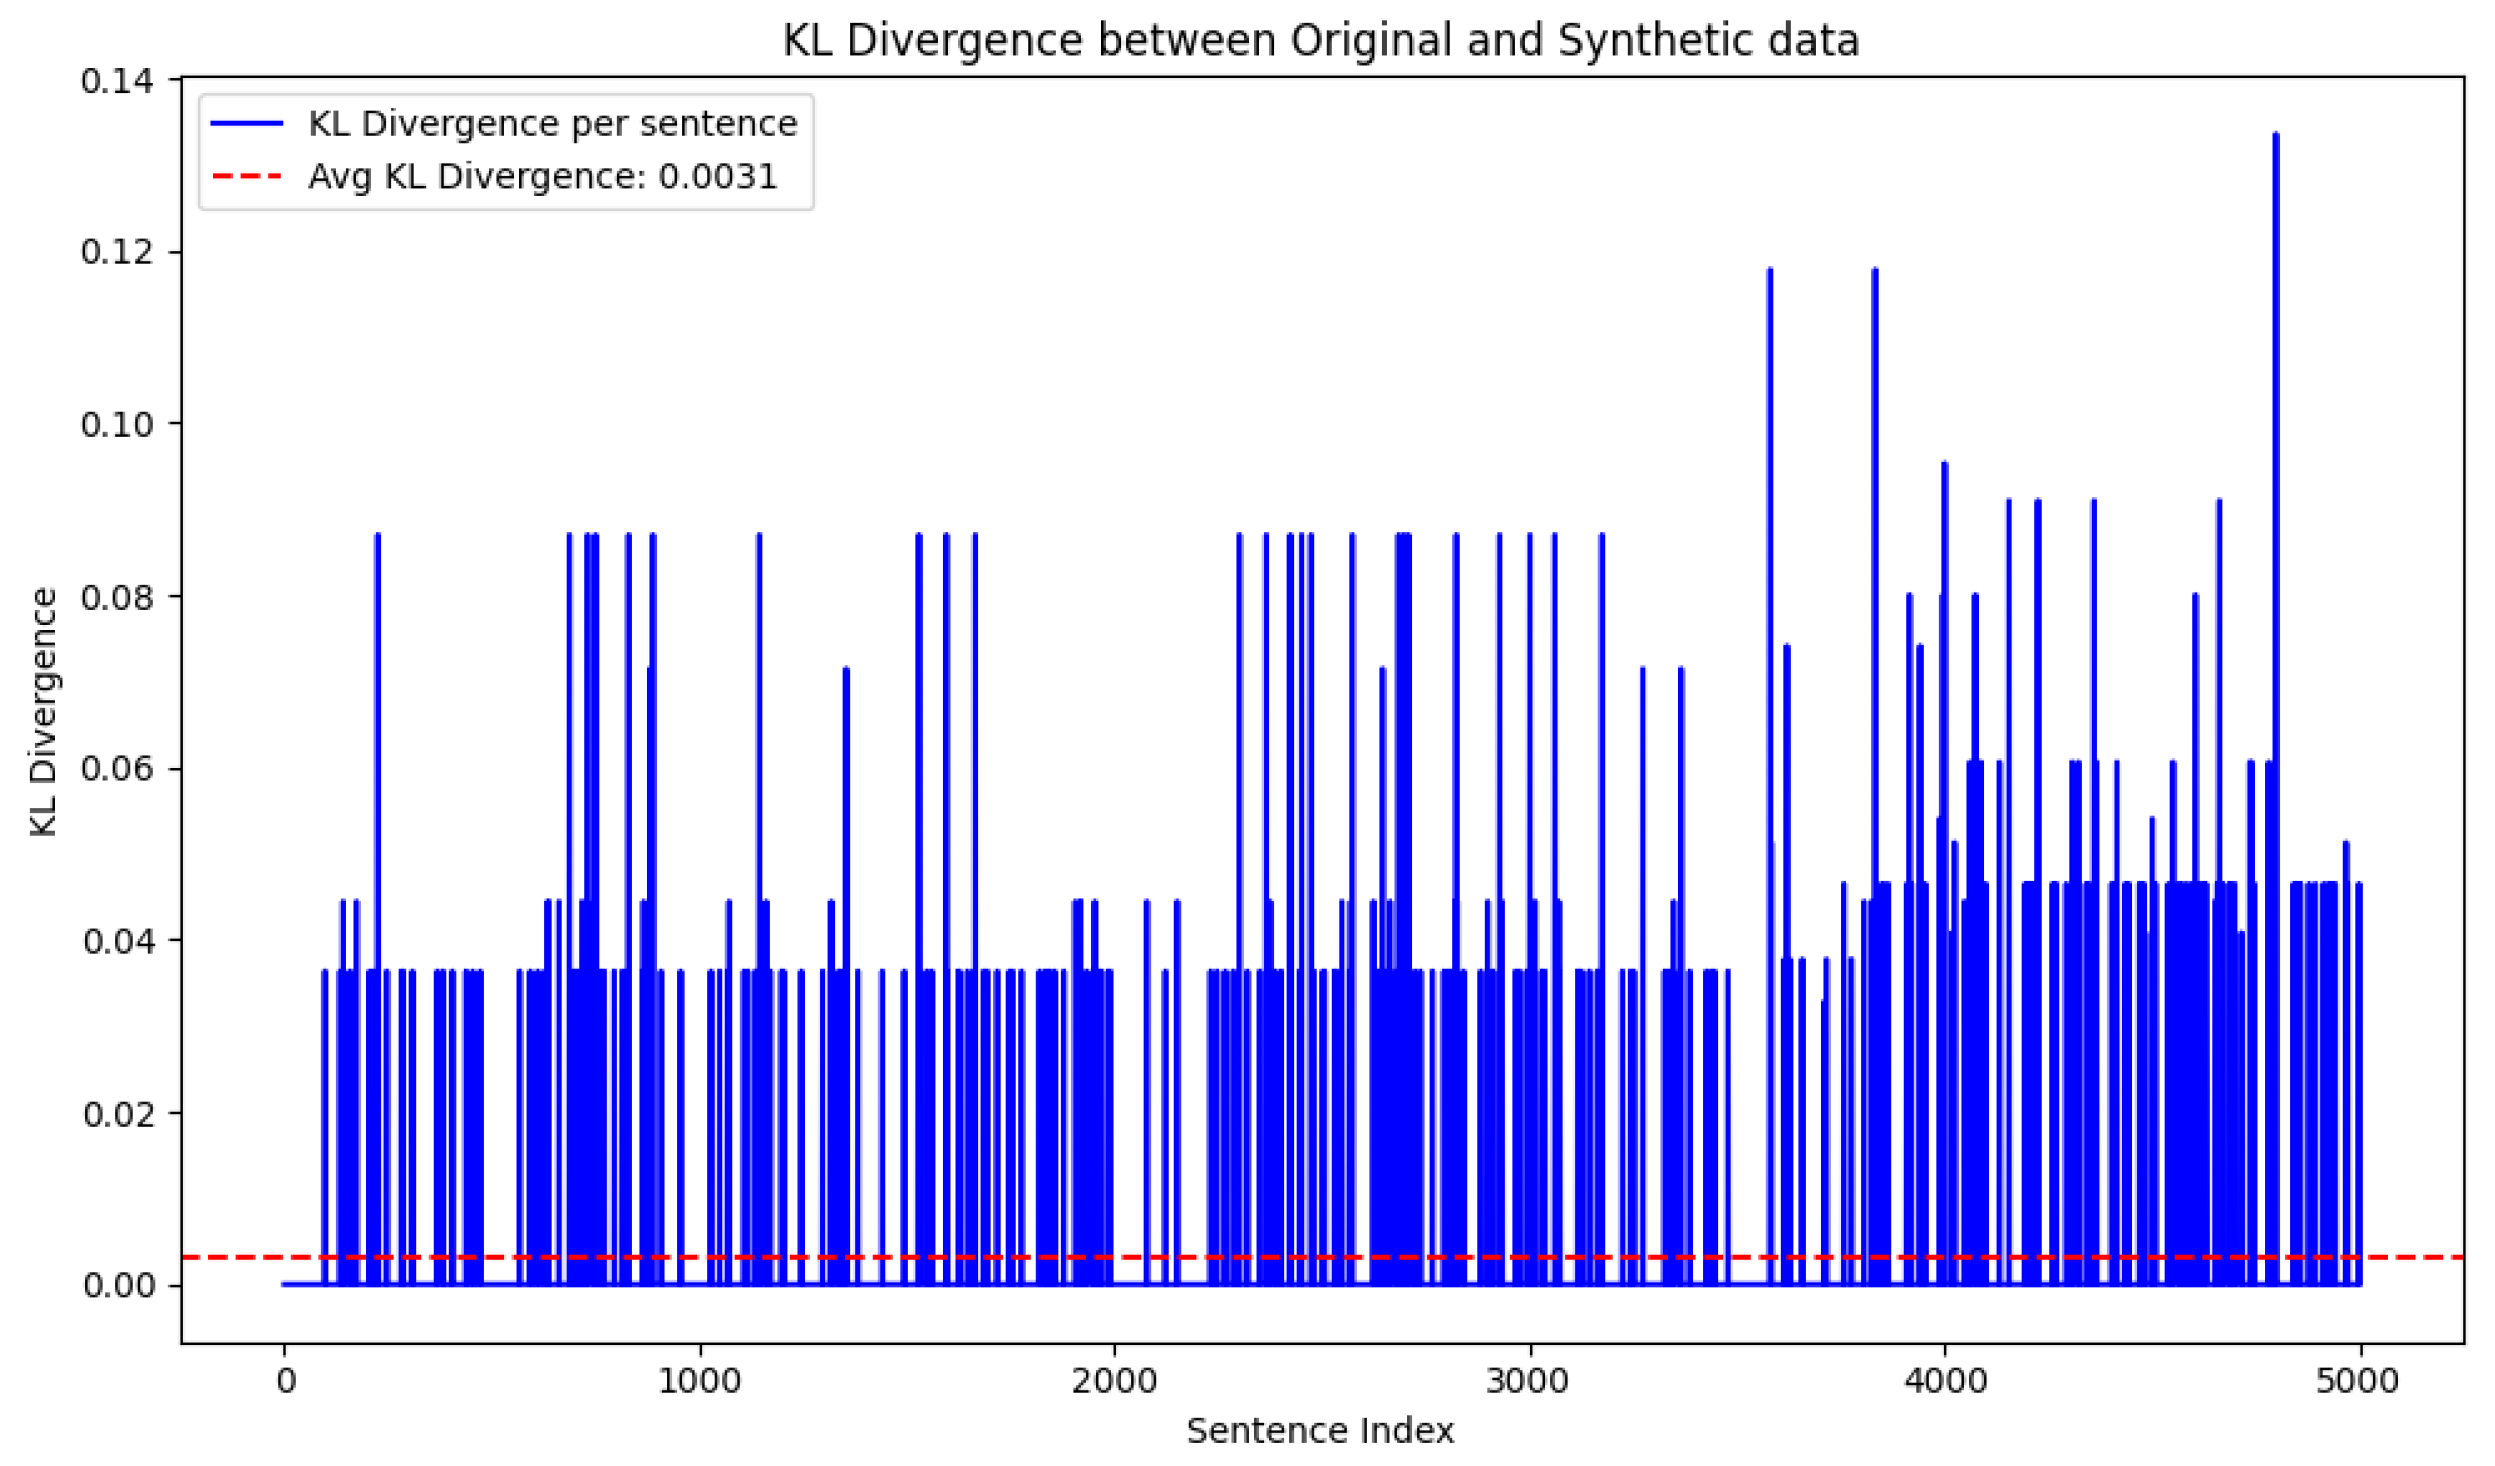
- is the TF-IDF value of term in the original text data;
- is the TF-IDF value of term in the synthetic text data;
- The sum is taken over all terms in the vocabulary.
3.3. Ethical Considerations with Synthetic Data
3.4. Features Analysis
3.5. Classification and Evaluation
- The 1st layer of the model is the input layer. This layer receives the input in the form of Attention Mask and Input ID. The required input is generated by the Tokenizer from the textual data. Tensorflow is used for model representation in Python so that input in the form of tensors is accepted by the model [50]. The shape of the input tensor is precise to 256 tokens; this resulted in the padding of the shorter token and truncation of larger tokens to keep the consistency of input.
- The input is fed to the pre-trained BERT model—a BERT-based uncased model from the Transformers library (4.42.4). Data are processed by BERT, resulting in two major outputs. Activation layer and Pooled Output layer. For the classification through BERT, a sequence to be used for classification by the Pooled Output Layer is further input to the new layers designed for classifications.
- An intermediate Dense layer is included, which is a fully connected dense layer, using the Rectified Linear Unit (ReLU) as an activation function to enhance the learning capability of the model. This layer is designed for 512 units, so it helps in dimensionality reductions of the features generated by the BERT pooled output layer, keeping the imperative information required for classification integral.
- Following that, another dense layer, the output layer, is added to perform the classification and generate the probability distribution of the classes. The SoftMax activation function is used to calculate the probabilities of the classes using classification.
- represents the previous value of the mean of the gradient.
- , as computed in Equation (2), is the gradient value at time step t.
- is the decay rate during the computation of the mean of the gradients.
- is the previous value of the uncentered variance.
- represents the element-wise square value of the gradient at each step.
- is the decay value during the computation for the uncentered variance.
4. Results and Discussion
4.1. Dataset Acquisition
4.2. Deployment and Results
5. Comparison of Results and Discussion
6. Conclusions and Future Work
Author Contributions
Funding
Data Availability Statement
Conflicts of Interest
References
- Sahay, S.K.; Sharma, A.; Rathore, H. Evolution of malware and its detection techniques. In Information and Communication Technology for Sustainable Development: Proceedings of ICT4SD 2018; Springer: Singapore, 2020; pp. 139–150. [Google Scholar]
- Udayakumar, N.; Saglani, V.J.; Cupta, A.V.; Subbulakshmi, T. Malware classification using machine learning algorithms. In Proceedings of the 2018 2nd International Conference on Trends in Electronics and Informatics (ICOEI), Tirunelveli, India, 11–12 May 2018; p. 1. [Google Scholar]
- Raff, E.; Nicholas, C. A survey of machine learning methods and challenges for windows malware classification. arXiv 2020, arXiv:2006.09271. [Google Scholar]
- Qamar, A.; Karim, A.; Chang, V. Mobile malware attacks: Review, taxonomy & future directions. Future Gener. Comput. Syst. 2019, 97, 887–909. [Google Scholar]
- Malik, M.I.; Ibrahim, A.; Hannay, P.; Sikos, L.F. Developing resilient cyber-physical systems: A review of state-of-the-art malware detection approaches, gaps, and future directions. Computers 2023, 12, 79. [Google Scholar] [CrossRef]
- Haris, M.; Jadoon, B.; Yousaf, M.; Khan, F.H. Evolution of android operating system: A review. Asia Pac. J. Contemp. Educ. Commun. Technol. 2018, 4, 178–188. [Google Scholar]
- Dhiman, D.B. Effects of Online News Applications for Android: A Critical Analysis. 2022. Available online: https://ssrn.com/abstract=4222791 (accessed on 21 June 2024).
- Selvaganapathy, S.; Sadasivam, S.; Ravi, V. A review on android malware: Attacks, countermeasures and challenges ahead. J. Cyber Secur. Mobil. 2021, 10, 177–230. [Google Scholar] [CrossRef]
- Almaleh, A.; Almushabb, R.; Ogran, R. Malware API calls detection using hybrid logistic regression and RNN model. Appl. Sci. 2023, 13, 5439. [Google Scholar] [CrossRef]
- Mehta, R.; Jurečková, O.; Stamp, M. A natural language processing approach to Malware classification. J. Comput. Virol. Hacking Tech. 2024, 20, 173–184. [Google Scholar] [CrossRef]
- Ambekar, N.G.; Devi, N.N.; Thokchom, S.; Yogita. TabLSTMNet: Enhancing android malware classification through integrated attention and explainable AI. Microsyst. Technol. 2024, 1–19. [Google Scholar] [CrossRef]
- Ullah, F.; Turab, A.; Ullah, S.; Cacciagrano, D.; Zhao, Y. Enhanced network intrusion detection system for internet of things security using multimodal big data representation with transfer learning and game theory. Sensors 2024, 24, 4152. [Google Scholar] [CrossRef]
- Zhang, N.; Xue, J.; Ma, Y.; Zhang, R.; Liang, T.; Tan, Y. Hybrid sequence-based Android malware detection using natural language processing. Int. J. Intell. Syst. 2021, 36, 5770–5784. [Google Scholar] [CrossRef]
- Alam, S. Applying natural language processing for detecting malicious patterns in Android applications. Forensic Sci. Int. Digit. Investig. 2021, 39, 301270. [Google Scholar] [CrossRef]
- Demmese, F.A.; Neupane, A.; Khorsandroo, S.; Wang, M.; Roy, K.; Fu, Y. Machine learning based fileless malware traffic classification using image visualization. Cybersecurity 2023, 6, 32. [Google Scholar] [CrossRef]
- Zhang, Y.; Jin, R.; Zhou, Z.H. Understanding bag-of-words model: A statistical framework. Int. J. Mach. Learn. Cybern. 2010, 1, 43–52. [Google Scholar] [CrossRef]
- Church, K.W. Word2Vec. Nat. Lang. Eng. 2017, 23, 155–162. [Google Scholar] [CrossRef]
- Liu, L.Z.; Wang, Y.; Kasai, J.; Hajishirzi, H.; Smith, N.A. Probing across time: What does RoBERTa know and when? arXiv 2021, arXiv:2104.07885. [Google Scholar]
- He, P.; Liu, X.; Gao, J.; Chen, W. Deberta: Decoding-enhanced bert with disentangled attention. arXiv 2020, arXiv:2006.03654. [Google Scholar]
- Karita, S.; Chen, N.; Hayashi, T.; Hori, T.; Inaguma, H.; Jiang, Z.; Someki, M.; Soplin, N.E.Y.; Yamamoto, R.; Wang, X.; et al. A comparative study on transformer vs rnn in speech applications. In Proceedings of the 2019 IEEE Automatic Speech Recognition and Understanding Workshop (ASRU), Singapore, 14–18 December 2019; pp. 449–456. [Google Scholar]
- Botacin, M.; Ceschin, F.; Sun, R.; Oliveira, D.; Grégio, A. Challenges and pitfalls in malware research. Comput. Secur. 2021, 106, 102287. [Google Scholar] [CrossRef]
- Li, J.; He, J.; Li, W.; Fang, W.; Yang, G.; Li, T. SynDroid: An adaptive enhanced Android malware classification method based on CTGAN-SVM. Comput. Secur. 2024, 137, 103604. [Google Scholar] [CrossRef]
- Chen, J.; Zhao, Z.; Cai, S.; Chen, X.; Ahmad, B.; Song, L.; Wang, K. DCM-GIFT: An Android malware dynamic classification method based on gray-scale image and feature-selection tree. Inf. Softw. Technol. 2024, 176, 107560. [Google Scholar] [CrossRef]
- Aboaoja, F.A.; Zainal, A.; Ghaleb, F.A.; Al-Rimy, B.A.S.; Eisa, T.A.E.; Elnour, A.A.H. Malware detection issues, challenges, and future directions: A survey. Appl. Sci. 2022, 12, 8482. [Google Scholar] [CrossRef]
- Gao, C.; Huang, G.; Li, H.; Wu, B.; Wu, Y.; Yuan, W. A Comprehensive Study of Learning-based Android Malware Detectors under Challenging Environments. In Proceedings of the 46th IEEE/ACM International Conference on Software Engineering, Lisbon, Portugal, 14–20 April 2024; pp. 1–13. [Google Scholar]
- Ullah, F.; Ullah, S.; Naeem, M.R.; Mostarda, L.; Rho, S.; Cheng, X. Cyber-threat detection system using a hybrid approach of transfer learning and multi-model image representation. Sensors 2022, 22, 5883. [Google Scholar] [CrossRef] [PubMed]
- Chen, Y.; Cui, M.; Wang, D.; Cao, Y.; Yang, P.; Jiang, B.; Lu, Z.; Liu, B. A survey of large language models for cyber threat detection. Comput. Secur. 2024, 145, 104016. [Google Scholar] [CrossRef]
- Koide, T.; Fukushi, N.; Nakano, H.; Chiba, D. Detecting phishing sites using chatgpt. arXiv 2023, arXiv:2306.05816. [Google Scholar]
- Xu, P. Android-coco: Android malware detection with graph neural network for byte-and native-code. arXiv 2021, arXiv:2112.10038. [Google Scholar]
- Rahali, A.; Akhloufi, M.A. Malbert: Malware detection using bidirectional encoder representations from transformers. In Proceedings of the 2021 IEEE International Conference on Systems, Man, and Cybernetics (SMC), Melbourne, Australia, 17–20 October 2021; pp. 3226–3231. [Google Scholar]
- Rahali, A.; Akhloufi, M.A. Malbertv2: Code aware bert-based model for malware identification. Big Data Cogn. Comput. 2023, 7, 60. [Google Scholar] [CrossRef]
- Demırcı, D.; Acarturk, C. Static malware detection using stacked bilstm and gpt-2. IEEE Access 2022, 10, 58488–58502. [Google Scholar] [CrossRef]
- Saracino, A.; Simoni, M. Graph-based android malware detection and categorization through bert transformer. In Proceedings of the 18th International Conference on Availability, Reliability and Security, Benevento, Italy, 29 August–1 September 2023; pp. 1–7. [Google Scholar]
- Ban, Y.; Yi, J.H.; Cho, H. Augmenting Android Malware Using Conditional Variational Autoencoder for the Malware Family Classification. Comput. Syst. Sci. Eng. 2023, 46, 2215–2230. [Google Scholar] [CrossRef]
- Mahmoudi, L.; Salem, M. BalBERT: A New Approach to Improving Dataset Balancing for Text Classification. Rev. d’Intell. Artif. 2023, 37, 425–431. [Google Scholar] [CrossRef]
- Habbat, N.; Nouri, H.; Anoun, H.; Hassouni, L. Sentiment analysis of imbalanced datasets using BERT and ensemble stacking for deep learning. Eng. Appl. Artif. Intell. 2023, 126, 106999. [Google Scholar] [CrossRef]
- Cheng, A. PAC-GAN: Packet generation of network traffic using generative adversarial networks. In Proceedings of the 2019 IEEE 10th Annual Information Technology, Electronics and Mobile Communication Conference (IEMCON), Vancouver, BC, Canada, 17–19 October 2019; pp. 0728–0734. [Google Scholar]
- Kholgh, D.K.; Kostakos, P. PAC-GPT: A novel approach to generating synthetic network traffic with GPT-3. IEEE Access 2023, 11, 114936–114951. [Google Scholar] [CrossRef]
- Lamping, U.; Warnicke, E. Wireshark user’s guide. Interface 2004, 4, 1. [Google Scholar]
- Kozierok, C.M. The TCP/IP Guide: A Comprehensive, Illustrated Internet Protocols Reference; No Starch Press: San Francisco, CA, USA, 2005. [Google Scholar]
- Feng, S.Y.; Gangal, V.; Wei, J.; Chandar, S.; Vosoughi, S.; Mitamura, T.; Hovy, E. A survey of data augmentation approaches for NLP. arXiv 2021, arXiv:2105.03075. [Google Scholar]
- Gujjar, J.P.; Kumar, H.P.; Prasad, M.G. Advanced NLP Framework for Text Processing. In Proceedings of the 2023 6th International Conference on Information Systems and Computer Networks (ISCON), Mathura, India, 3–4 March 2023; pp. 1–3. [Google Scholar]
- Pérez-Cruz, F. Kullback-Leibler divergence estimation of continuous distributions. In Proceedings of the 2008 IEEE International Symposium on Information Theory, Toronto, ON, Canada, 6–11 July 2008; pp. 1666–1670. [Google Scholar]
- Johansson, P.; Bright, J.; Krishna, S.; Fischer, C.; Leslie, D. Exploring responsible applications of Synthetic Data to advance Online Safety Research and Development. arXiv 2024, arXiv:2402.04910. [Google Scholar] [CrossRef]
- Hardeniya, N.; Perkins, J.; Chopra, D.; Joshi, N.; Mathur, I. Natural Language Processing: Python and NLTK; Packt Publishing Ltd.: Birmingham, UK, 2016. [Google Scholar]
- Wolf, T.; Debut, L.; Sanh, V.; Chaumond, J.; Delangue, C.; Moi, A.; Cistac, P.; Rault, T.; Louf, R.; Funtowicz, M.; et al. Transformers: State-of-the-art natural language processing. In Proceedings of the 2020 Conference on Empirical Methods in Natural Language Processing: System Demonstrations, Online, 16–20 November 2020; pp. 38–45. [Google Scholar]
- Devlin, J. Bert: Pre-training of deep bidirectional transformers for language understanding. arXiv 2018, arXiv:1810.04805. [Google Scholar]
- Nadi, F.; Naghavipour, H.; Mehmood, T.; Azman, A.B.; Nagantheran, J.A.; Ting, K.S.K.; Adnan, N.M.I.B.N.; Sivarajan, R.A.; Veerah, S.A.; Rahmat, R.F. Sentiment Analysis Using Large Language Models: A Case Study of GPT-3.5. In Proceedings of the International Conference on Data Science and Emerging Technologies, Virtual, 4–5 December 2023; Springer: Singapore, 2023; pp. 161–168. [Google Scholar]
- Nadeem, S.; Mehmood, T.; Yaqoob, M. A Generic Framework for Ransomware Prediction and Classification with Artificial Neural Networks. In Proceedings of the International Conference on Data Science and Emerging Technologies, Virtual, 4–5 December 2023; Springer: Singapore, 2023; pp. 137–148. [Google Scholar]
- Géron, A. Hands-On Machine Learning with Scikit-Learn, Keras, and TensorFlow; O’Reilly Media, Inc.: Sebastopol, CA, USA, 2022. [Google Scholar]
- Jais, I.K.M.; Ismail, A.R.; Nisa, S.Q. Adam optimization algorithm for wide and deep neural network. Knowl. Eng. Data Sci. 2019, 2, 41–46. [Google Scholar] [CrossRef]
- Lashkari, A.H.; Kadir, A.F.A.; Taheri, L.; Ghorbani, A.A. Toward developing a systematic approach to generate benchmark android malware datasets and classification. In Proceedings of the 2018 International Carnahan Conference on Security Technology (ICCST), Montreal, QC, Canada, 22–25 October 2018; pp. 1–7. [Google Scholar]
- Lashkari, A.H.; Kadir, A.F.A.; Gonzalez, H.; Mbah, K.F.; Ghorbani, A.A. Towards a network-based framework for android malware detection and characterization. In Proceedings of the 2017 15th Annual Conference on Privacy, Security and Trust (PST), Calgary, AB, Canada, 28–30 August 2017; pp. 233–23309. [Google Scholar]
- Chen, J.; Tam, D.; Raffel, C.; Bansal, M.; Yang, D. An empirical survey of data augmentation for limited data learning in nlp. Trans. Assoc. Comput. Linguist. 2023, 11, 191–211. [Google Scholar] [CrossRef]
- Dai, H.; Liu, Z.; Liao, W.; Huang, X.; Cao, Y.; Wu, Z.; Zhao, L.; Xu, S.; Liu, W.; Liu, N.; et al. Auggpt: Leveraging chatgpt for text data augmentation. arXiv 2023, arXiv:2302.13007. [Google Scholar]
- Zhou, F.; Wang, D.; Xiong, Y.; Sun, K.; Wang, W. FAMCF: A few-shot Android malware family classification framework. Comput. Secur. 2024, 146, 104027. [Google Scholar] [CrossRef]
- Ghourabi, A. An Attention-Based Approach to Enhance the Detection and Classification of Android Malware. Comput. Mater. Contin. 2024, 80, 2743–2760. [Google Scholar] [CrossRef]


| Attribute | Significance |
|---|---|
| Source IP | The IP address of the sender device, which originates the traffic |
| Destination IP | The destination of the traffic data represents the IP address of the receiver. |
| Source Port | The port number used by the Sender for transmitting the data |
| Destination Port | The port number designated by the receiver to receive the data |
| Protocol | The communication protocol used for the communication between the sender and receiver |
| Malware Class | Samples Collected | Impact of Malware |
|---|---|---|
| Adware | 104 | Adware displays advertisements on the Android device |
| Ransomware | 101 | Malicious programs that stop access to system resources |
| Scareware | 102 | Scareware generates fake security alerts for users |
| SMS Malware | 109 | Malware that spreads through SMS to mobile phones |
| Malware Class | Apps | Impact on the Android Device |
|---|---|---|
| Adware | 20 | It attacks the security of the system by displaying malicious advertisements to the users |
| General Malware | 150 | Composed of different families of malware such as FakeAV, FakeFlash, and Penetho |
| Benign | 1500 | Non-malicious Apps |
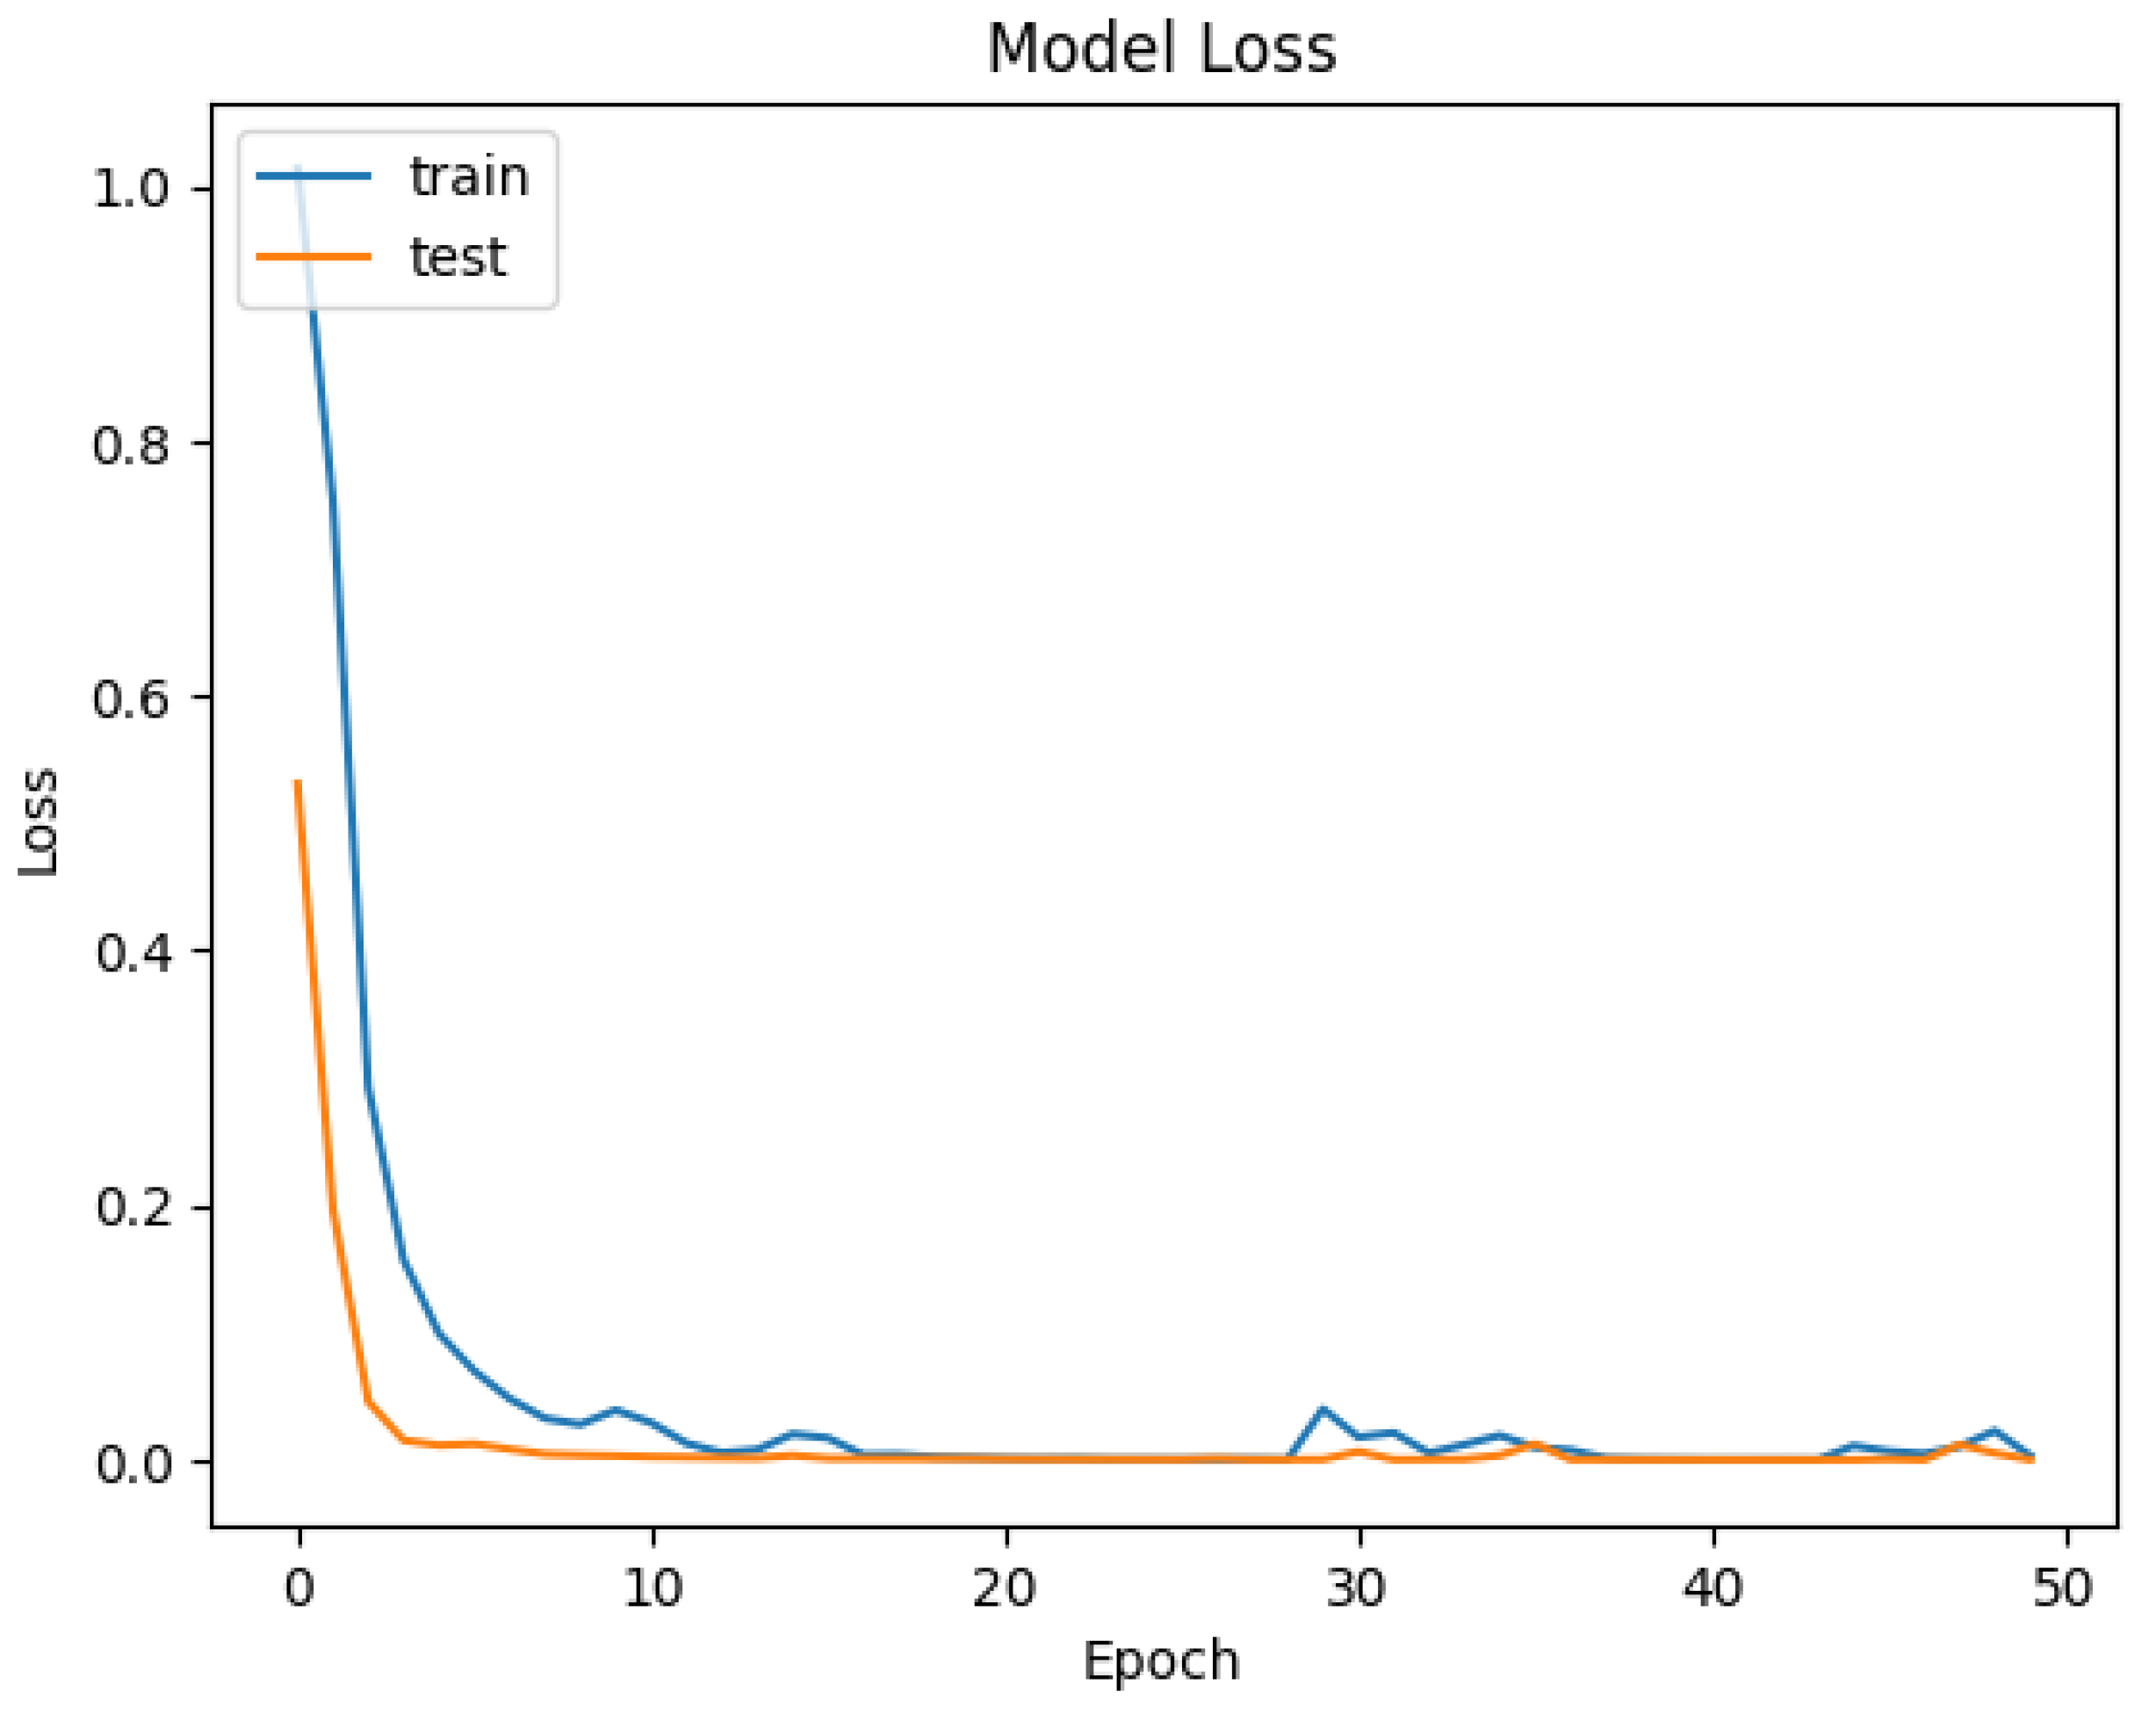
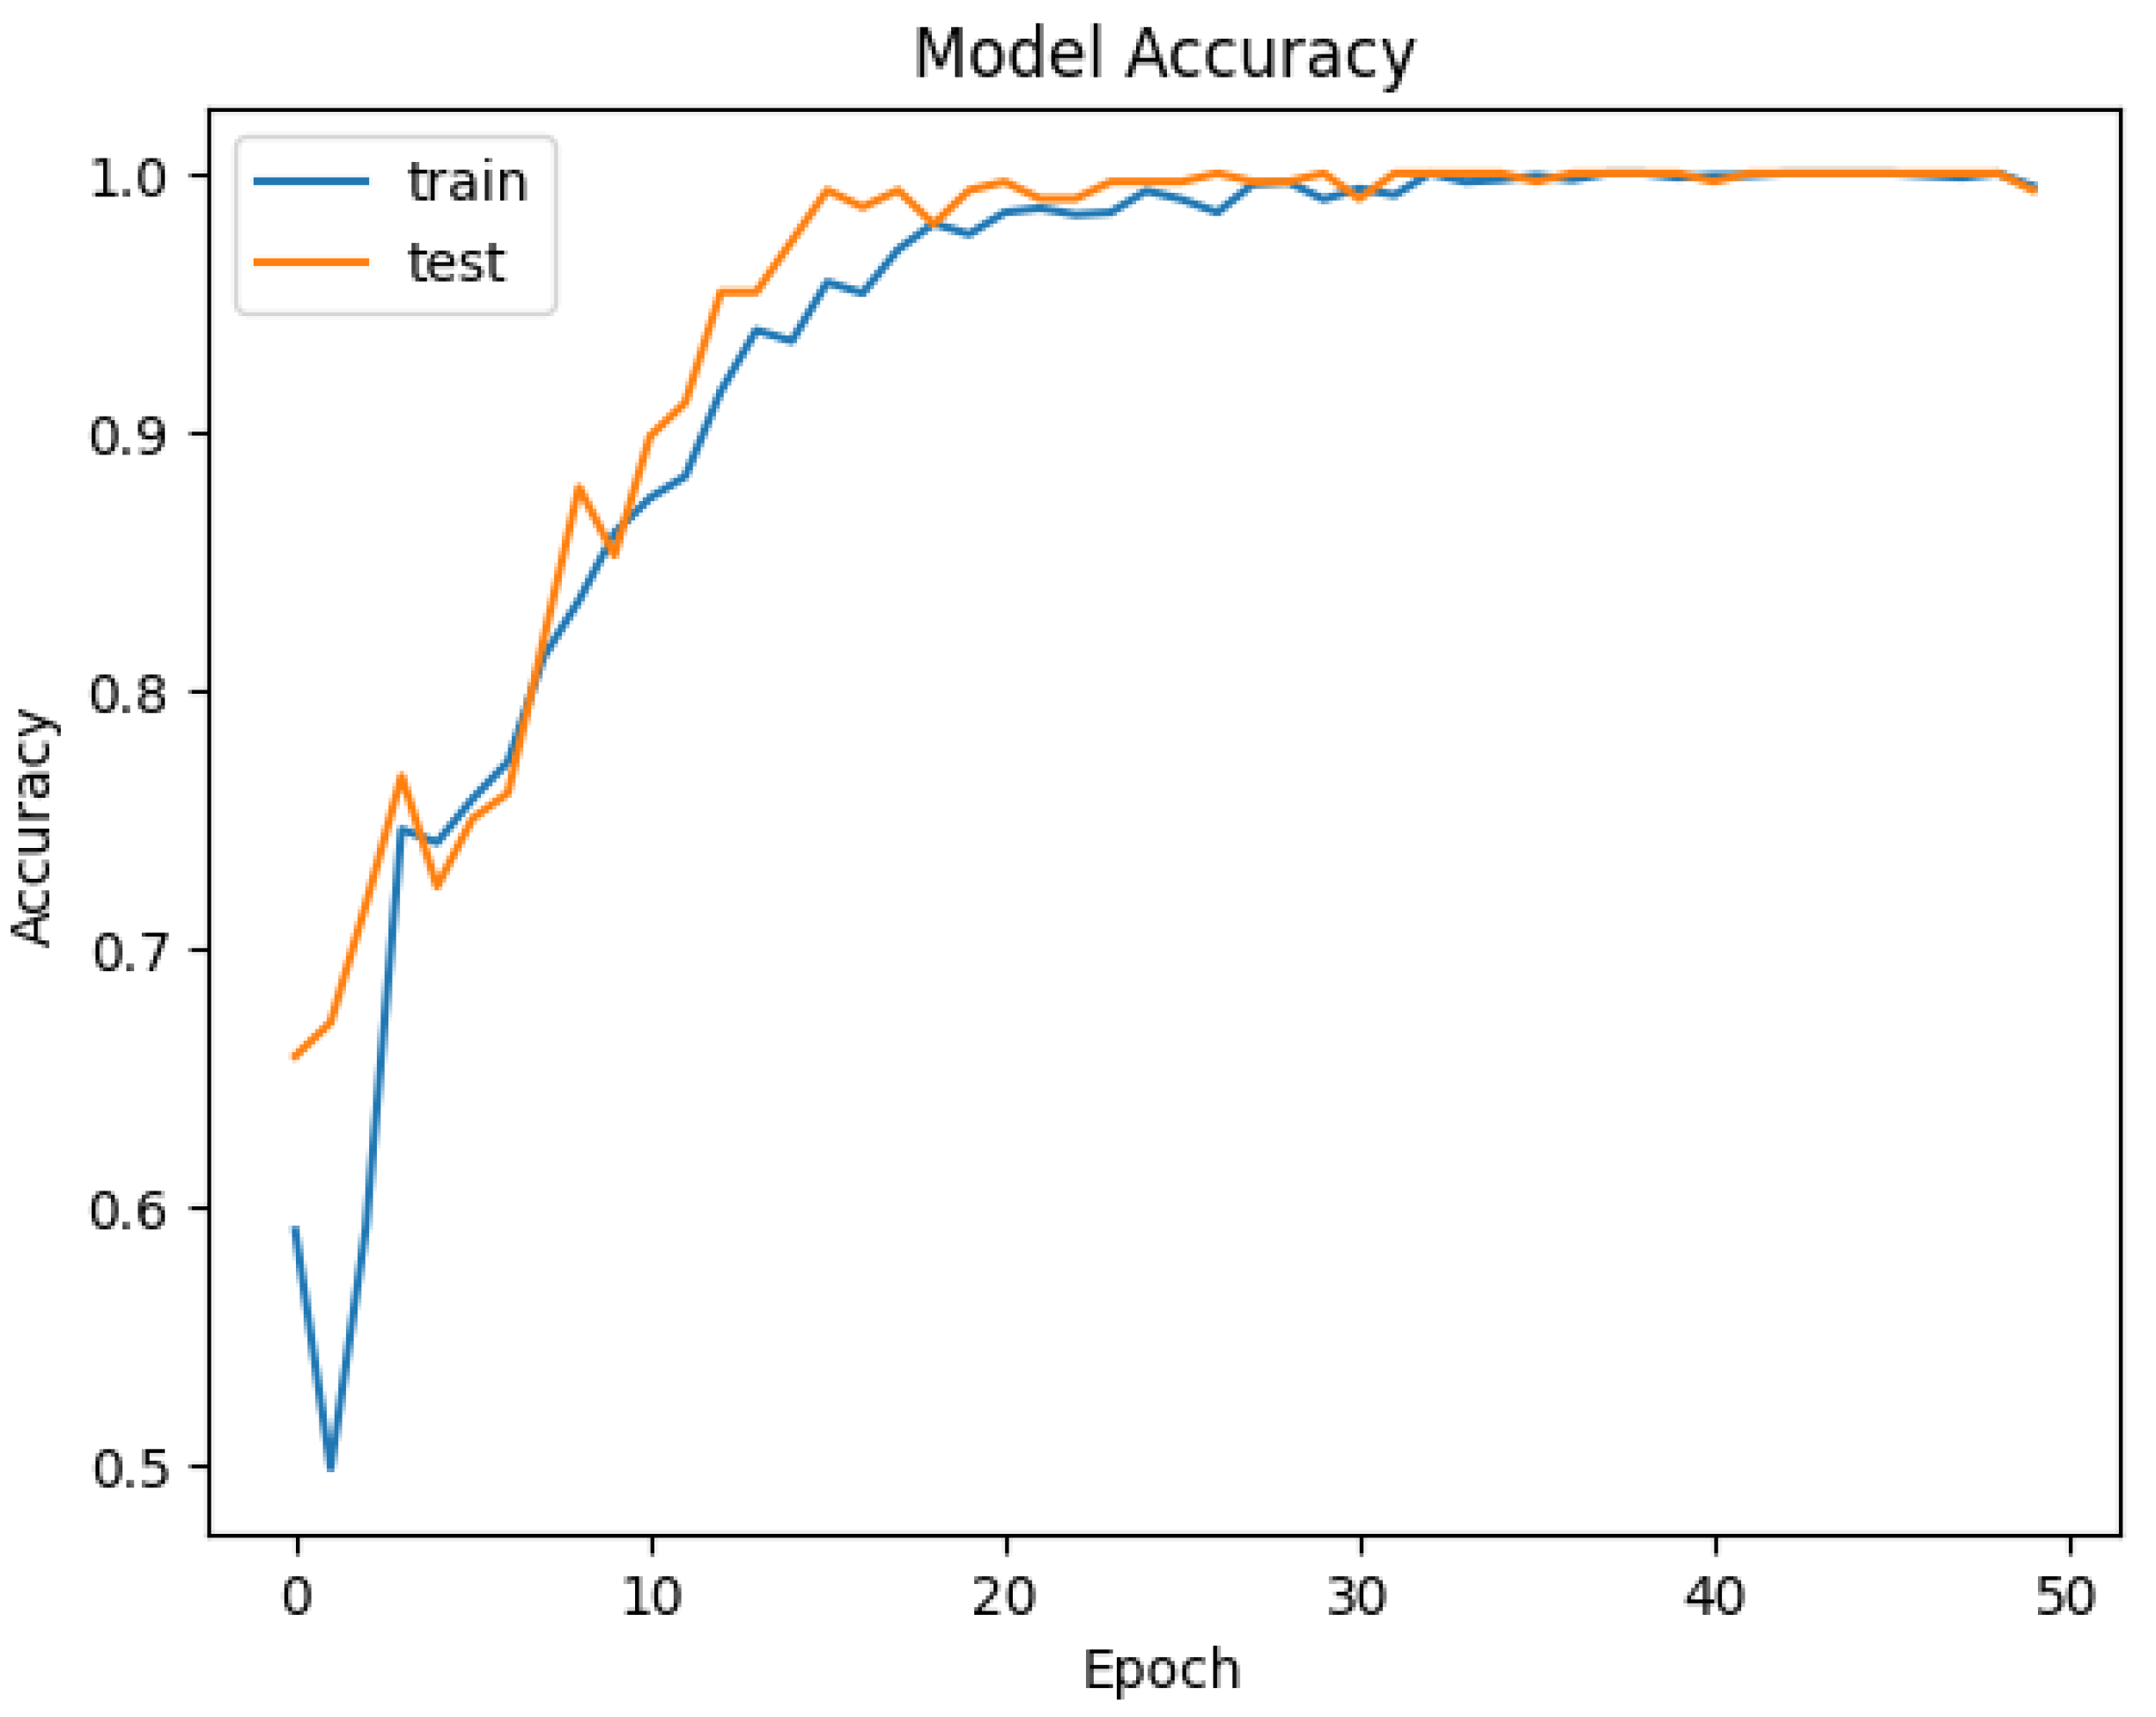
| Epoch | Training Loss | Training Accuracy | Validation Loss | Validation Accuracy |
|---|---|---|---|---|
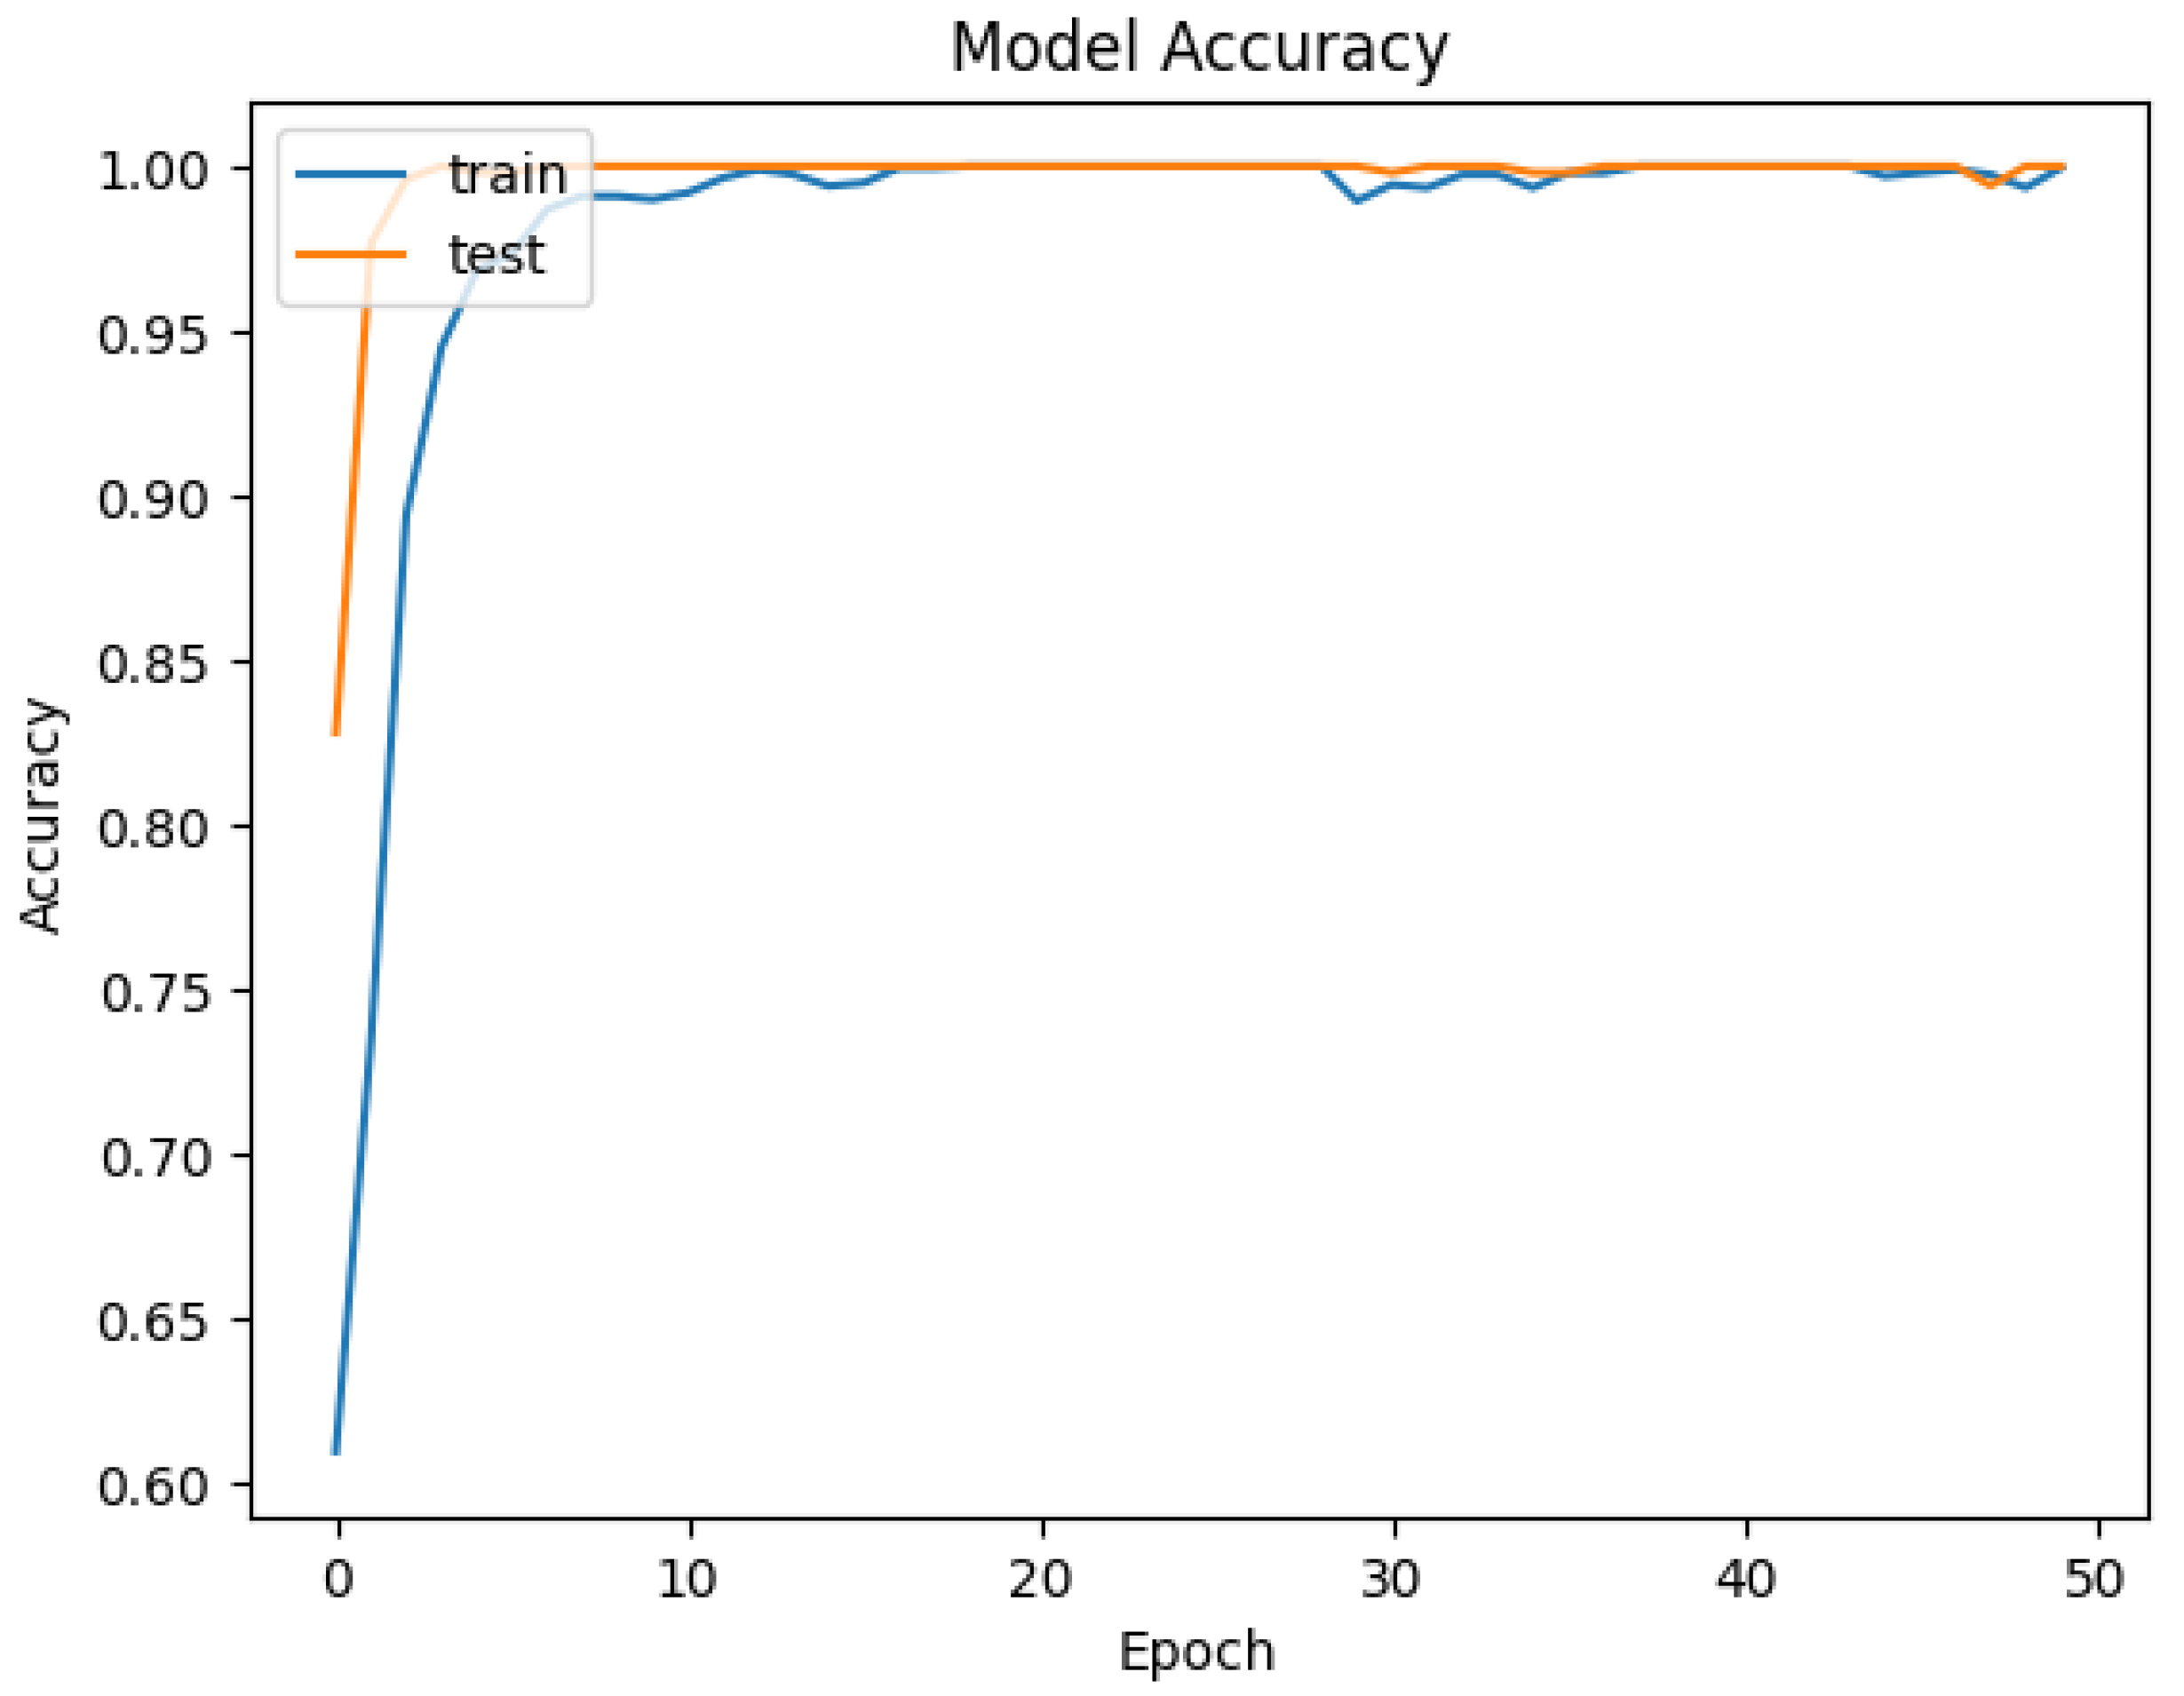
| 0 | 1.015 | 0.610 | 0.531 | 0.828 |
| 1 | 0.753 | 0.735 | 0.196 | 0.977 |
| 2 | 0.293 | 0.894 | 0.046 | 0.996 |
| 3 | 0.157 | 0.945 | 0.015 | 1.000 |
| 4 | 0.099 | 0.968 | 0.012 | 0.998 |
| 5 | 0.070 | 0.973 | 0.013 | 0.998 |
| 6 | 0.048 | 0.987 | 0.008 | 1.000 |
| 7 | 0.033 | 0.991 | 0.005 | 1.000 |
| 8 | 0.028 | 0.991 | 0.004 | 1.000 |
| 9 | 0.039 | 0.990 | 0.003 | 1.000 |
| 10 | 0.029 | 0.992 | 0.003 | 1.000 |
| 11 | 0.013 | 0.996 | 0.002 | 1.000 |
| 12 | 0.006 | 0.999 | 0.002 | 1.000 |
| 13 | 0.008 | 0.997 | 0.002 | 1.000 |
| 14 | 0.020 | 0.994 | 0.004 | 1.000 |
| 15 | 0.017 | 0.995 | 0.001 | 1.000 |
| 16 | 0.004 | 0.999 | 0.001 | 1.000 |
| 17 | 0.004 | 0.999 | 0.001 | 1.000 |
| 18 | 0.002 | 1.000 | 0.001 | 1.000 |
| 19 | 0.002 | 1.000 | 0.001 | 1.000 |
| 20 | 0.001 | 1.000 | 0.001 | 1.000 |
| 21 | 0.001 | 1.000 | 0.001 | 1.000 |
| 22 | 0.001 | 1.000 | 0.001 | 1.000 |
| 23 | 0.001 | 1.000 | 0.001 | 1.000 |
| 24 | 0.001 | 1.000 | 0.000 | 1.000 |
| 25 | 0.001 | 1.000 | 0.000 | 1.000 |
| 26 | 0.001 | 1.000 | 0.001 | 1.000 |
| 27 | 0.001 | 1.000 | 0.000 | 1.000 |
| 28 | 0.000 | 1.000 | 0.000 | 1.000 |
| 29 | 0.040 | 0.989 | 0.000 | 1.000 |
| 30 | 0.018 | 0.994 | 0.007 | 0.998 |
| 31 | 0.021 | 0.993 | 0.000 | 1.000 |
| 32 | 0.006 | 0.997 | 0.000 | 1.000 |
| 33 | 0.012 | 0.997 | 0.001 | 1.000 |
| 34 | 0.019 | 0.993 | 0.004 | 0.998 |
| 35 | 0.010 | 0.998 | 0.013 | 0.998 |
| 36 | 0.008 | 0.998 | 0.000 | 1.000 |
| 37 | 0.001 | 1.000 | 0.000 | 1.000 |
| 38 | 0.001 | 1.000 | 0.000 | 1.000 |
| 39 | 0.000 | 1.000 | 0.000 | 1.000 |
| 40 | 0.000 | 1.000 | 0.000 | 1.000 |
| 41 | 0.000 | 1.000 | 0.000 | 1.000 |
| 42 | 0.000 | 1.000 | 0.000 | 1.000 |
| 43 | 0.000 | 1.000 | 0.000 | 1.000 |
| 44 | 0.011 | 0.997 | 0.000 | 1.000 |
| 45 | 0.007 | 0.998 | 0.001 | 1.000 |
| 46 | 0.005 | 0.999 | 0.000 | 1.000 |
| 47 | 0.011 | 0.997 | 0.012 | 0.994 |
| 48 | 0.023 | 0.993 | 0.005 | 1.000 |
| 49 | 0.003 | 0.999 | 0.000 | 1.000 |
| Weighted | 0.057 | 0.980 | 0.018 | 0.996 |
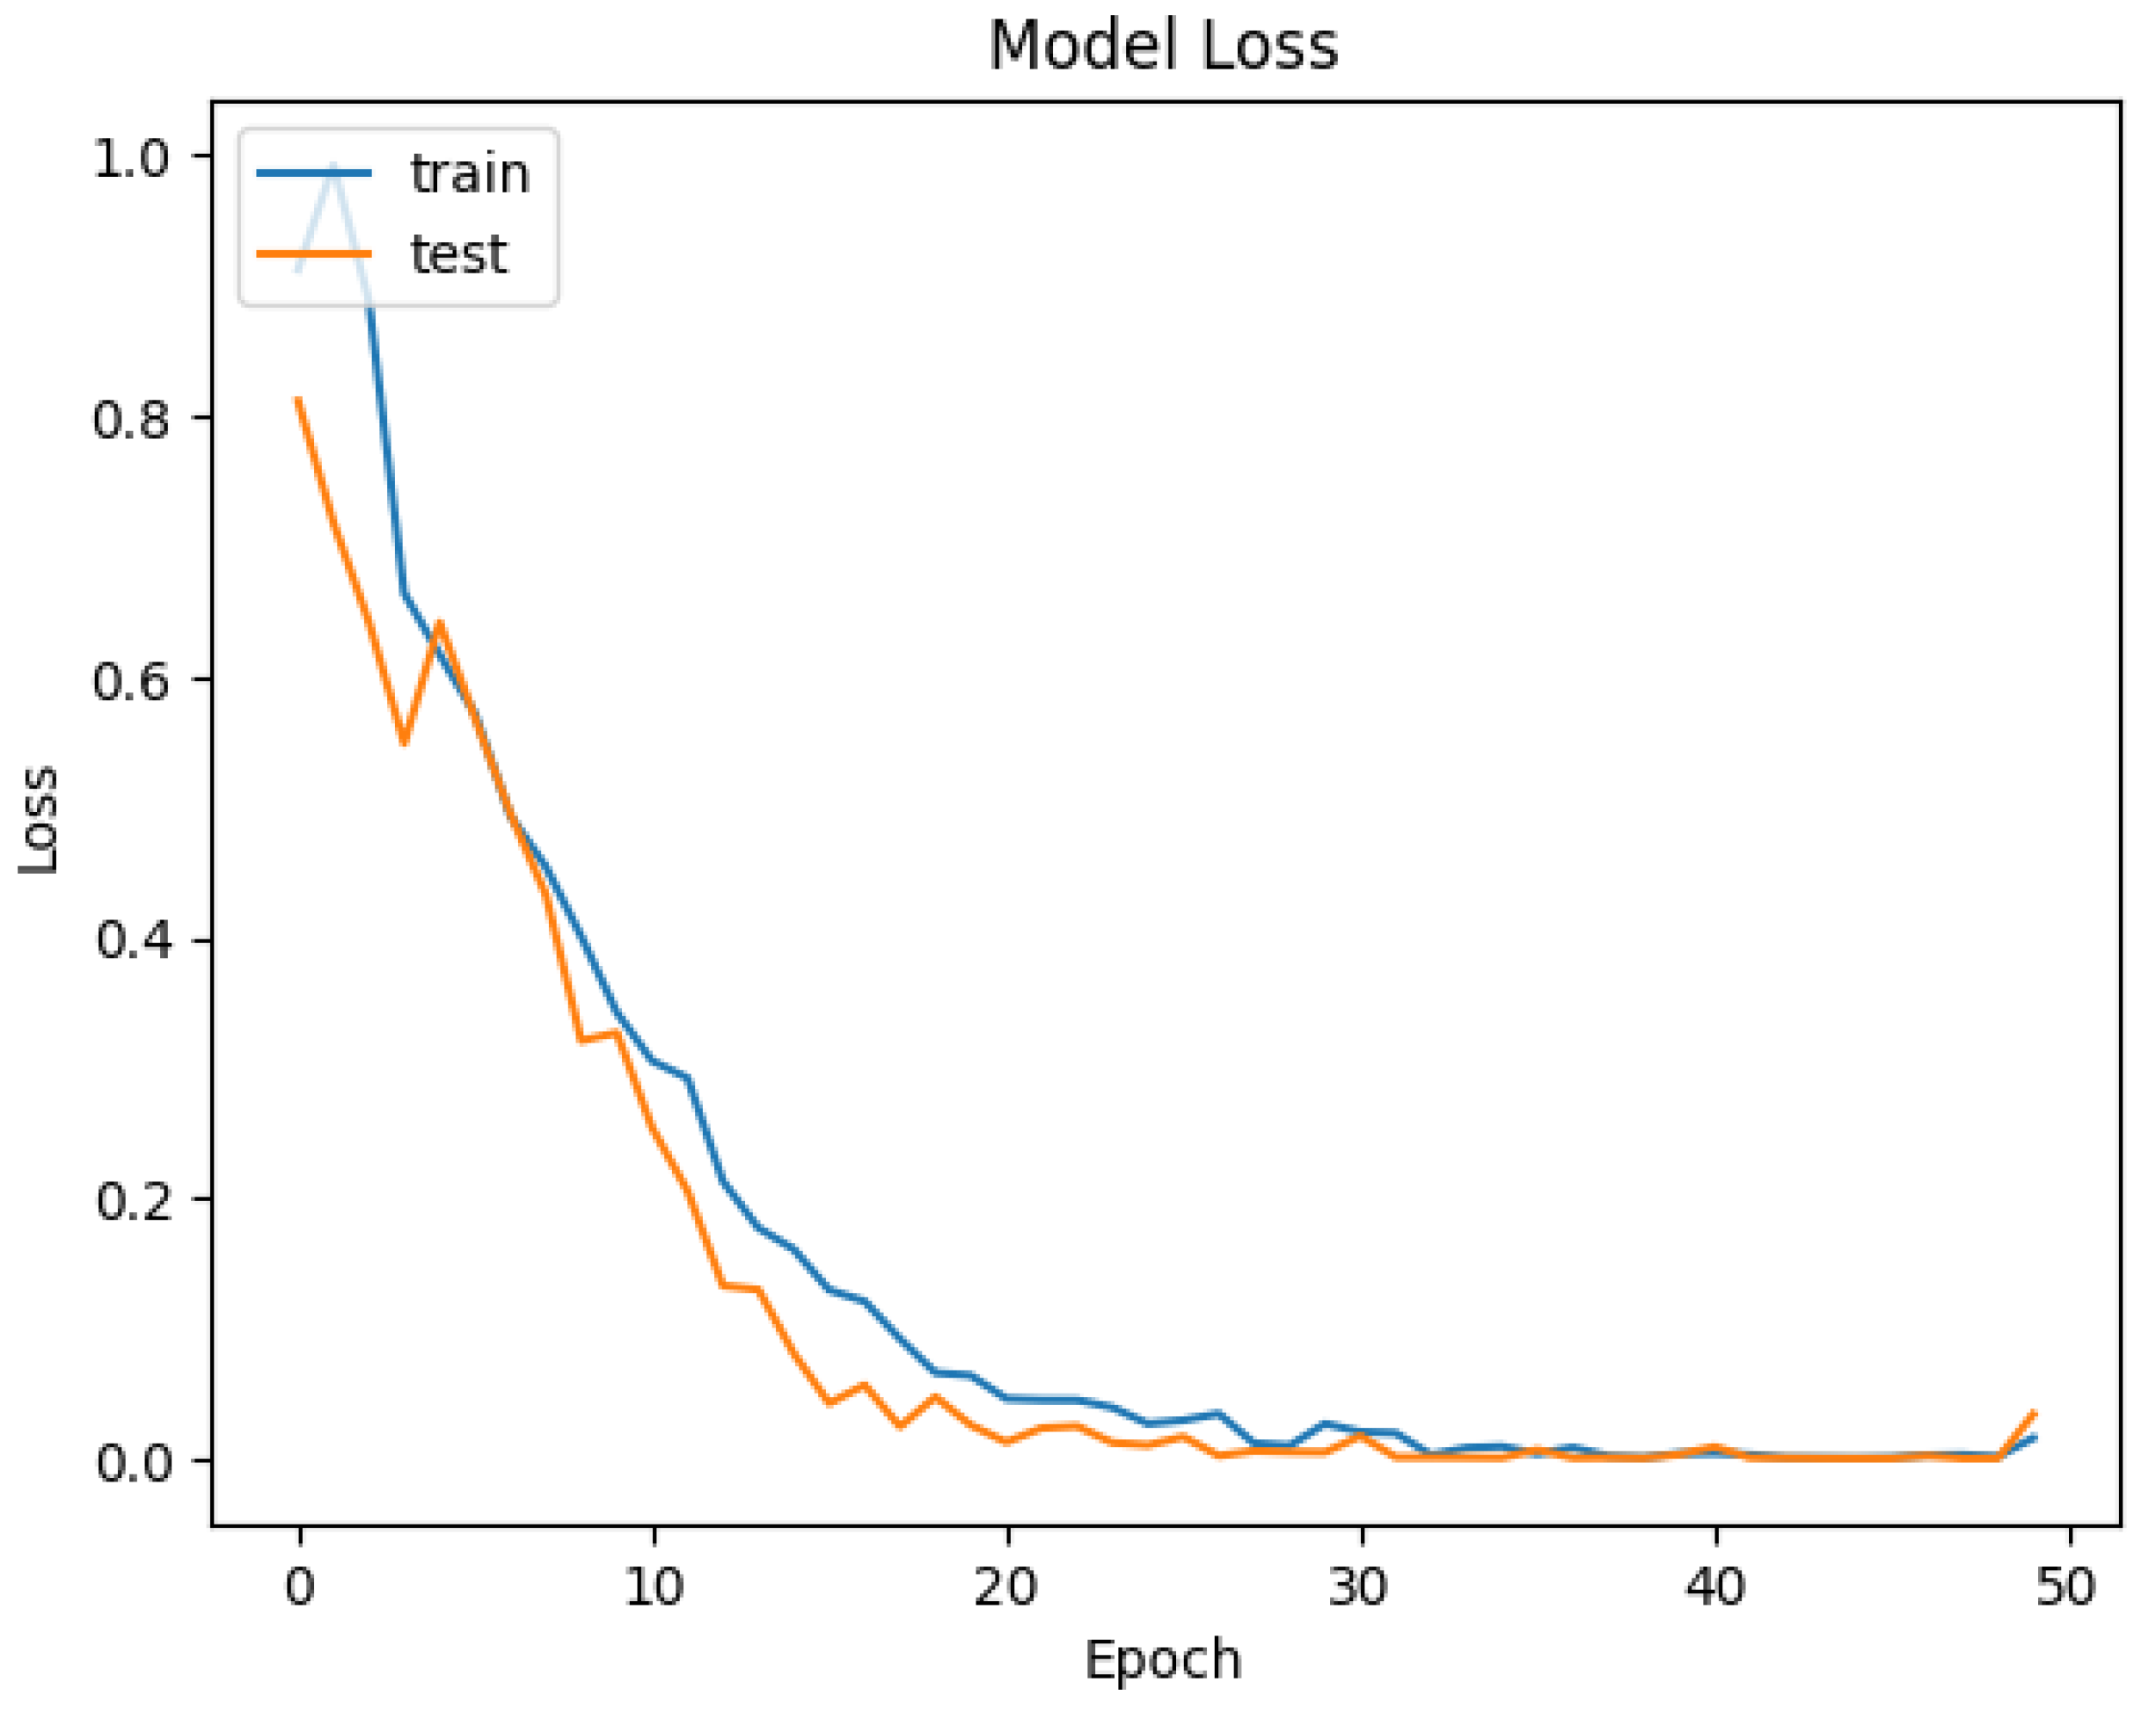
| Epoch | Training Loss | Training Accuracy | Validation Loss | Validation Accuracy |
|---|---|---|---|---|
| 0 | 0.912 | 0.590 | 0.811 | 0.658 |
| 1 | 0.992 | 0.498 | 0.718 | 0.671 |
| 2 | 0.888 | 0.592 | 0.642 | 0.717 |
| 3 | 0.664 | 0.746 | 0.549 | 0.766 |
| 4 | 0.617 | 0.741 | 0.642 | 0.724 |
| 5 | 0.571 | 0.758 | 0.568 | 0.819 |
| 6 | 0.493 | 0.772 | 0.495 | 0.819 |
| 7 | 0.454 | 0.813 | 0.433 | 0.819 |
| 8 | 0.401 | 0.834 | 0.321 | 0.878 |
| 9 | 0.343 | 0.861 | 0.327 | 0.898 |
| 10 | 0.305 | 0.874 | 0.254 | 0.898 |
| 11 | 0.292 | 0.883 | 0.206 | 0.974 |
| 12 | 0.213 | 0.916 | 0.133 | 0.974 |
| 13 | 0.177 | 0.939 | 0.130 | 0.974 |
| 14 | 0.161 | 0.935 | 0.081 | 0.974 |
| 15 | 0.130 | 0.958 | 0.043 | 0.993 |
| 16 | 0.121 | 0.954 | 0.057 | 0.993 |
| 17 | 0.092 | 0.970 | 0.025 | 0.993 |
| 18 | 0.066 | 0.981 | 0.048 | 0.997 |
| 19 | 0.064 | 0.976 | 0.026 | 0.993 |
| 20 | 0.046 | 0.985 | 0.013 | 0.993 |
| 21 | 0.045 | 0.986 | 0.024 | 0.997 |
| 22 | 0.045 | 0.984 | 0.025 | 0.997 |
| 23 | 0.040 | 0.985 | 0.012 | 0.997 |
| 24 | 0.027 | 0.993 | 0.011 | 1.000 |
| 25 | 0.030 | 0.990 | 0.017 | 1.000 |
| 26 | 0.035 | 0.985 | 0.002 | 1.000 |
| 27 | 0.012 | 0.996 | 0.006 | 1.000 |
| 28 | 0.010 | 0.997 | 0.005 | 1.000 |
| 29 | 0.027 | 0.990 | 0.005 | 0.997 |
| 30 | 0.021 | 0.994 | 0.018 | 1.000 |
| 31 | 0.020 | 0.992 | 0.001 | 1.000 |
| 32 | 0.003 | 1.000 | 0.001 | 1.000 |
| 33 | 0.009 | 0.997 | 0.001 | 1.000 |
| 34 | 0.010 | 0.997 | 0.001 | 1.000 |
| 35 | 0.004 | 0.999 | 0.007 | 1.000 |
| 36 | 0.009 | 0.997 | 0.001 | 1.000 |
| 37 | 0.002 | 1.000 | 0.001 | 1.000 |
| 38 | 0.001 | 1.000 | 0.001 | 1.000 |
| 39 | 0.004 | 0.998 | 0.003 | 1.000 |
| 40 | 0.004 | 0.999 | 0.009 | 1.000 |
| 41 | 0.003 | 0.999 | 0.001 | 1.000 |
| 42 | 0.001 | 1.000 | 0.001 | 1.000 |
| 43 | 0.001 | 1.000 | 0.001 | 1.000 |
| 44 | 0.001 | 1.000 | 0.000 | 1.000 |
| 45 | 0.001 | 1.000 | 0.000 | 1.000 |
| 46 | 0.003 | 0.999 | 0.002 | 1.000 |
| 47 | 0.003 | 0.998 | 0.000 | 1.000 |
| 48 | 0.002 | 1.000 | 0.000 | 1.000 |
| 49 | 0.016 | 0.995 | 0.034 | 1.000 |
| Weighted | 0.168 | 0.929 | 0.134 | 0.950 |
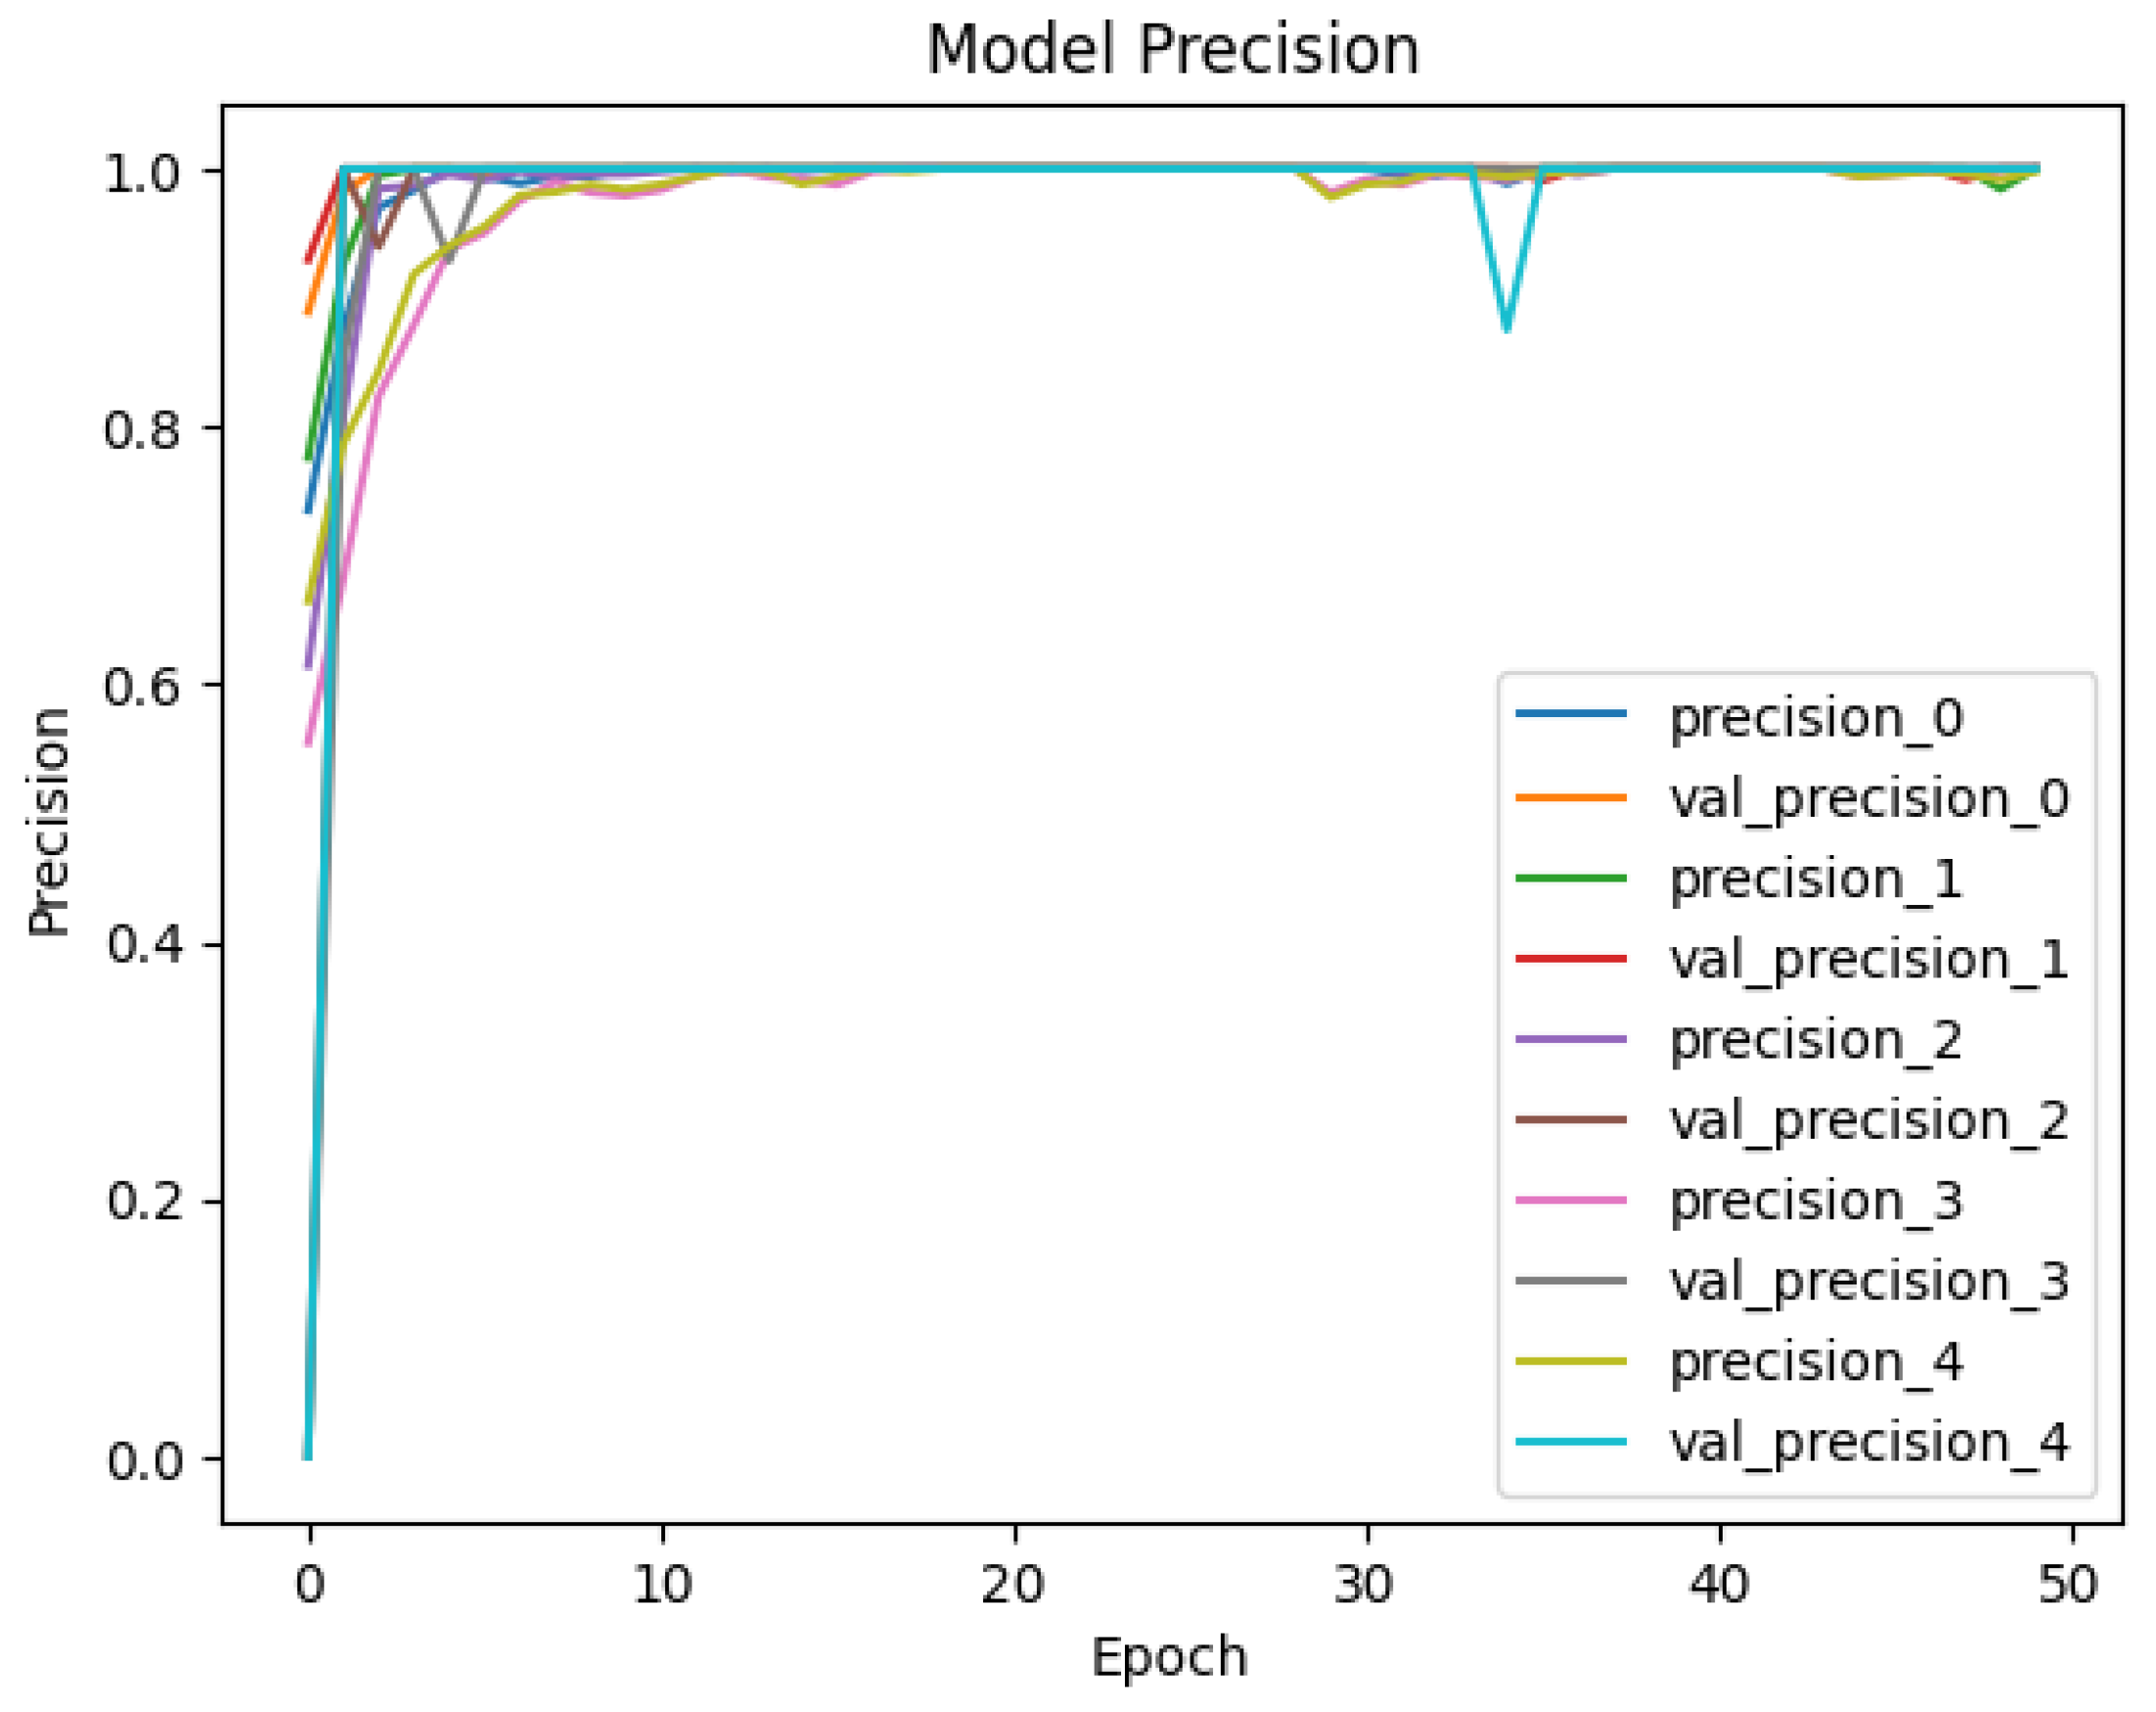
| SMS Malware | Benign | Adware | Ransomware | Scareware | Weighted | |
|---|---|---|---|---|---|---|
| Precision | 0.9973 | 0.9982 | 0.9788 | 0.9756 | 0.9775 | 0.9855 |
| Recall | 0.9993 | 0.9972 | 0.9773 | 0.9722 | 0.9627 | 0.9817 |
| F1-Score | 0.9983 | 0.9977 | 0.9780 | 0.9739 | 0.9700 | 0.9836 |
| Adware | Benign | General | Weighted | |
|---|---|---|---|---|
| Precision | 0.9484 | 0.8775 | 0.9439 | 0.9233 |
| Recall | 0.9313 | 0.8028 | 0.9932 | 0.9091 |
| F1-Score | 0.9398 | 0.8385 | 0.9679 | 0.9154 |
| SMS Malware | Benign | Adware | Ransomware | Scareware | Weighted | |
|---|---|---|---|---|---|---|
| Precision | 0.9397 | 0.9945 | 0.9582 | 0.9728 | 0.9767 | 0.9683 |
| Recall | 0.9365 | 0.9947 | 0.9622 | 0.9667 | 0.9873 | 0.9694 |
| F1-Score | 0.9381 | 0.9946 | 0.9602 | 0.9697 | 0.9819 | 0.9689 |
| Adware | Benign | General | Weighted | |
|---|---|---|---|---|
| Precision | 0.8488 | 0.9418 | 0.9814 | 0.9240 |
| Recall | 0.8338 | 0.9247 | 0.9973 | 0.9186 |
| F1-Score | 0.8413 | 0.9332 | 0.9893 | 0.9212 |
| Reference | Model | Result | Dataset Used |
|---|---|---|---|
| [56] | FAMCF model based on the few-shot learning-based classification of malware to deal with insufficient labeled samples in the dataset based on the features related to static analysis. | Ensemble accuracy—Unobfuscated: 95.44%; Obfuscated: 94.39% | CICInvesAndMal2019 dataset |
| [57] | The LightGBM (Light Gradient Boosting Machine) model performs feature extraction to identify the significant features for the classification of Android Malware Samples. | Accuracy: 98.64% to 98.71%; Reduction in Training Time: 80 to 28 s. | CCCS-CIC-AndMal-2020 |
| [23] | DCM-GIFT model is based on feature selection on gray-scale images of Malware signatures identified from traffic data, solving the problem of imbalanced classification results in Android software. | Recall: 95.99%; Average Recall: 98.37%; Average F1-Measure: Adware 98.78%, Benign 96.97%, Ransomware 99.35%, Scareware 96.91%, SMS Malware 99.84% | CIC-AndMal2017 and CCCS-CIC-AndMal-2020 |
| [30] | MalBERT, based on BERT (Bidirectional Encoder Representations from Transformers) executes a static analysis on the source code of Android applications using preprocessed features for malware classification. | Binary Accuracy: 0.9761; Multi-classification Accuracy: 0.9102 | Androzoo public dataset |
| Syn-detect Model | A two-stepped hybrid model having the process of creation of the synthetic TCP malware traffic data having malicious content with GPT-2 and classification of the malware using a fine-tuned LLM BERT with the inclusion of classification layers. | Dataset-1: 99.5%; Accuracy Weighted Precision: 0.9855; Weighted Recall: 0.9817; Weighted F1-Score: 0.9836; Dataset-2: 95%; Accuracy Weighted Precision: 0.9233; Weighted Recall: 0.9091; Weighted F1-Score: 0.9154 | CIC-AndMal2017 and CIC-AAGM2017 |
Disclaimer/Publisher’s Note: The statements, opinions and data contained in all publications are solely those of the individual author(s) and contributor(s) and not of MDPI and/or the editor(s). MDPI and/or the editor(s) disclaim responsibility for any injury to people or property resulting from any ideas, methods, instructions or products referred to in the content. |
© 2025 by the authors. Licensee MDPI, Basel, Switzerland. This article is an open access article distributed under the terms and conditions of the Creative Commons Attribution (CC BY) license (https://creativecommons.org/licenses/by/4.0/).
Share and Cite
Naseer, M.; Ullah, F.; Ijaz, S.; Naeem, H.; Alsirhani, A.; Alwakid, G.N.; Alomari, A. Obfuscated Malware Detection and Classification in Network Traffic Leveraging Hybrid Large Language Models and Synthetic Data. Sensors 2025, 25, 202. https://doi.org/10.3390/s25010202
Naseer M, Ullah F, Ijaz S, Naeem H, Alsirhani A, Alwakid GN, Alomari A. Obfuscated Malware Detection and Classification in Network Traffic Leveraging Hybrid Large Language Models and Synthetic Data. Sensors. 2025; 25(1):202. https://doi.org/10.3390/s25010202
Chicago/Turabian StyleNaseer, Mehwish, Farhan Ullah, Samia Ijaz, Hamad Naeem, Amjad Alsirhani, Ghadah Naif Alwakid, and Abdullah Alomari. 2025. "Obfuscated Malware Detection and Classification in Network Traffic Leveraging Hybrid Large Language Models and Synthetic Data" Sensors 25, no. 1: 202. https://doi.org/10.3390/s25010202
APA StyleNaseer, M., Ullah, F., Ijaz, S., Naeem, H., Alsirhani, A., Alwakid, G. N., & Alomari, A. (2025). Obfuscated Malware Detection and Classification in Network Traffic Leveraging Hybrid Large Language Models and Synthetic Data. Sensors, 25(1), 202. https://doi.org/10.3390/s25010202