

Random Convolutional Kernel Transform with Empirical Mode Decomposition for Classification of Insulators from Power Grid

 ,
,  ,
,  and
and 
Abstract
1. Introduction
- (i)
- An efficient classification framework that combines the advantages of Rocket approaches and machine learning models for the time series classification of medium voltage insulators is proposed, increasing classification accuracy and generalization capabilities.
- (ii)
- The impact of integrating empirical mode decomposition methods with the proposed framework is shown, with significant improvements in classification accuracy.
- (iii)
- Several classification algorithms are comprehensively compared to provide a benchmark for performance evaluation. This comparison will help engineers to select the most appropriate method for their specific insulator classification task, considering classification accuracy versus model complexity.
2. Related Works
2.1. Visual Inspections and Classification
2.2. Time Series and Machine Learning
2.3. Ultrasound Detector
3. Insulators Ultrasound Measurement
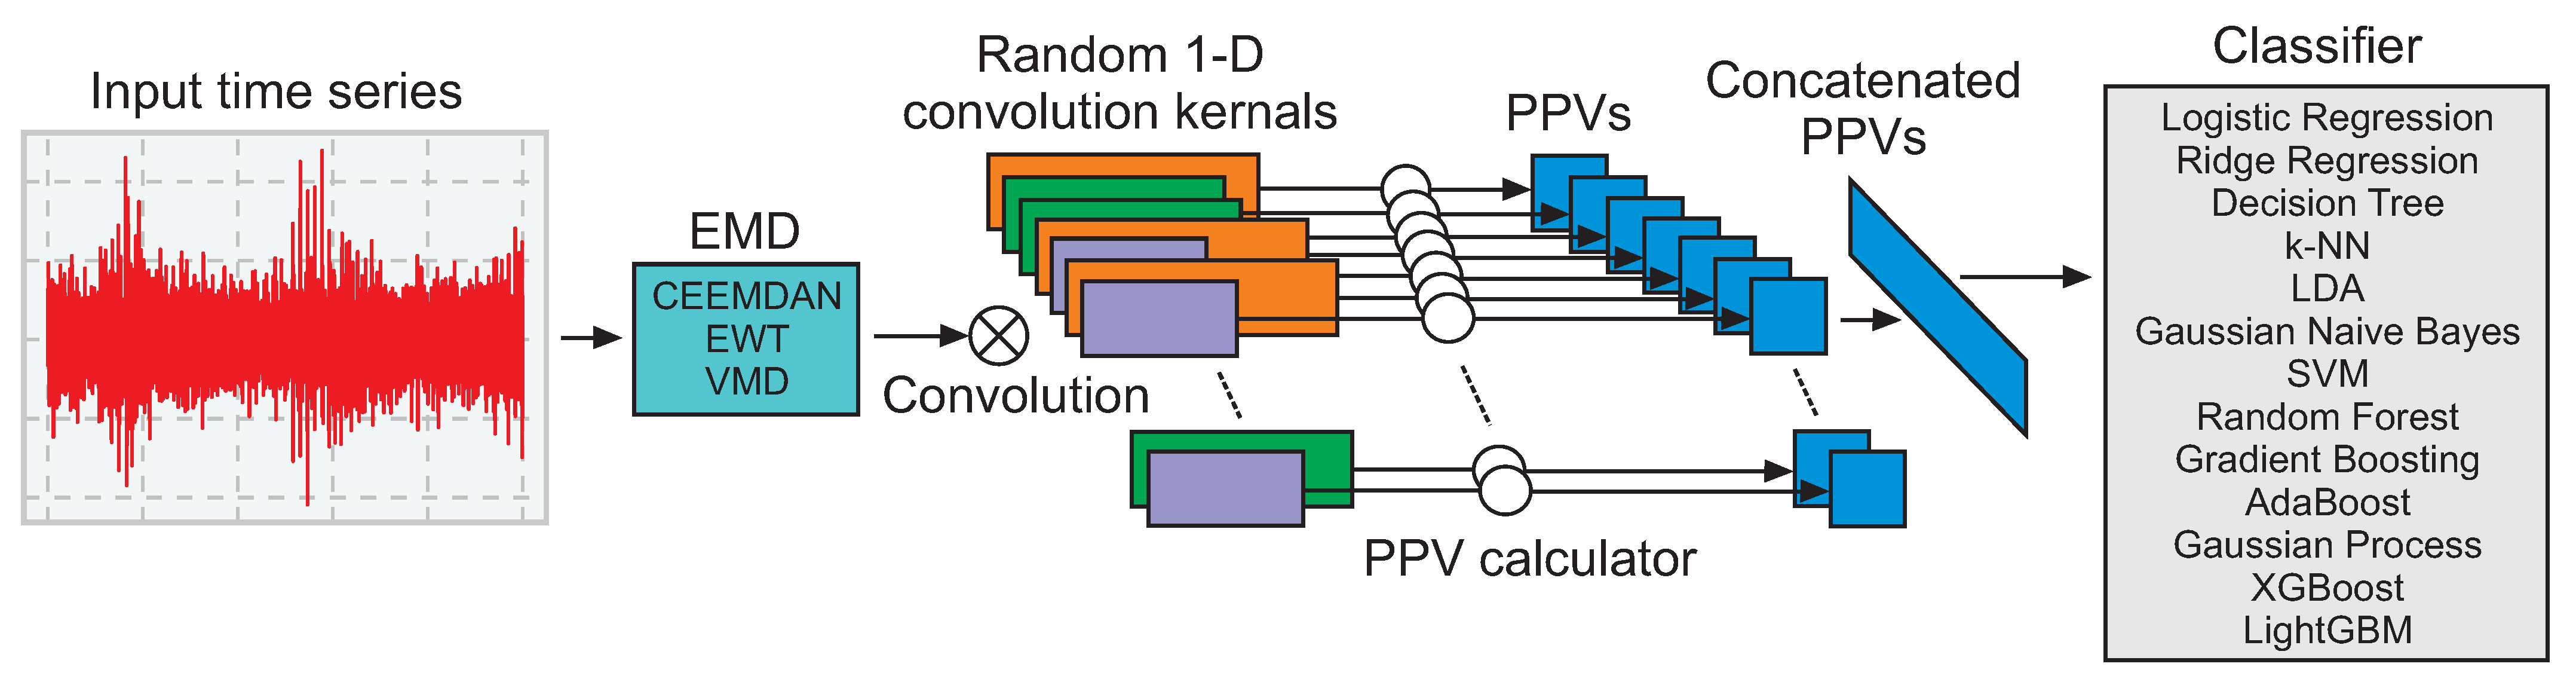
4. Methodology
4.1. Empirical Mode Decomposition
| Algorithm 1: EWT |
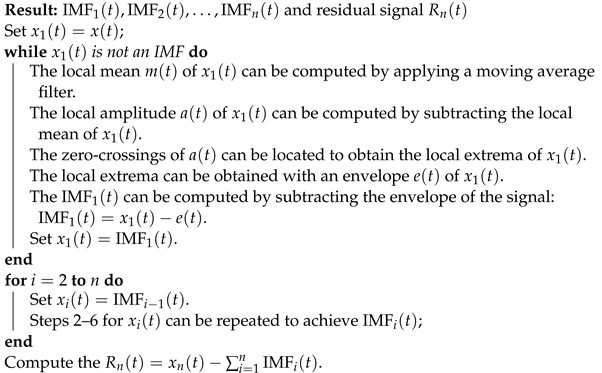 |
4.2. Classification Methods
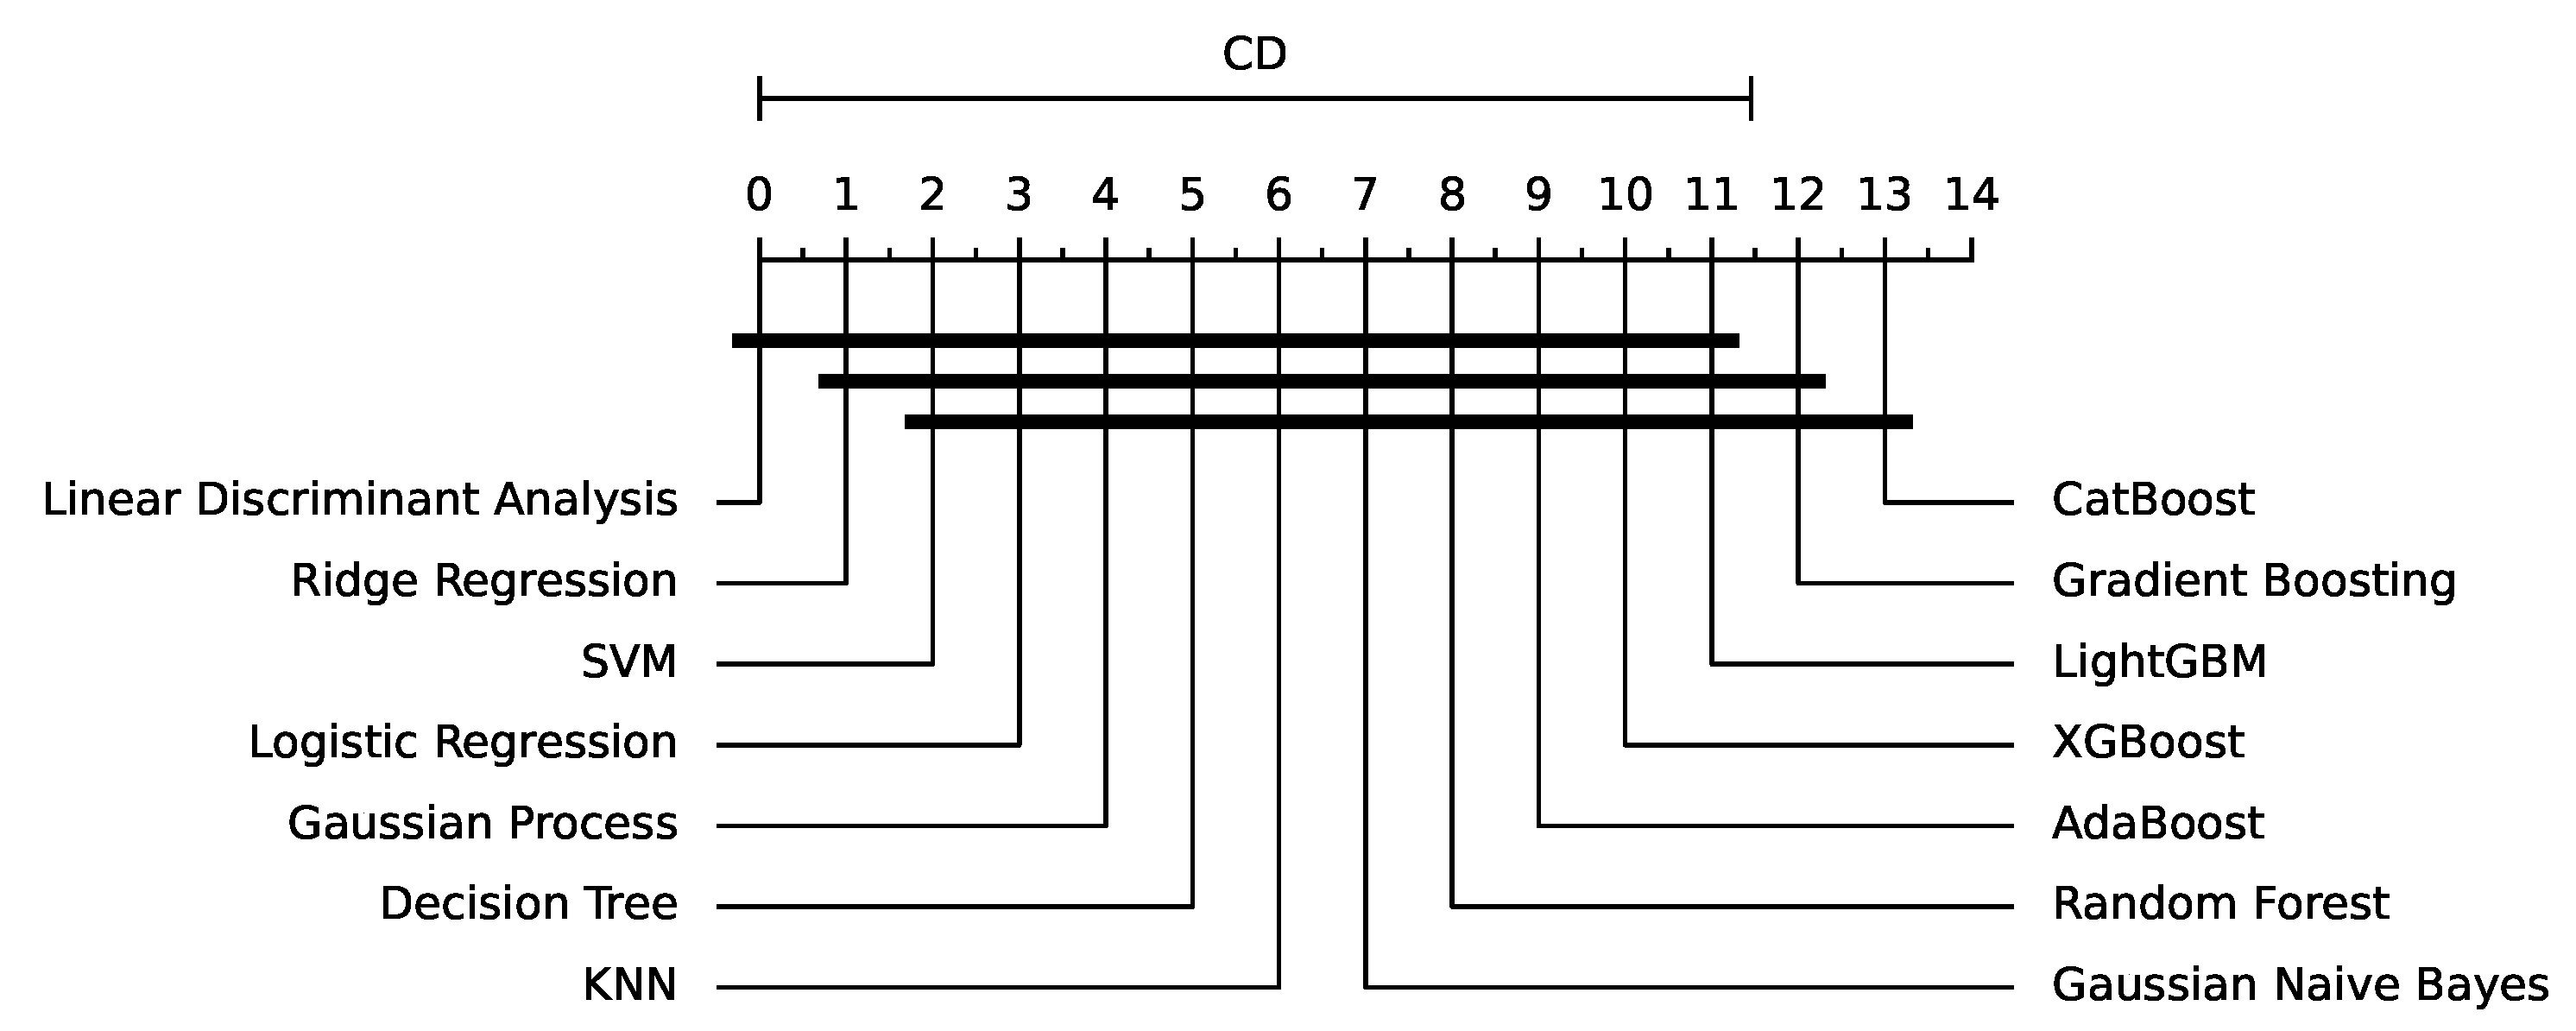
5. Results
5.1. Empirical Mode Decomposition
5.2. Discussion
- Consider the trade-offs with computational resources and training timeframes carefully when using longer time windows to increase the fault detection models’ accuracy.
- Consider the use of tree-based algorithms for insulator failure detection, such as CatBoost, LightGBM, and gradient boosting, while being cautious of overfitting concerns and using regularization techniques as necessary. To improve the efficiency of linear algorithms and potentially reduce model complexity while retaining high accuracy, use data transforms like Rocket, MiniRocket, or MultiRocket.
- Employ EMD methods to enhance the performance of less complex regression methods by providing a more refined representation of the data and improving fault detection capabilities.
6. Conclusions and Future Research Directions
Author Contributions
Funding
Institutional Review Board Statement
Informed Consent Statement
Data Availability Statement
Conflicts of Interest
References
- Corso, M.P.; Stefenon, S.F.; Couto, V.F.; Cabral, S.H.L.; Nied, A. Evaluation of methods for electric field calculation in transmission lines. IEEE Lat. Am. Trans. 2018, 16, 2970–2976. [Google Scholar] [CrossRef]
- Salem, A.A.; Lau, K.Y.; Ishak, M.T.; Abdul-Malek, Z.; Al-Gailani, S.A.; Al-Ameri, S.M.; Mohammed, A.; Alashbi, A.A.S.; Ghoneim, S.S.M. Monitoring porcelain insulator condition based on leakage current characteristics. Materials 2022, 15, 6370. [Google Scholar] [CrossRef] [PubMed]
- Ibrahim, A.; Dalbah, A.; Abualsaud, A.; Tariq, U.; El-Hag, A. Application of machine learning to evaluate insulator surface erosion. IEEE Trans. Instrum. Meas. 2020, 69, 314–316. [Google Scholar] [CrossRef]
- Stefenon, S.F.; Yow, K.C.; Nied, A.; Meyer, L.H. Classification of distribution power grid structures using inception v3 deep neural network. Electr. Eng. 2022, 104, 4557–4569. [Google Scholar] [CrossRef]
- Yang, D.; Cao, B.; Li, Z.; Yang, L.; Wu, Y. On-line monitoring, data analysis for electrolytic corrosion of ±800 kV high voltage direct current insulators. Int. J. Electr. Power Energy Syst. 2021, 131, 107097. [Google Scholar] [CrossRef]
- Stefenon, S.F.; Grebogi, R.B.; Freire, R.Z.; Nied, A.; Meyer, L.H. Optimized ensemble extreme learning machine for classification of electrical insulators conditions. IEEE Trans. Ind. Electron. 2020, 67, 5170–5178. [Google Scholar] [CrossRef]
- Stefenon, S.F.; Freire, R.Z.; Coelho, L.S.; Meyer, L.H.; Grebogi, R.B.; Buratto, W.G.; Nied, A. Electrical insulator fault forecasting based on a wavelet neuro-fuzzy system. Energies 2020, 13, 484. [Google Scholar] [CrossRef]
- Ilomuanya, C.; Nekahi, A.; Farokhi, S. A study of the cleansing effect of precipitation and wind on polluted outdoor high voltage glass cap and pin insulator. IEEE Access 2022, 10, 20669–20676. [Google Scholar] [CrossRef]
- Stefenon, S.F.; Oliveira, J.R.; Coelho, A.S.; Meyer, L.H. Diagnostic of insulators of conventional grid through LabVIEW analysis of FFT signal generated from ultrasound detector. IEEE Lat. Am. Trans. 2017, 15, 884–889. [Google Scholar] [CrossRef]
- Corso, M.P.; Stefenon, S.F.; Singh, G.; Matsuo, M.V.; Perez, F.L.; Leithardt, V.R.Q. Evaluation of visible contamination on power grid insulators using convolutional neural networks. Electr. Eng. 2023, 105, 3881–3894. [Google Scholar] [CrossRef]
- Stefenon, S.F.; Seman, L.O.; Sopelsa Neto, N.F.; Meyer, L.H.; Mariani, V.C.; Coelho, L.d.S. Group method of data handling using Christiano-Fitzgerald random walk filter for insulator fault prediction. Sensors 2023, 23, 6118. [Google Scholar] [CrossRef] [PubMed]
- Wang, H.; Cheng, L.; Liao, R.; Zhang, S.; Yang, L. Nonlinear ultrasonic nondestructive detection and modelling of kissing defects in high voltage composite insulators. IEEE Trans. Dielectr. Electr. Insul. 2020, 27, 924–931. [Google Scholar] [CrossRef]
- Salem, A.A.; Lau, K.Y.; Rahiman, W.; Abdul-Malek, Z.; Al-Gailani, S.A.; Rahman, R.A.; Al-Ameri, S. Leakage current characteristics in estimating insulator reliability: Experimental investigation and analysis. Sci. Rep. 2022, 12, 14974. [Google Scholar] [CrossRef] [PubMed]
- Stefenon, S.F.; Singh, G.; Souza, B.J.; Freire, R.Z.; Yow, K.C. Optimized hybrid YOLOu-Quasi-ProtoPNet for insulators classification. IET Gener. Transm. Distrib. 2023, 17, 3501–3511. [Google Scholar] [CrossRef]
- Salem, A.A.; Lau, K.Y.; Abdul-Malek, Z.; Al-Gailani, S.A.; Tan, C.W. Flashover voltage of porcelain insulator under various pollution distributions: Experiment and modeling. Electr. Power Syst. Res. 2022, 208, 107867. [Google Scholar] [CrossRef]
- Abanda, A.; Mori, U.; Lozano, J.A. A review on distance based time series classification. Data Min. Knowl. Discov. 2019, 33, 378–412. [Google Scholar] [CrossRef]
- Faouzi, J. Time series classification: A review of algorithms and implementations. Mach. Learn. (Emerg. Trends Appl.) 2022, 1, 1–34. [Google Scholar]
- Ismail Fawaz, H.; Forestier, G.; Weber, J.; Idoumghar, L.; Muller, P.A. Deep learning for time series classification: A review. Data Min. Knowl. Discov. 2019, 33, 917–963. [Google Scholar] [CrossRef]
- Dempster, A.; Petitjean, F.; Webb, G.I. ROCKET: Exceptionally fast and accurate time series classification using random convolutional kernels. Data Min. Knowl. Discov. 2020, 34, 1454–1495. [Google Scholar] [CrossRef]
- Dempster, A.; Schmidt, D.F.; Webb, G.I. Minirocket: A very fast (almost) deterministic transform for time series classification. In Proceedings of the Conference on Knowledge Discovery & Data Mining, Virtual, 14–18 August 2021; Volume 27, pp. 248–257. [Google Scholar] [CrossRef]
- Tan, C.W.; Dempster, A.; Bergmeir, C.; Webb, G.I. MultiRocket: Multiple pooling operators and transformations for fast and effective time series classification. Data Min. Knowl. Discov. 2022, 36, 1623–1646. [Google Scholar] [CrossRef]
- Yin, X.; Liu, F.; Cai, R.; Yang, X.; Zhang, X.; Ning, M.; Shen, S. Research on seismic signal analysis based on machine learning. Appl. Sci. 2022, 12, 8389. [Google Scholar] [CrossRef]
- Tao, S.; Chen, J.; Zhou, B.; Zhang, H. Simultaneous Robust State and Sensor Fault Estimation of Autonomous Vehicle via Synthesized Design of Dynamic and Learning Observers. IEEE Trans. Veh. Technol. 2023, 1–12. [Google Scholar] [CrossRef]
- He, Z.; Chen, Y.; Zhang, H.; Zhang, D. WKN-OC: A New Deep Learning Method for Anomaly Detection in Intelligent Vehicles. IEEE Trans. Intell. Veh. 2023, 8, 2162–2172. [Google Scholar] [CrossRef]
- Stefenon, S.F.; Branco, N.W.; Nied, A.; Bertol, D.W.; Finardi, E.C.; Sartori, A.; Meyer, L.H.; Grebogi, R.B. Analysis of training techniques of ANN for classification of insulators in electrical power systems. IET Gener. Transm. Distrib. 2020, 14, 1591–1597. [Google Scholar] [CrossRef]
- Moreno, S.R.; Seman, L.O.; Stefenon, S.F.; dos Santos Coelho, L.; Mariani, V.C. Enhancing wind speed forecasting through synergy of machine learning, singular spectral analysis, and variational mode decomposition. Energy 2024, 292, 130493. [Google Scholar] [CrossRef]
- Moreno, S.R.; Mariani, V.C.; dos Santos Coelho, L. Hybrid multi-stage decomposition with parametric model applied to wind speed forecasting in Brazilian Northeast. Renew. Energy 2021, 164, 1508–1526. [Google Scholar] [CrossRef]
- Ribeiro, M.H.D.M.; Stefenon, S.F.; de Lima, J.D.; Nied, A.; Mariani, V.C.; Coelho, L.d.S. Electricity Price Forecasting Based on Self-Adaptive Decomposition and Heterogeneous Ensemble Learning. Energies 2020, 13, 5190. [Google Scholar] [CrossRef]
- Klaar, A.C.R.; Stefenon, S.F.; Seman, L.O.; Mariani, V.C.; Coelho, L.d.S. Optimized EWT-Seq2Seq-LSTM with attention mechanism to insulators fault prediction. Sensors 2023, 23, 3202. [Google Scholar] [CrossRef]
- Sopelsa Neto, N.F.; Stefenon, S.F.; Meyer, L.H.; Ovejero, R.G.; Leithardt, V.R.Q. Fault prediction based on leakage current in contaminated insulators using enhanced time series forecasting models. Sensors 2022, 22, 6121. [Google Scholar] [CrossRef]
- Medeiros, A.; Sartori, A.; Stefenon, S.F.; Meyer, L.H.; Nied, A. Comparison of artificial intelligence techniques to failure prediction in contaminated insulators based on leakage current. J. Intell. Fuzzy Syst. 2022, 42, 3285–3298. [Google Scholar] [CrossRef]
- Zhang, L.; Qin, L.; Qin, Z.; Chu, F. Energy harvesting from gravity-induced deformation of rotating shaft for long-term monitoring of rotating machinery. Smart Mater. Struct. 2022, 31, 125008. [Google Scholar] [CrossRef]
- Wang, Q.; Xu, B.; Tan, D.; Hu, X.; Yang, Y.; Huang, J.; Gao, Y.; Liu, X. Nature-inspired scalable high-performance triboelectric nanogenerators for energy harvesting and sensing. Nano Energy 2024, 121, 109217. [Google Scholar] [CrossRef]
- Tao, X.; Zhang, D.; Wang, Z.; Liu, X.; Zhang, H.; Xu, D. Detection of Power Line Insulator Defects Using Aerial Images Analyzed With Convolutional Neural Networks. IEEE Trans. Syst. Man, Cybern. Syst. 2020, 50, 1486–1498. [Google Scholar] [CrossRef]
- Tan, J. Automatic insulator detection for power line using aerial images powered by convolutional neural networks. J. Phys. Conf. Ser. 2021, 1748, 42012. [Google Scholar] [CrossRef]
- Mano, T.; Ohtsuki, T. Application of convolutional neural network to quantum percolation in topological insulators. J. Phys. Soc. Jpn. 2019, 88, 123704. [Google Scholar] [CrossRef]
- She, L.; Fan, Y.; Xu, M.; Wang, J.; Xue, J.; Ou, J. Insulator Breakage Detection Utilizing a Convolutional Neural Network Ensemble Implemented With Small Sample Data Augmentation and Transfer Learning. IEEE Trans. Power Deliv. 2022, 37, 2787–2796. [Google Scholar] [CrossRef]
- Prates, R.M.; Cruz, R.; Marotta, A.P.; Ramos, R.P.; Simas Filho, E.F.; Cardoso, J.S. Insulator visual non-conformity detection in overhead power distribution lines using deep learning. Comput. Electr. Eng. 2019, 78, 343–355. [Google Scholar] [CrossRef]
- Singh, G.; Stefenon, S.F.; Yow, K.C. Interpretable visual transmission lines inspections using pseudo-prototypical part network. Mach. Vis. Appl. 2023, 34, 41. [Google Scholar] [CrossRef]
- Sadykova, D.; Pernebayeva, D.; Bagheri, M.; James, A. IN-YOLO: Real-time detection of outdoor high voltage insulators using UAV imaging. IEEE Trans. Power Deliv. 2020, 35, 1599–1601. [Google Scholar] [CrossRef]
- Souza, B.J.; Stefenon, S.F.; Singh, G.; Freire, R.Z. Hybrid-YOLO for classification of insulators defects in transmission lines based on UAV. Int. J. Electr. Power Energy Syst. 2023, 148, 108982. [Google Scholar] [CrossRef]
- Mitiche, I.; Jenkins, M.D.; Boreham, P.; Nesbitt, A.; Morison, G. Deep complex neural network learning for high-voltage insulation fault classification from complex bispectrum representation. In Proceedings of the European Signal Processing Conference, IEEE, Coruna, Spain, 2–6 September 2019; Volume 27, pp. 1–5. [Google Scholar] [CrossRef]
- IEC-60587; Electrical insulating materials used under severe ambient conditions—Test methods for evaluating resistance to tracking and erosion. International Electrotechnical Commission: Geneva, Switzerland, 2022.
- Zhao, W.; Xu, M.; Cheng, X.; Zhao, Z. An insulator in transmission lines recognition and fault detection model based on improved faster RCNN. IEEE Trans. Instrum. Meas. 2021, 70, 5016408. [Google Scholar] [CrossRef]
- Singh, L.; Alam, A.; Kumar, K.V.; Kumar, D.; Kumar, P.; Jaffery, Z.A. Design of thermal imaging-based health condition monitoring and early fault detection technique for porcelain insulators using Machine learning. Environ. Technol. Innov. 2021, 24, 102000. [Google Scholar] [CrossRef]
- Dai, Z. Uncertainty-aware accurate insulator fault detection based on an improved YOLOX model. Energy Rep. 2022, 8, 12809–12821. [Google Scholar] [CrossRef]
- Ghosh, R.; Chatterjee, B.; Chakravorti, S. A novel leakage current index for the field monitoring of overhead insulators under harmonic voltage. IEEE Trans. Ind. Electron. 2018, 65, 1568–1576. [Google Scholar] [CrossRef]
- Belhouchet, K.; Bayadi, A.; Bendib, M.E. Artificial neural networks (ANN) and genetic algorithm modeling and identification of arc parameter in insulators flashover voltage and leakage current. In Proceedings of the International Conference on Electrical Engineering (ICEE), Boumerdes, Algeria, 13–15 December 2015; Volume 4, pp. 1–6. [Google Scholar] [CrossRef]
- Zhang, S.; Wang, Y.; Liu, M.; Bao, Z. Data-based line trip fault prediction in power systems using LSTM networks and SVM. IEEE Access 2018, 6, 7675–7686. [Google Scholar] [CrossRef]
- Fernandes, F.; Stefenon, S.F.; Seman, L.O.; Nied, A.; Ferreira, F.C.S.; Subtil, M.C.M.; Klaar, A.C.R.; Leithardt, V.R.Q. Long short-term memory stacking model to predict the number of cases and deaths caused by COVID-19. J. Intell. Fuzzy Syst. 2022, 6, 6221–6234. [Google Scholar] [CrossRef]
- Stefenon, S.F.; Seman, L.O.; Aquino, L.S.; dos Santos Coelho, L. Wavelet-Seq2Seq-LSTM with attention for time series forecasting of level of dams in hydroelectric power plants. Energy 2023, 274, 127350. [Google Scholar] [CrossRef]
- Polisetty, S.; El-Hag, A.; Jayram, S. Classification of common discharges in outdoor insulation using acoustic signals and artificial neural network. High Volt. 2019, 4, 333–338. [Google Scholar] [CrossRef]
- De Santos, H.; Sanz-Bobi, M.A. A machine learning approach for condition monitoring of high voltage insulators in polluted environments. Electr. Power Syst. Res. 2023, 220, 109340. [Google Scholar] [CrossRef]
- Stefenon, S.F.; Seman, L.O.; Mariani, V.C.; Coelho, L.S. Aggregating prophet and seasonal trend decomposition for time series forecasting of Italian electricity spot prices. Energies 2023, 16, 1371. [Google Scholar] [CrossRef]
- Stefenon, S.F.; Kasburg, C.; Freire, R.Z.; Silva Ferreira, F.C.; Bertol, D.W.; Nied, A. Photovoltaic power forecasting using wavelet neuro-fuzzy for active solar trackers. J. Intell. Fuzzy Syst. 2021, 40, 1083–1096. [Google Scholar] [CrossRef]
- Stefenon, S.F.; Kasburg, C.; Nied, A.; Klaar, A.C.R.; Ferreira, F.C.S.; Branco, N.W. Hybrid deep learning for power generation forecasting in active solar trackers. IET Gener. Transm. Distrib. 2020, 14, 5667–5674. [Google Scholar] [CrossRef]
- Kong, X.; Guo, J.; Zheng, D.; Zhang, J.; Fu, W. Quality control for medium voltage insulator via a knowledge-informed SPSA based on historical gradient approximations. Processes 2020, 8, 146. [Google Scholar] [CrossRef]
- Klaar, A.C.R.; Stefenon, S.F.; Seman, L.O.; Mariani, V.C.; Coelho, L.S. Structure optimization of ensemble learning methods and seasonal decomposition approaches to energy price forecasting in Latin America: A case study about Mexico. Energies 2023, 16, 3184. [Google Scholar] [CrossRef]
- Mantach, S.; Lutfi, A.; Moradi Tavasani, H.; Ashraf, A.; El-Hag, A.; Kordi, B. Deep learning in high voltage engineering: A literature review. Energies 2022, 15, 5005. [Google Scholar] [CrossRef]
- Hao, L.; Zhenhua, L.; Ziyi, C.; Xingxin, C.; Xu, Y. Insulator fouling monitoring based on acoustic signal and one-dimensional convolutional neural network. Front. Energy Res. 2023, 10, 43–50. [Google Scholar] [CrossRef]
- Nguyen, T.P.; Yeh, C.T.; Cho, M.Y.; Chang, C.L.; Chen, M.J. Convolutional neural network bidirectional long short-term memory to online classify the distribution insulator leakage currents. Electr. Power Syst. Res. 2022, 208, 107923. [Google Scholar] [CrossRef]
- Thanh, P.N.; Cho, M.Y. Online leakage current classification using convolutional neural network long short-term memory for high voltage insulators on web-based service. Electr. Power Syst. Res. 2023, 216, 109065. [Google Scholar] [CrossRef]
- Stefenon, S.F.; Seman, L.O.; Sopelsa Neto, N.F.; Meyer, L.H.; Nied, A.; Yow, K.C. Echo state network applied for classification of medium voltage insulators. Int. J. Electr. Power Energy Syst. 2022, 134, 107336. [Google Scholar] [CrossRef]
- Ferreira, T.V.; Germano, A.D.; da Costa, E.G. Ultrasound and artificial intelligence applied to the pollution estimation in insulations. IEEE Trans. Power Deliv. 2012, 27, 583–589. [Google Scholar] [CrossRef]
- Stefenon, S.F.; Freire, R.Z.; Meyer, L.H.; Corso, M.P.; Sartori, A.; Nied, A.; Klaar, A.C.R.; Yow, K.C. Fault detection in insulators based on ultrasonic signal processing using a hybrid deep learning technique. IET Sci. Meas. Technol. 2020, 14, 953–961. [Google Scholar] [CrossRef]
- Branco, N.W.; Cavalca, M.S.M.; Stefenon, S.F.; Leithardt, V.R.Q. Wavelet LSTM for fault forecasting in electrical power grids. Sensors 2022, 22, 8323. [Google Scholar] [CrossRef] [PubMed]
- Seman, L.O.; Stefenon, S.F.; Mariani, V.C.; Coelho, L.S. Ensemble learning methods using the Hodrick–Prescott filter for fault forecasting in insulators of the electrical power grids. Int. J. Electr. Power Energy Syst. 2023, 152, 109269. [Google Scholar] [CrossRef]
- Stefenon, S.F.; Ribeiro, M.H.D.M.; Nied, A.; Mariani, V.C.; Coelho, L.D.S.; Leithardt, V.R.Q.; Silva, L.A.; Seman, L.O. Hybrid Wavelet Stacking Ensemble Model for Insulators Contamination Forecasting. IEEE Access 2021, 9, 66387–66397. [Google Scholar] [CrossRef]
- Sajjadi, B.; Asaithambi, P.; Raman, A.A.A.; Ibrahim, S. Hybrid nero-fuzzy methods for estimation of ultrasound and mechanically stirring Influences on biodiesel synthesis through transesterification. Measurement 2017, 103, 62–76. [Google Scholar] [CrossRef]
- Pisani, P.; Greco, A.; Conversano, F.; Renna, M.D.; Casciaro, E.; Quarta, L.; Costanza, D.; Muratore, M.; Casciaro, S. A quantitative ultrasound approach to estimate bone fragility: A first comparison with dual X-ray absorptiometry. Measurement 2017, 101, 243–249. [Google Scholar] [CrossRef]
- Pisani, P.; Conversano, F.; Chiriacò, F.; Quarta, E.; Quarta, L.; Muratore, M.; Lay-Ekuakille, A.; Casciaro, S. Estimation of femoral neck bone mineral density by ultrasound scanning: Preliminary results and feasibility. Measurement 2016, 94, 480–486. [Google Scholar] [CrossRef]
- Greco, A.; Pisani, P.; Conversano, F.; Soloperto, G.; Renna, M.D.; Muratore, M.; Casciaro, S. Ultrasound fragility Score: An innovative approach for the assessment of bone fragility. Measurement 2017, 101, 236–242. [Google Scholar] [CrossRef]
- Stefenon, S.F.; Furtado Neto, C.S.; Coelho, T.S.; Nied, A.; Yamaguchi, C.K.; Yow, K.C. Particle swarm optimization for design of insulators of distribution power system based on finite element method. Electr. Eng. 2022, 104, 615–622. [Google Scholar] [CrossRef]
- Stefenon, S.F.; Americo, J.P.; Meyer, L.H.; Grebogi, R.B.; Nied, A. Analysis of the electric field in porcelain pin-type insulators via finite elements software. IEEE Lat. Am. Trans. 2018, 16, 2505–2512. [Google Scholar] [CrossRef]
- Sopelsa Neto, N.F.; Stefenon, S.F.; Meyer, L.H.; Bruns, R.; Nied, A.; Seman, L.O.; Gonzalez, G.V.; Leithardt, V.R.Q.; Yow, K.C. A study of multilayer perceptron networks applied to classification of ceramic insulators using ultrasound. Appl. Sci. 2021, 11, 1592. [Google Scholar] [CrossRef]
- Stefenon, S.F.; Bruns, R.; Sartori, A.; Meyer, L.H.; Ovejero, R.G.; Leithardt, V.R.Q. Analysis of the ultrasonic signal in polymeric contaminated insulators through ensemble learning methods. IEEE Access 2022, 10, 33980–33991. [Google Scholar] [CrossRef]
- NBR-10621; High-voltage insulators to be used on a.c. systems—Artificial pollution tests. Brazilian National Standards Organization: São Paulo, Brazil, 2017.
- IEC-507; Artificial pollution tests on high-voltage insulators to be used on a.c. systems. International Electrotechnical Commission: Geneva, Switzerland, 1991.
- Stefenon, S.F.; Seman, L.O.; Pavan, B.A.; Ovejero, R.G.; Leithardt, V.R.Q. Optimal design of electrical power distribution grid spacers using finite element method. IET Gener. Transm. Distrib. 2022, 16, 1865–1876. [Google Scholar] [CrossRef]
- Stefenon, S.F.; Corso, M.P.; Nied, A.; Perez, F.L.; Yow, K.C.; Gonzalez, G.V.; Leithardt, V.R.Q. Classification of insulators using neural network based on computer vision. IET Gener. Transm. Distrib. 2021, 16, 1096–1107. [Google Scholar] [CrossRef]
- Stefenon, S.F.; Silva, M.C.; Bertol, D.W.; Meyer, L.H.; Nied, A. Fault diagnosis of insulators from ultrasound detection using neural networks. J. Intell. Fuzzy Syst. 2019, 37, 6655–6664. [Google Scholar] [CrossRef]
- Middlehurst, M.; Large, J.; Flynn, M.; Lines, J.; Bostrom, A.; Bagnall, A. HIVE-COTE 2.0: A new meta ensemble for time series classification. Mach. Learn. 2021, 110, 3211–3243. [Google Scholar] [CrossRef]
- Pantiskas, L.; Verstoep, K.; Hoogendoorn, M.; Bal, H. Taking ROCKET on an efficiency mission: Multivariate time series classification with LightWaveS. In Proceedings of the International Conference on Distributed Computing in Sensor Systems (DCOSS), Los Angeles, CA, USA, 30 May–1 June 2022; Volume 18, pp. 149–152. [Google Scholar] [CrossRef]
- Bondugula, R.K.; Udgata, S.K.; Sivangi, K.B. A novel deep learning architecture and MINIROCKET feature extraction method for human activity recognition using ECG, PPG and inertial sensor dataset. Appl. Intell. 2022, 53, 14400–14425. [Google Scholar] [CrossRef]
- Thangarajoo, R.G.; Reaz, M.B.I.; Srivastava, G.; Haque, F.; Ali, S.H.M.; Bakar, A.A.A.; Bhuiyan, M.A.S. Machine learning-based epileptic seizure detection methods using wavelet and EMD-based decomposition techniques: A review. Sensors 2021, 21, 8485. [Google Scholar] [CrossRef]
- Yao, L.; Pan, Z. A new method based CEEMDAN for removal of baseline wander and powerline interference in ECG signals. Optik 2020, 223, 165566. [Google Scholar] [CrossRef]
- Anuragi, A.; Sisodia, D.S.; Pachori, R.B. Epileptic-seizure classification using phase-space representation of FBSE-EWT based EEG sub-band signals and ensemble learners. Biomed. Signal Process. Control 2022, 71, 103138. [Google Scholar] [CrossRef]
- Ding, J.; Xiao, D.; Li, X. Gear fault diagnosis based on genetic mutation particle swarm optimization VMD and probabilistic neural network algorithm. IEEE Access 2020, 8, 18456–18474. [Google Scholar] [CrossRef]
- Smith, J.R.; Al-Badrawi, M.H.; Kirsch, N.J. An Optimized De-Noising Scheme Based on the Null Hypothesis of Intrinsic Mode Functions. IEEE Signal Process. Lett. 2019, 26, 1232–1236. [Google Scholar] [CrossRef]
- Liu, S.; Sun, Y.; Zhang, L.; Su, P. Fault diagnosis of shipboard medium-voltage DC power system based on machine learning. Int. J. Electr. Power Energy Syst. 2021, 124, 106399. [Google Scholar] [CrossRef]
- Yamasaki, M.; Freire, R.Z.; Seman, L.O.; Stefenon, S.F.; Mariani, V.C.; dos Santos Coelho, L. Optimized hybrid ensemble learning approaches applied to very short-term load forecasting. Int. J. Electr. Power Energy Syst. 2024, 155, 109579. [Google Scholar] [CrossRef]
- Wang, X.; Zhang, F.; Wei, X.; Gao, J.; Guo, L.; Wang, Y. Fault location of flexible grounding distribution system based on multivariate modes and kurtosis calibration. Int. J. Electr. Power Energy Syst. 2023, 150, 109108. [Google Scholar] [CrossRef]
- Liu, Y.; Yuan, D.; Gong, Z.; Jin, T.; Mohamed, M.A. Adaptive spectral trend based optimized EWT for monitoring the parameters of multiple power quality disturbances. Int. J. Electr. Power Energy Syst. 2023, 146, 108797. [Google Scholar] [CrossRef]
- Cheng, H.; Ding, X.; Zhou, W.; Ding, R. A hybrid electricity price forecasting model with Bayesian optimization for German energy exchange. Int. J. Electr. Power Energy Syst. 2019, 110, 653–666. [Google Scholar] [CrossRef]
- Wang, X.; Gao, X.; Liu, Y.; Wang, R.; Ma, N.; Qu, M. Bi-level decision matrix based fault location method for multi-branch offshore wind farm transmission lines. Int. J. Electr. Power Energy Syst. 2022, 141, 108137. [Google Scholar] [CrossRef]
- Campos, F.S.; Assis, F.A.; Leite da Silva, A.M.; Coelho, A.J.; Moura, R.A.; Schroeder, M.A.O. Reliability evaluation of composite generation and transmission systems via binary logistic regression and parallel processing. Int. J. Electr. Power Energy Syst. 2022, 142, 108380. [Google Scholar] [CrossRef]
- Hoerl, A.E.; Kennard, R.W. Ridge regression: Biased estimation for nonorthogonal problems. Technometrics 1970, 12, 55–67. [Google Scholar] [CrossRef]
- Kumar Mohanty, S.; Swetapadma, A.; Kumar Nayak, P.; Malik, O.P. Decision tree approach for fault detection in a TCSC compensated line during power swing. Int. J. Electr. Power Energy Syst. 2023, 146, 108758. [Google Scholar] [CrossRef]
- Mishra, S.; Mallick, P.K.; Tripathy, H.K.; Bhoi, A.K.; González-Briones, A. Performance evaluation of a proposed machine learning model for chronic disease datasets using an integrated attribute evaluator and an improved decision tree classifier. Appl. Sci. 2020, 10, 8137. [Google Scholar] [CrossRef]
- Tripoppoom, S.; Ma, X.; Yong, R.; Wu, J.; Yu, W.; Sepehrnoori, K.; Miao, J.; Li, N. Assisted history matching in shale gas well using multiple-proxy-based Markov chain Monte Carlo algorithm: The comparison of K-nearest neighbors and neural networks as proxy model. Fuel 2020, 262, 116563. [Google Scholar] [CrossRef]
- Zhang, S.; Li, X.; Zong, M.; Zhu, X.; Wang, R. Efficient k-NN classification With different numbers of nearest neighbors. IEEE Trans. Neural Netw. Learn. Syst. 2018, 29, 1774–1785. [Google Scholar] [CrossRef] [PubMed]
- Corso, M.P.; Perez, F.L.; Stefenon, S.F.; Yow, K.C.; García Ovejero, R.; Leithardt, V.R.Q. Classification of contaminated insulators using k-nearest neighbors based on computer vision. Computers 2021, 10, 112. [Google Scholar] [CrossRef]
- Ali, L.; Zhu, C.; Zhang, Z.; Liu, Y. Automated detection of Parkinson’s disease based on multiple types of sustained phonations using linear discriminant analysis and genetically optimized neural network. IEEE J. Transl. Eng. Health Med. 2019, 7, 2000410. [Google Scholar] [CrossRef] [PubMed]
- Jayachitra, S.; Prasanth, A. Multi-feature analysis for automated brain stroke classification using weighted Gaussian naïve Bayes classifier. J. Circ. Syst. Comput. 2021, 30, 2150178. [Google Scholar] [CrossRef]
- Yılmaz, A.; Küçüker, A.; Bayrak, G.; Ertekin, D.; Shafie-Khah, M.; Guerrero, J.M. An improved automated PQD classification method for distributed generators with hybrid SVM-based approach using un-decimated wavelet transform. Int. J. Electr. Power Energy Syst. 2022, 136, 107763. [Google Scholar] [CrossRef]
- Samantaray, S. Ensemble decision trees for high impedance fault detection in power distribution network. Int. J. Electr. Power Energy Syst. 2012, 43, 1048–1055. [Google Scholar] [CrossRef]
- Khan, M.S.I.; Islam, N.; Uddin, J.; Islam, S.; Nasir, M.K. Water quality prediction and classification based on principal component regression and gradient boosting classifier approach. J. King Saud-Univ.-Comput. Inf. Sci. 2022, 34, 4773–4781. [Google Scholar] [CrossRef]
- Hou, H.; Zhang, Z.; Yu, J.; Wei, R.; Huang, Y.; Li, X. Damage prediction of 10 kV power towers in distribution network under typhoon disaster based on data-driven model. Int. J. Electr. Power Energy Syst. 2022, 142, 108307. [Google Scholar] [CrossRef]
- Hou, H.; Chen, X.; Li, M.; Zhu, L.; Huang, Y.; Yu, J. Prediction of user outage under typhoon disaster based on multi-algorithm Stacking integration. Int. J. Electr. Power Energy Syst. 2021, 131, 107123. [Google Scholar] [CrossRef]
- Xuan, W.; Shouxiang, W.; Qianyu, Z.; Shaomin, W.; Liwei, F. A multi-energy load prediction model based on deep multi-task learning and ensemble approach for regional integrated energy systems. Int. J. Electr. Power Energy Syst. 2021, 126, 106583. [Google Scholar] [CrossRef]
- Hu, G.; Yin, C.; Wan, M.; Zhang, Y.; Fang, Y. Recognition of diseased Pinus trees in UAV images using deep learning and AdaBoost classifier. Biosyst. Eng. 2020, 194, 138–151. [Google Scholar] [CrossRef]
- Xiao, G.; Cheng, Q.; Zhang, C. Detecting travel modes Using rule-based classification system and Gaussian process classifier. IEEE Access 2019, 7, 116741–116752. [Google Scholar] [CrossRef]
- Chen, T.; Guestrin, C. XGBoost: A Scalable Tree Boosting System. In Proceedings of the International Conference on Knowledge Discovery and Data Mining, San Francisco, CA, USA, 13–17 August 2016; Volume 22, pp. 785–794. [Google Scholar] [CrossRef]
- Dong, W.; Huang, Y.; Lehane, B.; Ma, G. XGBoost algorithm-based prediction of concrete electrical resistivity for structural health monitoring. Autom. Constr. 2020, 114, 103155. [Google Scholar] [CrossRef]
- Fang, H.; Xiao, J.W.; Wang, Y.W. A machine learning-based detection framework against intermittent electricity theft attack. Int. J. Electr. Power Energy Syst. 2023, 150, 109075. [Google Scholar] [CrossRef]
- Pedregosa, F.; Varoquaux, G.; Gramfort, A.; Michel, V.; Thirion, B.; Grisel, O.; Blondel, M.; Prettenhofer, P.; Weiss, R.; Dubourg, V.; et al. Scikit-learn: Machine Learning in Python. J. Mach. Learn. Res. 2011, 12, 2825–2830. [Google Scholar]


| Model | WS10 | WS50 | WS100 |
|---|---|---|---|
| Logistic Regression | 0.5193 ± 0.0395 | 0.5167 ± 0.0325 | 0.5683 ± 0.0436 |
| Ridge Regression | 0.4923 ± 0.0134 | 0.5158 ± 0.0308 | 0.58 ± 0.041 |
| Decision Tree | 0.849 ± 0.0832 | 0.8658 ± 0.0789 | 0.8283 ± 0.0759 |
| k-NN | 0.8762 ± 0.0713 | 0.9025 ± 0.0748 | 0.85 ± 0.1182 |
| LDA | 0.4858 ± 0.0147 | 0.495 ± 0.0286 | 0.525 ± 0.0247 |
| Gaussian Naive Bayes | 0.8428 ± 0.0927 | 0.9133 ± 0.0746 | 0.9283 ± 0.0586 |
| SVM | 0.5343 ± 0.0379 | 0.5283 ± 0.0263 | 0.53 ± 0.0306 |
| Random Forest | 0.8672 ± 0.0815 | 0.9225 ± 0.0621 | 0.925 ± 0.0548 |
| Gradient Boosting | 0.8792 ± 0.0694 | 0.9433 ± 0.0439 | 0.9433 ± 0.0464 |
| AdaBoost | 0.8693 ± 0.07 | 0.9258 ± 0.0504 | 0.9317 ± 0.0593 |
| Gaussian Process | 0.6085 ± 0.0811 | 0.6342 ± 0.0564 | 0.615 ± 0.0883 |
| XGBoost | 0.8753 ± 0.0691 | 0.9417 ± 0.0484 | 0.935 ± 0.0539 |
| LightGBM | 0.8732 ± 0.0695 | 0.94 ± 0.0467 | 0.95 ± 0.0431 |
| Model | Rocket | MiniRocket | MultiRocket |
|---|---|---|---|
| Logistic Regression | 0.7552 ± 0.0353 | 0.8453 ± 0.068 | 0.8465 ± 0.06 |
| Ridge Regression | 0.6762 ± 0.0462 | 0.7943 ± 0.0518 | 0.8068 ± 0.0447 |
| Decision Tree | 0.7427 ± 0.0617 | 0.8635 ± 0.0687 | 0.8687 ± 0.064 |
| k-NN | 0.7375 ± 0.0387 | 0.8488 ± 0.0729 | 0.8623 ± 0.0676 |
| LDA | 0.6048 ± 0.0635 | 0.7832 ± 0.0421 | D.N.C. * |
| Gaussian Naive Bayes | 0.7615 ± 0.0515 | 0.8253 ± 0.0926 | 0.8342 ± 0.0894 |
| SVM | 0.6968 ± 0.0438 | 0.8257 ± 0.0647 | 0.8413 ± 0.0583 |
| Random Forest | 0.762 ± 0.0553 | 0.8788 ± 0.0659 | 0.882 ± 0.0676 |
| Gradient Boosting | 0.7735 ± 0.0543 | 0.8837 ± 0.0655 | 0.8873 ± 0.0632 |
| AdaBoost | 0.7452 ± 0.0544 | 0.8678 ± 0.0695 | 0.8715 ± 0.0639 |
| XGBoost | 0.7623 ± 0.0472 | 0.8785 ± 0.0687 | 0.8823 ± 0.0638 |
| LightGBM | 0.7713 ± 0.0482 | 0.8832 ± 0.067 | 0.8873 ± 0.0622 |
| Model | Rocket | MiniRocket | MultiRocket |
|---|---|---|---|
| Logistic Regression | 0.955 ± 0.0395 | 0.955 ± 0.0395 | 0.955 ± 0.0384 |
| Ridge Regression | 0.9533 ± 0.036 | 0.9533 ± 0.036 | 0.9508 ± 0.0389 |
| Decision Tree | 0.9258 ± 0.0551 | 0.9342 ± 0.0468 | 0.9367 ± 0.0511 |
| k-NN | 0.9483 ± 0.0427 | 0.9483 ± 0.0427 | 0.9433 ± 0.043 |
| LDA | 0.9533 ± 0.0361 | 0.9533 ± 0.0361 | 0.9492 ± 0.0418 |
| Gaussian Naive Bayes | 0.9308 ± 0.0491 | 0.9308 ± 0.0491 | 0.9283 ± 0.0502 |
| SVM | 0.9525 ± 0.0398 | 0.9525 ± 0.0398 | 0.9525 ± 0.0368 |
| Random Forest | 0.9483 ± 0.0459 | 0.9508 ± 0.0461 | 0.9483 ± 0.0402 |
| Gradient Boosting | 0.9517 ± 0.042 | 0.9483 ± 0.0452 | 0.9492 ± 0.0414 |
| AdaBoost | 0.9475 ± 0.0416 | 0.9475 ± 0.0416 | 0.955 ± 0.0349 |
| Gaussian Process | 0.9367 ± 0.0509 | 0.9367 ± 0.0509 | D.N.C. * |
| XGBoost | 0.9475 ± 0.044 | 0.9475 ± 0.044 | 0.9575 ± 0.0339 |
| LightGBM | 0.9542 ± 0.0365 | 0.9542 ± 0.0365 | 0.9592 ± 0.0309 |
| Model | Rocket | MiniRocket | MultiRocket |
|---|---|---|---|
| Logistic Regression | 0.9783 ± 0.0194 | 0.9783 ± 0.0194 | 0.9733 ± 0.0249 |
| Ridge Regression | 0.9767 ± 0.0193 | 0.9767 ± 0.0193 | 0.9717 ± 0.034 |
| Decision Tree | 0.9633 ± 0.0323 | 0.9667 ± 0.0316 | 0.97 ± 0.0282 |
| k-NN | 0.9567 ± 0.037 | 0.9567 ± 0.037 | 0.9683 ± 0.0309 |
| LDA | 0.97 ± 0.0261 | 0.97 ± 0.0261 | 0.975 ± 0.0247 |
| Gaussian Naive Bayes | 0.945 ± 0.0515 | 0.945 ± 0.0515 | 0.9483 ± 0.0392 |
| SVM | 0.9783 ± 0.018 | 0.9783 ± 0.018 | 0.9717 ± 0.0277 |
| Random Forest | 0.9717 ± 0.0314 | 0.9767 ± 0.0244 | 0.9733 ± 0.0309 |
| Gradient Boosting | 0.9683 ± 0.0271 | 0.97 ± 0.0251 | 0.9717 ± 0.0245 |
| AdaBoost | 0.9783 ± 0.0201 | 0.9733 ± 0.0295 | 0.965 ± 0.0399 |
| Gaussian Process | 0.96 ± 0.0363 | 0.96 ± 0.0363 | D.N.C. * |
| XGBoost | 0.9767 ± 0.0249 | 0.9767 ± 0.0249 | 0.975 ± 0.0228 |
| LightGBM | 0.9767 ± 0.022 | 0.9767 ± 0.022 | 0.965 ± 0.0429 |
| Accuracy | ||||
|---|---|---|---|---|
| Window Size | W/o EMB | EWT | CEENDAM | VMD |
| 10 | ||||
| 50 | ||||
| 100 | ||||
| Author | Approach | Advantages | Disadvantages |
|---|---|---|---|
| [6] | EN-ELM | Computation is fast. | It might obtain the wrong measurements because of interference. |
| [39] | Pseudo-prototypical part network. | It has interpretable results. | If the data are not correctly selected in the first step, the model will not work. |
| [41] | Hybrid-YOLO | It obtains a better performance than standard approaches. | If the data are not correctly selected in the first step, the model will not work. |
| [63] | ESN | It excels for drilling classification. | It has lower accuracy for multiclassification. |
| Our Method | Rocket with EMD | It is adaptable. | Needs an operator to set the ultrasound equipment. |
Disclaimer/Publisher’s Note: The statements, opinions and data contained in all publications are solely those of the individual author(s) and contributor(s) and not of MDPI and/or the editor(s). MDPI and/or the editor(s) disclaim responsibility for any injury to people or property resulting from any ideas, methods, instructions or products referred to in the content. |
© 2024 by the authors. Licensee MDPI, Basel, Switzerland. This article is an open access article distributed under the terms and conditions of the Creative Commons Attribution (CC BY) license (https://creativecommons.org/licenses/by/4.0/).
Share and Cite
Klaar, A.C.R.; Seman, L.O.; Mariani, V.C.; Coelho, L.d.S. Random Convolutional Kernel Transform with Empirical Mode Decomposition for Classification of Insulators from Power Grid. Sensors 2024, 24, 1113. https://doi.org/10.3390/s24041113
Klaar ACR, Seman LO, Mariani VC, Coelho LdS. Random Convolutional Kernel Transform with Empirical Mode Decomposition for Classification of Insulators from Power Grid. Sensors. 2024; 24(4):1113. https://doi.org/10.3390/s24041113
Chicago/Turabian StyleKlaar, Anne Carolina Rodrigues, Laio Oriel Seman, Viviana Cocco Mariani, and Leandro dos Santos Coelho. 2024. "Random Convolutional Kernel Transform with Empirical Mode Decomposition for Classification of Insulators from Power Grid" Sensors 24, no. 4: 1113. https://doi.org/10.3390/s24041113
APA StyleKlaar, A. C. R., Seman, L. O., Mariani, V. C., & Coelho, L. d. S. (2024). Random Convolutional Kernel Transform with Empirical Mode Decomposition for Classification of Insulators from Power Grid. Sensors, 24(4), 1113. https://doi.org/10.3390/s24041113