

Optimizing Winter Air Quality in Pig-Fattening Houses: A Plasma Deodorization Approach
 ,
,
Abstract
1. Introduction
2. Materials and Methods
2.1. Experimental Rooms
2.2. Measurements
2.3. Ventilation System
2.3.1. External Circulation System
2.3.2. Internal Circulation System
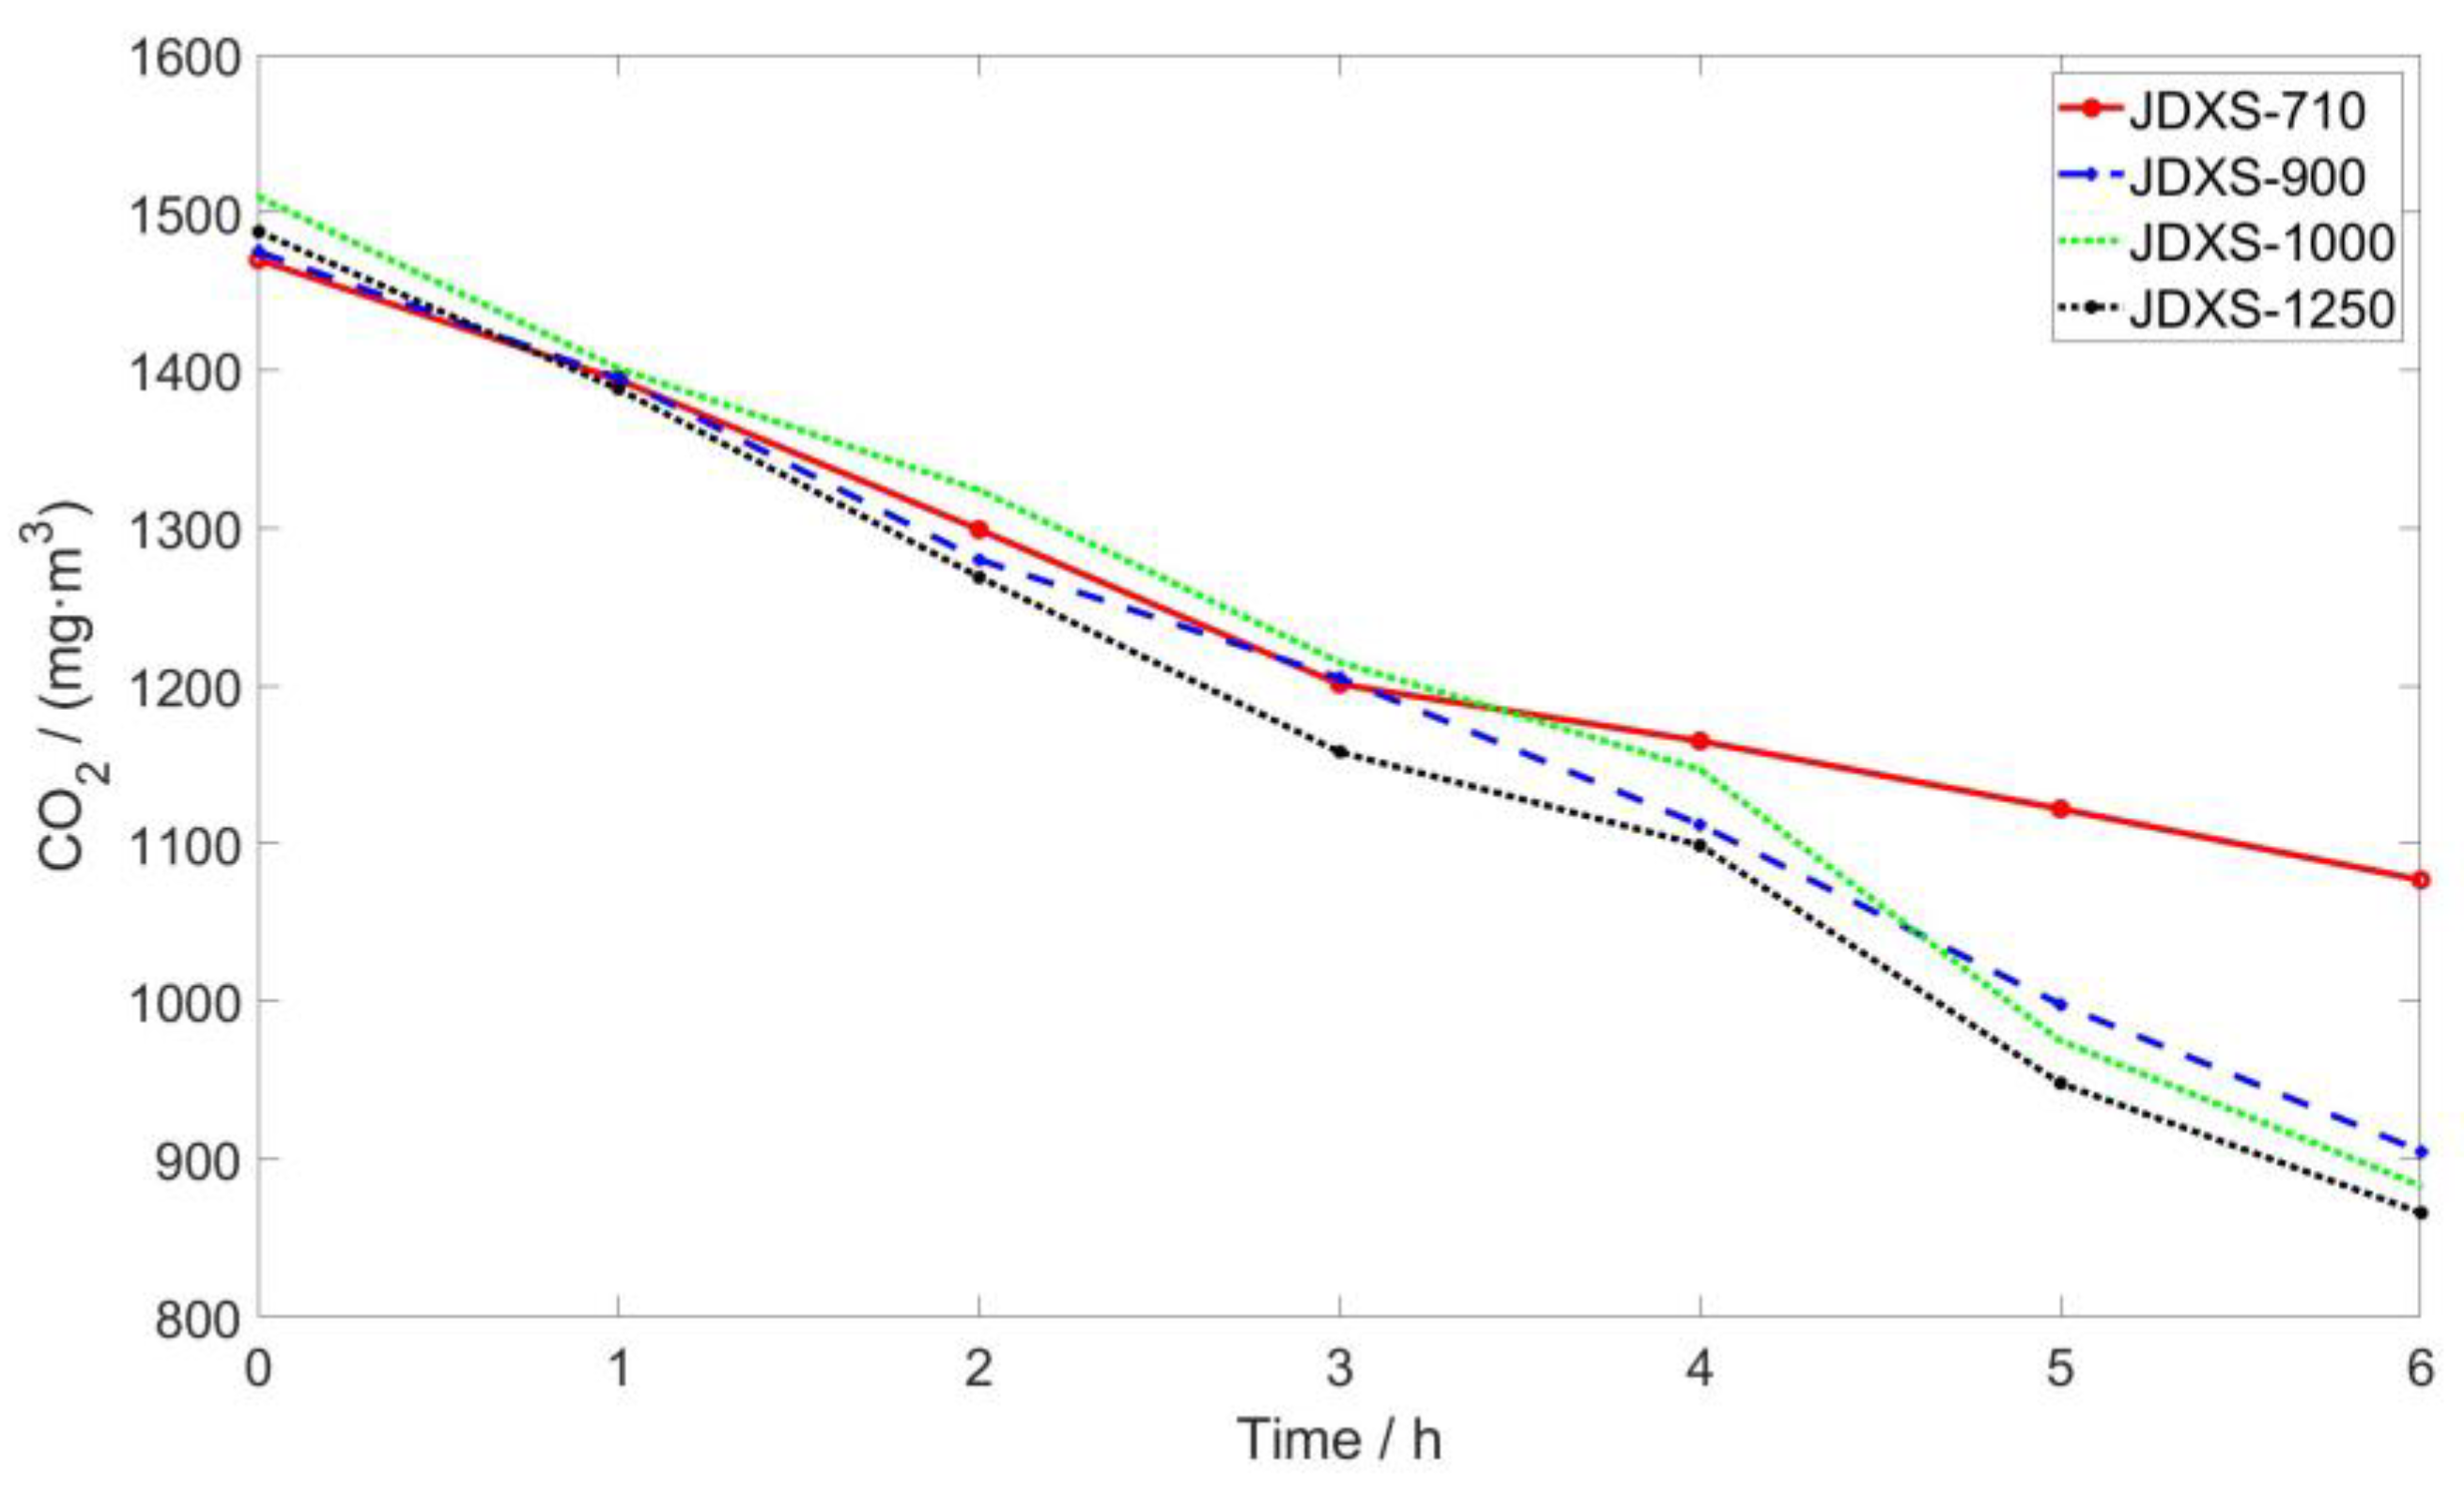
2.3.3. Ventilation Quantity
2.4. Odor Removal Device
2.4.1. Primary Filter Plate
2.4.2. Dielectric Barrier Discharge Module
2.4.3. Microwave Photolysis Module
2.4.4. Ozone Removal Module
3. Results
3.1. Animal Performance
3.2. Air Temperature and Relative Humidity
3.3. NH3 and H2S
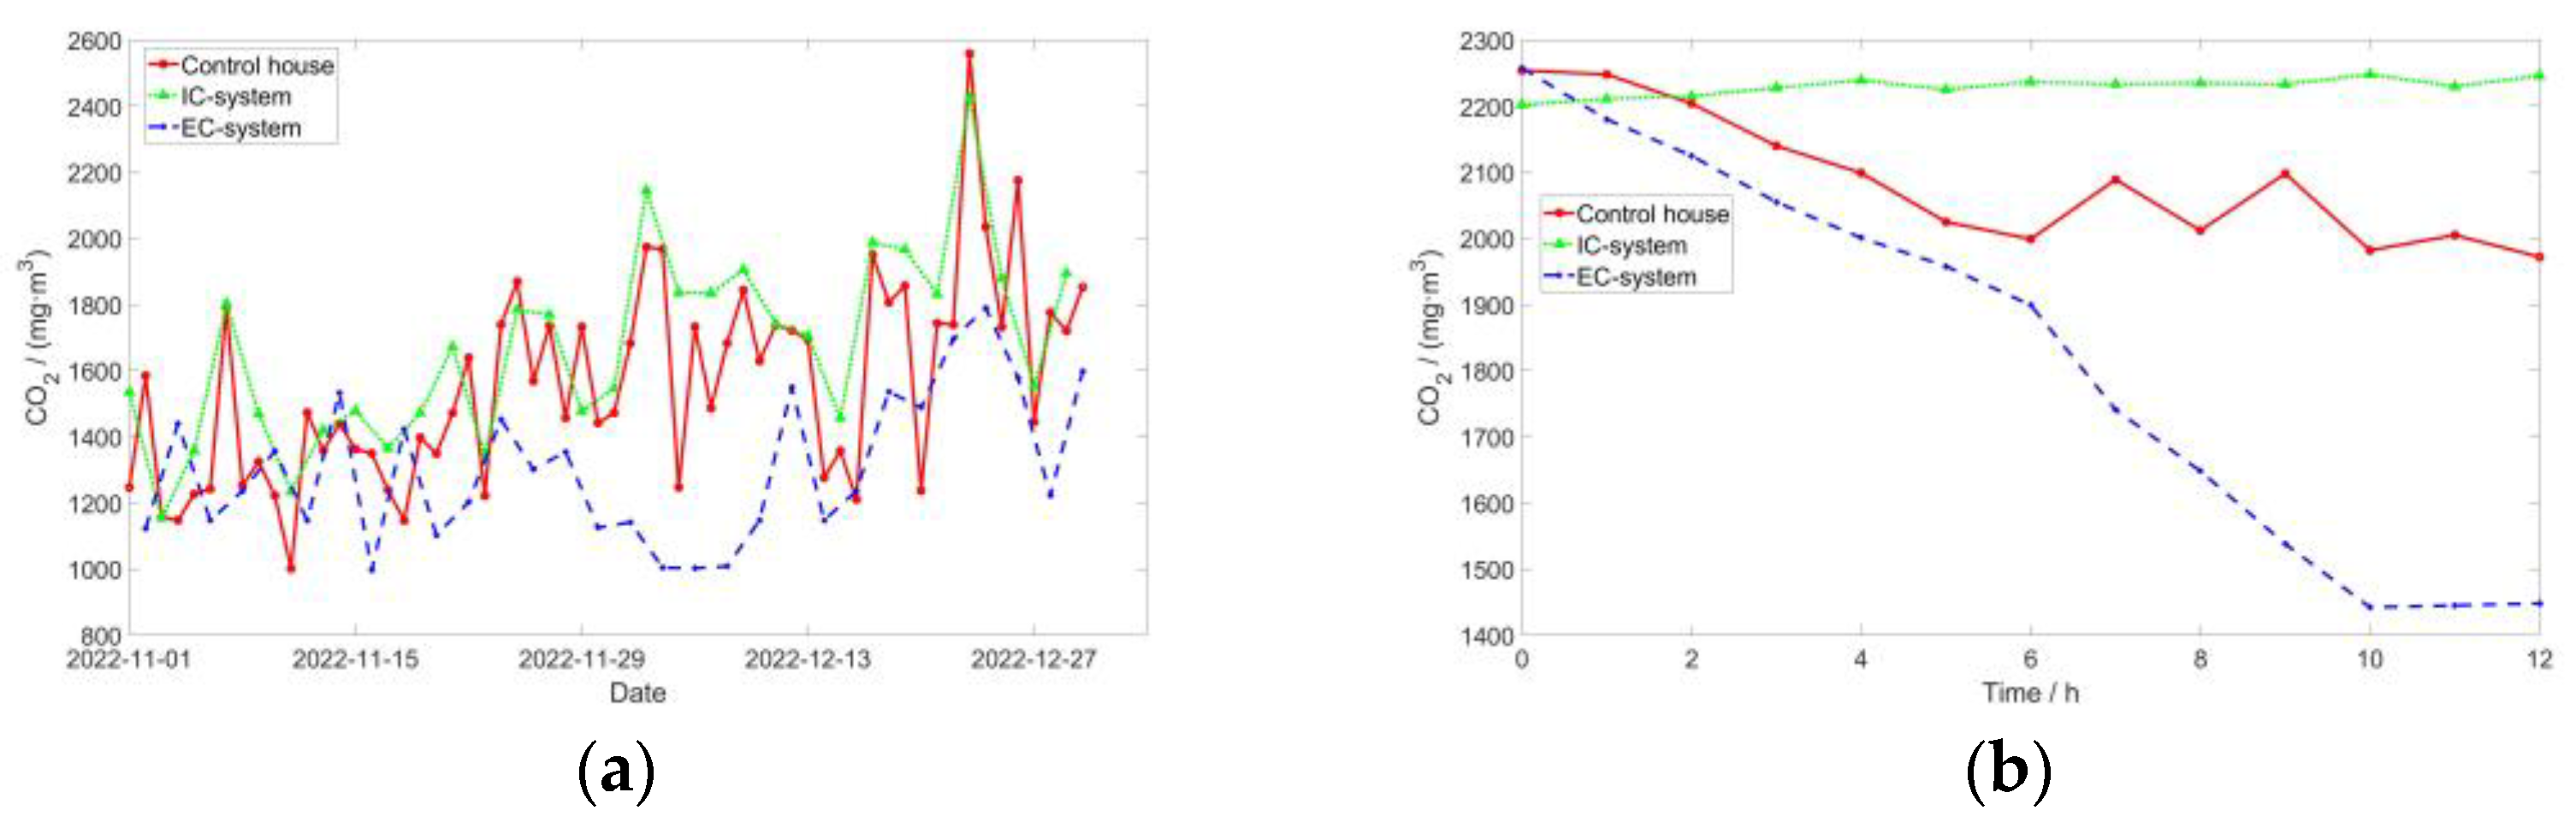
3.4. CO2
3.5. O3
4. Discussion
5. Conclusions
Author Contributions
Funding
Institutional Review Board Statement
Informed Consent Statement
Data Availability Statement
Acknowledgments
Conflicts of Interest
References
- Cao, T.; Zheng, Y.; Dong, H. Control of odor emissions from livestock farms: A review. Environ. Res. 2023, 225, 115545. [Google Scholar] [CrossRef] [PubMed]
- Todorov, V.; Dimov, I. Unveiling the Power of Stochastic Methods: Advancements in Air Pollution Sensitivity Analysis of the Digital Twin. Atmosphere 2023, 14, 1078. [Google Scholar] [CrossRef]
- Todorov, V.; Georgiev, S.; Georgiev, I.; Zaharieva, S.; Dimov, I. Optimizing Air Pollution Modeling with a Highly-Convergent Quasi-Monte Carlo Method: A Case Study on the UNI-DEM Framework. Mathematics 2023, 11, 2919. [Google Scholar] [CrossRef]
- Cao, T.; Zheng, Y.; Dong, H.; Wang, S.; Zhang, Y.; Cong, Q. A new air cleaning technology to synergistically reduce odor and bioaerosol emissions from livestock houses. Agric. Ecosyst. Environ. 2023, 342, 108221. [Google Scholar] [CrossRef]
- Melse, R.W.; Hofschreuder, P.; Ogink, N.W.M. Removal of particulate matter (PM10) by air scrubbers at livestock facilities: Results of an on-farm monitoring program. Trans. ASABE 2012, 55, 689–698. [Google Scholar] [CrossRef]
- Wang, Y.-C.; Han, M.-F.; Jia, T.-P.; Hu, X.-R.; Zhu, H.-Q.; Tong, Z.; Lin, Y.-T.; Wang, C.; Liu, D.-Z.; Peng, Y.-Z.; et al. Emissions, measurement, and control of odor in livestock farms: A review. Sci. Total Environ. 2021, 776, 145735. [Google Scholar] [CrossRef]
- Lv, E.; Yan, B.; Wang, Y.; Zeng, Z.; Wang, L.; Sun, C.; Huang, h. Removal performance and optimization of particulate matter from the waste gas treatment system using water scrubber in livestock and poultry houses. J. South China Agric. Univ. 2023, 44, 296–303. [Google Scholar] [CrossRef]
- Jafari, M.J.; Matin, A.H.; Rahmati, A.; Azari, M.R.; Omidi, L.; Hosseini, S.S.; Panahi, D. Experimental optimization of a spray tower for ammonia removal. Atmos. Pollut. Res. 2018, 9, 783–790. [Google Scholar] [CrossRef]
- De Capua, C.; Fulco, G.; Lugara, M.; Ruffa, F. An Improvement Strategy for Indoor Air Quality Monitoring Systems. Sensors 2023, 23, 3999. [Google Scholar] [CrossRef]
- Ramachandran, K.; Kikukawa, N. Plasma in-flight treatment of electroplating sludge. Vacuum 2000, 59, 244–251. [Google Scholar] [CrossRef]
- Mountouris, A.; Voutsas, E.; Tassios, D. Solid waste plasma gasification: Equilibrium model development and exergy analysis. Energy Convers. Manag. 2006, 47, 1723–1737. [Google Scholar] [CrossRef]
- Mumtaz, S.; Khan, R.; Rana, J.N.; Javed, R.; Iqbal, M.; Choi, E.H.; Han, I. Review on the Biomedical and Environmental Applications of Nonthermal Plasma. Catalysts 2023, 13, 685. [Google Scholar] [CrossRef]
- Dobslaw, D.; Ortlinghaus, O.; Dobslaw, C. A combined process of non-thermal plasma and a low-cost mineral adsorber for VOC removal and odor abatement in emissions of organic waste treatment plants. J. Environ. Chem. Eng. 2018, 6, 2281–2289. [Google Scholar] [CrossRef]
- Gomez, E.; Rani, D.A.; Cheeseman, C.R.; Deegan, D.; Wise, M.; Boccaccini, A.R. Thermal plasma technology for the treatment of wastes: A critical review. J. Hazard. Mater. 2009, 161, 614–626. [Google Scholar] [CrossRef]
- Chang, J.-S. Recent development of plasma pollution control technology: A critical review. Sci. Technol. Adv. Mater. 2001, 2, 571–576. [Google Scholar] [CrossRef]
- Urashima, K.; Chang, J.-S. Removal of volatile organic compounds from air streams and industrial flue gases by non-thermal plasma technology. IEEE Trans. Dielectr. Electr. Insul. 2000, 7, 602–614. [Google Scholar] [CrossRef]
- Amutha Rani, D.; Gomez, E.; Boccaccini, A.R.; Hao, L.; Deegan, D.; Cheeseman, C.R. Plasma treatment of air pollution control residues. Waste Manag. 2008, 28, 1254–1262. [Google Scholar] [CrossRef]
- Scholtz, V.; Pazlarova, J.; Souskova, H.; Khun, J.; Julak, J. Nonthermal plasma—A tool for decontamination and disinfection. Biotechnol. Adv. 2015, 33, 1108–1119. [Google Scholar] [CrossRef]
- Clothiaux, E.J.; Koropchak, J.A.; Moore, R.R. Decomposition of an Organophosphorus Material in a Silent Electrical Discharge. Plasma Chem. Plasma Process. 1984, 4, 15–20. [Google Scholar] [CrossRef]
- Zhu, T.; Wang, R.; Bian, W.; Chen, Y.; Jing, W. Advanced oxidation technology for H2S odor gas using non-thermal plasma. Plasma Sci. Technol. 2018, 20, 054007. [Google Scholar] [CrossRef]
- Wei, X.; Tao, Z.; Xinrui, J.; Huan, X. Degradation of mixed typical odour gases via non-thermal plasma catalysis. J. Hazard. Mater. 2022, 440, 129751. [Google Scholar] [CrossRef] [PubMed]
- Chung, W.-C.; Mei, D.-H.; Tu, X.; Chang, M.-B. Removal of VOCs from gas streams via plasma and catalysis. Catal. Rev. 2018, 61, 270–331. [Google Scholar] [CrossRef]
- Xu, N.; Fu, W.; He, C.; Cao, L.; Liu, X.; Zhao, J.; Pan, H. Benzene Removal Using Non-thermal Plasma with CuO/AC Catalyst: Reaction Condition Optimization and Decomposition Mechanism. Plasma Chem. Plasma Process. 2014, 34, 1387–1402. [Google Scholar] [CrossRef]
- Saoud, W.A.; Belkessa, N.; Azzaz, A.A.; Rochas, V.; Mezino, V.; Presset, M.-A.; Lechevin, S.; Genouel, A.; Rouxel, S.; Monsimert, D.; et al. Pilot scale investigation of DBD-Plasma photocatalysis for industrial application in livestock building air: Elimination of chemical pollutants and odors. Chem. Eng. J. 2023, 468, 143710. [Google Scholar] [CrossRef]
- Wang, Y.; Shao, L.; Kang, X.; Zhang, H.; Lu, F.; He, P. A critical review on odor measurement and prediction. J. Environ. Manag. 2023, 336, 117651. [Google Scholar] [CrossRef]
- Dai, X.; Ji, Q.; Pan, Q.; Wang, K.; Heber, A.J. Monitoring of Tempreature, Humidity and Air Quality inside Pig Weaner House in Eastern China. Trans. Chin. Soc. Agric. Mach. 2016, 47, 315–322. [Google Scholar] [CrossRef]
- Zong, C.; Li, H.; Zhang, G. Ammonia and greenhouse gas emissions from fattening pig house with two types of partial pit ventilation systems. Agric. Ecosyst. Environ. 2015, 208, 94–105. [Google Scholar] [CrossRef]
- Guo, L.; Zhao, B.; Jia, Y.; He, F.; Chen, W. Mitigation Strategies of Air Pollutants for Mechanical Ventilated Livestock and Poultry Housing—A Review. Atmosphere 2022, 13, 452. [Google Scholar] [CrossRef]
- Mancini, F.; Nardecchia, F.; Groppi, D.; Ruperto, F.; Romeo, C. Indoor Environmental Quality Analysis for Optimizing Energy Consumptions Varying Air Ventilation Rates. Sustainability 2020, 12, 482. [Google Scholar] [CrossRef]
- Winkel, A.; Mosquera, J.; Aarnink, A.J.A.; Groot Koerkamp, P.W.G.; Ogink, N.W.M. Evaluation of a dry filter and an electrostatic precipitator for exhaust air cleaning at commercial non-cage laying hen houses. Biosyst. Eng. 2015, 129, 212–225. [Google Scholar] [CrossRef]
- Lu, W.; Abbas, Y.; Mustafa, M.F.; Pan, C.; Wang, H. A review on application of dielectric barrier discharge plasma technology on the abatement of volatile organic compounds. Front. Environ. Sci. Eng. 2019, 13, 30. [Google Scholar] [CrossRef]
- Li, J.; Zheng, Z.; Cui, X.; Liu, Y.; Fan, T.; Liu, Y.; Chang, D.; Yang, D. Decomposition of Naphthalene by Dielectric Barrier Discharge in Conjunction with a Catalyst at Atmospheric Pressure. Catalysts 2022, 12, 740. [Google Scholar] [CrossRef]
- Li, S.; Gallucci, F. CO2 capture and activation with a plasma-sorbent system. Chem. Eng. J. 2022, 430, 132979. [Google Scholar] [CrossRef]
- Yang, G.W.; Chun, S.M.; Kim, K.I.; Lee, H.J.; Hong, Y. Simulated experiments for removal of odorous gases by wire-mesh electrode dielectric barrier discharge. Phys. Plasmas 2022, 29, 093502. [Google Scholar] [CrossRef]
- Li, S.; Dang, X.; Yu, X.; Abbas, G.; Zhang, Q.; Cao, L. The application of dielectric barrier discharge non-thermal plasma in VOCs abatement: A review. Chem. Eng. J. 2020, 388, 124275. [Google Scholar] [CrossRef]
- Jiang, B.; Zheng, J.; Qiu, S.; Wu, M.; Zhang, Q.; Yan, Z.; Xue, Q. Review on electrical discharge plasma technology for wastewater remediation. Chem. Eng. J. 2014, 236, 348–368. [Google Scholar] [CrossRef]
- Dobslaw, C.; Glocker, B. Plasma Technology and Its Relevance in Waste Air and Waste Gas Treatment. Sustainability 2020, 12, 8981. [Google Scholar] [CrossRef]
- Iervolino, G.; Vaiano, V.; Palma, V. Enhanced removal of water pollutants by dielectric barrier discharge non-thermal plasma reactor. Sep. Purif. Technol. 2019, 215, 155–162. [Google Scholar] [CrossRef]
- Doubla, A.; Laminsi, S.; Nzali, S.; Njoyim, E.; Kamsu-Kom, J.; Brisset, J.L. Organic pollutants abatement and biodecontamination of brewery effluents by a non-thermal quenched plasma at atmospheric pressure. Chemosphere 2007, 69, 332–337. [Google Scholar] [CrossRef]
- Fang, H.J.; Hou, H.Q.; Xia, L.Y.; Shu, X.H.; Zhang, R.X. A combined plasma photolysis (CPP) method for removal of CS2 from gas streams at atmospheric pressure. Chemosphere 2007, 69, 1734–1739. [Google Scholar] [CrossRef]
- Duan, X.; Qian, Y.; Wu, J.; Ma, L.; Zhao, Z.; Wang, L.; Xiao, L.; Zhang, S. Photocatalytic Degradation of VOC Waste Gas in Petrochemical Sewage Fields. Ind. Eng. Chem. Res. 2022, 61, 18676–18684. [Google Scholar] [CrossRef]
- Oliva, G.; Comia, J.R., Jr.; Senatore, V.; Zarra, T.; Ballestreros, F.; Belgiorno, V.; Naddeo, V. Degradation of gaseous volatile organic compounds (VOCs) by a novel UV-ozone technology. Sci. Rep. 2022, 12, 11112. [Google Scholar] [CrossRef] [PubMed]
- Qu, M.; Cheng, Z.; Sun, Z.; Chen, D.; Yu, J.; Chen, J. Non-thermal plasma coupled with catalysis for VOCs abatement: A review. Process Saf. Environ. Prot. 2021, 153, 139–158. [Google Scholar] [CrossRef]
- Jiang, L.; Wang, P.; Zhang, Y.; Yao, Z. Plasma-catalytic oxidation of chlorobenzene over Co-Mn/TiO2 catalyst in a dielectric barrier discharge reactor with the segmented electrodes. J. Environ. Chem. Eng. 2022, 10, 108021. [Google Scholar] [CrossRef]
- Bogaerts, A.; Neyts, E.C.; Guaitella, O.; Murphy, A.B. Foundations of plasma catalysis for environmental applications. Plasma Sources Sci. Technol. 2022, 31, 053002. [Google Scholar] [CrossRef]
- Ngwabie, N.M.; Chungong, B.N.; Yengong, F.L. Characterisation of pig manure for methane emission modelling in Sub-Saharan Africa. Biosyst. Eng. 2018, 170, 31–38. [Google Scholar] [CrossRef]
- Zhang, Y.; Zhu, Y.; Tao, S.; Zhang, Z.; Chen, M.; Jiang, Z.; Shangguan, W. Plasma-coupled catalysis in VOCs removal and CO2 conversion: Efficiency enhancement and synergistic mechanism. Catal. Commun. 2022, 172, 106535. [Google Scholar] [CrossRef]
- Chang, T.; Wang, Y.; Wang, Y.; Zhao, Z.; Shen, Z.; Huang, Y.; Veerapandian, S.K.P.; De Geyter, N.; Wang, C.; Chen, Q.; et al. A critical review on plasma-catalytic removal of VOCs: Catalyst development, process parameters and synergetic reaction mechanism. Sci. Total Environ. 2022, 828, 154290. [Google Scholar] [CrossRef]


| Fan Model | Blade Diameter (mm) | Blade Speed (r/min) | Motor Speed (r/min) | Air Volume (m3/h) | Power (W) |
|---|---|---|---|---|---|
| JDXS-710 | 710 | 560 | 1350 | 17,000 | 370 |
| JDXS-900 | 1400 | 560 | 1350 | 24,000 | 550 |
| JDXS-1000 | 1000 | 600 | 1400 | 28,000 | 750 |
| JDXS-1250 | 1250 | 439 | 1400 | 38,000 | 1100 |
| Module | Parameters | ||
|---|---|---|---|
| Treatment capacity | 10,000 m3/h | Size (mm) | 5565 × 1335 × 3000 |
| Filter plate | Activated carbon sponge | Size (mm) | 1000 × 1000 × 50 |
| Electric field | 201 stainless steel | Size (mm) | 780 × 485 × 290 |
| 2 installation positions | Voltage/power | 220 V/300 W | |
| DBD module | 6 installation positions | Voltage/power | 220 V/50 W |
| Ultraviolet lamp | 6 installation positions | Voltage/power | 220 V/300 W |
| Photocatalyst | Aperture 4 mm | Size (mm) | 1000 × 1000 × 3 |
| Catalyzer | Four groups | Size (mm) | 1000 × 1000 × 100 |
| Induced draft fan | Axial-flow type | Power | 5.5 kW |
| Main body | The frame was welded with 40 × 40 angle iron | Material | 235 Q |
| Specifications | |
|---|---|
| Shape | Cylindrical particles |
| Particle size (mm) | Φ (2–4) × (5–15) |
| Density (kg/m3) | 700–800 |
| Model | DXO3-1 |
| Function | Catalytic decomposition of O3 and oxidation of VOCs |
| Component | Mn-based catalysts |
| Intake air humidity | 0–98% (RH) |
| Intake air temperature | Ordinary temperature |
| Control House Value | EC-System | IC-System | Sigc | |||
|---|---|---|---|---|---|---|
| Value | Siga | Value | Sigb | |||
| Temperature (°C) | 20.64 | 18.41 | <0.05 | 22.68 | >0.05 | <0.05 |
| Relative humidity (%) | 54.65 | 51.59 | >0.05 | 57.58 | >0.05 | <0.05 |
| NH3 (mg/m3) | 5.73 | 4.75 | <0.05 | 2.07 | <0.01 | <0.05 |
| H2S (mg/m3) | 0.07 | 0.05 | <0.05 | / | / | / |
| CO2 (mg/m3) | 1559.03 | 1302.93 | <0.05 | 1668.37 | >0.05 | <0.01 |
Disclaimer/Publisher’s Note: The statements, opinions and data contained in all publications are solely those of the individual author(s) and contributor(s) and not of MDPI and/or the editor(s). MDPI and/or the editor(s) disclaim responsibility for any injury to people or property resulting from any ideas, methods, instructions or products referred to in the content. |
© 2024 by the authors. Licensee MDPI, Basel, Switzerland. This article is an open access article distributed under the terms and conditions of the Creative Commons Attribution (CC BY) license (https://creativecommons.org/licenses/by/4.0/).
Share and Cite
Zhang, L.; Zhang, M.; Yu, Q.; Su, S.; Wang, Y.; Fang, Y.; Dong, W. Optimizing Winter Air Quality in Pig-Fattening Houses: A Plasma Deodorization Approach. Sensors 2024, 24, 324. https://doi.org/10.3390/s24020324
Zhang L, Zhang M, Yu Q, Su S, Wang Y, Fang Y, Dong W. Optimizing Winter Air Quality in Pig-Fattening Houses: A Plasma Deodorization Approach. Sensors. 2024; 24(2):324. https://doi.org/10.3390/s24020324
Chicago/Turabian StyleZhang, Liping, Meng Zhang, Qianfeng Yu, Shiguang Su, Yan Wang, Yu Fang, and Wei Dong. 2024. "Optimizing Winter Air Quality in Pig-Fattening Houses: A Plasma Deodorization Approach" Sensors 24, no. 2: 324. https://doi.org/10.3390/s24020324
APA StyleZhang, L., Zhang, M., Yu, Q., Su, S., Wang, Y., Fang, Y., & Dong, W. (2024). Optimizing Winter Air Quality in Pig-Fattening Houses: A Plasma Deodorization Approach. Sensors, 24(2), 324. https://doi.org/10.3390/s24020324