
Biometric Recognition: A Systematic Review on Electrocardiogram Data Acquisition Methods


Abstract
1. Introduction
2. Review Methodology
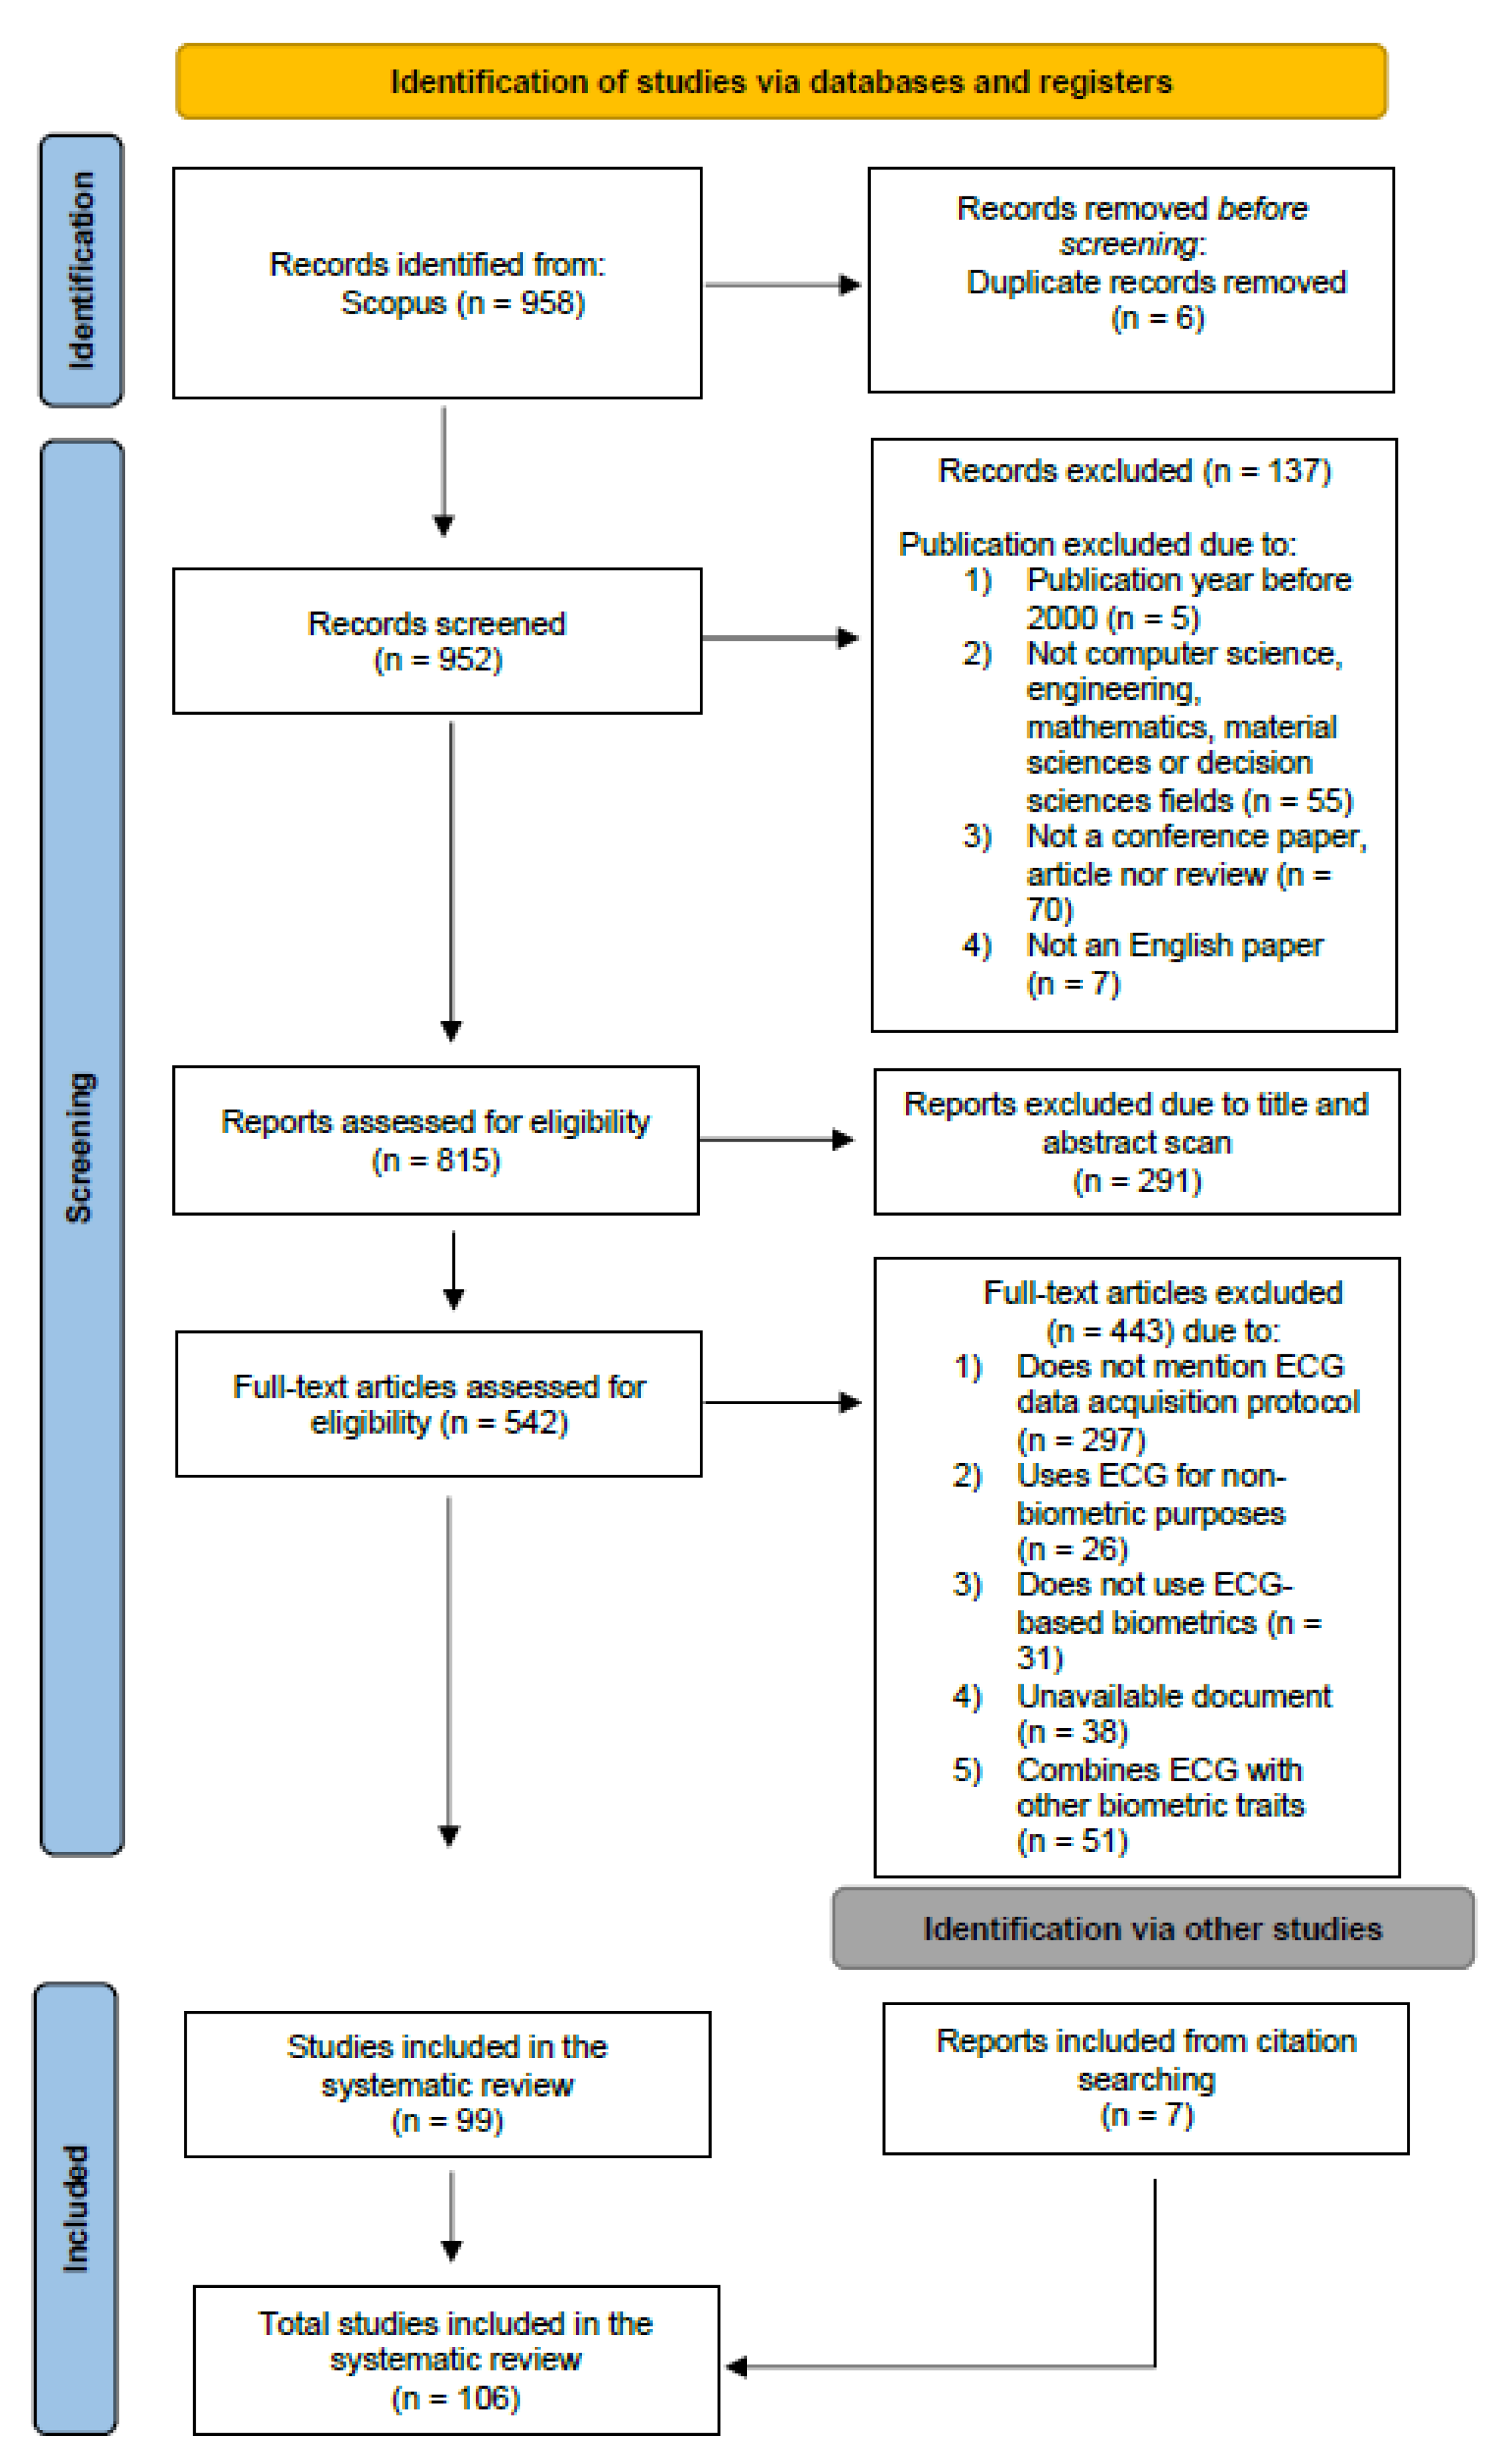
2.1. Search Strategy
2.1.1. Identification
2.1.2. Screening
2.1.3. Inclusion
2.2. Research Questions
3. ECG Acquisition and Databases
3.1. Data Acquisition
3.1.1. Acquisition Hardware Information
Intrusiveness
- On-the-Person AcquisitionsAcquisition methods that require attachment to the body, such as wet Ag/AgCl electrodes applied to the skin with a conductive electrolyte gel, are known as on-the-person methods. This approach relies on half-cell potential, double-layer capacitance, and parallel and series resistances to function. Despite providing good signal quality, wet electrodes can irritate the skin and restrict the user’s movement and may also cause interference between neighboring electrodes. These factors must be considered when using on-the-person data acquisition methods [43].This type of acquisition can either be medical or unrestricted by movement, such as through Holter systems. According to medical standards and guidelines, the standard 12-lead configuration allows for the acquisition of an ECG signal in 12 leads (or channels) using three bipolar limb leads, three monopolar limb leads, and six monopolar precordial leads. The orthogonal configuration, also called Frank leads, allows the acquisition of ECG signals using seven electrodes. In early ECG biometric research, recordings from standard 12-lead and Frank leads were used in the development and evaluation of algorithms [44,45,46,47,48,49,50]. Some researchers chose acquisitions without movement restrictions, with longer duration, and with fewer electrodes, such as Holter systems, which can acquire ECG signals for several hours while subjects perform their daily activities [7,51].
- Off-the-Person AcquisitionsThe off-the-person acquisition method refers to devices that are integrated in objects or surfaces with which the subjects interact (e.g., a computer keyboard) and do not require any special preparation of the subject [52]. Wet electrodes characteristic of medical acquisitions were replaced by dry metallic electrodes, which increase the long-term performance and cause low skin irritation. However, they have high impedance between the electrode and skin, and are susceptible to motion artifacts [43]. Off-the-person acquisitions reduce the number of leads to two or three, and their placements are confined to the upper limbs, especially on the wrists, hands, or fingers [5,15,16,20,24,53,54,55]. Recently, a few initiatives have been conducted to improve off-the-person configurations and approach unconstrained settings in ECG biometrics. These efforts seek to close the gap to real, commercial applications by developing wearable technologies for ECG acquisition or embedding the sensors into common objects [7,11,13,18,28].
Number of Leads
Duration of Acquisition
3.1.2. Acquisition Protocol
Time Stability
Number of Subjects
Physical Condition
Posture
Emotions
Cardiac Conditions
3.2. Acquisition Devices
3.2.1. Commercially Available Devices
- Vital JacketThe VitalJacket [87], presented in Figure 5a, is a wearable device developed by researchers from the IEETA research unit at the University of Aveiro and commercialized by Biodevices SA [88]. It is designed to continuously record high-quality ECG and other vital signals in various clinical and everyday settings. The collected data can be stored on an SD card for offline analysis or transmitted via Bluetooth to mobile devices for real-time monitoring and online processing. Ye et al. [13] investigated the applicability of ECG signals from such wearable device in human identification. In the five-subject study, their proposed method exhibited near 100% recognition rates based on single heartbeats, even with a six-month interval between the training and testing data. Ramos et al. [11] used VitalJacket to collect ECG signals from twenty healthy participants in two sessions separated by 2 weeks. They investigated the impact of movement, the influence of using different ECG acquisition placement, the impact of temporal separation between sessions, and the impact of the acquisition time. The authors reached an accuracy of 99% for signals collected on the fingers in two different sessions. For the various experiments, the results suggested that the ECG signals acquired using VitalJacket can be used as robust biometrics.
- RespiBanThe RespiBAN Professional, which is presented in Figure 5b, is a wearable system made by PLUX, which includes a PLUX accelerometer biosensor and biosignal acquisition hardware, as well as a respiration biometric sensor embedded in the chest strap fabric. This device can measure various biosignals, including ECG, electrodermal activity (EDA), electromyogram (EMG), and skin temperature. The collected data can be transmitted to mobile devices via Bluetooth. Biçakci et al. [7] used the WESAD dataset, which consists of ECG recordings collected from a RespiBAN device. The EER obtained was 7.07%, meaning that ECG biometrics will be a valid verification option (or could be in the future) using wearable devices for data acquisition.
- Nymi BandThe Nymi Band [89], shown in Figure 5c, is a wearable device that uses the wearer’s unique cardiac signal to unlock Bluetooth-enabled devices such as computers, smartphones, and cards. To authenticate the user, the Nymi Band is placed on the wrists and the top of the device is touched with a finger. As long as the device is worn, the user remains authenticated. The Nymi Band is equipped with a heart rate monitor, accelerometer, gyroscope, and biometric authenticator, and is powered by a rechargeable battery. Chun et al. [14] used ECG data from 15 subjects collected using the Nymi Band, achieving an EER of 0.9%, which proves the reliability of this wearable device.
- ReadMyHeartReadMyHeart [90], shown in Figure 5d, is a handheld, non-invasive heart monitoring device made by DailyCare BioMedical Inc. It allows users to record electrical signals from their hearts by placing their thumbs on the device’s conducting plates, without the need for wires or conducting gel. The device takes 30 s to record each measurement and displays the average heart rate, ST segment, and QRS interval. These readings are based on a “modified Lead I-ECG”, rather than traditional standard ECG readings. Islam et al. [15] captured ECG signals from 112 individuals using the handheld ECG device ReadMyHeart, achieving a minimum EER of 10.52%.
- Vernier ECG SensorThe Vernier ECG Sensor [91], presented in Figure 5e, is a device used to measure the electrical potential waveforms produced during the contraction of the heart. It can be used to record standard three-lead ECG tracings or surface EMG recordings of muscle contractions in various parts of the body. The device is usually associated with the Vernier Go!Link interface, which is a low-cost USB sensor interface that connects Vernier sensors to a computer. Raj et al. [16] used the Vernier sensor for ECG acquisitions on the arm with different body postures, achieving an Optimal performance with an EER of 4.34%.
- Philips PageWriter Trim IIIThe PageWriter Trim III [92] is a compact and cost-effective cardiograph made by Philips, shown in Figure 5f. It is an interpretative ECG system designed for fast-paced clinical environments, with features such as a high-resolution full-color display and the ability to report, store, and transmit 12-lead ECG data using industry-standard XML. Carreiras et al. [17] used Philips PageWriter Trim III for ECG acquisitions of 618 subjects, achieving an EER and an IE of 9.01% and 15.64%, respectively.
- Shimmer ECG SensorThe Shimmer ECG unit [93] is a device designed for the measurement of physiological signals for ECG, and it is presented in Figure 5g. It includes a configurable digital front-end and an ECG sensor that can record the pathway of electrical impulses through the heart muscle. The sensor can be used to record ECG data on resting and ambulatory subjects, or during exercise to provide information on the heart’s response to physical exertion. Li et al. [18] used a public database, DREAMER, in which data were acquired using the Shimmer ECG Sensor, and an accuracy of 97.2% was obtained.
- BioPLUX Electrocardiography SensorThe BioPLUX [94] low-noise ECG local differential triode configuration enables fast application and unobtrusive single-lead ECG data acquisition. This sensor can be used to extract heart rate data and other ECG features, enabling its application in research fields such as biomedical, biofeedback, psychophysiology, and sports, among many others. Silva et al. [19] used the BioPlux Electrocardiography Sensor presented in Figure 5h integrated on a steering wheel for in-vehicle driver recognition, achieving an IE of 2.40%.
- Maxim 86150 Evaluation KitMaxim 86150 Evaluation Kit [95], presented in Figure 5i, is a device designed to evaluate the photoplethysmogram (PPG) and ECG bio-sensor module. The device includes a Microcontroller Board and a Sensor Board. The Microcontroller Board houses a microcontroller unit (MCU) with preloaded firmware, Bluetooth connectivity, and power management. The Sensor Board includes the MAX86150 Bio-Sensor Module and two stainless steel dry electrodes for ECG measurement. The Evaluation Kit is powered by an included lithium polymer battery, which is charged with a micro-USB cable. When monitoring is active, the module uses IR Proximity Mode to detect each user’s fingers, and a red LED will turn on when a finger is near the module. Sorvillo et al. [20] used the Maxim 86150 Evaluation Kit to collect ECG for human identification under rest and mental and physical stress, reaching accuracies of 88% and 68%, respectively.
- The BioRadioThe BioRadio [96] is a wireless biomedical monitor, shown in Figure 5j, with programmable channels for recording and transmitting various combinations of human physiological signals. It is easy to set up and operate, and the wearable device captures data in a flexible file format compatible with a variety of software suites and proprietary tools. Huang et al. [68] used the BioRadio device with the positions of the electrodes following the Einthoven’s configuration. Abdelazez et al. [97] also used this device, but the electrodes were positioned under the right and left thumbs instead. Their system achieved a precision of 0.68, being able to identify 98.7% of the false positives while retaining the true positives rate.
- Biopac MP160The BIOPAC MP160 [98] is a 16-channel system designed for the acquisition of various physiological signals, including Heart Rate Variability (HRV), Electroencephalogram (EEG), EMG, EGG, and many more. The device, represented in Figure 5k, offers multiple configurations to suit different research and teaching needs, and records multiple channels with different sample rates up to 400 kHz. Used in conjunction with AcqKnowledge software and BIOPAC electrodes, amplifiers, transducers, and other system components, the MP160 is part of a complete data acquisition and analysis system. Many researchers used the BIOPAC system for data acquisition of their proposed biometric system [21,22,23].
- Kardia by ALIVECORKardia [99] is a wireless device that allows users to record a medical-grade single-lead ECG in 30 s and receive instant analysis on their phones. It is clinically validated, CE marked, and FDA-cleared, making it a reliable option for checking one’s heart from home. Kardia, in Figure 5l, is compatible with most popular phones and tablets and, to use it, one only needs to download the Kardia app. Arteaga-Falconi et al. [24] used the Kardia device along with a mobile phone for ECG acquisitions at different times and conditions, proving the reliability of this mobile device, since the results revealed 1.41% of FAR and 81.82% of true acceptance rate.
3.2.2. Self-Developed Acquisition Devices
- SavvyRashkovska et al. [25] developed a wireless ECG sensor for long-term monitoring and tested it in various applications, including biometric authentication. The initial prototype of the wireless body sensor (WBS) was powered by a coin-sized battery and included a low power microcontroller and a 2.4 GHz radio transceiver. The design was later improved to include a rechargeable battery and a Bluetooth Low Power (BLE) radio transceiver for communication. The WBS is attached to the skin by using self-adhesive electrodes and has evolved into a more flexible and lightweight design that allows for unobtrusive long-term health monitoring and low-cost implementation. It is now commercially available as the SavvyTM sensor. The proposed methodology for biometric authentication using this device achieved an EER from 6% to 13%, depending on the subject.
- Basco et al. [26]Blasco et al. [26] developed a wearable sensor capable of measuring photoplethysmography (PPG), ECG, Galvanic Skin Response (GSR), and Acceleration (ACC) signals from the wrists. The ECG sensor is from Bitalino [100] and the two electrodes were placed on the inner side of the wristband and on top of the wristband, respectively. The viability of the use of the sensor on a biometric system was tested in three different acquisition conditions: sitting, walking, and sitting after exercise, and the results were promising.
- Guven et al. [3]Guven et al. [3] also developed a fingertip ECG data acquisition device for biometric purposes. The device consists of two dry-contact sensors, produced by Plessey Semiconductors, an instrumentation amplifier, an anti-aliasing filter, an optocoupler, a digital signals controller (DSC), and a USB connection unit. The authors conducted an experiment to evaluate the performance of the proposed device by comparing it to the use of lead-I ECG signal, recorded using Biopac MP36 with three conventional Ag/AgCl electrodes and gel. The results achieved were around 100% for the IE, showing that this portable, inexpensive, and user-friendly device is very promising for biometric applications.
- Wieclaw et al. [10]Wieclaw et al. [10] developed a sensor using an Arduino Uno and e-Health Sensor Platform V2.0 for data acquisition. Arduino Uno is a microcontroller board with 16 MHz quartz crystal and a USB port for programming, debugging, and data transfer. The e-Health Sensor Platform V2.0 extends the Arduino Uno and enables the implementation of biometric and medical applications. Data acquisition was performed using differential OpAmp schema followed by 8-bit ADC operating at 277 Hz sampling rate. ADC data were transferred to a PC via the COM-port using the PySerial Library. Modified schema required the user to touch the electrodes with two fingers from the left hand and one finger from the right.
- Peter et al. [27]Peter et al. [27] used a low-cost sensor and designed a sensor processing board. They used conventional wet cloth electrodes with repositionable conductive adhesive hydrogel to measure the electrical activity from the skin surface. Then, a sensor board that amplifies and filters the signals was designed. They applied a standard difference amplifier approach, which is a suitable solution since the basic ECG data is obtained as an output of the difference of two leads placed on the body. The circuit build consists of three parts: the differential amplifier, a filter, and a post amplifier. Afterwards, the signal follows to an embedded target platform, called Raspberry Pi (RPi), which is a low-power single-board computer. One advantage of the RPi is that it is supported by MATLAB Simulink and a range of design tools, which facilitates easy and fast prototyping.
- Ramli et al. [28]Ramli et al. [28] developed a portable ECG detection kit integrated into a wearable bracelet that is responsible for detecting the heartbeat signal of the user and sending out the ECG signals to be processed via Bluetooth. The sensor is equipped with three electrodes and by placing a finger on the topside electrode while the user’s wrists are in contact with the other two electrodes, an electrical circuit is completed; ECG signals are able to be detected by the device. The heartbeat detection kit is formed by six main parts: instrumentation amplifier (IA), high-pass filter (HPF), 60 Hz notch filter, low-pass filter (LPF), analog-to-digital converter (ADC), and signal transmitter. They also developed an Android platform application that acts as a secure login system. This application receives the serial data from the heartbeat detection kit through a Bluetooth connection. Then, when the sign-in or sign-up function of the application is triggered, the incoming data is saved to the database. The database will trigger the back-end system which is the Intel platform board to perform the embedding, features extraction, and pattern-matching processes. Once the processes are done, the verification result will be sent to the android application GUI.
- Lourenço et al. [29]Lourenço et al. [29] proposed a method and device for ECG acquisition, using a single lead setup at the fingers, with Ag/AgCl electrodes without gel. This setup aims to increase the usability and acceptability of ECG-based biometric systems to the level of other biometric traits in terms of signal acquisition. The rigid base integrates three leads which, due to the underlying sensor design, correspond to the ground, positive, and negative poles. The right-hand thumb is used as a negative electrode and the left-hand index finger acts simultaneously as the positive and ground electrodes. The base sensor is an ecgPLUX active ECG triode and the transmission was done via a Bluetooth wireless bioPLUX research biosignal acquisition unit.
3.3. Databases
3.3.1. On-the-Person
- MIT-BIH Arrhythmia DatabaseThe MIT-BIH Arrhythmia database [34] is a widely used resource for ECG-based biometrics research and is available at the Physionet repository. It consists of 48 half-hour ECG recordings from 47 subjects that were collected in the laboratories at Boston’s Beth Israel Hospital. Out of 27 subjects, 23 recordings were selected from a mixed population of inpatients (about 60%) and outpatients (about 40%), and the remaining 25 recordings were selected from the same set to include less common but clinically significant arrhythmias. The recordings were digitized at 360 samples per second per channel with an 11-bit resolution over a 10 mV range [49].
- MIT-BIH Normal Sinus Rhythm DatabaseThis database is composed of excerpts from 18 subjects from the MIT-BIH Arrhythmia database presented above, which are deemed to be free from arrhythmias or other diseases. Subjects included in this database were found to have had no significant arrhythmias, and they include 5 men, aged 26 to 45 and 13 women, aged 20 to 50 [35].
- MIT-BIH Atrial FibrillationThis database contains 25 long-term ECG recordings of human subjects with atrial fibrillation (mostly paroxysmal). The individual recordings are each 10 h in duration and include two ECG signals. The original analog recordings were made at Boston’s Beth Israel Hospital using ambulatory ECG recorders with a typical recording bandwidth of approximately 0.1 Hz to 40 Hz [40].
- PTB Diagnostic DatabaseThis database is obtained by the Physikalisch-Technische Bundesanstalt (PTB), National Metrology Institute of Germany [36]. The database contains 549 records with diverse profile information and various lengths of ECG from 290 subjects. Of the 290 subjects, 148 had suffered from myocardial infarction, 18 had cardiomyopathy or heart failure, and 52 were healthy subjects. Acquisitions were performed both through the standard 12-leads and the three Frank leads [49].
- ECG-ID DatabaseThe ECG identification database was recorded for biometric identification purposes [32]. Each raw ECG record was acquired for about 20 s with a sampling rate of 500 Hz and a 12-bit resolution. The first two records acquired on the same day were used for each subject. The database consists of 310 one-lead ECG recording sessions obtained from 90 volunteers during a resting state. The number of sessions for each volunteer varied from 2 to 20, with a time span of 1 day to 6 months between the initial and last recordings [49].
- E-HOL-03-0202-003 DatabaseThis is an ECG database from the University of Rochester that is focused on biometrics. The study population consists of 202 healthy subjects from the Intercity Digital Electrocardiogram Alliance (IDEAL) database. The database includes 24 Holter recordings that were acquired using the SpaceLab-Burdick digital Holter recorder. The equipment provides 200 Hz sampling frequency signals with 16-bit amplitude resolution. The ECG was acquired using a pseudo-orthogonal lead configuration (X, Y, and Z), obtained through four electrodes placed on the chest. There is an initial resting supine period with a duration of 20 min before starting the ambulatory recording [33].
- QT DatabaseThe QT database is a collection of ECGs that have been selected to showcase a wide range of QRS and ST-T shapes, with the goal of testing QT detection algorithms with real-world variability. These records were largely drawn from various ECG databases, including the MIT-BIH Arrhythmia Database [34], as well as additional recordings gathered at Boston’s Beth Israel Deaconess Medical Center. The additional recordings were chosen to represent extreme examples of cardiac (patho)physiology, including data from Holter recordings of patients who experienced sudden cardiac death during the recordings, as well as age- and gender-matched patients without diagnosed cardiac disease. The QT database includes a total of 105 fifteen-minute excerpts of two-channel ECGs [37].
- Drive DatabaseThis database contains data collected from a real-world driving task designed to measure a driver’s stress level. The driving protocol involved following a predetermined route for 20 min on open roads in the Boston area while following a set of instructions. Four types of physiological sensors were used during the experiment: ECG, electromyogram (EMG), skin conductivity (EDA and GSR), and respiration. These sensors were connected to a FlexComp analog-to-digital converter, which isolated the subject from the power supply. The ECG electrodes were positioned in a modified lead II configuration to minimize motion artifacts and maximize the amplitude of the R-waves, and the ECG was sampled at 496 Hz. In total, 27 collections were recorded, 6 from drivers who completed the course only once, and 7 from 3 drivers who repeated the course on multiple days [31].
- Fantasia DatabaseThe Fantasia Database is a collection of 120 min of continuous ECG recordings taken while subjects were lying down. Two groups of healthy human subjects, ten young and ten elderly participated in this acquisition. Only healthy, nonsmoking subjects with normal exercise tolerance tests, no medical problems, and taking no medication, were admitted to the study. The subjects laids supine for 120 min while continuous ECG signals were collected. All subjects remained in a relaxed state with a normal sinus rhythm while watching the movie “Fantasia” from Disney to help maintain wakefulness [39].
3.3.2. Off-the-Person
- CYBHI DatabaseIn this work, Silva et al. [30] presented the CYBHI database which consists of 128 ECG recordings acquired using the off-the-person approach. The ECG signals (2 min long) were recorded simultaneously from both wrists and fingers using dry Ag/AgCl electrodes and electrolycra strips, respectively. These sensors were placed on custom hand-shaped support, and data synchronization was ensured using the syncPLUX synchronization kit. The electrodermal activity data was also collected to provide information about the arousal state of the subject, as the acquisition protocol included both neutral and emotional elicitation tasks. The acquisition protocol consisted of short-term and long-term sessions. Short-term sessions were conducted over 2 days with 65 participants. The participants completed an experimental procedure that was 5 min long, during which they watched a low-arousal video and a high-arousal video (a horror movie trailer). Long-term sessions consisted of 2 data acquisition moments separated by a 3-month period with 63 participants. In both phases, only ECG signals from the fingers were recorded, and in each of the sessions, the subjects were seated for 2 min in a resting position with two fingers on the dry Ag/AgCl electrodes [52].
- UofTDBPouryayevali et al. [38] collected a large database with 1012 ECG recordings from different people. The acquisition hardware consisted of a pad with dry Ag/AgCl electrodes, positioned so that the left thumb was placed on the positive electrode, whereas the right thumb and right forefinger were placed on the negative and reference electrodes, respectively. According to the acquisition protocol, the ECG recordings were performed in the following conditions: supine, tripod, sit, physical exercise, and stand. The ECG signals were recorded for all the subjects while sitting, but they were collected in supine, tripod, physical exercise, and standing conditions only for 63, 63, 71, and 81 participants, respectively. Regarding the time interval, 72, 65, 54, 47, and 43 out of 1012 subjects participated in 2, 3, 4, 5, and 6 acquisition sessions, respectively. The length of each recording ranged from 2 min to 5 min [52].
- DREAMER DatabaseThis database contains two-lead ECG recordings taken during affect elicitation using audio-visual stimuli. The data was collected using eight film clips containing scenes from different films that were designed to elicit a range of emotions. Of these eighteen film clips, two were intended to evoke the following nine emotions: amusement, excitement, happiness, calmness, anger, disgust, fear, sadness, and surprise. The film clips were between 65 and 393 s long. ECG was recorded using a SHIMMER wireless sensor. A total of 25 healthy volunteers aged between 22 and 33 years old participated in the study [41].
- WESAD DatabaseThis dataset consists of ECG recordings, along with several other physiological signals, collected from 15 subjects using a RespiBan device. The device was placed around the subject’s chest and recorded ECG using a standard three-lead configuration. After the subjects were equipped with the sensors, a 20-min baseline was recorded (baseline condition), while sitting/standing at a table. Neutral reading material (magazines) was provided. During the amusement condition, the subjects watched a set of eleven funny video clips. The following phase was a stress condition, in which the subjects were exposed to the Trier Social Stress Test (TSST), which consists of a public speaking and mental arithmetic task. The subjects had to deliver a five-minute speech on their personal traits in front of a panel of three people, focusing on strengths and weaknesses. After the speech, the panel asked to subjects to count down from 2023 to 0, in steps of 17, and asked to start over if they made a mistake. Both tasks lasted about 5 min, resulting in a total of ten minutes for the stress condition. The amusement and stress conditions were followed by a meditation, in which subjects followed instructions with their eyes closed while sitting in a comfortable position for seven minutes [42].
4. Discussion
4.1. Acquisition Hardware
4.1.1. Acquisition Devices
4.1.2. Number of Leads
4.1.3. Duration of Acquisition
4.1.4. Sampling Frequency of Acquisition
4.2. Acquisition Protocol
4.2.1. Number of Subjects
4.2.2. Time Stability
4.3. Sources of Variability
4.3.1. Inter-Subject Variability
- Heart Geometry: Heart size, cardiac muscle thickness, and the overall shape of the heart dictate the paths the electrical current follows inside the heart, the number of muscle cells that depolarize, and the time it takes to depolarize the whole heart. Athletes, due to their high levels of physical training, commonly have larger hearts with thicker myocardia, which affects the ECG with higher voltages in the QRS complex and results in lower basal heart rates [109,110].
- Individual Attributes: Age, weight, and pregnancy are some of the individual attributes that can cause shifts in the heart position and/or orientation. These shifts will change the orientation of the electrical current conduction vectors along the heart, meaning the electrodes will detect the signal from a different perspective, thus altering the ECG waveform. For instance, the QRS complex amplitude tends to increase from birth to adolescence and then gradually begins to decrease afterward [8]. The authors in [111] also find that the PR interval increases slightly with increasing age. Studies have shown that the amplitude of the S wave in ECG signals is lower in women than in men between the age interval of 18–40 [112]. While gender differences in ECG signal parameters are more evident in young adulthood, they are known to decrease their effect afterward.
4.3.2. Intra-Subject Variability
- Physical Exercise: The duration of and the intervals between the different deflections of the heartbeats in an ECG signal vary with the heart rate. These changes are especially visible in the interval between the QRS complex and the T wave in situations of tachycardia (higher heart rates) or brachycardia (lower heart rates). Changes in the heart rate caused by physical exercise or meditation can, effectively, affect the electrocardiogram. While Lee at al. [69] showed that the ECG cycle became shorter after 10 min of physical exercise, running, and holding the breath for a certain period on different dates, Komeili et al. [54] also demonstrated that if, during feature selection, one investigates the features that are less affected by physical exercise, one can still achieve great biometric performance while exercising. Lee et al. [69] also investigated the ECG patterns of smokers, finding that there was also a minimal change in the ECG signal before and after smoking.
- Cardiac Conditions: Medical conditions of the heart can also interfere with the dynamics of the electrical pulse conduction and generate variability. In the scope of biometrics, many databases consisting of ECG signals from patients with cardiac conditions have been used. One of the most studied conditions is arrhythmia, which causes wide variations in the heart rate across time. Chiu et al. [82] mentioned that the low accuracies can be justified by unstable QRS-complexes, causing extracted features to change. However, Becerra et al. [78] stated that even though cardiac conditions affect the performance of the system, accuracies can be higher for some classifiers. Moreover, Ghazarian et al. [83] achieved different accuracies for different heart conditions, meaning that feature selection and classification optimization should be performed considering different cardiac conditions.
- Posture: Postures like standing or lying down differ widely on the position and shape of internal organs. The heart is also affected by this, and changes its position in the thorax, and thus its position in reference with the electrode placement, which causes variations in the collected ECG signal. The vast majority of the ECG acquisitions are performed with the subject lying down at rest. However, Porée et al. [47] stated that there is no requirement or advantage to compare only ECG shapes in supine resting conditions. Moreover, Raj et al. [16] presented more accurate performances while standing (which is a more realistic biometric scenario) than while sitting. Furthermore, Wahabi et al. [72] proved that the performance degrades if the training and testing signals are not from the same position, meaning that the enrollment task should be performed in different positions.
- Emotions: The sympathetic and parasympathetic systems of the autonomous nervous system work to increase or reduce the heart rate, respectively. These systems are under the direct influence of psychological states and thus, under stress, fear, and other strong emotions, fatigue, or drowsiness, the heart rate and the ECG signal can be affected. Even though some researchers still achieved good performances with different levels of stress and anxiety (91% and 97% for [18,73], respectively), some others proved a slightly negative impact of emotions on the performance of a biometric system. As mentioned above, Zhang et al. [75] found a reduction of the true positive rate with ECG signals acquired during high pressure and lack of sleeping situations, whereas the eating and health status did not affect the system. Thus, since there is still no consensus on whether emotions (stress, anxiety, levels of sleeping, levels of thirst and eating, etc.) negatively impact the performance of a biometric system or not, researchers should further investigate these conditions within their systems. However, we must note that it is difficult to design an experimental setup that can induce the same emotion in every subject, as different characters, varying moods, and the inability to accurately self-report an emotional experience may significantly affect the outcome of such a study.
4.3.3. Artefacts and Noise
- Electrode Material: The most used electrodes are silver/silver–chloride coated electrodes with well known frequency-band characteristics and temperature stability. However, different materials can have different characteristics affecting the recording: temperature drift can cause variation of the baseline (low frequency oscillations) while frequency-band modifications can cause attenuation of high frequencies [52].
- hlSensor Location: In the biometric scenario, it is common to use single ECG recording with only two electrodes placed in non-standard locations which can lead to different morphology of the ECG recording with respect to the standard recordings [73].
- Power-line Interference: Capacitive coupling with power lines can induce a superimposed (distorted) harmonic signal whose amplitude can obscure the morphological characteristics of ECG: notch filtering is usually used to remove this interference [52].
- Baseline Drift: Respiration causes changes in thorax volume/electrical impedance, therefore causing the isoelectric level to change slowly (in low frequencies ranges): this artefact is usually removed via low pass filtering [52].
- Movement Artefacts: The contact interface between skin/electrode is subjected to electrochemical reactions of ionic chemical species under the electrode inducing half-cell potentials of the order of 1V or less. However, patient movements can change the electrode position and the chemical concentrations of these species can vary leading to different half-cell potentials and therefore different iso-electrical (baseline) levels [52].
5. Conclusions
Author Contributions
Funding
Institutional Review Board Statement
Informed Consent Statement
Data Availability Statement
Conflicts of Interest
References
- Pereira, T.M.C.; Conceição, R.C.; Sebastião, R. Initial Study Using Electrocardiogram for Authentication and Identification. Sensors 2022, 6, 2202. [Google Scholar] [CrossRef]
- Srivastva, R.; Singh, A.; Singh, Y.N. PlexNet: A fast and robust ECG biometric system for human recognition. Inf. Sci. 2021, 558, 208–228. [Google Scholar] [CrossRef]
- Guven, G.; Gurkan, H.; Guz, U. Biometric identification using fingertip electrocardiogram signals. Signal Image Video Process. 2018, 12, 933–940. [Google Scholar] [CrossRef]
- Huang, Y.; Yang, G.; Wang, K.; Liu, H.; Yin, Y. Robust multi-feature collective non-negative matrix factorization for ECG biometrics. Pattern Recognit. 2022, 123, 108376. [Google Scholar] [CrossRef]
- Pinto, J.R.; Cardoso, J.S.; Lourenço, A. Evolution, Current Challenges, and Future Possibilities in ECG Biometrics. IEEE Access 2018, 6, 34746–34776. [Google Scholar] [CrossRef]
- Merdjanovska, E.; Rashkovska, A. Comprehensive survey of computational ECG analysis: Databases, methods and applications. Expert Syst. Appl. 2022, 203, 1468. [Google Scholar] [CrossRef]
- Biçakci, H.S.; Santopietro, M.; Boakes, M.; Guest, R. Evaluation of Electrocardiogram Biometric Verification Models Based on Short Enrollment Time on Medical and Wearable Recorders. In Proceedings of the International Carnahan Conference on Security Technology (ICCST), Hatfield, UK, 11–15 October 2021; pp. 1–6. [Google Scholar] [CrossRef]
- Uwaechia, A.N.; Ramli, D.A. A Comprehensive Survey on ECG Signals as New Biometric Modality for Human Authentication: Recent Advances and Future Challenges. IEEE Access 2021, 9, 97760–97802. [Google Scholar] [CrossRef]
- Zhang, Q.; Zhou, D. Deep Arm/Ear-ECG Image Learning for Highly Wearable Biometric Human Identification. Ann. Biomed. Eng. 2018, 46, 122–134. [Google Scholar] [CrossRef] [PubMed]
- Wieclaw, L.; Khoma, Y.; Falat, P.; Sabodashko, D.; Herasymenjo, V. Biometric identification from raw ECG signal using deep learning techniques. In Proceedings of the 9th IEEE International Conference on Intelligent Data Acquisition and Advanced Computing Systems: Technology and Applications (IDAACS), Bucharest, Romania, 21–23 September 2017; pp. 129–133. [Google Scholar] [CrossRef]
- Ramos, M.S.; Carvalho, J.M.; Pinho, A.J.; Brás, S. On the Impact of the Data Acquisition protocol on ECG Biometric Identification. Sensors 2021, 21, 4645. [Google Scholar] [CrossRef]
- PRISMA: Transparent Reporting of Systematic Reviews and Meta-Analyses. Available online: https://prisma-statement.org// (accessed on 2 December 2022).
- Ye, C.; Kumar, B.V.K.V.; Coimbra, M.T. Human Identification Based on ECG Signals from Wearable Health Monitoring Devices. In Proceedings of the 4th International Symposium on Applied Sciences in Biomedical and Communication Technologies, Barcelona, Spain, 26–29 October 2011; pp. 1–4. [Google Scholar] [CrossRef]
- Chun, S.Y.; Hang, J.H.; Kim, H.; Lee, C.; Oakley, I.; Kim, S.P. ECG based user authentication for wearable devices using short time Fourier transform. In Proceedings of the 39th International Conference on Telecommunications and Signal Processing (TSP), Vienna, Austria, 27–29 June 2016; pp. 656–659. [Google Scholar] [CrossRef]
- Islam, M.S.; Alajlan, N. Biometric template extraction from a heartbeat signal captured from fingers. Multimed. Tools Appl. 2017, 76, 12709–12733. [Google Scholar] [CrossRef]
- Raj, P.S.; Hatzinakos, D. Feasibility of single-arm single-lead ECG biometrics. In Proceedings of the 22nd European Signal Processing Conference (EUSIPCO), Lisbon, Portugal, 1–5 September 2014; pp. 2525–2529. [Google Scholar]
- Carreiras, C.; Lourenço, A.; Silva, H.P.; Fred, A.L.N. Evaluating Template Uniqueness in ECG Biometrics. In Informatics in Control, Automation and Robotics; Springer: Berlin/Heidelberg, Germany, 2016; pp. 111–123. [Google Scholar] [CrossRef]
- Li, W.; Zhang, Z.; Hou, B.; Song, A. Collaborative-Set Measurement for ECG-Based Human Identification. IEEE Trans. Instrum. Meas. 2021, 70, 1–8. [Google Scholar] [CrossRef]
- Silva, H.; Lourenço, A.; Fred, A. In-vehicle driver recognition based on hand ECG signals. In Proceedings of the 2012 ACM International Conference on Intelligent User Interfaces, Lisbon, Portugal, 14–17 February 2012; pp. 25–28. [Google Scholar] [CrossRef]
- Sorvillo, R.; Bacco, L.; Merone, M.; Zompanti, A.; Santonic, M.; Pennazza, G.; Iannello, G. Single beat ECG-based Identification System: Development and robustness test in different working conditions. In Proceedings of the IEEE International Workshop on Metrology for Industry 4.0 & IoT, Rome, Italy, 7–9 June 2021; pp. 538–543. [Google Scholar] [CrossRef]
- Tirado-Martin, P.; Liu-Jimenez, J.; Sanchez-Cosanova, J.; Sanchez-Reillo, R. QRS Differentiation to improve ECG Biometrics under Different Physical Scenarios Using Multilayer Perceptron. Appl. Sci. 2020, 10, 6896. [Google Scholar] [CrossRef]
- Nobunaga, T.; Watanabe, T.; Tanaka, H. Identification of Exercising Individuals Based on Features Extracted from ECG Frequency Spectrums. IEICE Trans. Fundam. Electron. Commun. Comput. Sci. 2018, 7, 1151–1155. [Google Scholar] [CrossRef]
- Carvalho, J.M.; Bras, S.; Ferreira, J.; Soares, S.; Pinho, A.J. Impact of the Acquisition Time on ECG Compression-Based Biometric Identification Systems. In Pattern Recognition and Image Analysis; Springer: Berlin/Heidelberg, Germany, 2017; Volume 10255, pp. 169–176. [Google Scholar] [CrossRef]
- Arteaga-Falconi, J.S.; Al Osman, H.; El Saddik, A. ECG Authentication for Mobile Devices. IEEE Trans. Instrum. Meas. 2016, 65, 591–600. [Google Scholar] [CrossRef]
- Rashkovska, A.; Depolli, M.; Tomasic, I.; Avbelj, V.; Trobec, R. Medica-Grade ECG Sensor for Long-Term Monitoring. Sensors 2020, 20, 1695. [Google Scholar] [CrossRef] [PubMed]
- Blasco, J.; Peris-Lopez, P. On the feasibility of low-cost wearable sensors for multi-modal biometric verification. Sensors 2018, 18, 2782. [Google Scholar] [CrossRef]
- Peter, S.; Reddy, B.P.; Momtaz, F.; Givargis, T. Design of Secure ECG-Based Biometric Authentication in Body Area Sensor Networks. Sensors 2016, 16, 570. [Google Scholar] [CrossRef] [PubMed]
- Ramli, D.A.; Hooi, M.Y.; Chee, K.J. Development of Heartbeat Detection Kit for Biometric Authentication System. Procedia Comput. Sci. 2016, 96, 305–314. [Google Scholar] [CrossRef]
- Lourenco, A.; Silva, H.P.; Fred, A. Unveiling the Biometric Potential of Finger-Based ECG Signals. Comput. Intell. Neurosci. 2011, 2011, 720971. [Google Scholar] [CrossRef] [PubMed]
- Silva, H.P.; Lourenco, A.; Fread, A.; Raposo, N.; Aires-de-Sousa, M. Check Your Biosignals Here: A new dataset for off-the-person ECG biometrics. Comput. Methods Programs Biomed. 2013, 113, 503–514. [Google Scholar] [CrossRef] [PubMed]
- Healey, J.A.; Picard, R.W. Detecting stress during real-world driving tasks using physiological sensors. IEEE Trans. Intell. Transp. Syst. 2005, 6, 156–166. [Google Scholar] [CrossRef]
- Lugovaya, T.S. Biometric Human Identification Based on Electrocardiogram. Master’s Thesis, Faculty of Compuring Technologies and Informatics, Electrotechnical University “LETI”, Saint-Petersburg, Russia, 2005. [Google Scholar]
- E-hol-03-0202-003, University of Rocher Medical Center, Telemetric and Holter ECG Warehouse. Available online: http://thew-project.org/database/e-hol-03-0202-003.html (accessed on 20 August 2022).
- Moddy, G.B.; Mark, R.G. The impact of the MIT-BIH Arrhythmia Database. IEEE Eng. Med. Biol. 2001, 20, 45–50. [Google Scholar] [CrossRef] [PubMed]
- Goldberger, A.; Amaral, L.; Glass, L.; Hausdorff, J.; Ivanov, P.C.; Mark, R.; Stangley, H.E. PhysioBank, PhysioToolkit, and PhysioneNet: Components of a new research resource for complex physiologic signals. Circulation 2000, 101, e215–e220. [Google Scholar] [CrossRef]
- Bousseljot, R.; Kreiseler, D.; Schnabel, A. Nutzung der EKG-Signaldatenbank CARDIODAT der PTB über das Internet. Biomed. Tech. 1995, 40, 317–318. [Google Scholar] [CrossRef]
- Laguna, P.; Mark, R.G.; Goldberger, A.L.; Moody, G.B. A Database for Evaluation of Algorithms for Measurement of QT and Other Waveform Intervals in the ECG. Comput. Cardiol. 1997, 24, 673–676. [Google Scholar]
- Pouryayevali, S. ECG Biometrics: New Algorithm and Multimodal Biometric System. University of Toronto (Canada) [ProQuest Dissertations Publishing 1604768]. 2015. Available online: https://www.proquest.com/openview/5c65393cd4e46efa7af666f4ed901773/1?pq-origsite=gscholar&cbl=18750 (accessed on 1 September 2022).
- Iyengar, N.; Peng, C.K.; Morin, R.; Goldberger, A.L.; Lipsitz, L.A. Age-related alterations in the fractal scaling of cardiac interbeat interval dynamics. Am. J. Physiol. 1996, 271, 1078–1084. [Google Scholar] [CrossRef]
- Moddy, G.B.; Mark, R.G. A new method for detecting atrial fibrillation using R-R intervals. Comput. Cardiol. 1983, 10, 227–230. [Google Scholar]
- Katsigiannis, S.; Ramzan, N. DREAMER: A Database for Emotion Recongition Through EEG and ECG Signals from Wireless Low-cost Off-the-Shelf Devices. IEEE J. Biomed. Health Inform. 2018, 22, 98–107. [Google Scholar] [CrossRef]
- Schmidt, P.; Reiss, A.; Duerichen, R.; Marberger, C.; Laerhoven, K.V. Introducing WESAD, a Multimodal Dataset for Wearable Stress and Affect Detection. In Proceedings of the 20th ACM International Conference on Multimodal Interaction (ICMI’18), Boulder, CO, USA, 16–20 October 2018; pp. 400–408. [Google Scholar] [CrossRef]
- Rathore, A.S.; Li, Z.; Zhu, W.; Jin, Z.; Xu, W. A survey on Heart Biometrics. ACM Comput. Surv. 2021, 53, 1–38. [Google Scholar] [CrossRef]
- Dong, X.; Si, W.; Yu, W. Identity Recognition Based on the QRS Complex Dynamics of Electrocardiogram. IEEE Access 2020, 8, 134373–134385. [Google Scholar] [CrossRef]
- Wu, S.; Chen, P.; Hsieh, J. Spatialtemporal features of electrocardiogram for biometric recognition. Multidimens. Syst. Signal Process. 2018, 30, 989–1007. [Google Scholar] [CrossRef]
- Dalal, S.; Vishwakarma, P.; Sisaudia, V. ECG Classification using Kernel Extreme Learning Machine. In Proceedings of the 2nd IEEE International Conference on Power Electronics, Intelligent Control and Energy Systems (ICPEICES), Delhi, India, 22–24 October 2018; pp. 988–992. [Google Scholar] [CrossRef]
- Porée, F.; Kervio, G.; Carrault, G. ECG biometric analysis in different physiological recording conditions. Signal Image Video Process. 2016, 10, 267–276. [Google Scholar] [CrossRef]
- Singh, Y.N.; Singh, S.K. Human Identification Using Heartbeat Interval Features and ECG Morphology. In Proceedings of the Seventh International Conference on Bio-Inspired Computing: Theories and Applications (BIC-TA 2012), Gwalior, India, 14–16 December 2012; Springer: Berlin/Heidelberg, Germany, 2013. [Google Scholar] [CrossRef]
- Ingale, M.; Cordeiro, R.; Thentu, S.; Park, Y.; Karimian, N. ECG Biometric Authentication: A Comparative Analysis. IEEE Access 2020, 8, 117853–117866. [Google Scholar] [CrossRef]
- Agrafioti, F.; Hatzinakos, D. Fusiono f ECG sources for human identification. In Proceedings of the 3rd International Symposium on Communications, Control and Signal Processing, Saint Julian’s, Malta, 12–14 March 2008; pp. 1542–1547. [Google Scholar] [CrossRef]
- Labati, R.D.; Sassi, R.; Scotti, F. ECG Biometric recognition: Permanence analysis of QRS signals for 24 h continuous authentication. In Proceedings of the IEEE International Workshop on Information Forensics and Security, Guangzhou, China, 18–21 November 2013; pp. 31–36. [Google Scholar] [CrossRef]
- Merone, M.; Soda, P.; Sansone, M.; Sansone, C. ECG databases for biometric systems: A systematic review. Expert Syst. Appl. 2017, 67, 189–202. [Google Scholar] [CrossRef]
- Chen, Y.; Chen, W. Finger ECG-based authentication for healthcare data security using artificial neural network. In Proceedings of the IEEE 19th International Conference on e-Health Networking, Applications and Services (Healthcom), Dalian, China, 12–15 October 2017; pp. 1–6. [Google Scholar] [CrossRef]
- Komeili, M.; Louis, W.; Armanfard, N.; Hatzinakos, D. On evaluating human recognition using electrocardiogram signals: From rest to exercise. In Proceedings of the IEEE Canadian Conference on Electrical and Computer Engineering (CCECE), Vancouver, BC, Canada, 15–18 May 2016; pp. 1–4. [Google Scholar] [CrossRef]
- Lin, S.L.; Chen, C.K.; Lin, C.L.; Yang, W.C.; Chiang, C.T. Individual identification based on chaotic electrocardiogram signals during muscular exercise. IET Biom. 2014, 3, 257–266. [Google Scholar] [CrossRef]
- Jyotishi, D.; Dandapat, S. An ECG Biometric System Using Hierarchical LSTM With Attention Mechanism. IEEE Sens. J. 2022, 2, 6052–6061. [Google Scholar] [CrossRef]
- Ponciano, V.; Pires, I.M.; Ribeiro, F.R.; Villasana, M.V.; Teixeira, M.C.; Zdravevski, E. Experimental Study for Determining the Parameters Required for Detecting ECG and EEG Related Diseases during the Timed-Up and Go Test. Computers 2020, 9, 67. [Google Scholar] [CrossRef]
- Shdefat, A.; Mostafa, N.; Saker, L.; Topcu, A. A survey study of the current challenges and opportunities of deploying the ECG biometric authentication method in IoT and 5G environments. Indones. J. Electr. Eng. Inform. 2021, 9. [Google Scholar] [CrossRef]
- Jekova, I.; Krasteva, V.; Schmid, R. Human Identification by Cross-Correlation and Pattern Matching of Personalized Heartbeat: Influence of ECG Leads and Reference Database Size. Sensors 2018, 2, 372. [Google Scholar] [CrossRef]
- Fang, S.C.; Chan, H.L. Human identification by quantifying similarity and dissimilarity in electrocardiogram phase space. Pattern Recognit. 2009, 42, 1824–1831. [Google Scholar] [CrossRef]
- Ibtehaz, N.; Chowdhury, M.E.H.; Khandakar, A.; Kiranyaz, S.; Rahman, M.S.; Tahir, A.; Qiblawey, Y.; Rahman, T. EDITH: ECG Biometrics Aided by Deep Learning for Reliable Individual Authentication. IEEE Trans. Emerg. Top. Comput. Intell. 2022, 6, 928–940. [Google Scholar] [CrossRef]
- Romero, J.C.B.; Echeverri, J.M.R.; Cortés, J.M.R.; Gil, P.G.; Magdaleno, J.R.; Vega, I.C. On signal variability of ECG-based biometric system under practical considerations. In Proceedings of the IEEE Mexican Humanitarian Technology Conference, Puebla, Mexico, 21–22 April 2021; pp. 19–24. [Google Scholar] [CrossRef]
- Pinto, J.R.; Cardoso, J.S. An End-to-End Convolutional Neural Network for ECG-Based Biometric Authentication. In Proceedings of the IEEE 10th International Conference on Biometrics Theory, Applications and Systems (BTAS), Tampa, FL, USA, 23–26 September 2019; pp. 1–8. [Google Scholar] [CrossRef]
- Djelouat, H.; Disi, M.A.; Amira, A.; Bensaali, F.; Zhai, X. Compressive Sensing Based ECG Biometric System. In Intelligent Systems and Applications; Springer: Berlin/Heidelberg, Germany, 2018; Volume 869, pp. 126–137. [Google Scholar] [CrossRef]
- Chee, K.J.; Ramli, D.A. Electrocardiogram Biometric Using Transformer’s Self-Attention Mechanism for Sequence Pair Feature Extractor and Flexible Enrollment Scope Identification. Sensors 2022, 22, 3446. [Google Scholar] [CrossRef] [PubMed]
- Sun, H.; Guo, Y.; Chen, B.; Chen, Y. A Practical Cross-Domain ECG Biometric Identification Method. In Proceedings of the 2019 IEEE Global Communications Conference (GLOBECOM), Waikoloa, HI, USA, 9–13 December 2019; pp. 1–6. [Google Scholar] [CrossRef]
- Choi, G.H.; Bak, E.S.; Pan, S.B. User Identification System Using 2D Resized Spectrogram Features of ECG. IEEE Access 2019, 7, 34862–34873. [Google Scholar] [CrossRef]
- Huang, P.; Guo, L.; Li, M.; Fang, Y. Practical Privacy-Preserving ECG-Based Authentication for IoT-Based Healthcare. IEEE Internet Things J. 2019, 6, 9200–9210. [Google Scholar] [CrossRef]
- Lee, W.; Kim, S.; Kim, D. Individual Biometric Identification Using Multi-Cycle Electrocardiographic Waveform Patterns. Sensors 2018, 18, 1005. [Google Scholar] [CrossRef] [PubMed]
- Iqbal, F.T.Z.; Sidek, K.A. Cardioid graph based ECG biometric using compressed QRS complex. In Proceedings of the International Conference on BioSignal Analysis, Processing and Systems (ICBAPS), Kuala Lumpur, Malaysia, 26–28 May 2015; pp. 11–15. [Google Scholar] [CrossRef]
- Wahabi, S.; Pouryayevali, S.; Hatzinakos, D. Posture-invariant ECG recognition with posture detection. In Proceedings of the IEEE International Conference on Acoustics, Speech and Signal Processing (ICASSP), Kuala Lumpur, Malaysia, 26–28 May 2015; pp. 1812–1816. [Google Scholar] [CrossRef]
- Wahabi, S.; Pouryayevali, S.; Hari, S.; Hatzinakos, D. On evaluating ECG Biometric Systems: Session-Dependence and Body Posture. IEEE Trans. Inf. Forensics Secur. 2014, 9, 2002–2013. [Google Scholar] [CrossRef]
- Israel, S.; Irvine, J.; Cheng, A.; Wiederhold, M.; Wiederhold, B. ECG to identify individuals. Pattern Recognit. 2005, 38, 133–142. [Google Scholar] [CrossRef]
- Zhou, R.; Wang, C.; Zhang, P.; Chen, X.; Du, L.; Wang, P.; Zhao, Z.; Du, M.; Fang, Z. ECG-based biometric under different psychological stress states. Comput. Methods Programs Biomed. 2021, 202, 106005. [Google Scholar] [CrossRef]
- Zheng, G.; Zhang, H.Y.; Ji, S.Z. ECG based identification under different physical status In Proceedings of the International Conference on Machine Learning and Cybernetics (ICMLC). Chengdu, China, 15–18 July 2018; pp. 197–203. [Google Scholar] [CrossRef]
- Zheng, G.; Ji, S.; Dai, M.; Sun, Y. ECG based identification by deep learning. Chin. Conf. Biom. Recognit. 2017, 10568, 503–510. [Google Scholar] [CrossRef]
- Chen, M.; Li, Y.F.; Bao, S.D.; Zhang, Y.J. A comparative performance study of electrocardiogram-based human identity recognition. In Proceedings of the IEEE International Conference on Computational Science and Engineering (CSE) and IEEE International Conference on Embedded and Ubiquitous Computing (EUC), New York, NY, USA, 1–3 August 2019; pp. 121–126. [Google Scholar] [CrossRef]
- Becerra, M.; Duque-Mejía, C.; Zapata, H.J.; Peluffo, D.; Serna-Guarín, L.; Delgado-Trejos, E.; Revelo, J.; Blanco, X. Exploratory Study of the Effects of Cardiac Murmurs on Electrocardiographic-Signal-Based Biometric Systems. Lect. Notes Comput. Sci. 2018, 11314, 410–418. [Google Scholar] [CrossRef]
- Singh, Y.N. Human recognition using Fisher’s discriminant analysis of heartbeat interval features and ECG morphology. Neurocomputing 2015, 167, 322–335. [Google Scholar] [CrossRef]
- Sidek, K.A.; Khalil, I.; Jelinek, H.F. ECG Biometric with Abnormal Cardiac Conditions in Remote Monitoring System. IEEE Trans. Syst. Man, Cybern. Syst. 2014, 44, 1498–1509. [Google Scholar] [CrossRef]
- Loong, J.L.C.; Swee, S.K.; Bear, R.; Subari, K.S.; Abdullah, M.K. Effects of diseased ECG on the robustness of ECG biometric systems. In Proceedings of the IEEE EMBS Conference on Biomedical Engineering and Sciences (IECBES), Kuala Lumpur, Malaysia, 30 November–2 December 2010; pp. 307–310. [Google Scholar] [CrossRef]
- Chiu, C.C.; Chuang, C.M.; Hsu, C.Y. Discrete Wavelet Transform Applied on Personal Identity Verification with ECG Signal. Int. J. Wavelets Multiresolution Inf. Process. 2009, 7, 341–355. [Google Scholar] [CrossRef]
- Ghazarian, A.; Zheng, J.; El-Askary, H.; Chu, H.; Fu, G.; Rakovski, C. Increased Risks of Re-Identification For Patients Posed by Deep Learning-Based ECG Identification Algorithms. In Proceedings of the 43rd Annual International Conference of the IEEE Engineering in Medicine & Biology Society (EMBC), Virtual Conference, 31 October–4 November 2021; pp. 1969–1975. [Google Scholar] [CrossRef]
- Tison, G.H.; Zhang, J.; Delling, F.N.; Deo, R.C. Automated and Interpretable Patient ECG Profiles for Disease Detection, Tracking, and Discovery. Circ Cardiovasc. Qual Outcomes 2019, 12, e005289. [Google Scholar] [CrossRef] [PubMed]
- Rath, A.; Mishra, D.; Panda, G.; Satapathy, S.C. Heart disease detection using deep learning methods from imbalanced ECG samples. Biomed. Signal Process. Control. 2021, 68, 102820. [Google Scholar] [CrossRef]
- Karaoğuz, M.R.; Yurtseven, E.; Aslan, G.; Deliormanlı, B.G.; Adıgüzel, O.; Gönen, M.; Li, K.M.; Yılmaz, E.N. The quality of ECG data acquisition, and diagnostic performance of a novel adhesive patch for ambulatory cardiac rhythm monitoring in arrhythmia detection. J. Electrocardiol. 2019, 54, 28–35. [Google Scholar] [CrossRef]
- Cunha, J.P.S.; Cunha, B.; Pereira, A.S.; Xavier, W.; Ferreira, N.; Meireles, L. Vital-Jacket: A wearable wireless vital signs monitor for patients’ mobility in cardiology and sports. In Proceedings of the 2010 4th International Conference on Pervasive Computing Technologies for Healthcare, Munich, Germany, 22–25 March 2010; pp. 1–2. [Google Scholar] [CrossRef]
- VitalJacket Holter—Biodevices. Available online: https://www.vitaljacket.com/pt/vitaljacket-holter/ (accessed on 1 November 2022).
- Nymi Band. Available online: https://www.nymi.com/ (accessed on 1 November 2022).
- Daily Care ReadyMyHeart ECG Recorder. Available online: https://ekgshop.com/product/daily-care-readmyheart-ecg-recorder/ (accessed on 1 November 2022).
- EKG Sensor - Vernier Science Education. Available online: https://www.vernier.com/product/ekg-sensor/ (accessed on 1 November 2022).
- Philips PageWriter Trim III EKG - SOMA TECH INTL. Available online: https://www.somatechnology.com/EKG-Machines/Philips-Pagewriter-Trim-III.aspx (accessed on 1 November 2022).
- Shimmer3 ECG Unit. Available online: https://shimmersensing.com/product/shimmer3-ecg-unit-2/ (accessed on 1 November 2022).
- Electrocardiography (ECG) Sensor. Available online: https://www.pluxbiosignals.com/products/electrocardiography-ecg-sensor-1 (accessed on 2 November 2022).
- Maxim Integrated MAX86150 Evaluation Kit (MAX86150EVSYS#). Available online: https://eu.mouser.com/new/maxim-integrated/maxim-max86150-eval-kit/ (accessed on 2 November 2022).
- The BioRadio—Wireless Biomedical Monitor. Available online: https://glntdevelopment.com/bioradio/bioradio-wireless-physiological-monitor/ (accessed on 2 November 2022).
- Abdelazez, M.; Hozayn, M.; Hanna, G.S.K.; Chan, A.D.C. Gating of false identifications in electrocardiogram based biometric system. In Proceedings of the IEEE International Symposium on Medical Measurements and Applications (MeMeA), Rochester, MN, USA, 7–10 May 2017; pp. 338–343. [Google Scholar] [CrossRef]
- MP160 STARTER SYSTEMS. Available online: https://www.biopac.com/product-category/research/systems/mp150-starter-systems/ (accessed on 2 November 2022).
- KardiaMobile EKG Monitor by Alivecor. Available online: https://store.kardia.com/products/kardiamobile (accessed on 2 November 2022).
- HeartBIT PLUX. Available online: https://www.pluxbiosignals.com/collections/bitalino/products/heartbit (accessed on 1 November 2022).
- Physionet Database. Available online: https://physionet.org/about/database/ (accessed on 10 December 2022).
- Blaco, J.; Chen, T.M.; Tapiador, J.; Peris-Lopez, P. A survey of Wearable Biometric Recognition Systems. ACM Comput. Surv. 2017, 49, 1–35. [Google Scholar] [CrossRef]
- Hong, S.; Zhou, Y.; Shang, J.; Xiao, C.; Sun, J. Opportunities and challenges of deep learning methods for electrocardiogram data: A systematic review. Comput. Biol. Med. 2020, 122, 103801. [Google Scholar] [CrossRef]
- Sörnmo, L.; Laguna, P. Bioelectrical Signal Processing in Cardiac and Neurological Application, Biomedical Engineering; Academic Press: Burlington, NJ, USA, 2005; pp. 411–566. [Google Scholar] [CrossRef]
- Chan, A.D.C.; Hamdy, M.M.; Badre, A.; Badee, V. Wavelet distance measure for person identification using electrocardiograms. IEEE Trans. Instrum. Meas. 2008, 57, 248–253. [Google Scholar] [CrossRef]
- Censi, F.; Calcagnini, G.; Corazza, I.; Mattei, E.; Triventi, M.; Bartolini, P.; Boriani, G. On the resolution of ECG acquisition systems for the reliable analysis of the P-Wave. Physiol Meas. 2022, 33, N11.7. [Google Scholar] [CrossRef] [PubMed]
- Sidek, K.A.; Khalil, I. Enhancement of low sampling frequency recordings for ECG biometric matching using interpolation. Comput. Methods Programs Biomed. 2013, 109, 13–25. [Google Scholar] [CrossRef] [PubMed]
- Ranjan, A. Permanence of ECG Biometric: Experiments Using Convolutional Neural Networks. In Proceedings of the International Conference on Biometrics (ICB), Crete, Greece, 4–7 June 2019; pp. 1–6. [Google Scholar] [CrossRef]
- Hoekema, R.; Uijen, G.J.H.; Oosterom, A.V. Geometrical aspects of the inter-individual variability of multilead ECG recordings. Comput. Cardiol. 1999, 26, 499–502. [Google Scholar] [CrossRef]
- Oosterom, A.V.; Hoekema, R.; Uijen, G.J. Geometrical factors affecting the interindividual variability of the ECG and the VCG. J. Electrocardiol. 2000, 33, 219–227. [Google Scholar] [CrossRef] [PubMed]
- Aro, A.L.; Anttonen, O.; Kerola, T.; Junttila, M.J.; Tikkanen, J.T.; Rissanen, H.A.; Reunanen, A.; Huikuri, H.V. Prognostic significance of prolonger PR interval in the general population. Eur. Heart J. 2014, 35, 123–129. [Google Scholar] [CrossRef]
- Macfarlane, P.W.; Lawrie, T.D.V. The Normal Electrocardiogram and Vectorcardiogram. Comprehensive Electrocardiology; Macfarlane, P.W., van Oosterom, A., Pahlm, O., Kligfield, P., Janse, M., Camm, J., Eds.; Springer: Berlin/Heidelberg, Germany, 2010. [Google Scholar] [CrossRef]
- Sansone, M.; Fusco, R.; Pepino, A.; Sansone, C. Electrocardiogram Pattern Recognition and Analysis Based on Artificial Neural Networks and Support Vector Machines: A review. J. Healthc. Eng. 2013, 4, 465–504. [Google Scholar] [CrossRef]
- Fratini, A.; Sansone, M.; Bifulco, P.; Cesarelli, M. Individual identification via electrocardiogram analysis. Biomed. Eng. Online 2015, 14, 78. [Google Scholar] [CrossRef]


| Acquisition Devices | Type of Acquisition | Type of Electrode | Data Transmission | Performance Accuracy |
|---|---|---|---|---|
| Vital Jacket | Off-the-person (Wearable) | Conductive fabric electrodes | Bluetooth | Recognition Rate 100% [13] |
| RespiBan | Off-the-person (Wearable) | Pre-gelled electrodes | Bluetooth | Equal Error Rate 7.07% [7] |
| Nymi Band | Off-the-person (Wearable) | Dry electrodes | Bluetooth | Equal Error Rate: 0.9% [14] |
| ReadMyHeart | Off-the-person | Conductive Plates | USB connection | Equal Error Rate: 10.52% [15] |
| Vernier ECG Sensor | On-the-person | Gel electrodes | VernierGo!Link (USB sensor interface) | Equal Error Rate: 4.34% while walking 8.17% while sitting 10.56% after exercise [16] |
| Philips PageWriter Trim III | On-the-person | Gel electrodes | - | Equal Error Rate: 9.01% |
| Error of Identification: 15.64% [17] | ||||
| Shimmer ECG sensor | On-the-person | Gel electrodes | - | Identification Rate: between 77.25% and 91.30% for different methods [18] |
| BioPlux Electrocardiography Sensor | Off-the-person | Dry electrodes Electrolycra | - | Identification Error: 1.66% with dry electrodes 5.61% with electrolycra [19] |
| Maxim 86150 Evaluation Kit | Off-the-person | Stainless steel dry electrodes | Bluetooth | Identification Rate: 97% [20] |
| The BioRadio | Off-the-person (Wearable) | Dry electrodes | - | - |
| BioPac | On-the-person | Wet electrodes/ Adhesive disposable Ag/AgCl wet electrodes | - | Equal Error Rate: 2.69% to 4.71% [21] Identification Rate: 100% at rest, 99.8% exercising [22] Identification Rate: 75% to 80% [23] |
| Kardia | Off-the-person (Wireless) | Dry electrodes | - | True Accept Rate: 81.82% False Acceptance Rate: 1.41% [24] |
| Savvy | Off-the-person (Wireless) | Self-adhesive electrodes | Bluetooth | Equal Error Rate: 6% to 13% [25] |
| Basco et al. [26] | Off-the-person (Wearable) | Dry electrodes | Bluetooth | - |
| Guven et al. [3] | Off-the-person | Dry electrodes | USB connection | Identification Rate: 100% |
| Wieclaw et al. [10] | Off-the-person | Dry electrodes | USB connection | Identification Rate: 96% |
| Peter et al. [27] | On-the-person | Wet cloth electrodes with conductive adhesive hydrogel | - | - |
| Ramli et al. [28] | Off-the-person (Wearable) | Dry electrodes | Bluetooth | Equal Error Rate: 2% |
| Lourenço et al. [29] | Off-the-person | Dry electrodes | Bluetooth | Identification Rate: 94.3% Equal Error Rate: 10.1% |
| Database | OP | NS | Electrode Placement | Leads/ Electrodes | Health Conditions | Activity/ Posture | Sessions | Publicly Available |
|---|---|---|---|---|---|---|---|---|
| CYBHi [30] | Yes | 128 | Palm + Fingers | 2/4 | None | Reactions triggered by sound and video | Up to two 5-min sessions, 3 months apart | Yes |
| Drive DB [31] | No | 9 | Chest | 1/- | None | Rest, highway and city driving | 50 min to 1.5 h | Yes |
| ECG-ID [32] | No | 90 | Wrists | 1/- | None | Siting, unrestrained movement | Various 20s recordings per subject over 6 months | Yes |
| E-Hol 24h [33] | No | 203 | Chest | 3/4 | None | Ambulatory recordings | 24 h | Yes |
| MIT-BIH Arrhythmia [34] | No | 47 | Chest | 2/- | Arrythmias | Ambulatory recordings | 30 min | Yes |
| MIT-BIH Normal [35] | No | 18 | Chest | 2/- | None | Ambulatory recordings | 30 min | Yes |
| PTB [36] | No | 290 | Chest + Limbs | -/15 | Various cardiac conditions | At rest only | 1–5 per subject, 38.4–104.2 s | Yes |
| QT [37] | No | 105 | Chest | - | Various cardiac conditions | Rest and exercise | 15 min | Yes |
| UofTDB [38] | Yes | 1019 | Fingers | 1/2 | None | Sit, stand, supine, exercise and tripod | Up to six 2–5 min recordings over 6 months | No |
| Fantasia [39] | No | 40 | Chest + Limbs | 12 | None | Supine at rest | 120 min | Yes |
| MIT-BIH Atrial Fibrillation | Yes | 23 | Chest + Limbs | 12 | Atrial Fibrillation [40] | Ambulatory recordings | 10 h | Yes |
| DREAMER [41] | Yes | 23 | Limbs | 1 | None | During emotional stimuli | 1 h | Yes |
| WESAD [42] | Yes | 17 | - | - | None | Sitting, speaking and watching video clips | - | Yes |
| Item | On-the-Person | Off-the-Person |
|---|---|---|
| Type of Electrodes | Wet electrodes | Dry metallic electrodes |
| Number of Leads | 5, 7, or 12 electrodes | 2 or 3 electrodes |
| Placement of Leads | Wrists, ankles, chest | Wrists, hands, fingers |
| Movement | Limited | No restriction |
| Noise | Low | High |
| Performance | High | Medium |
Disclaimer/Publisher’s Note: The statements, opinions and data contained in all publications are solely those of the individual author(s) and contributor(s) and not of MDPI and/or the editor(s). MDPI and/or the editor(s) disclaim responsibility for any injury to people or property resulting from any ideas, methods, instructions or products referred to in the content. |
© 2023 by the authors. Licensee MDPI, Basel, Switzerland. This article is an open access article distributed under the terms and conditions of the Creative Commons Attribution (CC BY) license (https://creativecommons.org/licenses/by/4.0/).
Share and Cite
Pereira, T.M.C.; Conceição, R.C.; Sencadas, V.; Sebastião, R. Biometric Recognition: A Systematic Review on Electrocardiogram Data Acquisition Methods. Sensors 2023, 23, 1507. https://doi.org/10.3390/s23031507
Pereira TMC, Conceição RC, Sencadas V, Sebastião R. Biometric Recognition: A Systematic Review on Electrocardiogram Data Acquisition Methods. Sensors. 2023; 23(3):1507. https://doi.org/10.3390/s23031507
Chicago/Turabian StylePereira, Teresa M. C., Raquel C. Conceição, Vitor Sencadas, and Raquel Sebastião. 2023. "Biometric Recognition: A Systematic Review on Electrocardiogram Data Acquisition Methods" Sensors 23, no. 3: 1507. https://doi.org/10.3390/s23031507
APA StylePereira, T. M. C., Conceição, R. C., Sencadas, V., & Sebastião, R. (2023). Biometric Recognition: A Systematic Review on Electrocardiogram Data Acquisition Methods. Sensors, 23(3), 1507. https://doi.org/10.3390/s23031507