Abstract
We sought to determine the utility of Stryd, a commercially available inertial measurement unit, to quantify running intensity and aerobic fitness. Fifteen (eight male, seven female) runners (age = 30.2 [4.3] years; O2max = 54.5 [6.5] ml·kg−1·min−1) performed moderate- and heavy-intensity step transitions, an incremental exercise test, and constant-speed running trials to establish the maximal lactate steady state (MLSS). Stryd running power stability, sensitivity, and reliability were evaluated near the MLSS. Stryd running power was also compared to running speed, O2, and metabolic power measures to estimate running mechanical efficiency (EFF) and to determine the efficacy of using Stryd to delineate exercise intensities, quantify aerobic fitness, and estimate running economy (RE). Stryd running power was strongly associated with O2 (R2 = 0.84; p < 0.001) and running speed at the MLSS (R2 = 0.91; p < 0.001). Stryd running power measures were strongly correlated with RE at the MLSS when combined with metabolic data (R2 = 0.79; p < 0.001) but not in isolation from the metabolic data (R2 = 0.08; p = 0.313). Measures of running EFF near the MLSS were not different across intensities (~21%; p > 0.05). In conclusion, although Stryd could not quantify RE in isolation, it provided a stable, sensitive, and reliable metric that can estimate aerobic fitness, delineate exercise intensities, and approximate the metabolic requirements of running near the MLSS.
1. Introduction
A consensus regarding an approach to evaluate mechanical running power output (PO) is lacking, resulting in a range of PO values for a given running speed, depending on the method [1,2]. During level running, the working muscles transfer energy to produce and absorb the forces needed to move body segments. As a result, there is no dissipative load external to the body that can be measured to quantify mechanical PO. Instead, running mechanical PO measurements may be derived from “external” or “internal” work perspectives by evaluating the centre of mass (CoM) or the body segments, respectively [1,2,3]. Such approaches require sophisticated laboratory assessments of joint kinetics and/or kinematics based on ground reaction force and motion-capture data. Several methodological challenges also limit the utility of running mechanical PO to approximate the metabolic work rate [1,3], and, in contrast to cycling, where there is a strong relationship between mechanical and metabolic PO [4,5], many factors complicate the relationship between mechanical and metabolic PO when running [6,7,8]. Nevertheless, a wearable running device that can quantify and monitor training intensity, analogous to a cycling power meter [9,10], would be useful to guide training and maximize running performance.
Several consumer technologies providing a running power metric have been developed [11,12]. These technologies derive a measurement of mechanical PO using estimates of ground reaction forces, CoM velocity, and/or vertical displacement from global positioning system (GPS) and/or inertial measurement unit (IMU) sensor data [11,12,13]. Previously, the Stryd running power device (a portable IMU), has provided the closest relationship with O2 when compared to other available commercial devices [11]. Possibly by generating a running power metric based on estimates of horizontal velocity and vertical displacement using acceleration data, it is purported that Stryd power can be used as a proxy for metabolic PO, despite changes in external conditions such as air resistance or gradient [13]. Thus, Stryd running power can theoretically quantify training intensity in a manner analogous to cycling mechanical PO and could be superior to conventional measurement approaches using running speed. Despite evidence of repeatability [11], reliability [14,15], stability during prolonged running [16], and strong linear correlations with running speed [17,18], limited research has investigated the Stryd running metric at stable metabolic work rates relative to exercising thresholds. Thus, to determine the utility of Stryd power to indicate relative exercise intensity and assess running fitness and performance, the relationship between Stryd mechanical power and metabolic power needs to be established using an exercise intensity domain training approach (i.e., evaluating running power metrics during steady-state exercise relative to the gas exchange threshold (GET) and maximal metabolic steady state (MMSS)).
Prior to determining whether Stryd running power can monitor training, like cycling power output, in uncontrolled environments (e.g., variable inclines, wind speeds, and surfaces), the primary purpose of the present study was to evaluate the Stryd power metric in a controlled environment (i.e., in situ). Using an exercise intensity domain approach, we assessed the stability, sensitivity, and reliability of Stryd at stable metabolic work rates to (i) determine the efficacy of Stryd running power as a training intensity and running performance metric, (ii) explore the relationship between running power and running economy (RE), (iii) estimate mechanical efficiency during constant-speed treadmill running, and (iv) contrast steady-state measurements with measurements derived from incremental exercise. We hypothesized that Stryd running power would be repeatable across two visits, stable during a 30-min run, and sensitive to running speeds near the maximal lactate steady state (MLSS)—a proxy measure of the MMSS. In addition, we hypothesized that Stryd power would be strongly associated with running speed, O2, and RE measurements, thereby providing a tool to guide exercise training and assess running fitness.
2. Materials and Methods
2.1. Participants
Fifteen (8 male; 7 female) recreationally active or trained/developmental runners [19] (mean [SD]; age = 30.2 [4.3] years; body mass = 68.8 [8.2] kg; height = 173.2 [8.4] cm; O2max, 54.5 [6.5] ml·kg−1·min−1) were recruited using convenience sampling. Participants were included if they were healthy, uninjured, and between 18 and 45 years of age, with recent 10-km performances of ≤50 min and ≤55 min for males and females, respectively. Within the 3 months prior to testing, runners reported exercising an average of 3.5 [1.4] days per week, running an average of 27.7 [17.1] km each week, and having 10-km best performance times of 44.6 [6.5] min. Written informed consent was provided by the runners to participate in the experimental procedures, which were approved by the University of Calgary Conjoint Health Research Ethics Board (REB20-0111) and conducted in accordance with the declaration of Helsinki, except for pre-trial registration. Participants had the option to cease participation at any time during the experimental procedures. Prior to test administration, runners completed the physical activity readiness questionnaire (PAR-Q+) to identify contraindications to exercise testing and to ensure that participants were free of medical conditions and injuries that could interfere with metabolic and cardiorespiratory exercise responses. All runners provided their own lightweight running shoes and wore the same shoes for all testing sessions.
2.2. Experimental Design
Runners visited the laboratory for five to six exercise testing sessions, with a minimum of 48 h between visits. The exercise sessions included: (1) a “Step-Ramp-Step” (SRS) exercise test to determine maximal exercising parameters [20]; (2) a series of 3–4 constant-speed bouts to determine the MLSS; and (3) a repeated trial at the MLSS running speed. Runners were asked to refrain from smoking, eating, or consuming caffeine within 2 h prior to their testing sessions. Runners did not engage in strenuous exercise on the same day as the testing sessions. A manuscript validating the SRS approach to identify the running speed and Stryd running power associated with the MLSS has been published [20]; however, despite the overlap in experimental procedures, the results presented herein are distinct.
2.3. Exercise Protocols
2.3.1. Step-Ramp-Step (SRS) Protocol
As described in detail in our previous study [20], runners performed an SRS exercise protocol during their first testing visit to establish their maximal exercising values and estimate the running speed associated with the MLSS. This SRS protocol was modified for treadmill running from a cycle ergometer-based method [21]. Of relevance to the present study, the SRS protocol involved a moderate-intensity step-transition (MOD; 6 min at 1.9 m·s−1, 6 min at 2.4 m·s−1, and 6 min at 1.9 m·s−1); an incremental treadmill running test (an initial speed of 1.9 m·s−1, increasing by ~0.2 m·s−1 (i.e., 0.5 mph) per min, until volitional exhaustion); and a heavy-intensity step transition (HVY; 4 min of treadmill running at 1.9 m·s−1, followed by 12 min of treadmill running at a speed associated with the heavy-intensity exercise domain). The incremental treadmill test immediately preceded the MOD step, but the participants recovered passively for 30 min between the incremental test and the HVY step. The SRS protocol facilitated the identification of the MLSS in 2–3 constant-speed trials [20].
2.3.2. Constant-Speed Treadmill Running—MLSS Determination
Following the initial SRS testing visit, runners completed the constant-speed exercise sessions during 4 to 5 separate visits to the lab. These visits consisted of 5 min of treadmill running at 1.9 m·s−1, followed by treadmill running at the predetermined testing speed. During all constant-speed testing visits, participants were encouraged to run until volitional exhaustion, up to a maximum duration of 45 min (excluding warm-up). Data collected beyond 30 min were not used in this study. All runners performed their initial constant-speed test at the running speed estimated to be the MLSS by the SRS protocol. Depending on whether the difference between the 10- and 30-min blood lactate concentrations ([BLa]) was ≤1 mmol·L−1 or >1 mmol·L−1, the subsequent visit was performed at a treadmill speed that was 5% faster or 5% slower, respectively. The MLSS for each runner was identified as the highest treadmill speed whereby at least 30 min of exercise was performed and the difference between the [Bla] at 10 and 30 min was ≤1 mmol·L−1 [22]. All participants performed constant-speed treadmill running trials at the MLSS, 5% above the MLSS, 5% below the MLSS, and once more at the MLSS. Data analysis was primarily based on data collected at the 10- and 30-min (or at task failure if <30 min) time points.
2.4. Equipment and Measurements
2.4.1. Cardiorespiratory Measurements
All exercise sessions were performed on a treadmill (Desmo Pro Evo, Woodway USA Inc., Waukesha, WI, USA) with an incline set to a 1% gradient [23]. Adjustments to treadmill speed could be made in 0.1 mph increments (i.e., ~0.04 m·s−1); however, all running speed data were reported in SI units (i.e., m·s−1). Ventilatory and gas exchange variables were measured using the Quark CPET metabolic cart (COSMED, Rome, Italy), with a mixing chamber (COSMED), facemask (7450 Series V2, Hans-Rudolph, Shawnee, KS, USA), 2-way non-rebreathing valve (Hans-Rudolph), and gas collection hose. The metabolic cart system was calibrated using a 3 L syringe and gas mixture of known composition (5% CO2, 16% O2, and N2 for the balance) prior to each testing visit. For the analysis, 10-s average ventilatory and gas exchange data were used. Heart rates were recorded during all testing sessions using a Polar H10 chest strap (Polar Electro Oy, Kempele, Finland).
The O2 associated with a disproportionate increase in the rate of carbon dioxide production (CO2) and minute ventilation (E) relative to the increase in O2 was used to identify the GET [24]. The O2 associated with a second disproportionate increase in E and a disproportionate increase in E/CO2 relative to the increase in O2 was used to identify the respiratory compensation point (RCP) [24,25]. O2max was identified as the highest 30-s average O2 achieved during the incremental test. All incremental tests were considered maximal, based on the observation of a O2 plateau (defined as a change in O2 of less than 150 mL·min−1, despite an increased intensity) or any of the following criteria: maximum HR within 10 bpm of the age-predicted maximal value, a respiratory exchange ratio (RER) greater than 1.15, or [Bla] ≥ 8 mmol·L−1 upon test completion.
2.4.2. Blood Lactate Measurements
All [Bla] data were collected using capillary blood drawn from a pinprick of the finger and analyzed for [Bla] using the Biosen C-Line (EKF Diagnostics, Cardiff, Wales; n = 7) or Lactate Plus (Nova Biomedical, Waltham, MA, USA; n = 8) lactate analyzer. Runners straddled the treadmill (~60–75 s) during [Bla] measurements at 10 and 30 min (or at task failure if <30 min).
2.4.3. Perceptual Responses
After familiarization with the scale, the rating of perceived exertion (RPE) was measured every 5 min during constant-speed running, using the Borg RPE scale (6–20) [26].
2.4.4. Running Power—Stryd
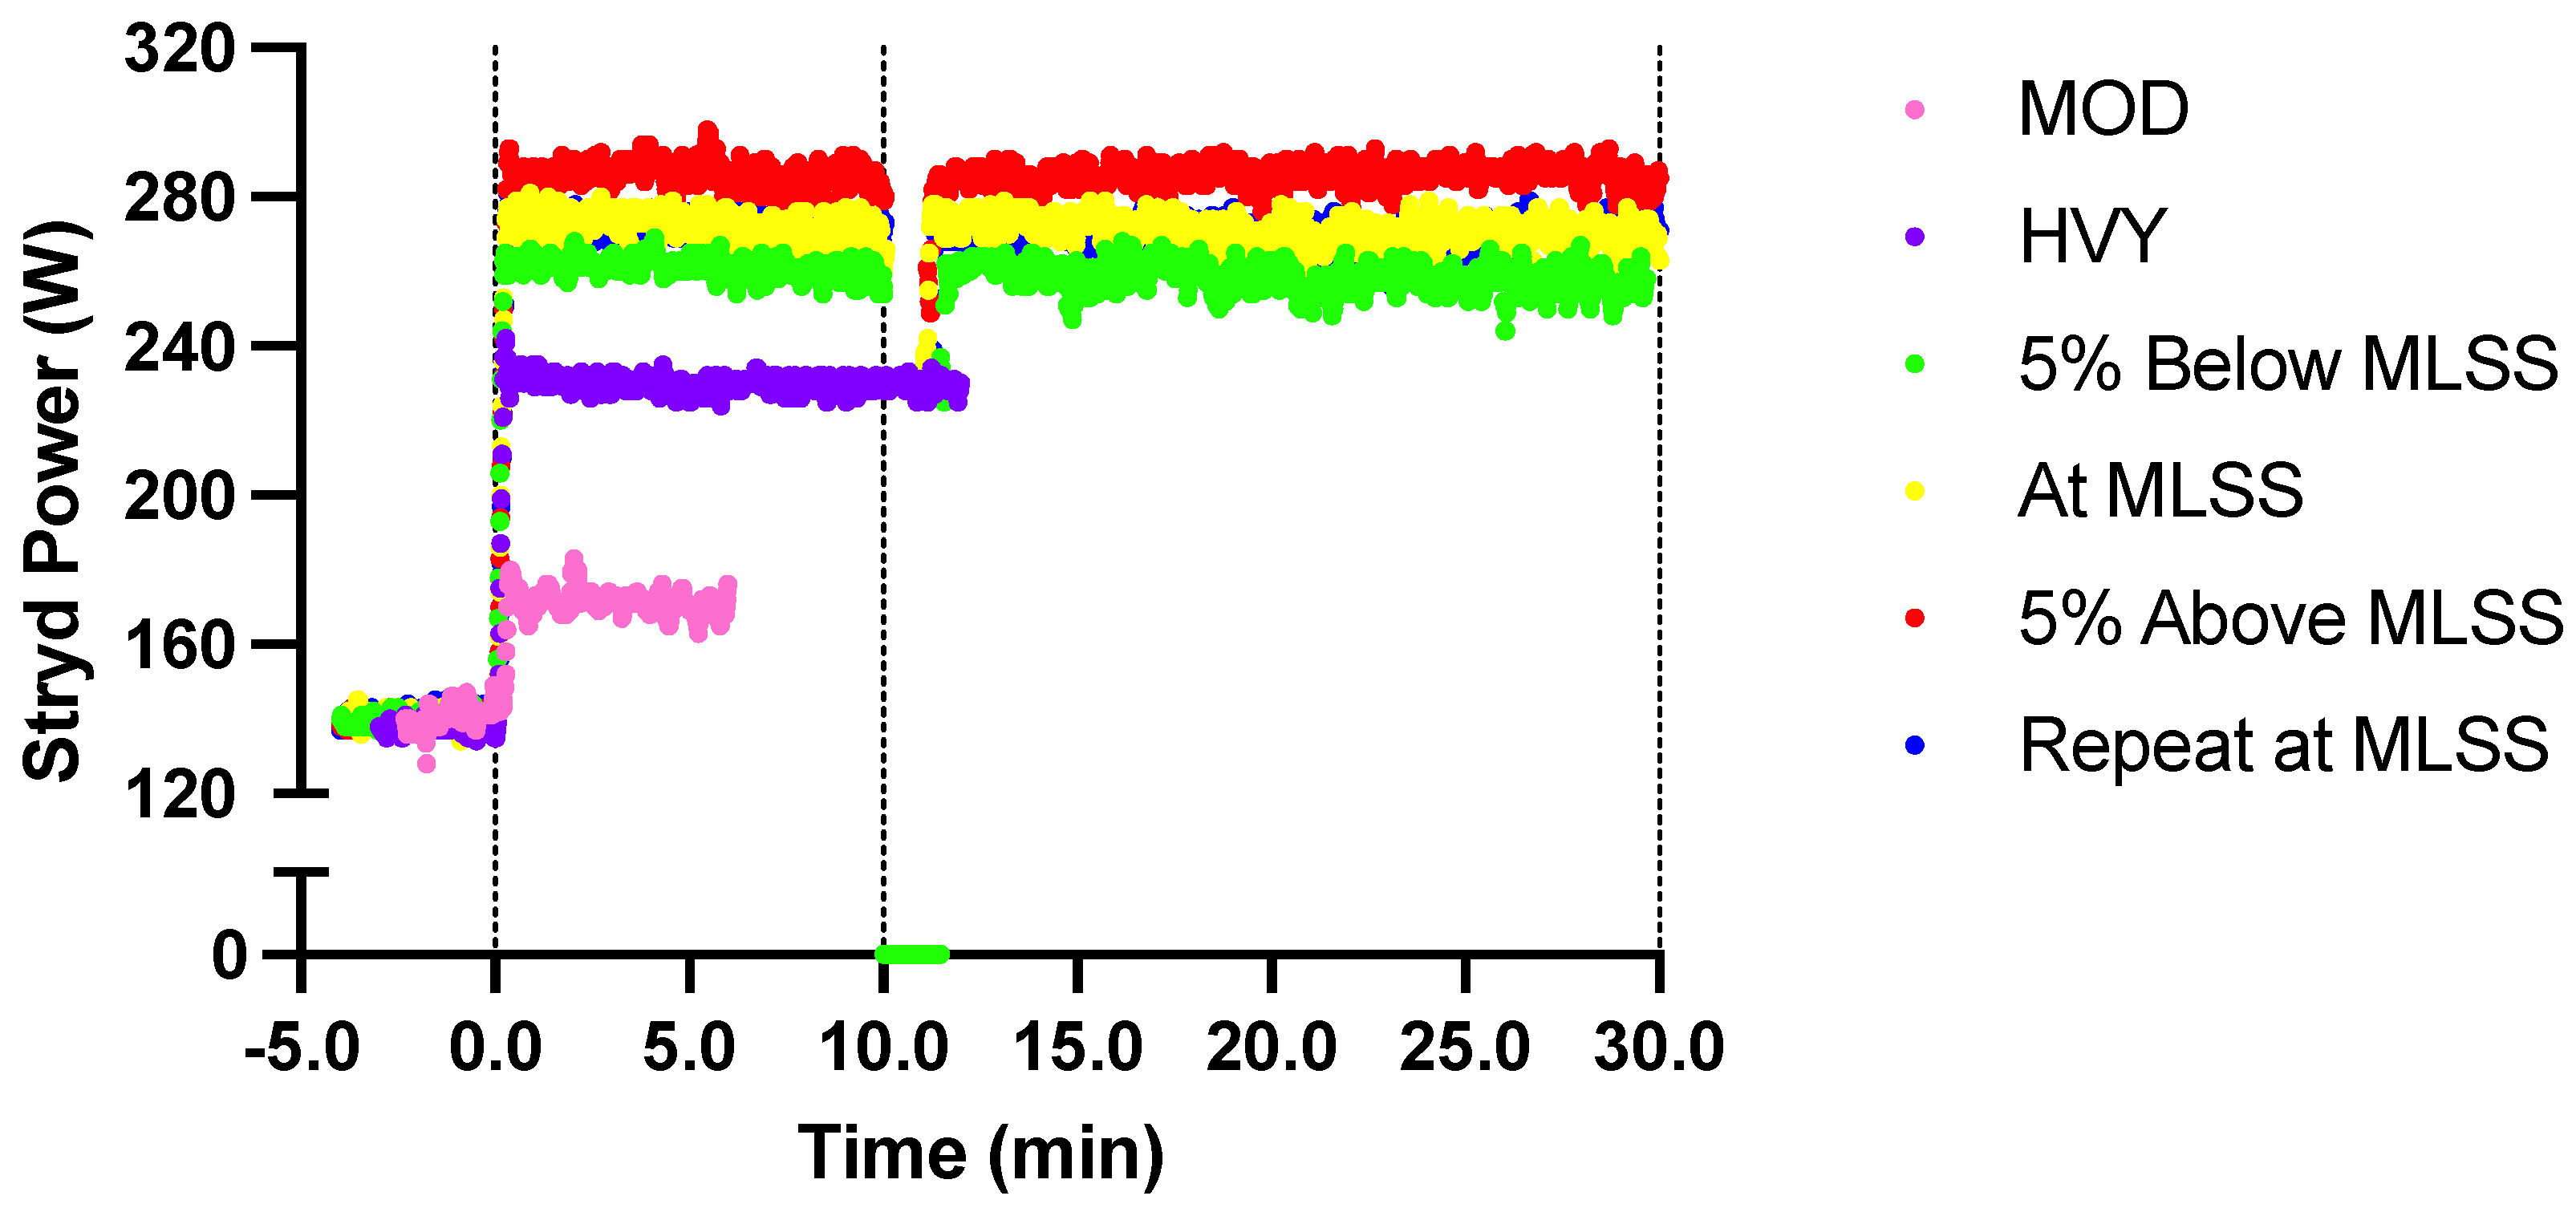
Running power measurements were made using the Stryd Summit Running Pod (Stryd, Boulder, CO, USA). The Stryd pod, which is a lightweight (8.0 g) and unobtrusive (4.0 cm in length) wearable sensor (Model v.19, firmware v.2.1.16, software v.4), was affixed to the runner’s left shoe, approximately equidistant between the runner’s malleoli and the shoe’s toe. A unique Stryd user profile was created for each runner that included their respective height and body mass, which was kept constant for all testing sessions. The iPhone Stryd application (Apple Inc., Cupertino, CA, USA) was used to pair the Stryd device and collect the Stryd running power data during the testing sessions. Running power data were sampled at 1 Hz (see Figure 1).
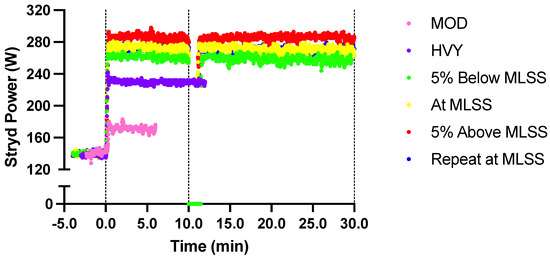
Figure 1.
Example of the running power signal during constant-speed treadmill running at different intensities for one participant. Data are shown for the moderate (MOD; 6 min) and heavy (HVY; 12 min) intensity steps, and during 30 min of running at 5% below the maximal lactate steady state (MLSS), at the MLSS, 5% above the MLSS, and during a repeat trial at the MLSS, preceded by running power data recorded for 3–4 min at a running speed of 1.9 m·s−1. Running power data were not collected during the first ~1–2 min of each exercise protocol (i.e., warm-up) to allow for synchronization with other measurements. Note that the repeat MLSS trial is obscured by the first MLSS trial.
2.5. Data Analysis
2.5.1. Cardiorespiratory, Running Speed, and Stryd Running Power Data
The average O2 and running power, measured between minutes 4 and 6 of the MOD step and between minutes 10 and 12 of the HVY step, were calculated from the SRS test. Maximal aerobic speed (MAS) and maximal aerobic power (MAP) were determined as the running speed associated with the highest completed 1-min stage during the incremental test and the average running power during that stage, respectively.
Cardiorespiratory and running power data used for analysis from the constant-speed MLSS-determination running trials included the 10- and 30-min O2, CO2, RER, E, HR, and running power measures for running trials 5% below, at, and 5% above MLSS. To align with the timing of [BLa] measurement (i.e., a short pause in running), mean values for O2, CO2, RER, E, HR, and Stryd running power were calculated from the 2 min of data collected prior to the 10-min and the 30-min (or at task failure if <30 min) time points. Although the MLSS is thought to represent the highest intensity at which energy provision is supplied exclusively via oxidative metabolism [27], data collected at 5% above the MLSS were included in the analysis due to the similarly stable O2 measurements between the 10- and 30-min values across the three intensities (i.e., differences between 10- and 30-min O2 measures were ~50 mL·min−1 at intensities of 5% below, at, and 5% above the MLSS)—with similar findings previously being reported [28]—and to provide a more comprehensive dataset for the analyses.
2.5.2. Incremental and Constant-Speed O2–Power and Speed–Power Gains
A least-squares linear regression was performed to calculate the O2–power gain (i.e., the slope of the regression equation) for each participant during both incremental and constant-speed exercise trials, measured separately. This method allowed for the calculation of a O2–power gain mean and standard deviation in which comparisons could be made between the incremental and constant-speed running tests and to contrast the measurements with cycling data [29]. The “incremental O2–power gain” for each runner was calculated as the slope ((mL·min−1)·W−1) of a least-squares linear regression line through the incremental exercise O2–power response, from the onset of a systemic rise in O2 until test termination or the onset of a plateau, if detected. The “constant-speed O2–power gain” for each runner was calculated as the slope ((mL·min−1)·W−1) of a least-squares linear regression line for the steady-state O2 and power data from five constant-speed intensities: the MOD and HVY steps from the SRS-protocol and the constant-speed exercise trials 5% below, at, and 5% above the MLSS. Replacing O2 with running speed, these same procedures were used to calculate the “incremental speed–power gain” and the “constant-speed speed–power gain” for each participant.
2.5.3. Metabolic Power, Mechanical Power, and Mechanical Efficiency
Running metabolic power, mechanical power, and mechanical efficiency measurements were calculated during constant-speed running trials at MOD, HVY, 5% below, at, and 5% above MLSS. Metabolic power was calculated as a gross energy cost per unit of body mass and distance travelled (kJ·kg−1·km−1) using O2 and RER [30]. This calculation of metabolic power was used to represent the energy cost of running (i.e., RE) at each respective intensity, providing a reference measure of RE in which all subsequent comparisons were made. Metabolic power (i.e., StrydMET) was also calculated by expressing the energy cost—using O2 and RER [30]—per unit of absolute Stryd power ((J·s−1)·W−1) and per unit of relative Stryd power ((kJ·s−1)·(W·kg−1)−1). StrydMET was calculated in isolation from running speed to provide a metric that characterized the metabolic power requirements per unit of Stryd running power. The units used to describe StrydMET were not simplified in order to distinguish among related terms and to provide units that clearly described the energy cost of running per unit of absolute and relative Stryd running power. Mechanical power (i.e., StrydMECH) was calculated in isolation from the O2 and RER by expressing Stryd running power (W) in units of J·s−1 and by converting mechanical power to an absolute energy cost per unit of the distance travelled (kJ·km−1) and a relative energy cost per unit of distance (kJ·kg−1·km−1). Mechanical efficiency (EFF) was calculated as the ratio between StrydMECH (kJ·kg−1·km−1) and metabolic power (kJ·kg−1·km−1), expressed as a percentage.
2.6. Statistical Analysis
2.6.1. General
Statistical analyses were performed using the Statistical Package for the Social Sciences (SPSS, version 26, IBM, Armonk, NY, USA). Linear mixed-effects models were performed using the nlme package (version 3.1-157) in RStudio (version 4.2.0) (R Core Team (2018)). Data visualization was performed using Prism (version 9.5.1 for macOS; GraphPad Software, San Diego, CA, USA). Data are presented as mean [standard deviation (SD)]. Statistical significance was set at an α level of <0.05. Where appropriate, Bonferroni post hoc tests were used. Test-retest reliability was measured using two-way mixed effects, absolute agreement, and single-rater intraclass correlation models wherein reliability was interpreted as poor (ICC < 0.5), moderate (0.5 ≤ ICC < 0.75), good (0.75 ≤ ICC < 0.9), or excellent (ICC ≥ 0.9) [31].
2.6.2. Stability, Sensitivity, and Reliability
Multiple two-way repeated-measure ANOVAs were used to assess stability (the main effect of duration) and sensitivity (the main effect of intensity) of Stryd running power and the physiological and perceptual responses (i.e., O2, CO2, RER, E, HR, [BLa], and RPE) at 10 min and 30 min (or task failure, if <30 min) during constant-speed treadmill running at 5% below, at, and 5% above the MLSS. For the same variables, the two MLSS trials were compared using paired Student’s t tests, intraclass correlations, and Bland–Altman analyses (with 95% limits of agreement) to assess reliability at the 30-min timepoint. Stryd running power stability was further assessed by evaluating the linear association and agreement between the 10- and 30-min running power data for the first MLSS trial using a Pearson’s correlation coefficient and Bland–Altman analysis, respectively.
2.6.3. Stryd Running Power—Association with O2 and Running Speed
Paired Student’s t tests were used to compare the mean O2–power gains and O2–speed gains between incremental and constant-speed exercise trials. To determine the association between Stryd running power and training intensity, linear mixed-effects models were used to assess the within-individual and between-individual association between running power and O2 measurements, and between running power and running speed during the MOD, HVY, MLSS −5%, MLSS, and MLSS +5% running trials. Models included fixed-effects models of absolute running power and relative running power while allowing intercepts as random effects for the participants to account for repeated measurements within individuals [32]. Models were estimated using maximum likelihood, model selection was assessed using a chi-squared likelihood ratio test, and model fit was assessed using pseudo-R2 [32]. These analyses were performed for absolute (i.e., W) and relative measures of power (i.e., W·kg−1). The spread of the participants’ intercepts was compared using the O2 and absolute power and the O2 and relative power relationships and using the speed and absolute power and speed and relative power relationships, employing the Pitman–Morgan test for the homogeneity of variance of paired samples.
2.6.4. Stryd Running Power—Running Economy and Efficiency
To determine whether Stryd running power provides an indication of RE during constant-speed treadmill running trials at MLSS, Pearson’s correlation coefficients were calculated between metabolic power (kJ·kg−1·km−1) and each of the following variables: absolute StrydMECH (kJ·km−1), relative StrydMECH (kJ·kg−1·km−1), absolute StrydMET ((J·s−1)·W−1), and relative StrydMET ((kJ·s−1)·(W·kg−1)−1). One-way repeated-measures ANOVAs were used to assess the main effect of running intensity on metabolic power, StrydMECH, and StrydMET measurements. Using the 30-min timepoint mean (i.e., 28–30 min) data from the two MLSS trials, the reliability of metabolic power, StrydMECH, and StrydMET were assessed by paired Student’s t tests, intraclass correlations, and Bland–Altman analyses (with 95% limits of agreement). One-way repeated-measures ANOVAs were also used to determine whether running intensity affected Stryd-derived assessments of EFF.
2.6.5. Stryd Running Power—Aerobic Fitness
To determine whether Stryd running power provides an indication of an athlete’s aerobic fitness during constant-speed treadmill running, Pearson’s correlation coefficients were calculated for the following pairs of variables: O2 at MLSS and running power at MLSS, and O2 at MLSS and running speed at MLSS.
3. Results
3.1. Participants
Table 1 displays the female and male participant characteristics, incremental exercise testing results, and MLSS testing results. All incremental tests were maximal, and the duration of the incremental test portion of the SRS protocol was 12.1 [2.0] min. The measured O2 during constant-speed running at MOD and HVY was 91.2 [8.0]% and 92.9 [5.6]% of the O2 at GET and RCP, respectively. All runners completed at least 30 min of treadmill running at 5% below the MLSS, at the MLSS, and during the repeat trial at the MLSS; however, seven runners were unable to complete 30 min of running at 5% above the MLSS.

Table 1.
Participant characteristics, maximal exercise results, and maximal lactate steady-state (MLSS) results.
3.2. Stability, Sensitivity, and Reliability of Stryd Running Power
The 10- and 30-min running power measurements taken during constant-speed running trials near the MLSS are presented in Figure 2. While the intensity × duration interaction and the main effect of duration were not statistically significant for running power, there was a significant main effect for running intensity, with significant differences between all pairs of intensities (p < 0.001 for all post hoc comparisons; Table 2).
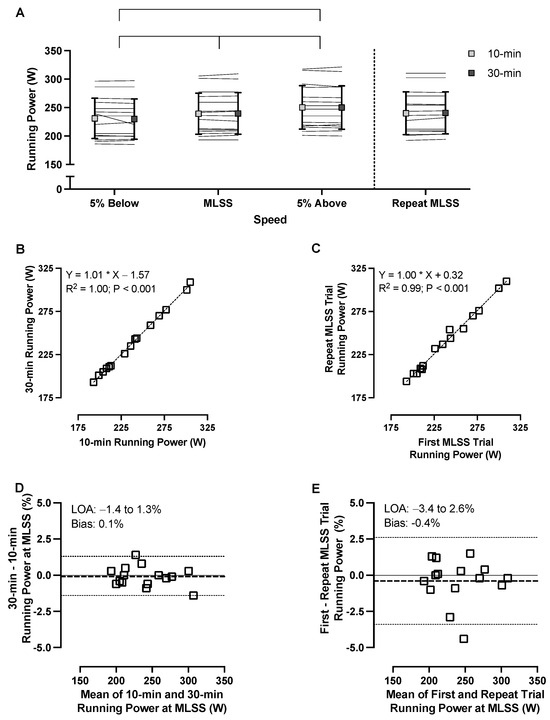
Figure 2.
Running power data near the maximal lactate steady state (MLSS). Panel (A) shows the comparison between the 10-min and 30-min mean running power measurements during treadmill running near the MLSS. Lines representing individual participants, asterisks (*) indicate statistically significant differences between speeds, and error bars represent one standard deviation. Panel (B) shows the relationship between 10 min and 30 min of running power from the first run at the MLSS, and Panel (C) shows the relationship between 30 min of running power from the two separate runs at the MLSS. Panels (D,E) show Bland–Altman plots corresponding to the data in Panels B and C, respectively. In Panels (B–E), squares represent individual data, solid lines represent y=0, dashed lines represent bias, and dotted lines represent 95% limits of agreement. n = 15 for all panels.
Table 2.
O2 and running power responses to exercise near the maximal lactate steady state (MLSS).
The 10- and 30-min running power measurements during the repeat constant-speed running trial at MLSS are reported in Table 3. There was excellent reliability and low bias between the running power measured at two time points within one run at the MLSS and across two runs at the MLSS, without differences between repeated trials at the MLSS (Figure 2; Table 3).
Table 3.
Reliability of O2 and running power responses and metabolic and mechanical power measurements to exercise at the maximal lactate steady state (MLSS).
Table 4.
Mean metabolic and mechanical power measures during the moderate-intensity step (MOD) and during constant-speed running 5% below, at, and 5% above the maximal lactate steady state (MLSS).
3.3. Physiological and Perceptual Responses
The duration × intensity interaction was not significant for O2; however, there was a main effect of intensity, with significant differences across the three running speeds and a main effect of duration, demonstrating 30-min values greater than the 10-min values (p < 0.05 for all post hoc comparisons; Table 2). The O2 values measured at two time points within one run at the MLSS had excellent reliability and low bias across two runs at the MLSS, without differences between repeated trials at the MLSS (Table 3).
Descriptive data and statistical results for CO2, RER, E, HR, [BLa], and RPE measured at two time points (10-min and 30-min) for three speeds near the MLSS are reported in the Supplementary Materials (Table S1).
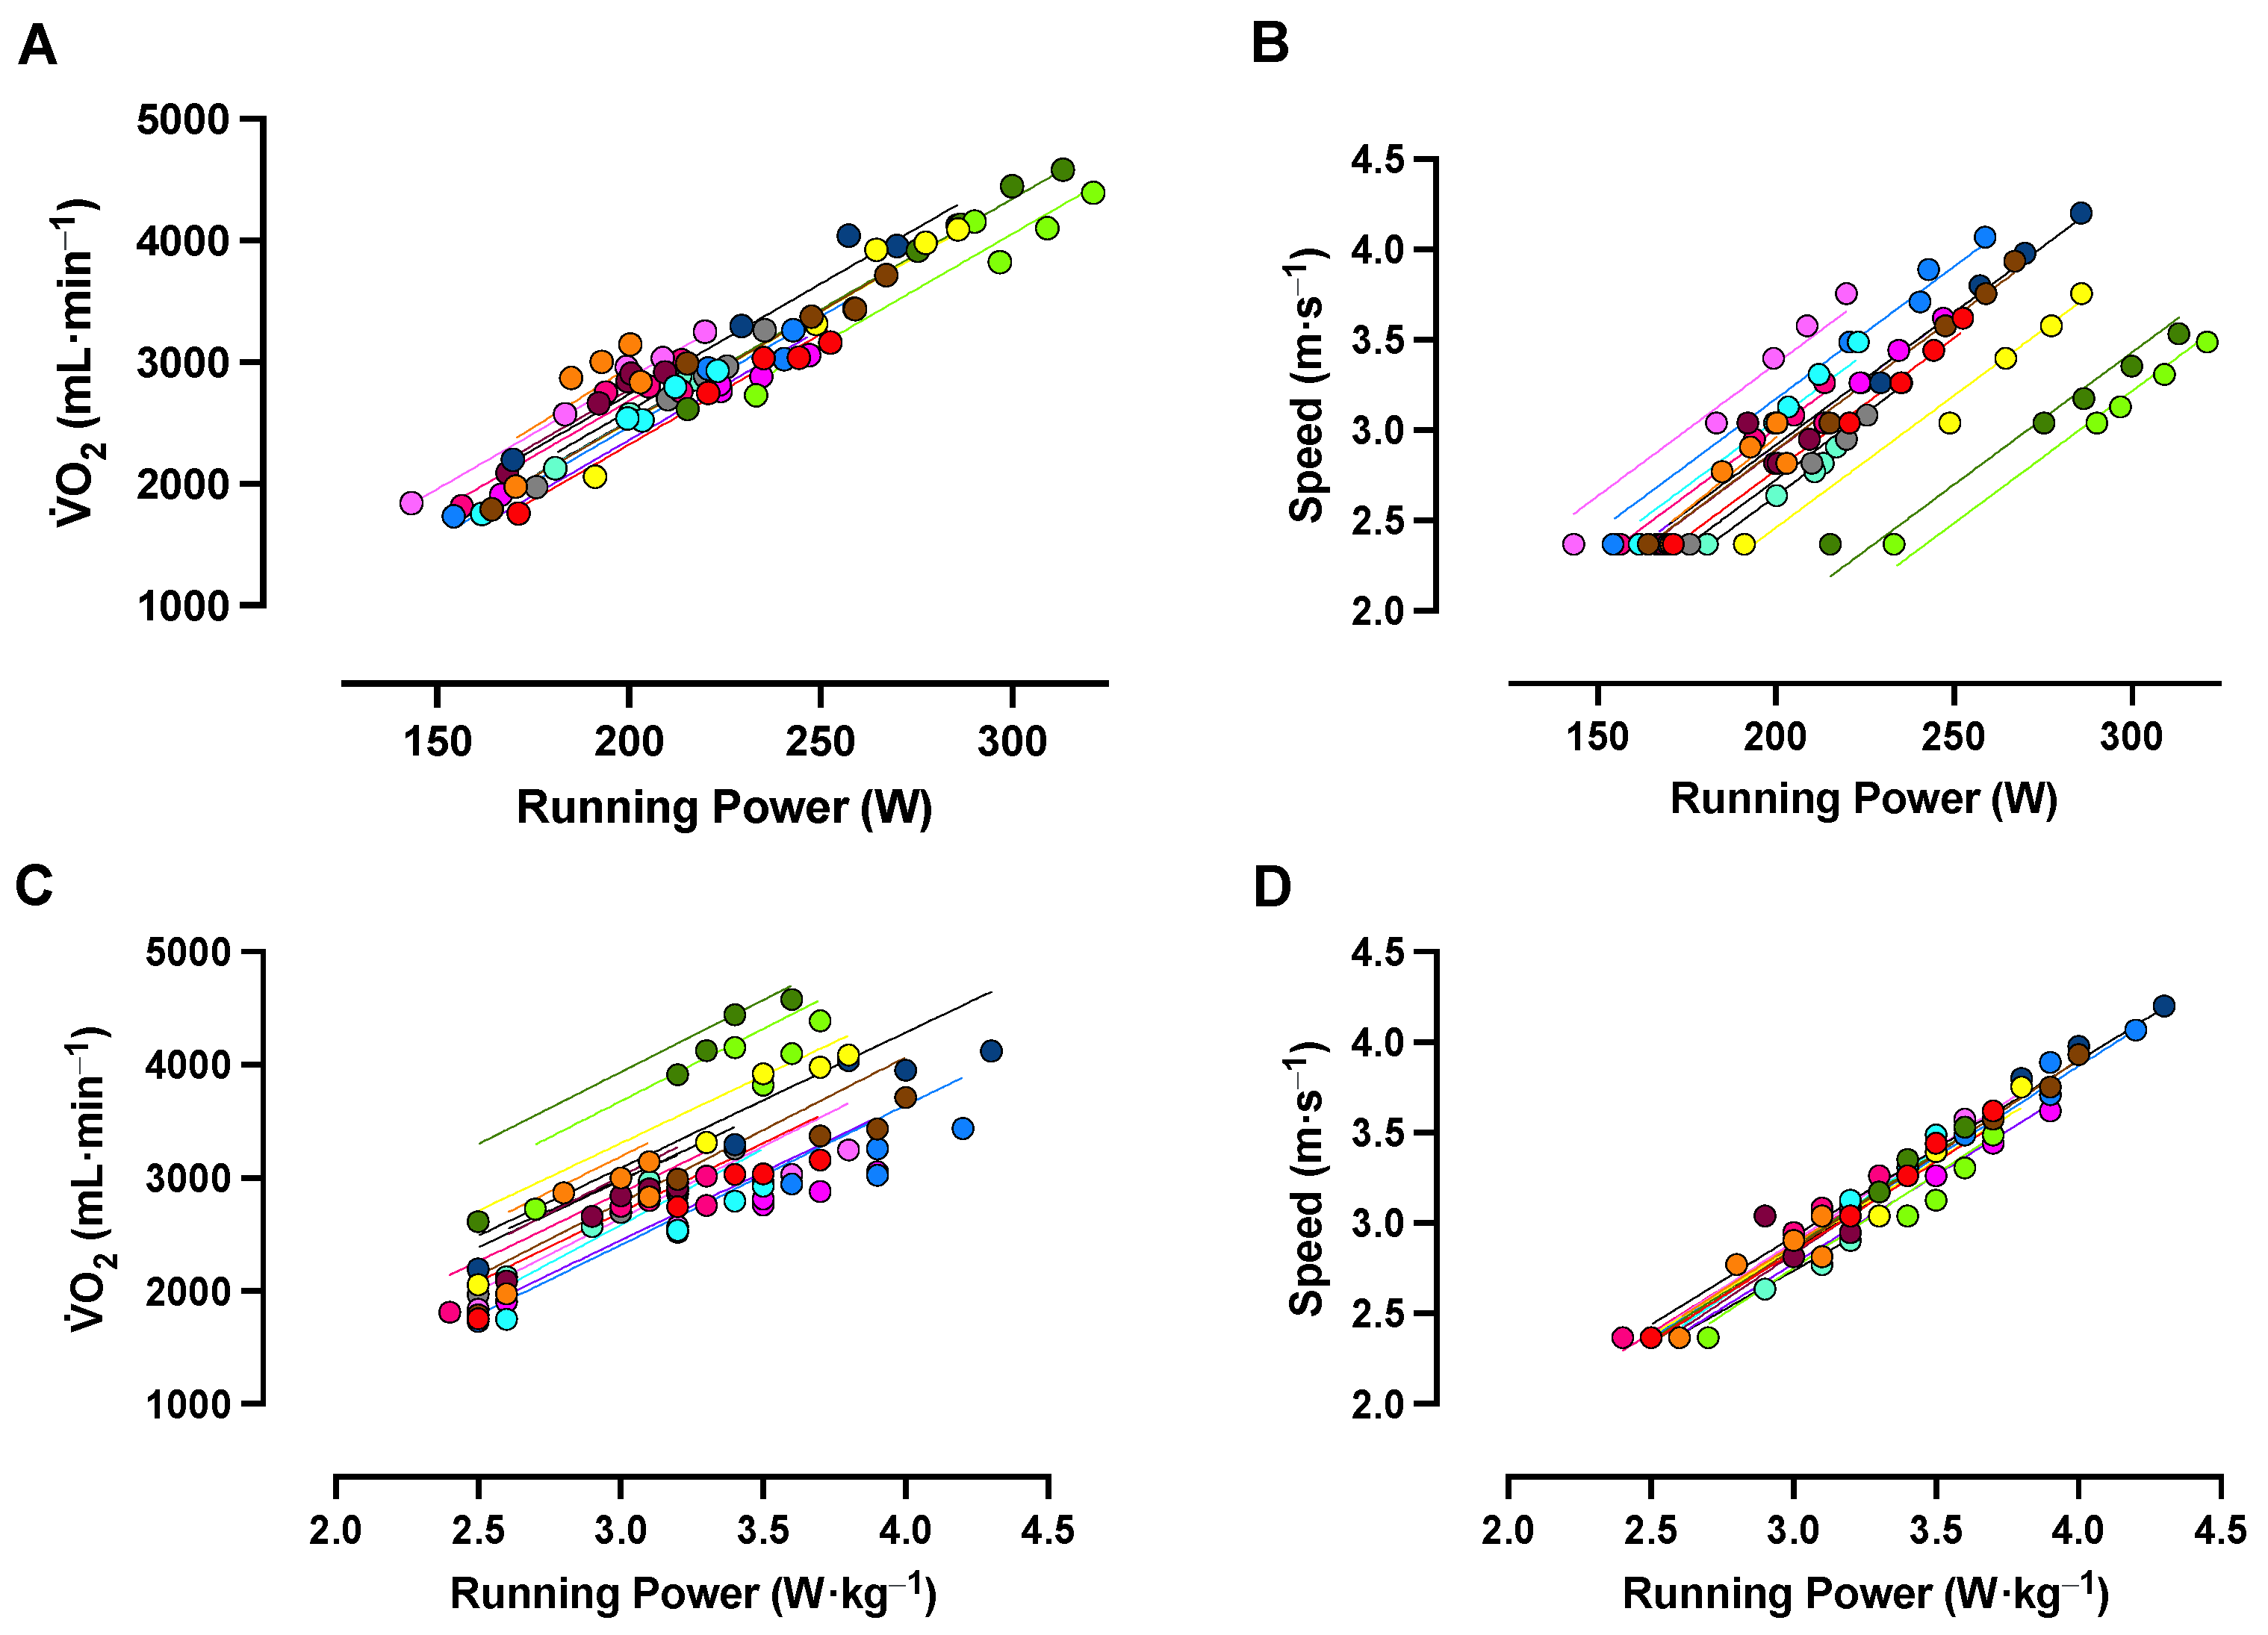
3.4. Stryd Running Power—Association with O2 and Running Speed
The incremental and constant-speed O2–power gains and speed–power gains are reported in Table 5. From the constant-speed running trials, the linear mixed-effects models revealed a strong, positive relationship between absolute running power and O2 and between relative power and O2 (Table 6; Figure 3). There was significant variance between participant intercepts for both models that differed between models (Table 6; Figure 3), providing evidence that the relationship between absolute power and O2 was stronger and less variable between the participants than the relationship between relative power and O2.
Table 5.
The O2–power gain and speed–power gain calculated from the incremental exercise test and constant-speed running trials.
Table 6.
The within-individual and between-individual association between running power and O2 measurements and between running power and running speed during the MOD, HVY, maximal lactate steady state (MLSS) −5%, MLSS, and MLSS +5% running trials.
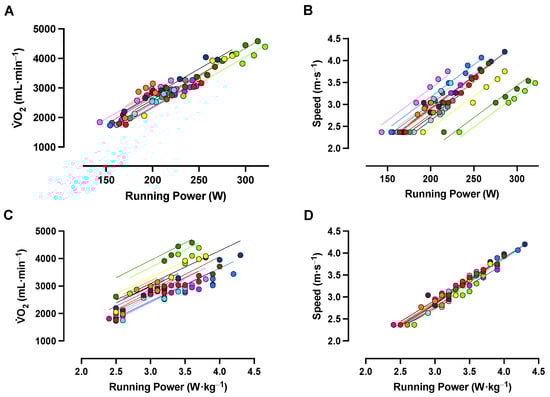
Figure 3.
Relationships between absolute and relative running power, running speed, and oxygen uptake (O2). Panels (A,B) show the relationships between absolute running power and O2 and between absolute running power and running speed for each participant during the moderate (MOD) and heavy (HVY) intensity steps and constant-speed trials near the maximal lactate steady state (MLSS). Panels (C,D) show the relationships between relative running power and O2 and between relative running power and running speed for each participant at each running intensity, respectively. Each color represents a single participant’s set of trials. N = 15 for all panels.
3.5. Stryd Running Power—Association with Running Economy
Based on the constant-speed running trials at MOD and near the MLSS, there were significant effects of intensity on metabolic power, StrydMECH, and StrydMET measurements (Table 6). The metabolic power and StrydMET measurements were significantly lower at MOD compared to measurements 5% below, at, and 5% above the MLSS (p < 0.001 for all pairwise comparisons; Table 6). In contrast, the StrydMECH measurements were significantly higher at MOD compared to the three higher intensities (p < 0.001 for all comparisons; Table 6). All variables had excellent reliability for the repeated trials at the MLSS, without significant differences between trials at the MLSS (Table 3).
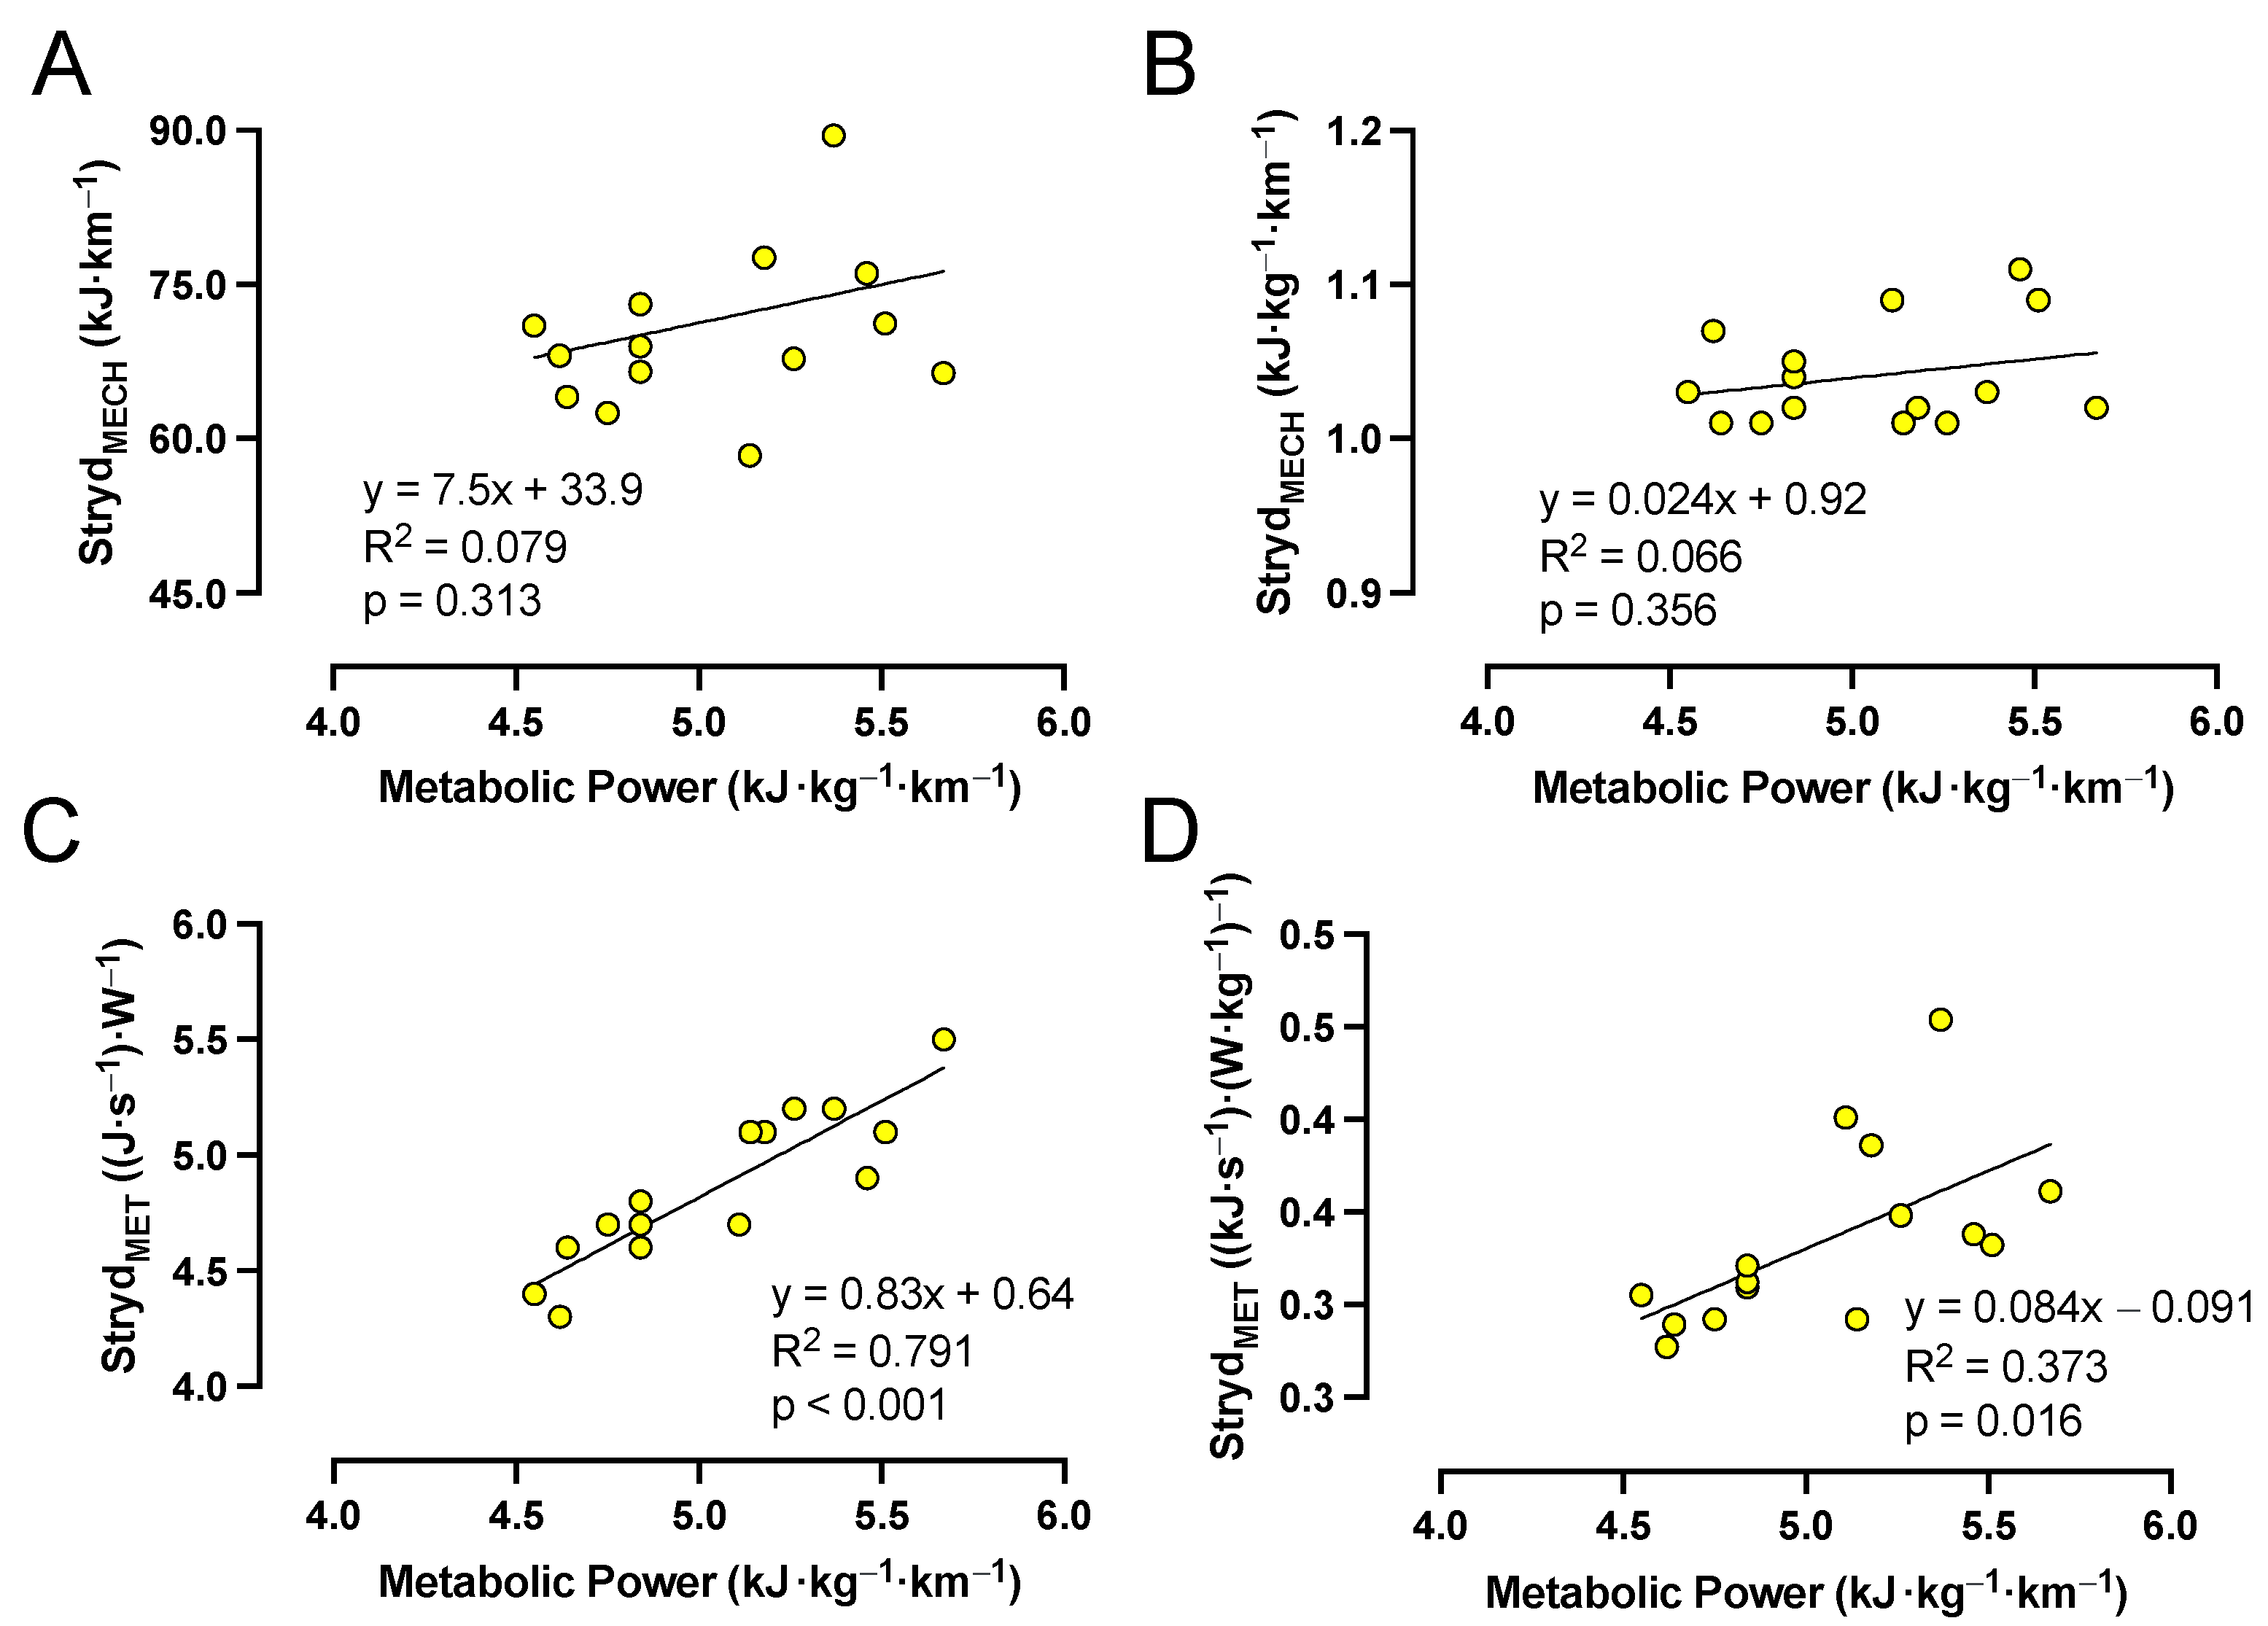
Figure 4 depicts the relationships between metabolic power (kJ·kg−1·km−1) and absolute StrydMECH (kJ·km−1), relative StrydMECH (kJ·kg−1·km−1), absolute StrydMET ((J·s−1)·W−1), and relative StrydMET ((kJ·s−1)·(W·kg−1)−1) at the MLSS. Metabolic power (kJ·kg−1·km−1) was not significantly correlated with absolute StrydMECH (kJ·km−1) or relative StrydMECH (kJ·kg−1·km−1); however, strong positive and moderately positive correlations were detected between metabolic power (kJ·kg−1·km−1) and absolute StrydMET (J·s−1)·W−1) and relative StrydMET ((kJ·s−1)·(W·kg−1)−1), respectively (Figure 4). The results for other intensities were similar.
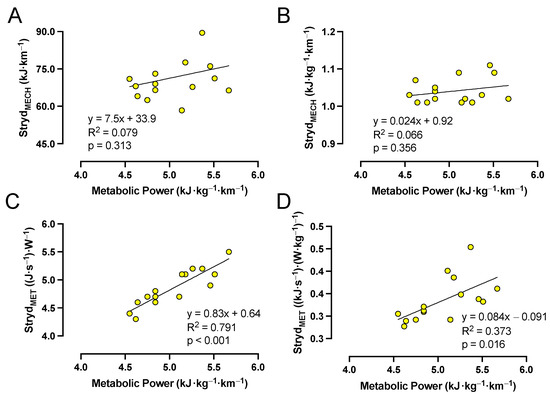
Figure 4.
Relationships between metabolic power and absolute StrydMECH (A), relative StrydMECH (B), absolute StrydMET (C), and relative StrydMET (D) during constant-speed running trials performed at the maximal lactate steady state (MLSS). Circles represent individual data. n = 15 for all panels.
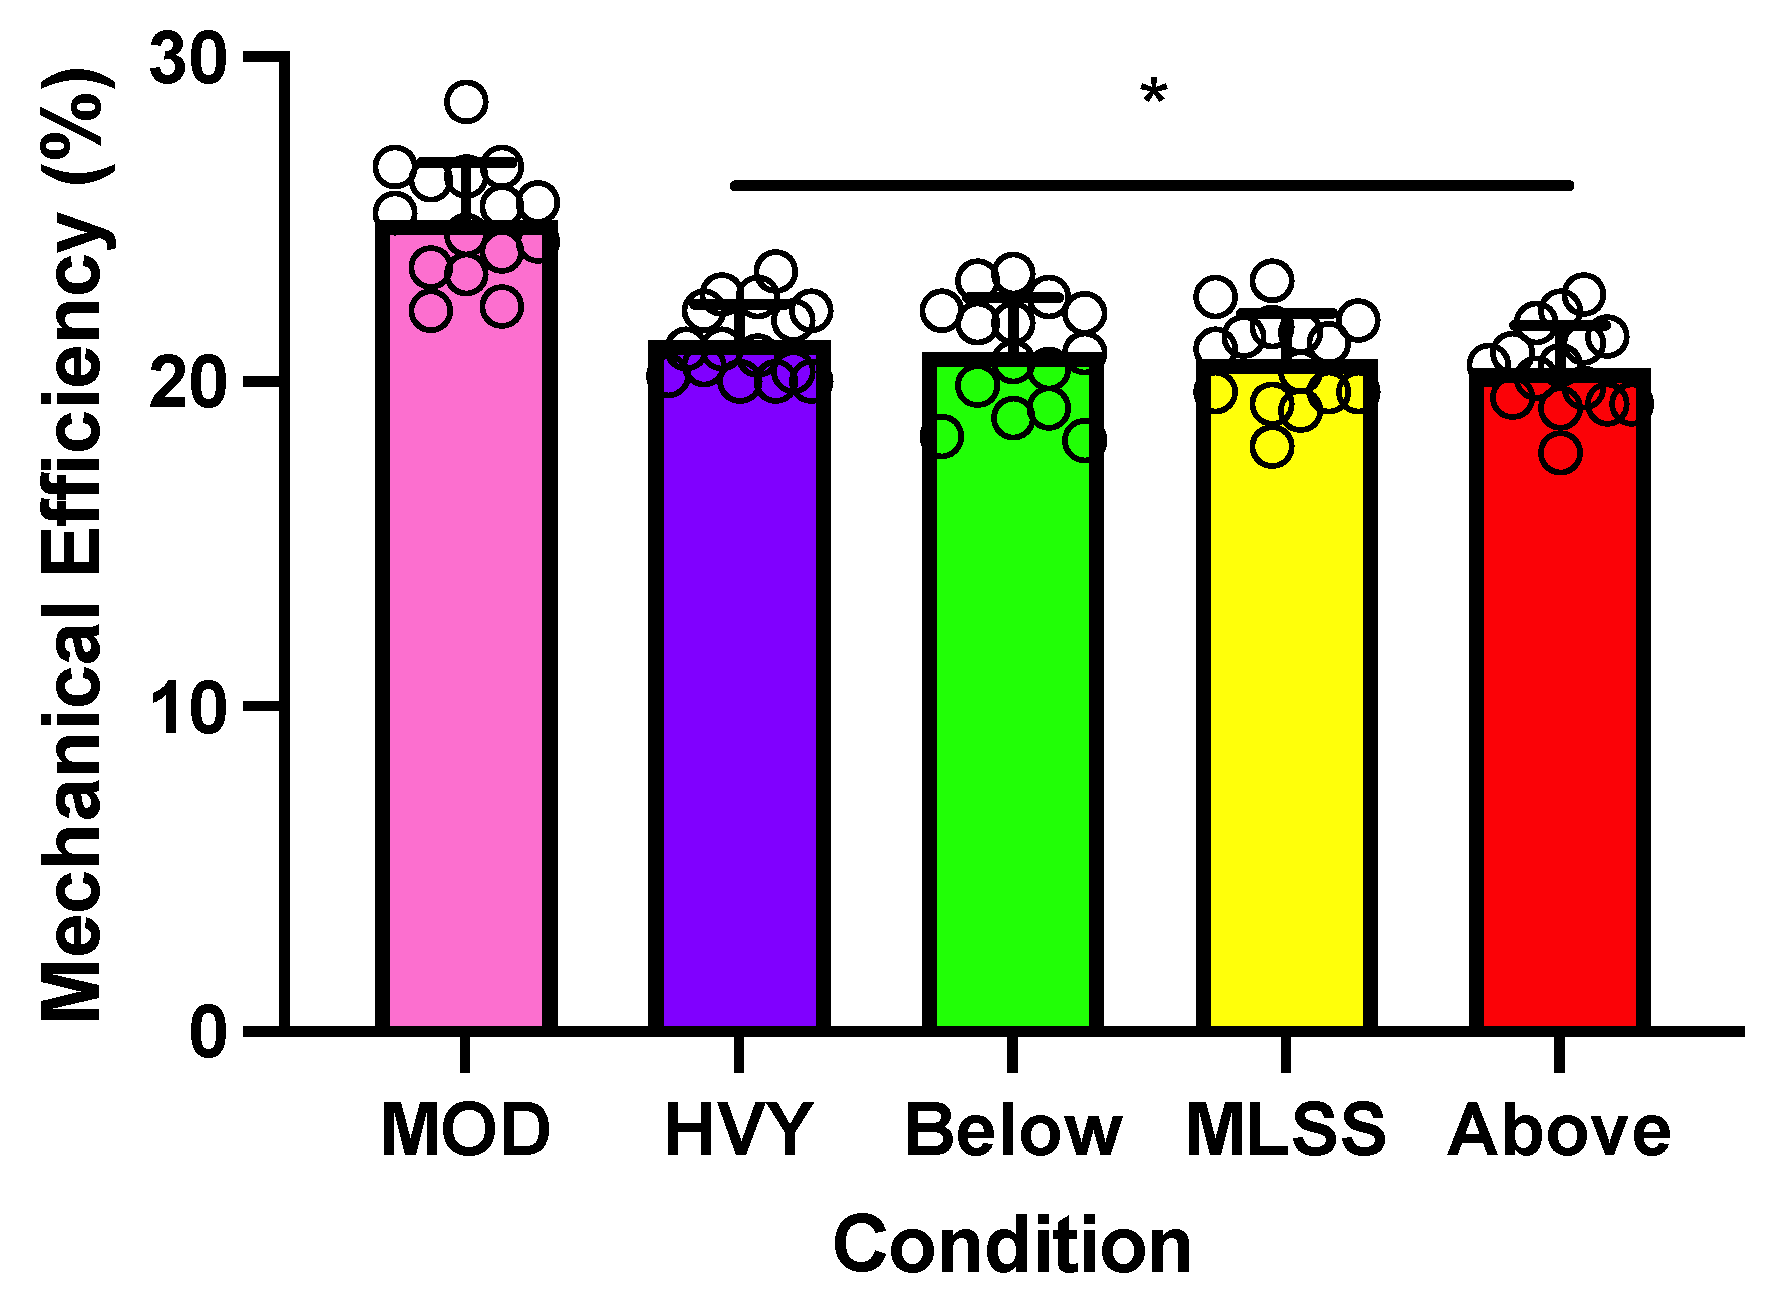
3.6. Stryd Running Power—Estimates of Mechanical Running Efficiency
There was a statistically significant main effect of running speed for EFF (p < 0.001; Figure 5). Pairwise comparisons revealed that EFF was significantly higher at MOD (25.0 [1.8]%) compared to HVY (21.3 [1.2]%), 5% below MLSS (20.9 [1.7]%), MLSS (20.7 [1.4]%), and 5% above MLSS (20.4 [1.4]%) (p < 0.001 for these pairwise comparisons). No other significant differences were detected between the EFF measurements.

Figure 5.
Average running mechanical efficiency (EFF) measurements during the moderate- (MOD) and heavy-intensity (HVY) steps, and during constant-speed trials near the maximal lactate steady state (MLSS). The asterisks (*) indicate statistically significant differences between intensities. Error bars represent one standard deviation. Circles represent individual data. n = 15.
3.7. Stryd Running Power—Association with Aerobic Fitness
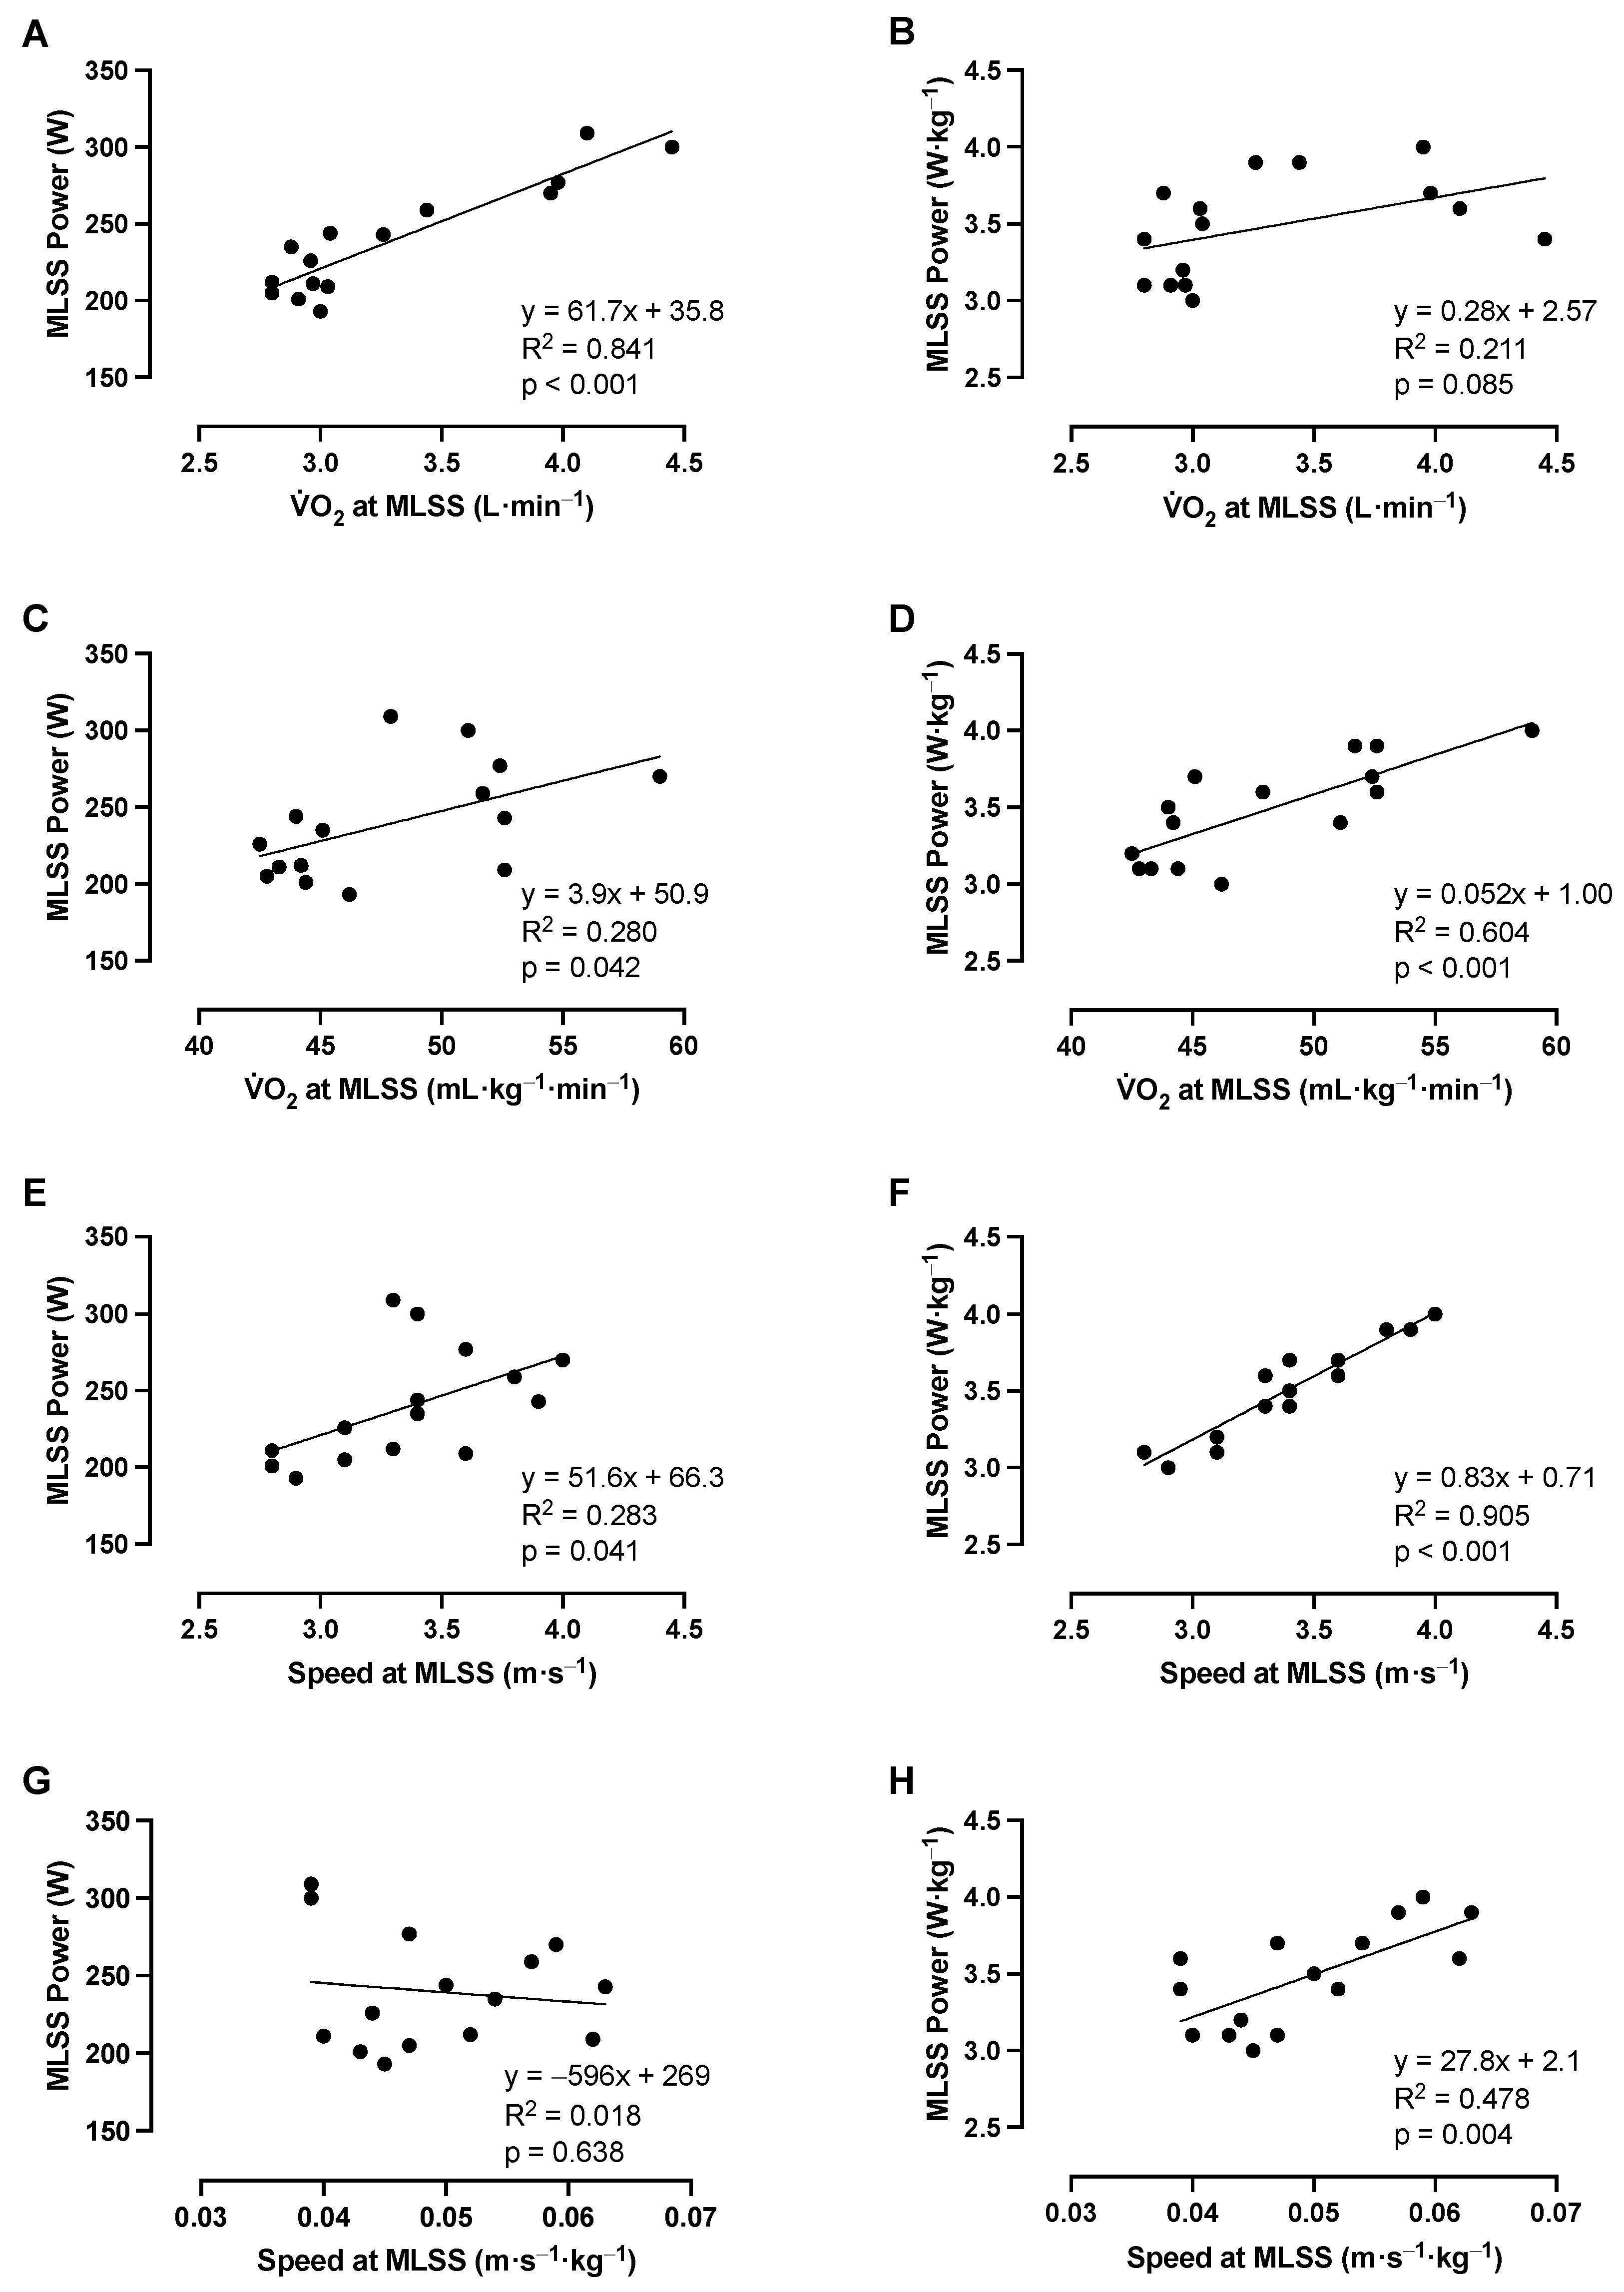
Absolute running power at the MLSS was strongly correlated with absolute O2 at the MLSS, moderately correlated with relative O2 and absolute running speed at the MLSS, and not correlated with relative running speed at the MLSS (Table 1; Figure 6). Relative running power at the MLSS was not correlated with absolute O2 at the MLSS, but it was strongly correlated with relative O2 and absolute running speed at the MLSS and moderately correlated with relative running speed at the MLSS (Table 1; Figure 6).

Figure 6.
Relationships between absolute and relative running power, running speed, and oxygen uptake (O2) at the maximal lactate steady state (MLSS). Panels (A–D) show the relationship between O2 at the MLSS and running power at the MLSS in absolute and relative units. Panels (E–H) show the relationship between running speed at the MLSS and running power at the MLSS in absolute and relative units. Individual data are plotted, along with the regression lines. n = 15 for all panels.
4. Discussion
The results from this investigation support the use of Stryd in research and applied settings. The Stryd running power metric was stable during 30-min constant-speed running trials, repeatable across trials at the MLSS, and sensitive enough to differentiate between trials performed at running speeds of 5% below, at, and 5% above the MLSS threshold. Running power was strongly correlated with running speed and O2 during constant-speed exercise relative to the GET and MLSS, supporting its use as a training intensity metric. Furthermore, running power measurements at the MLSS were strongly associated with both the O2 and running speed at the MLSS. Although metabolic power was strongly associated with absolute StrydMET, it appears that Stryd power cannot provide an indication of RE in isolation from metabolic data, as the associations between metabolic power and StrydMECH were weak. Despite this finding, the mechanical running efficiency derived using Stryd (i.e., EFF) remained consistent and proportional at various exercise intensities near the MLSS threshold.
4.1. Stability, Sensitivity, and Reliability
Mean running power measurements were similar across the 10- and 30-min timepoints during constant-speed running trials at 5% below, at, and 5% above the MLSS. Along with a strong correlation, zero bias, and narrow LOA between time points, these findings indicate that the Stryd signal remained stable during constant-speed treadmill running. Running power across two runs at the MLSS was also strongly correlated, with a near-zero bias and narrow LOA, indicating the excellent day-to-day reliability of the metric. Furthermore, the Stryd power metric was able to distinguish between exercise intensities near the MLSS. In agreement with our results, previous investigations also reported that Stryd running power was stable during constant-speed running [33], repeatable [11], and sensitive between conditions [34]; however, our investigation is the first to evaluate these running power parameters near the MLSS, an important threshold for training programs and fitness assessment [35,36]. In support of the Stryd running power metric results, besides a significantly lower RPE measurement during the second compared to the first MLSS trial (i.e., 0.8 units on the Borg 6–20 scale), which may indicate increased comfort during testing, the O2 (Table 2) and other physiological and perceptual responses to running near the MLSS were also stable, sensitive, and reliable (Table S1).
4.2. Stryd Running Power and Exercise Intensity
The strong associations observed between running power, O2, and speed support the use of Stryd running power to guide exercise training relative to the exercise intensity domains. Of note, the relationship between Stryd running power and O2, considered at the group level, was stronger when running power was expressed in absolute units, whereas the relationship between Stryd running power and speed, at the group level, was stronger when running power was expressed in relative units. In practice, our results suggest that absolute Stryd power may be best used as a metric to approximate the rate of absolute oxygen consumption, while relative running power may be best used to indicate running speed—at least during treadmill running. Due to the varying methodological approaches used to establish O2–power relationships in previous research [11,17,18,37,38,39], it is difficult to make comparisons across studies.
A major strength of the current investigation is that exercise intensity domains were delineated and the O2 was subsequently evaluated during appropriate durations of constant-speed running before examining the relationship between O2 and running power. Exercise in the heavy-intensity domain can result in a slow O2 component that delays the attainment of a steady O2 measure by ~10–15 min or longer [40]. Thus, without appropriately delineating the exercise intensity domain, it is difficult to discern whether a given absolute work rate or stage duration will produce steady-state exercising conditions. The influence that intensity domain and O2 kinetic responses have on subsequent O2–power relationships can be highlighted by the substantial difference between the incremental (i.e., 11.6 [1.5] (mL·min−1)·W−1) and constant-speed O2–power gains (i.e., 19.8 [3.5] (mL·min−1)·W−1). Of interest, this O2–power gain from incremental treadmill running, measured using Stryd running power, is similar to previously observed O2–power gain measured during 15 W·min−1 incremental cycling protocols (i.e., 11.3 [1.2] (mL·min−1)·W−1) [29].
4.3. Stryd Running Power and Running Fitness
Runners with greater MLSS running powers displayed greater O2 and running speeds at the MLSS (Figure 6). As the O2 and running speed associated with the MLSS are strong predictors of running performance [41,42], at least in samples with broad aerobic fitness ranges, it appears that the Stryd running power metric can be used to indicate fitness in a similar manner to that used for cycling PO from constant-intensity exercise [43,44]; however, in contrast to cycling, where the cycling speed at any given PO is primarily dictated by surface area and aerodynamics [45], body mass has a more substantial influence on the relationship between Stryd running power and running speed. Thus, while absolute Stryd running power may be used to estimate fitness in terms of absolute O2 at the MLSS, in order to evaluate fitness from a speed perspective, it is best to interpret Stryd running power relative to body mass or to only interpret the speed–power relationship relative to the individual. Previous investigations have also reported strong associations between Stryd assessments of critical power (CP) and fitness metrics such as the RCP and O2max [38,46], providing further support for the utility of Stryd to quantify running fitness.
4.4. Stryd Running Power, Running Economy, and Mechanical Efficiency
Although strong associations were observed between absolute running power and O2 during constant-speed treadmill running conditions, there was a degree of variability between the measured O2 for a given absolute running power (Figure 3). A large proportion of this variance may be explained by the range of StrydMET requirements for a specific metabolic power between runners (Figure 4). Indeed, runners with greater absolute StrydMET measurements also exhibited greater metabolic power measures during each constant-speed running intensity test (i.e., MOD and near to the MLSS). Although this finding may suggest that Stryd can be used as an indication of RE, the strong relationship between running power and running speed likely explains this finding. Accordingly, when examining the relationship between metabolic power and StrydMECH (i.e., determining whether the Stryd running power metric can be used in isolation from energy expenditure to approximate the RE), there is no indication that StrydMECH is related to RE (i.e., metabolic power), suggesting that this approach cannot distinguish between more and less economical runners. Previous investigations have similarly concluded that Stryd running power metrics may be insufficient for detecting differences in RE between trained runners [46,47] or detecting worsened RE (i.e., increased O2 at a given running speed) after purposefully altering running biomechanics [37].
Our Stryd-derived measures of mechanical efficiency (~21–25%) are lower than previous estimates of “apparent” running mechanical efficiency during level running (e.g., ~50–70%) [6,7,39] but are similar to estimates of gross cycling efficiency (e.g., ~20–25%) [4]. Furthermore, in comparison with the up to ~20% difference in previously reported estimates of running efficiency measurements at various running speeds [6,7,39], the Stryd estimates of running mechanical efficiency for level running during MOD and heavy-intensity running were relatively small (i.e., ~4%). Consequently, our results indicate that Stryd-based measures of mechanical running efficiency remain relatively stable at various submaximal intensities and that the metabolic requirement per unit of Stryd running power and the metabolic requirement per unit of cycling PO are similar.
Despite certain limitations related to the accurate detection of changing RE [37,47] and the quantification of running mechanical PO [39], our data suggest that foot-worn running power metrics can still be used to monitor training and quantify running performance. Although these findings do question the ability of Stryd running power to accurately represent the running mechanical PO, we suggest that a wearable running power device need not evaluate running power in a manner that is true to the definition of mechanical PO to be useful. Indeed, as the relationship between metabolic demand and measurements of running mechanical PO may vary with running speed, incline, and surface [6,7,8], a running training tool that provides a consistent and seemingly equivalent evaluation of metabolic demand may be more useful than one that evaluates external work rate, particularly for such applied uses.
4.5. Experimental Considerations
Several limitations warrant discussion. Firstly, as all testing was performed on a treadmill with a fixed incline (1%), it remains unknown whether our findings can be extended to outdoor running conditions under variable running gradients, surfaces, or air resistances. With varying inclines, Stryd has shown evidence of repeatability [11] and strong correlations with O2 [11,18,39], but the influence of variable running gradients and surfaces on metabolic cost requires further investigation. Secondly, it remains unknown whether Stryd power can adjust for changes in air resistance, such as changes in wind speed. For example, changes in air resistance (e.g., wind, drafting, or drag) impact the cycling O2–speed relationship [45] without influencing the O2–PO relationship. As Stryd seemingly derives its estimate of running power by quantifying positive changes in vertical displacement and horizontal velocities, whether it can account for the increases in mechanical PO required to overcome greater air resistance is unclear [13]. Despite evidence that Stryd may detect changes in wind speed [48] and has introduced a metric, “Air power”, to adjust running power based on changes in air resistance from increasing or decreasing wind speeds and/or running speeds [49], it remains unknown whether the Stryd power metric–O2 relationship is linear in uncontrolled environments.
5. Conclusions
A wide variety of internal and external load-monitoring methods have been used in endurance sports, such as running speed and pace, RPE, [BLa], HR, step count, step frequency, and distance [50]; however, none of these variables provide a continuous, instantaneous, and reliable method to measure training intensity, and imprecise measurements of training stress may negatively affect performance and elevate injury risk. With evidence of stability, reliability, and sensitivity, our study suggests that Stryd’s foot-worn wearable device can be used to monitor training intensity and quantify aerobic fitness. While the impact of variable running gradients, surfaces, and air resistance on the Stryd running power metric still needs to be assessed, our results support the use of Styrd running power to delineate exercise intensity domains, guide training intensity, and assess aerobic fitness during level treadmill running.
Supplementary Materials
The following supporting information can be downloaded at: https://www.mdpi.com/article/10.3390/s23218729/s1, Table S1: Mean physiological and perceptual responses to exercise near the maximal lactate steady state (MLSS), and indices of reliability between two runs at the MLSS.
Author Contributions
Conceptualization: C.R.v.R. and M.J.M.; data curation: C.R.v.R. and M.J.M.; formal analysis: C.R.v.R., J.K.G. and M.J.M.; funding acquisition: M.J.M.; investigation: C.R.v.R., O.O.A. and K.M.S.; methodology: all authors; project administration: C.R.v.R. and M.J.M.; resources: M.J.M.; software: M.J.M.; supervision: M.J.M.; validation: C.R.v.R., O.O.A., K.M.S. and M.J.M.; visualization: C.R.v.R., J.K.G. and M.J.M.; writing—original draft: C.R.v.R. and M.J.M.; writing—reviewing and editing: all authors. All authors have read and agreed to the published version of the manuscript.
Funding
This work was supported by an operating grant from the Natural Sciences and Engineering Research Council of Canada (NSERC; grant number RGPIN-2018-06424) and start-up funding from the Faculty of Kinesiology (University of Calgary) received by M.J.M. C.V.R. was funded by NSERC, the NSERC CREATE Wearable Technology and Collaboration (We-TRAC) Training Program, an Alberta Innovates Graduate Student Scholarship for Data-Enabled Innovation, and an Alberta Graduate Excellence Scholarship. OOA was also funded by NSERC and the NSERC CREATE We-TRAC. The authors would like to acknowledge the contributions of all participants, students, faculty, and staff, who assisted and made this investigation possible.
Institutional Review Board Statement
The study was conducted in accordance with the Declaration of Helsinki, except for pre-registration of the trial, and was approved by the University of Calgary Conjoint Health Research Ethics Board (REB20-0111, approved 29 July 2020).
Informed Consent Statement
Informed consent was obtained from all participants involved in the study.
Data Availability Statement
Individual data are shown where possible; however, other data are available from the corresponding author upon reasonable request.
Conflicts of Interest
M.J.M. has received several foot pods from Stryd for research purposes; however, that equipment was not used in this study. Stryd had no involvement in the conduct, analysis, or reporting of this study, and M.J.M. has no professional relationship with Stryd. All authors declare no competing interests. The funders of this study (NSERC, University of Calgary) had no role in the design of the study; in the collection, analyses, or interpretation of data; in the writing of the manuscript; or in the decision to publish the results.
References
- Williams, K.R.; Cavanagh, P.R. A model for the calculation of mechanical power during distance running. J. Biomech. 1983, 16, 115–128. [Google Scholar] [CrossRef] [PubMed]
- Arampatzis, A.; Knicker, A.; Metzler, V.; Bruggemann, G.P. Mechanical power in running: A comparison of different approaches. J. Biomech. 2000, 33, 457–463. [Google Scholar] [CrossRef] [PubMed]
- Willems, P.A.; Cavagna, G.A.; Heglund, N.C. External, internal and total work in human locomotion. J. Exp. Biol. 1995, 198, 379–393. [Google Scholar] [CrossRef] [PubMed]
- Ettema, G.; Loras, H.W. Efficiency in cycling: A review. Eur. J. Appl. Physiol. 2009, 106, 1–14. [Google Scholar] [CrossRef]
- Keir, D.A.; Paterson, D.H.; Kowalchuk, J.M.; Murias, J.M. Using ramp-incremental O2 responses for constant-intensity exercise selection. Appl. Physiol. Nutr. Metab. 2018, 43, 882–892. [Google Scholar] [CrossRef]
- Rasica, L.; Porcelli, S.; Minetti, A.; Pavei, G. Biomechanical and metabolic aspects of backward (and forward) running on uphill gradients: Another clue towards an almost inelastic rebound. Eur. J. Appl. Physiol. 2020, 120, 2507–2515. [Google Scholar] [CrossRef]
- Monte, A.; Maganaris, C.; Baltzopoulos, V.; Zamparo, P. The influence of Achilles tendon mechanical behaviour on “apparent” efficiency during running at different speeds. Eur. J. Appl. Physiol. 2020, 120, 2495–2505. [Google Scholar] [CrossRef]
- Lejeune, T.M.; Willems, P.A.; Heglund, N.C. Mechanics and energetics of human locomotion on sand. J. Exp. Biol. 1998, 201, 2071–2080. [Google Scholar] [CrossRef]
- Jamnick, N.A.; By, S.; Pettitt, C.D.; Pettitt, R.W. Comparison of the YMCA and a custom submaximal exercise test for determining O2max. Med. Sci. Sports Exerc. 2016, 48, 254–259. [Google Scholar] [CrossRef]
- Passfield, L.; Hopker, J.G.; Jobson, S.; Friel, D.; Zabala, M. Knowledge is power: Issues of measuring training and performance in cycling. J. Sports Sci. 2017, 35, 1426–1434. [Google Scholar] [CrossRef]
- Cerezuela-Espejo, V.; Hernández-Belmonte, A.; Courel-Ibáñez, J.; Conesa-Ros, E.; Mora-Rodríguez, R.; Pallarés, J.G. Are we ready to measure running power? Repeatability and concurrent validity of five commercial technologies. Eur. J. Sport. Sci. 2021, 21, 341–350. [Google Scholar] [CrossRef]
- Jaen-Carrillo, D.; Roche-Seruendo, L.E.; Carton-Llorente, A.; Ramirez-Campillo, R.; Garcia-Pinillos, F. Mechanical power in endurance running: A scoping review on sensors for power output estimation during running. Sensors 2020, 20, 6482. [Google Scholar] [CrossRef] [PubMed]
- Stryd, T. How to Lead the Pack: Running Power Meters & Quality Data. 2022. Available online: https://blog.stryd.com/2017/12/07/how-to-lead-the-pack-running-power-meters-quality-data/ (accessed on 11 January 2022).
- García-Pinillos, F.; Roche-Seruendo, L.E.; Marcén-Cinca, N.; Marco-Contreras, L.A.; Latorre-Román, P.A. Absolute reliability and concurrent validity of the Stryd system for the assessment of running stride kinematics at different velocities. J. Strength. Cond. Res. 2021, 35, 78–84. [Google Scholar] [CrossRef] [PubMed]
- Navalta, J.W.; Montes, J.; Bodell, N.G.; Aguilar, C.D.; Radzak, K.; Manning, J.W.; DeBeliso, M. Reliability of trail walking and running tasks using the Stryd power meter. Int. J. Sports Med. 2019, 40, 498–502. [Google Scholar] [CrossRef] [PubMed]
- Cartón-Llorente, A.; Roche-Seruendo, L.E.; Mainer-Pardos, E.; Nobari, H.; Rubio-Peirotén, A.; Jaén-Carrillo, D.; García-Pinillos, F. Acute effects of a 60-min time trial on power-related parameters in trained endurance runners. BMC Sports Sci. Med. Rehabil. 2022, 14, 142. [Google Scholar] [CrossRef] [PubMed]
- García-Pinillos, F.; Latorre-Román, P.Á.; Roche-Seruendo, L.E.; García-Ramos, A. Prediction of power output at different running velocities through the two-point method with the Stryd™ power meter. Gait Posture 2019, 68, 238–243. [Google Scholar] [CrossRef]
- Taboga, P.; Giovanelli, N.; Spinazze, E.; Cuzzolin, F.; Fedele, G.; Zanuso, S.; Lazzer, S. Running power: Lab based vs. portable devices measurements and its relationship with aerobic power. Eur. J. Sport. Sci. 2022, 22, 1555–1568. [Google Scholar] [CrossRef]
- McKay, A.K.A.; Stellingwerff, T.; Smith, E.S.; Martin, D.T.; Mujika, I.; Goosey-Tolfrey, V.L.; Sheppard, J.; Burke, L.M. Defining training and performance caliber: A participant classification framework. Int. J. Sports Physiol. Perform. 2022, 17, 317–331. [Google Scholar] [CrossRef]
- Van Rassel, C.R.; Ajayi, O.O.; Sales, K.M.; Azevedo, R.A.; Murias, J.M.; MacInnis, M.J. A “Step-Ramp-Step” protocol to identify running speed and power associated with the maximal metabolic steady state. Med. Sci. Sports Exerc. 2022, 55, 534–547. [Google Scholar] [CrossRef]
- Iannetta, D.; Inglis, E.C.; Pogliaghi, S.; Murias, J.M.; Keir, D.A. A “Step-Ramp-Step” protocol to identify the maximal metabolic steady state. Med. Sci. Sports Exerc. 2020, 52, 2011–2019. [Google Scholar] [CrossRef]
- Beneke, R.; von Duvillard, S.P. Determination of maximal lactate steady state response in selected sports events. Med. Sci. Sports Exerc. 1996, 28, 241–246. [Google Scholar] [CrossRef] [PubMed]
- Jones, A.M.; Doust, J.H. A 1% treadmill grade most accurately reflects the energetic cost of outdoor running. J. Sports Sci. 1996, 14, 321–327. [Google Scholar] [CrossRef] [PubMed]
- Beaver, W.L.; Wasserman, K.; Whipp, B.J. A new method for detecting anaerobic threshold by gas exchange. J. Appl. Physiol. 1986, 60, 2020–2027. [Google Scholar] [CrossRef] [PubMed]
- Whipp, B.J.; Davis, J.A.; Wasserman, K. Ventilatory control of the ‘isocapnic buffering’ region in rapidly-incremental exercise. Respir. Physiol. 1989, 76, 357–367. [Google Scholar] [CrossRef] [PubMed]
- Borg, G.A. Psychophysical bases of perceived exertion. Med. Sci. Sports Exerc. 1982, 14, 377–381. [Google Scholar] [CrossRef]
- Billat, V.L.; Sirvent, P.; Py, G.; Koralsztein, J.-P.; Mercier, J. The concept of maximal lactate steady state: A bridge between biochemistry, physiology and sport science. Sports Med. 2003, 33, 407–426. [Google Scholar] [CrossRef]
- Nixon, R.J.; Kranen, S.H.; Vanhatalo, A.; Jones, A.M. Steady-state O2 above MLSS: Evidence that critical speed better represents maximal metabolic steady state in well-trained runners. Eur. J. Appl. Physiol. 2021, 121, 3133–3144. [Google Scholar] [CrossRef]
- Wilcox, S.L.; Broxterman, R.M.; Barstow, T.J. Constructing quasi-linear O2 responses from nonlinear parameters. J. Appl. Physiol. 2016, 120, 121–129. [Google Scholar] [CrossRef]
- Peronnet, F.; Massicotte, D. Table of nonprotein respiratory quotient: An update. Can. J. Sport. Sci. 1991, 16, 23–29. [Google Scholar]
- Koo, T.K.; Li, M.Y. A guideline of selecting and reporting intraclass correlation coefficients for reliability research. J. Chiropr. Med. 2016, 15, 155–163. [Google Scholar] [CrossRef]
- Hoffman, L. Longitudinal Analysis: Modeling within-Person Fluctuation and Change; Routledge: Abingdon, UK, 2015. [Google Scholar]
- García-Pinillos, F.; Soto-Hermoso, V.M.; Latorre-Román, P.Á.; Párraga-Montilla, J.A.; Roche-Seruendo, L.E. How does power during running change when measured at different time intervals? Int. J. Sports Med. 2019, 40, 609–613. [Google Scholar] [CrossRef] [PubMed]
- Cerezuela-Espejo, V.; Hernandez-Belmonte, A.; Courel-Ibanez, J.; Conesa-Ros, E.; Martinez-Cava, A.; Pallares, J.G. Running power meters and theoretical models based on laws of physics: Effects of environments and running conditions. Physiol. Behav. 2020, 223, 112972. [Google Scholar] [CrossRef] [PubMed]
- Iannetta, D.; Inglis, E.C.; Fullerton, C.; Passfield, L.; Murias, J.M. Metabolic and performance-related consequences of exercising at and slightly above MLSS. Scand. J. Med. Sci. Sports 2018, 28, 2481–2493. [Google Scholar] [CrossRef] [PubMed]
- Iannetta, D.; Inglis, E.C.; Mattu, A.T.; Fontana, F.Y.; Pogliaghi, S.; Keir, D.A.; Murias, J.M. A Critical Evaluation of Current Methods for Exercise Prescription in Women and Men. Med. Sci. Sports Exerc. 2020, 52, 466–473. [Google Scholar] [CrossRef]
- Baumgartner, T.; Held, S.; Klatt, S.; Donath, L. Limitations of foot-worn sensors for assessing running power. Sensors 2021, 21, 4952. [Google Scholar] [CrossRef] [PubMed]
- Ruiz-Alias, S.A.; Olaya-Cuartero, J.; Nancupil-Andrade, A.A.; Garcia-Pinillos, F. 9/3-Minute Running Critical Power Test: Mechanical Threshold Location With Respect to Ventilatory Thresholds and Maximum Oxygen Uptake. Int. J. Sports Physiol. Perform. 2022, 17, 1111–1118. [Google Scholar] [CrossRef]
- Imbach, F.; Candau, R.; Chailan, R.; Perrey, S. Validity of the Stryd power meter in measuring running parameters at submaximal speeds. Sports 2020, 8, 103. [Google Scholar] [CrossRef]
- Poole, D.C.; Jones, A.M. Oxygen uptake kinetics. Compr. Physiol. 2012, 2, 933–996. [Google Scholar] [CrossRef]
- Bassett, D.R., Jr.; Howley, E.T. Limiting factors for maximum oxygen uptake and determinants of endurance performance. Med. Sci. Sports Exerc. 2000, 32, 70–84. [Google Scholar] [CrossRef]
- Jones, A.M.; Doust, J.H. The validity of the lactate minimum test for determination of the maximal lactate steady state. Med. Sci. Sports Exerc. 1998, 30, 1304–1313. [Google Scholar] [CrossRef]
- Hawley, J.A.; Noakes, T.D. Peak power output predicts maximal oxygen uptake and performance time in trained cyclists. Eur. J. Appl. Physiol. Occup. Physiol. 1992, 65, 79–83. [Google Scholar] [CrossRef] [PubMed]
- Smith, J.; Dangelmaier, B.; Hill, D. Critical power is related to cycling time trial performance. Int. J. Sports Med. 1999, 20, 374–378. [Google Scholar] [CrossRef] [PubMed]
- Faria, E.W.; Parker, D.L.; Faria, I.E. The science of cycling: Factors affecting performance—Part 2. Sports Med. 2005, 35, 313–337. [Google Scholar] [CrossRef] [PubMed]
- Dearing, C.G.; Paton, C.D. Is Stryd critical power a meaningful parameter for runners? Biol. Sport 2022, 40, 657–664. [Google Scholar] [CrossRef]
- Austin, C.L.; Hokanson, J.F.; McGinnis, P.M.; Patrick, S. The relationship between running power and running economy in well-trained distance runners. Sports 2018, 6, 142. [Google Scholar] [CrossRef]
- Bello, M.L.; Anglin, D.A.; Gillen, Z.M.; Smith, J.W. The use of wearable technology to quantify power and muscle load differences during running against varying wind resistances. Int. J. Kines. Sports Sci. 2022, 10, 11–15. [Google Scholar] [CrossRef]
- Stryd, T. New Power-Based Metric Reveals the Wind So You Can Benefit from Its Effects. 2019. Available online: https://blog.stryd.com/2019/08/16/introducing-air-power/ (accessed on 29 March 2023).
- Bourdon, P.C.; Cardinale, M.; Murray, A.; Gastin, P.; Kellmann, M.; Varley, M.C.; Gabbett, T.J.; Coutts, A.J.; Burgess, D.J.; Gregson, W.; et al. Monitoring Athlete Training Loads: Consensus Statement. Int. J. Sports Physiol. Perform. 2017, 12, S2161–S2170. [Google Scholar] [CrossRef]

Disclaimer/Publisher’s Note: The statements, opinions and data contained in all publications are solely those of the individual author(s) and contributor(s) and not of MDPI and/or the editor(s). MDPI and/or the editor(s) disclaim responsibility for any injury to people or property resulting from any ideas, methods, instructions or products referred to in the content. |
© 2023 by the authors. Licensee MDPI, Basel, Switzerland. This article is an open access article distributed under the terms and conditions of the Creative Commons Attribution (CC BY) license (https://creativecommons.org/licenses/by/4.0/).