1. Introduction
Transparent and specular objects are omnipresent and belong to optically uncooperative objects in the visual spectral range (VIS). Representatives are various glass objects, e.g., glass walls or glass flasks, and transparent or translucent plastic parts, e.g., clear orthodontic aligners or car headlights. Typical areas of application are as follows: (a) human–robot interactions, e.g., for confidential detection of visually uncooperative objects [
1]; (b) autonomous robot navigation, e.g., collision prevention of glass walls; (c) laboratory automation, e.g., for grasping visually uncooperative objects [
2,
3,
4,
5]; (d) medical section, e.g., 3D reconstruction of clear orthodontic aligners; (e) autonomous waste sorting and recycling, and (f) augmented reality [
6]. In these use cases, there are two main tasks:
Locating optically uncooperative objects. This includes object segmentation [
7,
8] and object pose estimation [
9,
10,
11].
Accurately estimating the depth of optically uncooperative objects. This includes accurate and reliable depth estimates, also known as deep depth completion [
2,
12,
13,
14], 3D reconstruction methods [
3,
15,
16], and stereo vision [
17,
18,
19].
This paper describes the current challenges in the stereo depth estimation of transparent and specular objects and presents a new measurement principle for the acquisition of real ground truth data sets.
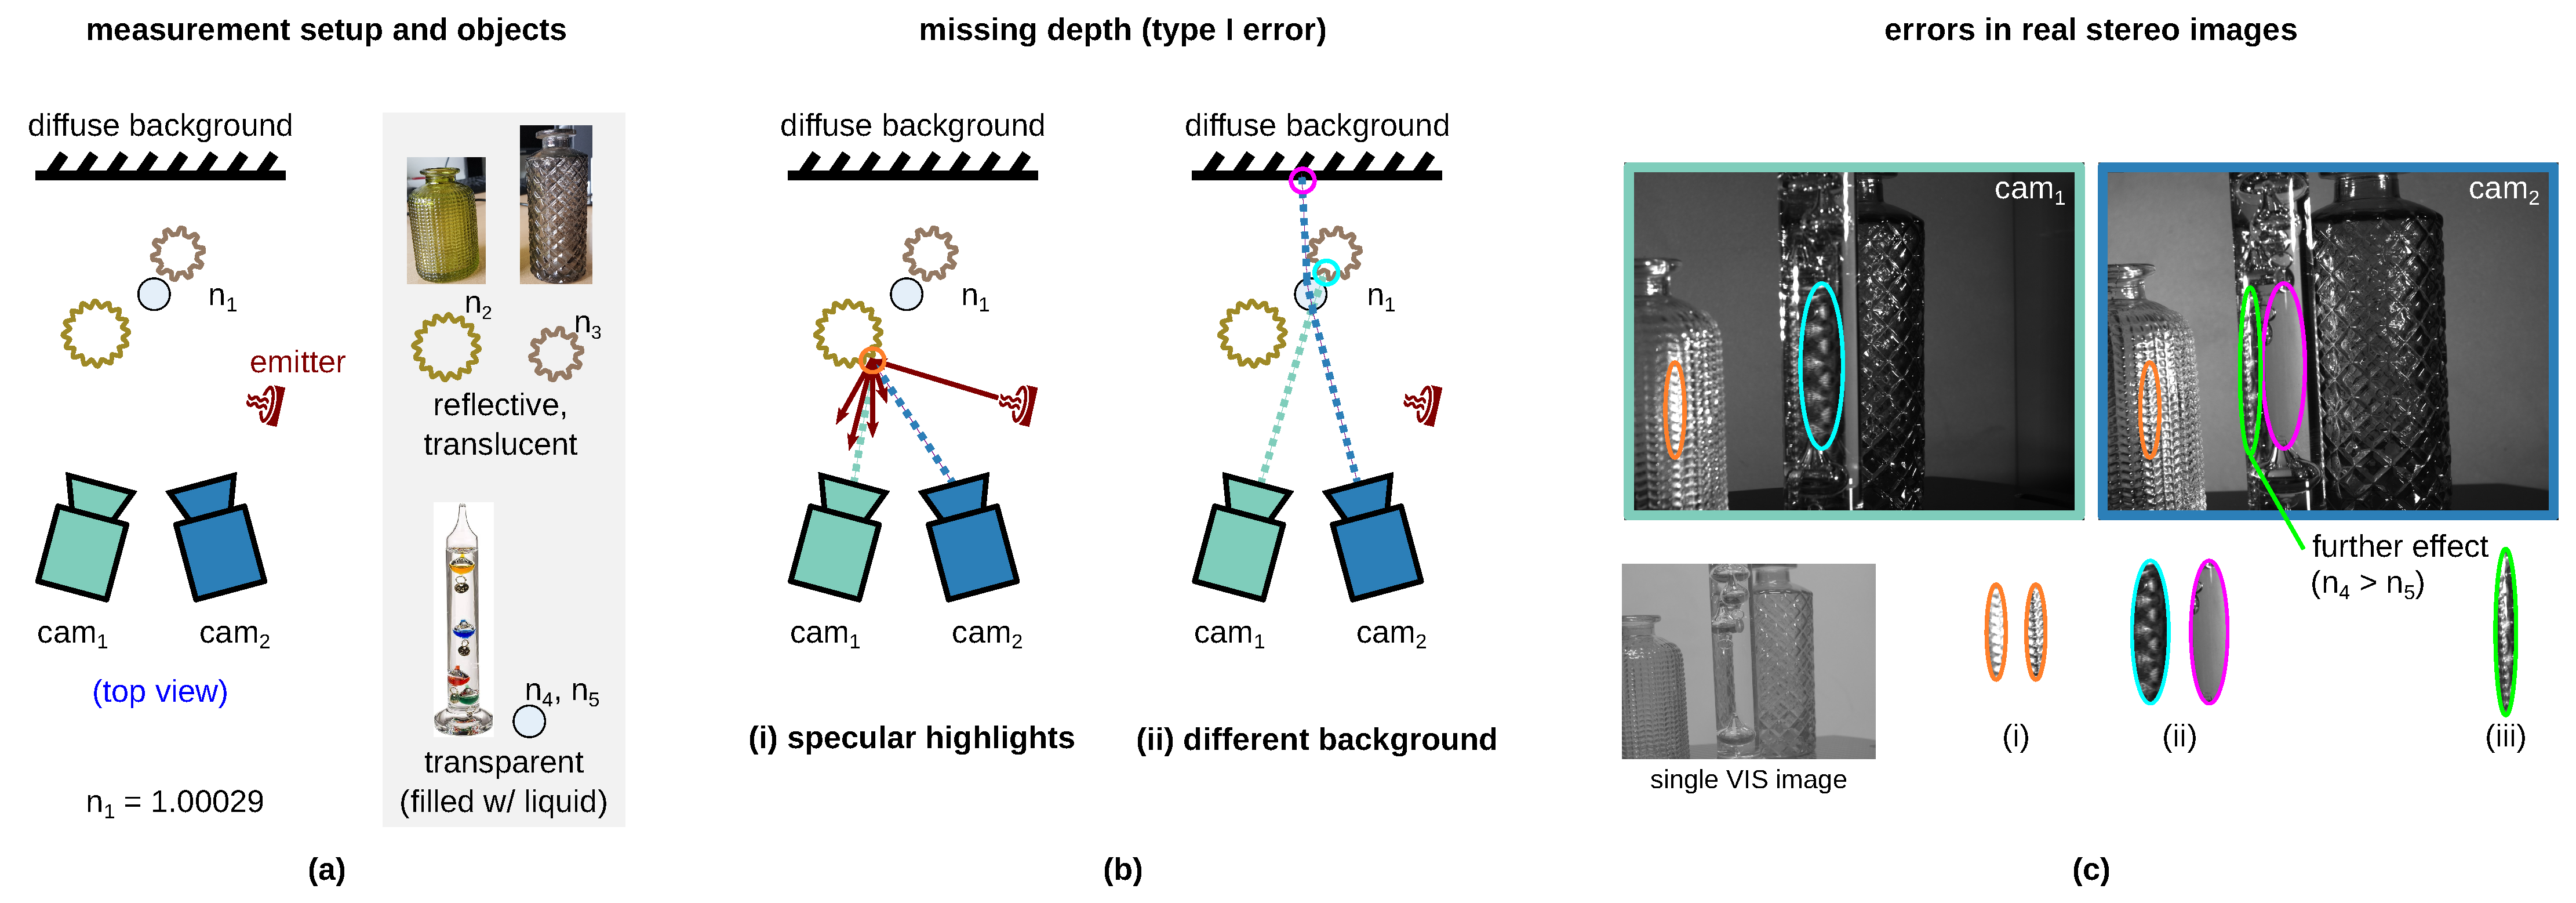
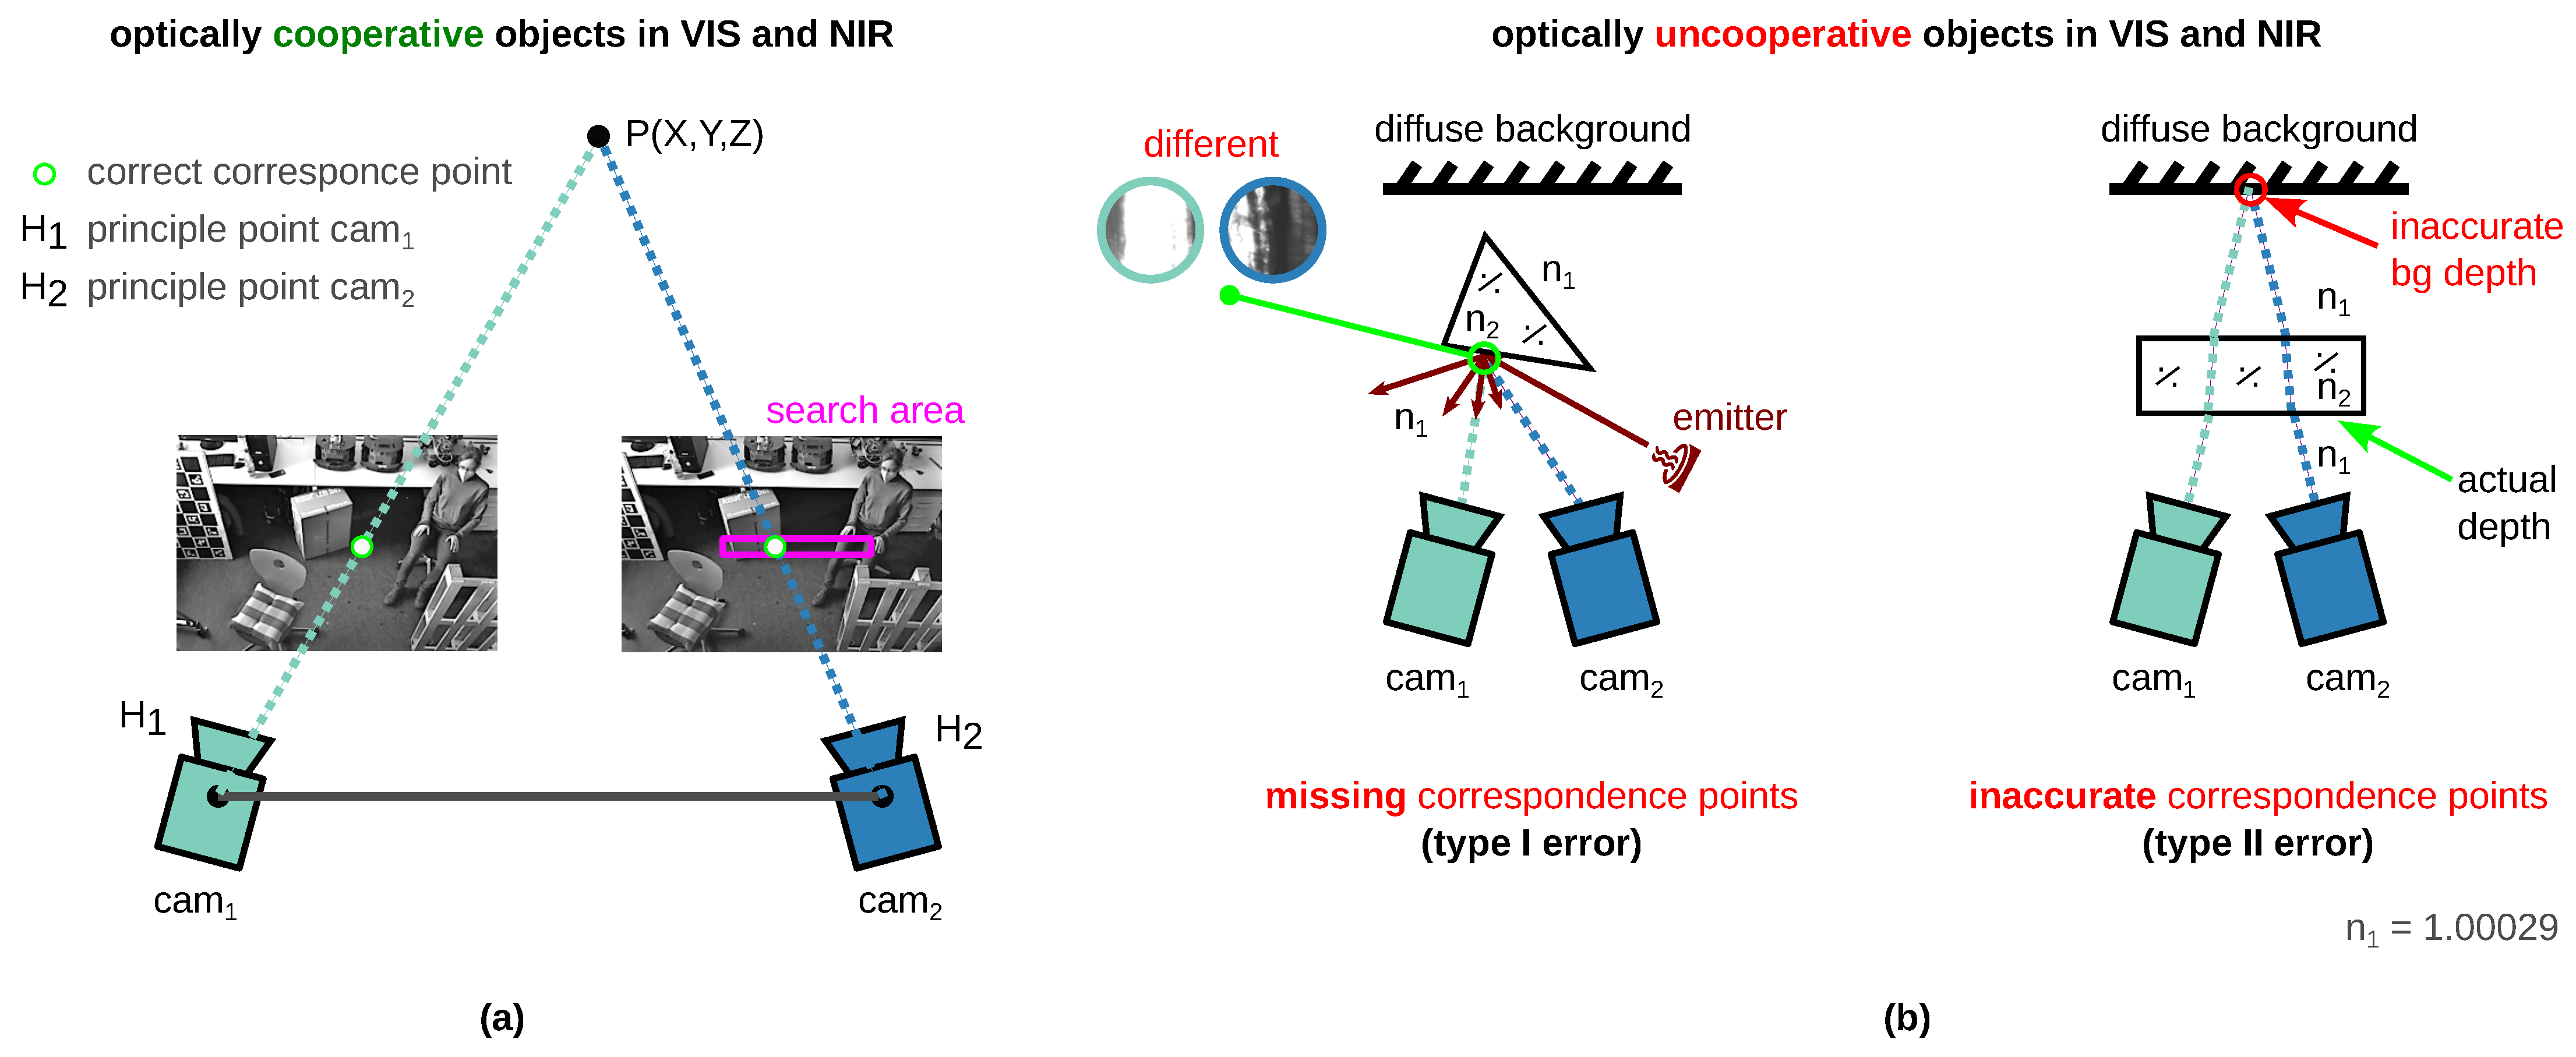
The conventional 3D sensors in the VIS and near-infrared (NIR) spectral range are not suitable for the perception of transparent, translucent, and reflective surfaces [
2,
6,
13,
17,
19,
20] since stereo matching, i.e., the search for correspondence points in the left and right image, is error prone [
18,
19]. The limitations are described in detail in
Section 2.1. To overcome this limitation, data-driven approaches of artificial intelligence (AI)-based stereo matching methods [
17,
18,
21] or monocular depth estimation [
22,
23,
24] are applied. In the process, known (uncooperative) objects that were set during the training time can be perceived without object preparation (also called in distribution). However, there are currently two challenges (A) and (B) for deep stereo methods for visually uncooperative surfaces.
- (A)
This method requires a large training and test data set with ground truth disparity maps. Synthetic data sets or real data sets can be used. Real data sets, unlike synthetic data sets [
2], capture the environment most realistically but are difficult [
2], very time consuming and expensive to create [
18,
25]. That is why hardly any real ground truth data sets exist. The most complex part is the generation of the ground truth, so-called annotation. Therefore, optically uncooperative objects are prepared (e.g., diffuse reflective coating) in order to optically detect them in the VIS or NIR spectral range [
17,
18,
26,
27,
28].
Figure 1a shows that the manipulated surface can thereby be captured three-dimensionally.
This technique is very elaborate and very highly time consuming due to the object preparation process [
18,
25]; see
Figure 1a. This process also includes
high effort in positioning prepared objects to the previous place of unprepared objects [
25]
, and possible object cleaning.
Object preparation is not suitable or appropriate for many objects that may not be prepared, such as historical glass objects.
- (B)
The transparency awareness ability is a corner case in deep stereo matching networks [
17,
19]. Furthermore, current deep stereo matching approaches—regardless of the challenge with transparent objects—are generally limited to a specific data set due to divergent key factors in multiple data sets, and generalize poorly to others. Three key factors are unbalanced disparity distributions and divergent textures and illuminations [
20,
29].
The performance of deep stereo matching networks is strongly dependent on the performance of the training data [
29]. (The definition and key role of the performance of the data set are described in detail in
Section 2.2.) For deep stereo matching and monocular depth estimation, data sets with ground truth are needed. Synthetic data can be produced cheaply without complex surface preparation in large quantities compared to real data sets. Therefore, more synthetic data sets are available than real ones [
6]. In order to synthesize a representative data set of transparent objects and artifacts such as specular highlights and caustics, however, very high-quality rendering and 3D models are required [
2]. Real data sets are preferable to synthetic data sets for the following reasons:
Real data are authentic and reflects the real world;
Real data contain errors, inaccuracies and inconsistencies;
Real data represent human behavior or complex interactions better.
Nevertheless, real-world ground truth data sets for optically uncooperative objects are difficult to obtain [
2], still time consuming and expensive [
18,
25] due to the necessary object preparation (see
Section 2.1). Yet, there are hardly any available real-world data sets for stereo systems suitable for disparity estimation (
Table 1) as well as for mono depth estimation (
Table 2).
Table 1 shows an overview of real-world (non-synthetic) stereo data sets with transparent and specular objects
suitable for disparity estimation. Liu et al. [
25] created the
Transparent Object Data Set (TOD) for pose estimation and depth estimation. The generation of the ground truth data set is very time consuming and elaborate. The ground truth depth of the transparent object was acquired in an additional step with an opaque twin in the same position as the previously acquired transparent object. The challenging part is the exact placement of the opaque twin at exactly the same position as the transparent object. Ramirez et al. [
18] created the first real stereo data set for transparent and reflective surfaces, named
Booster. The ground truth disparity map is obtained by additionally preparing the scene. All non-Lambertian surfaces in the scene are painted or sprayed to allow the projection of textures over them. Our
TranSpec3D data set is, according to our research, the first real (stereo) data set for visually uncooperative materials generated without object preparation, e.g., white titanium dioxide powder.
This shortens and simplifies the ground truth data acquisition process by eliminating the need for object preparation and the accurate placement of the respectively prepared opaque twin object (cf. [
18,
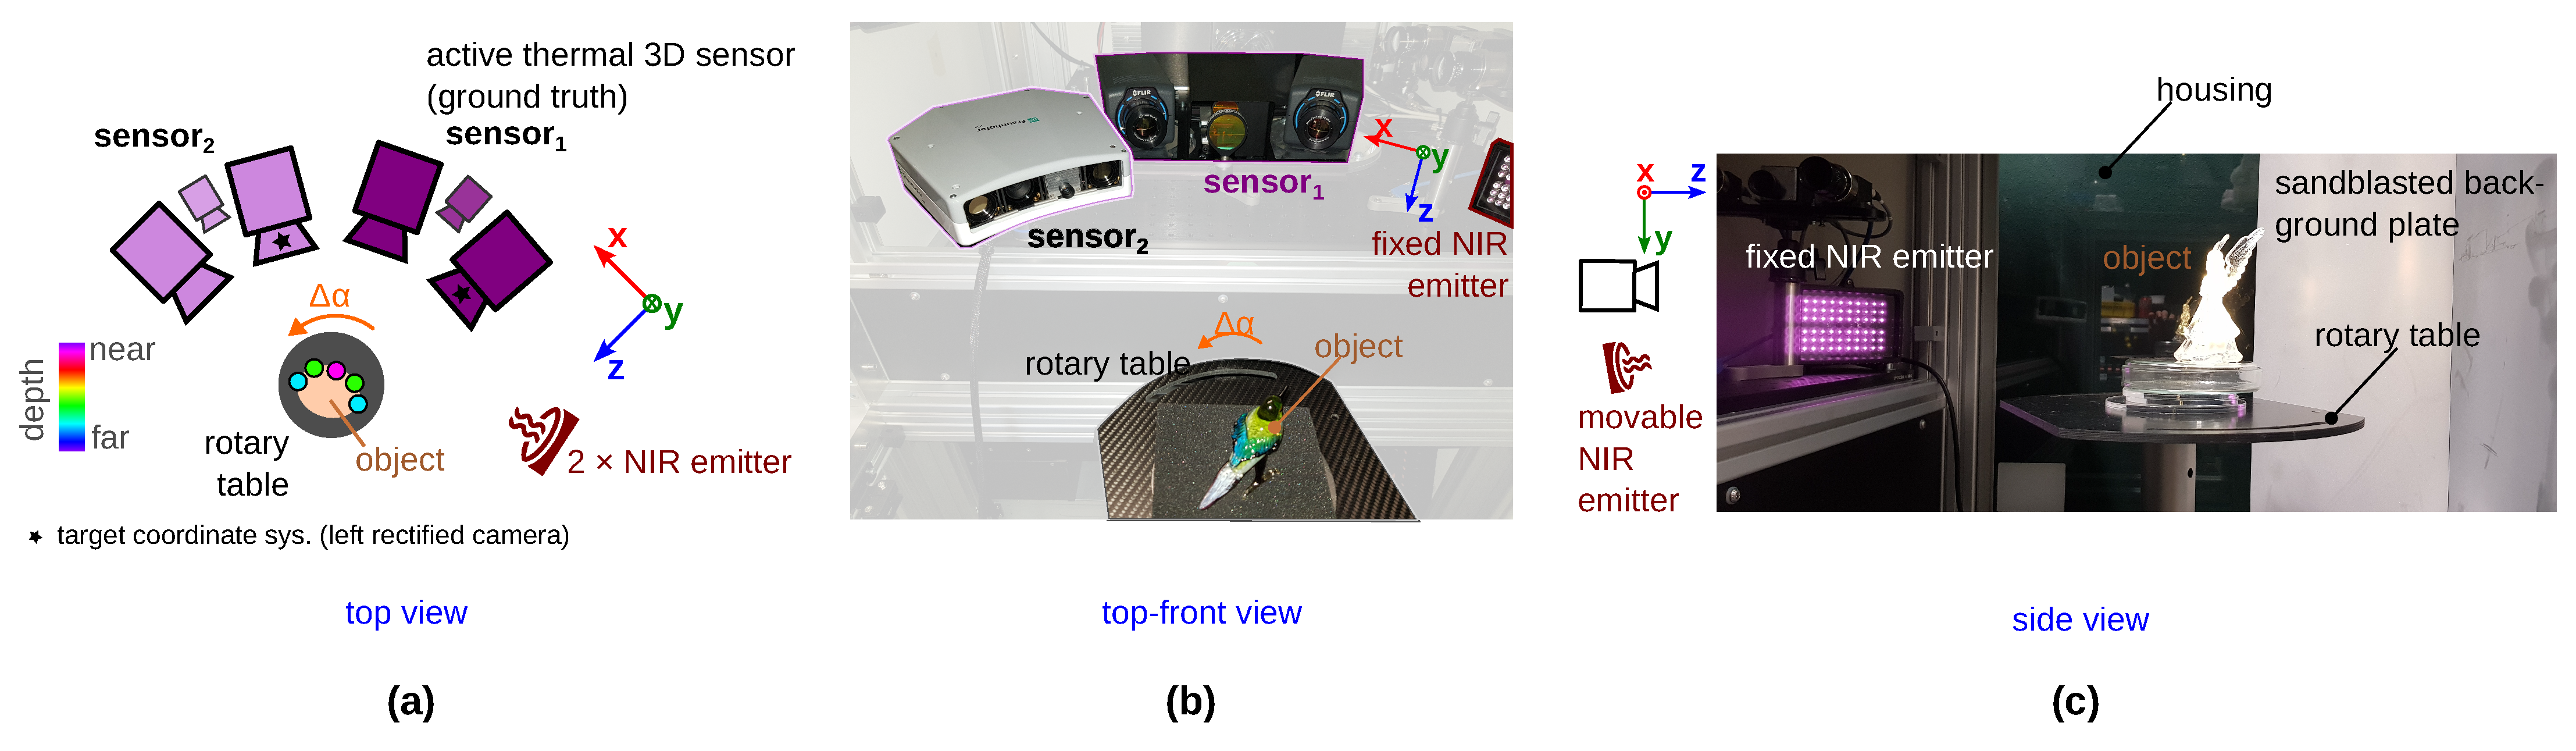
25]). With our novel measuring principle, we overcome the challenges (A). For this purpose, we additionally use a thermal 3D sensor developed by Landmann et al. [
30] to generate real ground truth data. With this additional sensor, the fast and easy acquisition of real ground truth data is possible with little effort and without object preparation; see
Figure 1b.
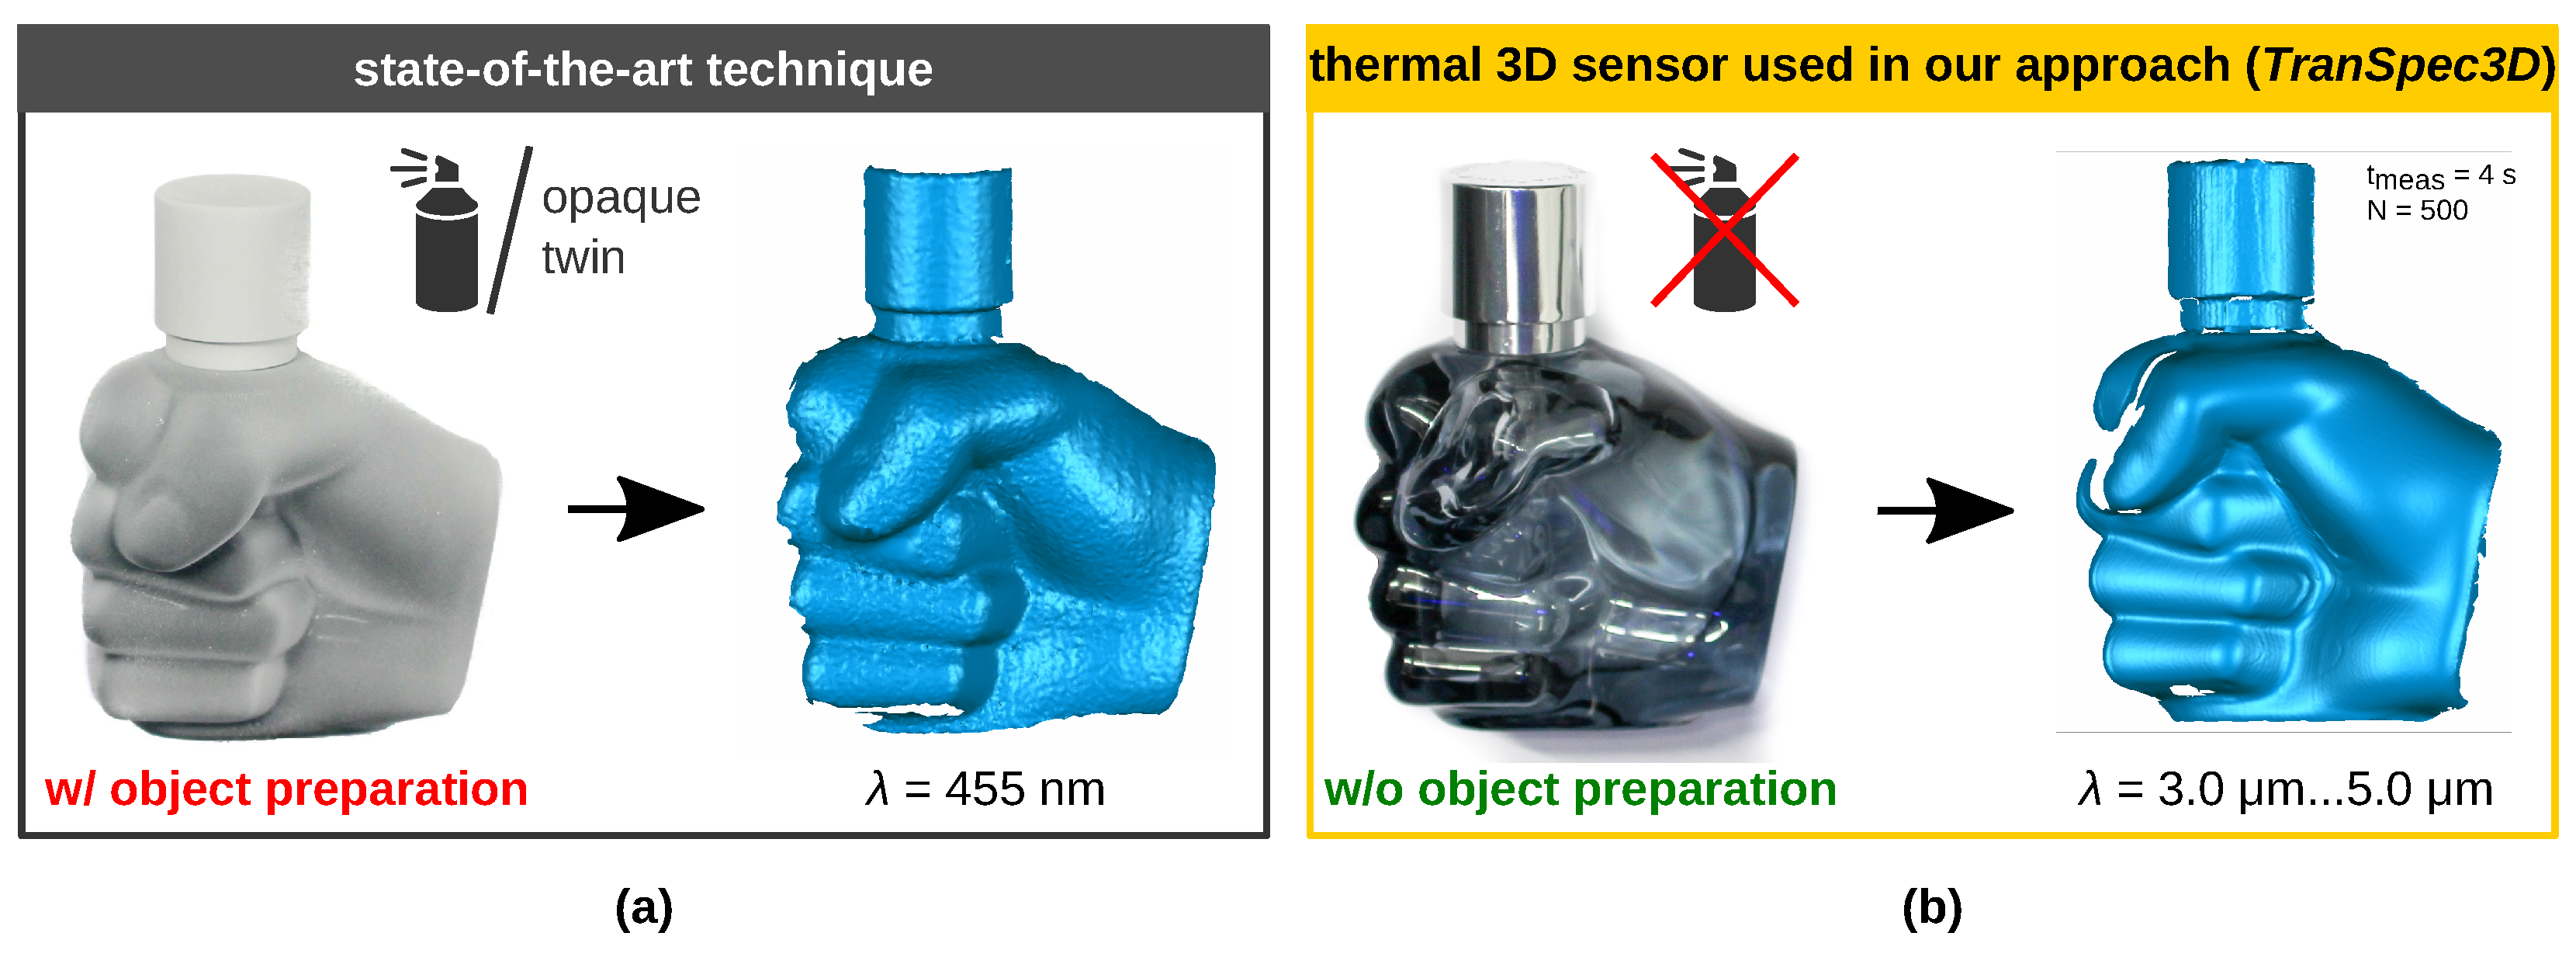
Figure 1.
Two techniques to three-dimensionally record transparent, translucent, and reflective surfaces [
31]. Object: fist-shaped glass flacon with metal-covered plastic cap. (
a) State-of-the-art technique: Using an active VIS 3D sensor requiring object preparation (diffuse reflective coating) [
11,
17,
18,
27,
28]. (
b) Alternative measurement technology: Using a thermal 3D sensor [
30] without object preparation. Wavelength of stereo system
; measuring time
; number of fringes
N (sequential fringe projection).
Figure 1b shows an alternative method published by Landmann et al. [
30] for measuring freeform surfaces without any object preparation with high accuracy. The object surface is heated up locally by only a few Kelvin under the generation of a heat pattern. The surface itself emits this heat pattern which is recorded by thermal cameras. Like in VIS or NIR, the camera pictures are evaluated, and a 3D shape is reconstructed. The fully automatic 3D reconstruction takes place within seconds [
30]. Three disadvantages of this technology, however, are the high hardware costs, the necessary safety-related enclosure and the longer measurement time compared to conventional stereo systems. Objects with very high thermal conductivity or good thermal conductors are not measurable. Nevertheless, with higher costs, the measurement time can also be reduced. There is still potential for development to remedy some disadvantages.
The main contributions of our work are as follows:
We introduce a novel measurement principle
TranSpec3D to generate for transparent and specular objects the
first-ever real data set with ground truth without object preparation (e.g., object painting or powdering).
The absence of object preparation greatly simplifies the creation of the data set, both in terms of object reusability and time, as there is no need to prepare the objects or generate opaque twins, including drying and accurately placing the non-prepared and prepared objects (cf. [
2,
12,
18,
25]). In addition, the surface of the object is not manipulated (cf. [
18,
25]). For data set generation, any conventional 3D sensor is supplemented by a thermal 3D sensor developed by Landmann et al. [
30]. The thermal 3D sensor captures the optically uncooperative objects three-dimensionally without time-consuming object preparation. This measurement principle can be used to generate real monocular as well as stereo data sets, which can be applied, e.g., to monocular depth estimation (depth-from-mono) [
4,
23,
24] or deep stereo matching [
21].
Based on the new measurement principle, we created a new real-world (non-synthetic) stereo data set with ground truth disparity maps, named
TranSpec3D. Our data set is available at
https://QBV-tu-ilmenau.github.io/TranSpec3D-web (accessed on 6 September 2023).
6. Conclusions
In various applications, such as human–robot interactions, autonomous robot navigation or autonomous waste recycling, the perception or 3D reconstruction of transparent and specular objects is required. However, such objects are optically uncooperative in the VIS and NIR ranges. The capture of transparent surfaces is still a corner case in stereo matching [
18,
19]. This can also be seen by the fact that most deep stereo matching networks perform worse on transparent and other visually uncooperative objects [
20,
29]. This is also due to the fact that the generation of real data sets with ground truth disparity maps is very time consuming and costly due to a necessary object preparation (or an additional opaque twin), which is reflected in the small number of available data sets (
Table 1). For this reason, we introduce our novel measurement principle
TranSpec3D that
accelerates and simplifies the generation of a stereo or monocular data set with real measured ground truth for transparent and specular objects without the state-of-the-art object preparation [
18,
25] or an additional opaque twin [
2,
14]. In contrast to conventional techniques that require object preparation [
18,
25], opaque twins [
2,
14] or 3D models [
12,
32] to generate a ground truth, we obtain the ground truth using an additional thermal 3D sensor developed by [
30]. The thermal 3D sensor captures the optically uncooperative objects three-dimensionally without time-consuming object preparation. With our measurement principle, the time and effort required to create the data set is massively reduced. The time-consuming object preparation as well as the time-consuming object placement of transparent and opaque objects is eliminated. In addition, the surface of the object is not manipulated, which means that sensitive objects can also be detected, e.g., historical glass. Another special feature is the generalizability of the measurement principle, i.e., any conventional 3D sensor in VIS or NIR (sensor
2) can be extended with the thermal 3D sensor (sensor
1), e.g., by a RGB stereo system (with parallel or convergent camera arrangement) for a stereo data set with ground truth disparity values (for deep stereo matching [
21]) or by a RGB-D sensor for monocular data sets with ground truth depth values (for monocular depth estimation [
4,
23,
24]). In addition, there is a high development potential to optimize the thermal 3D sensor to make this technology as accessible as possible.
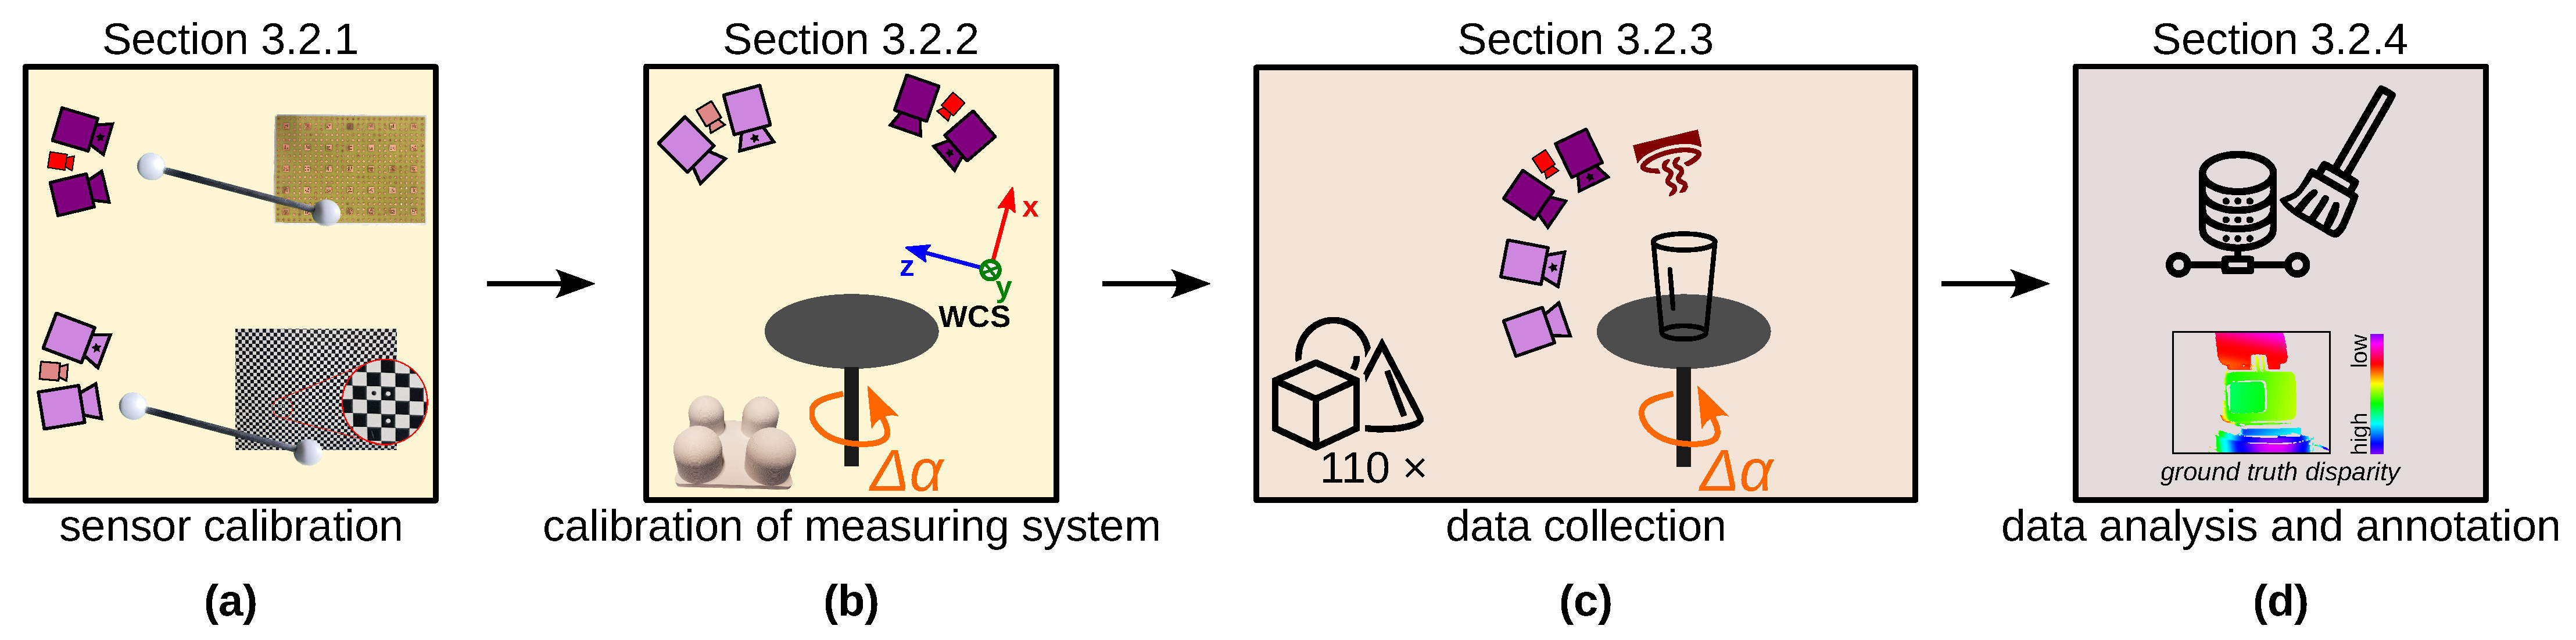
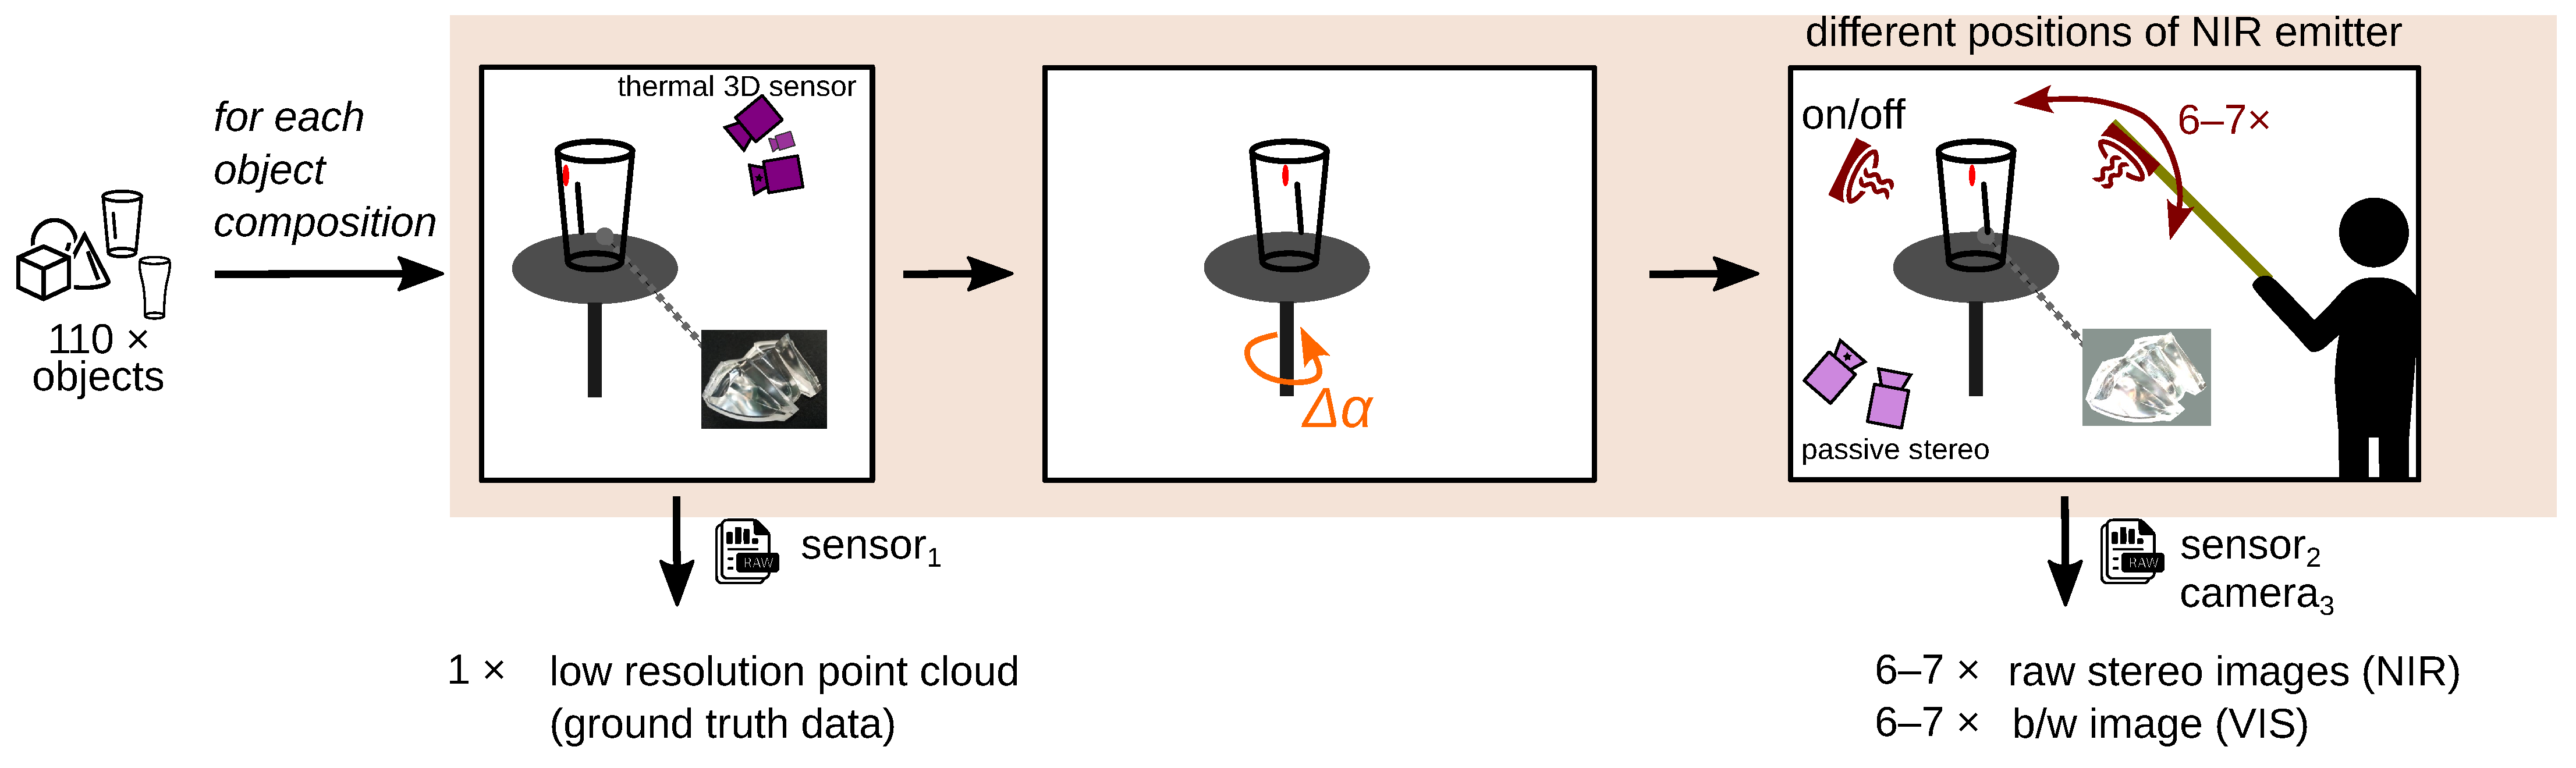
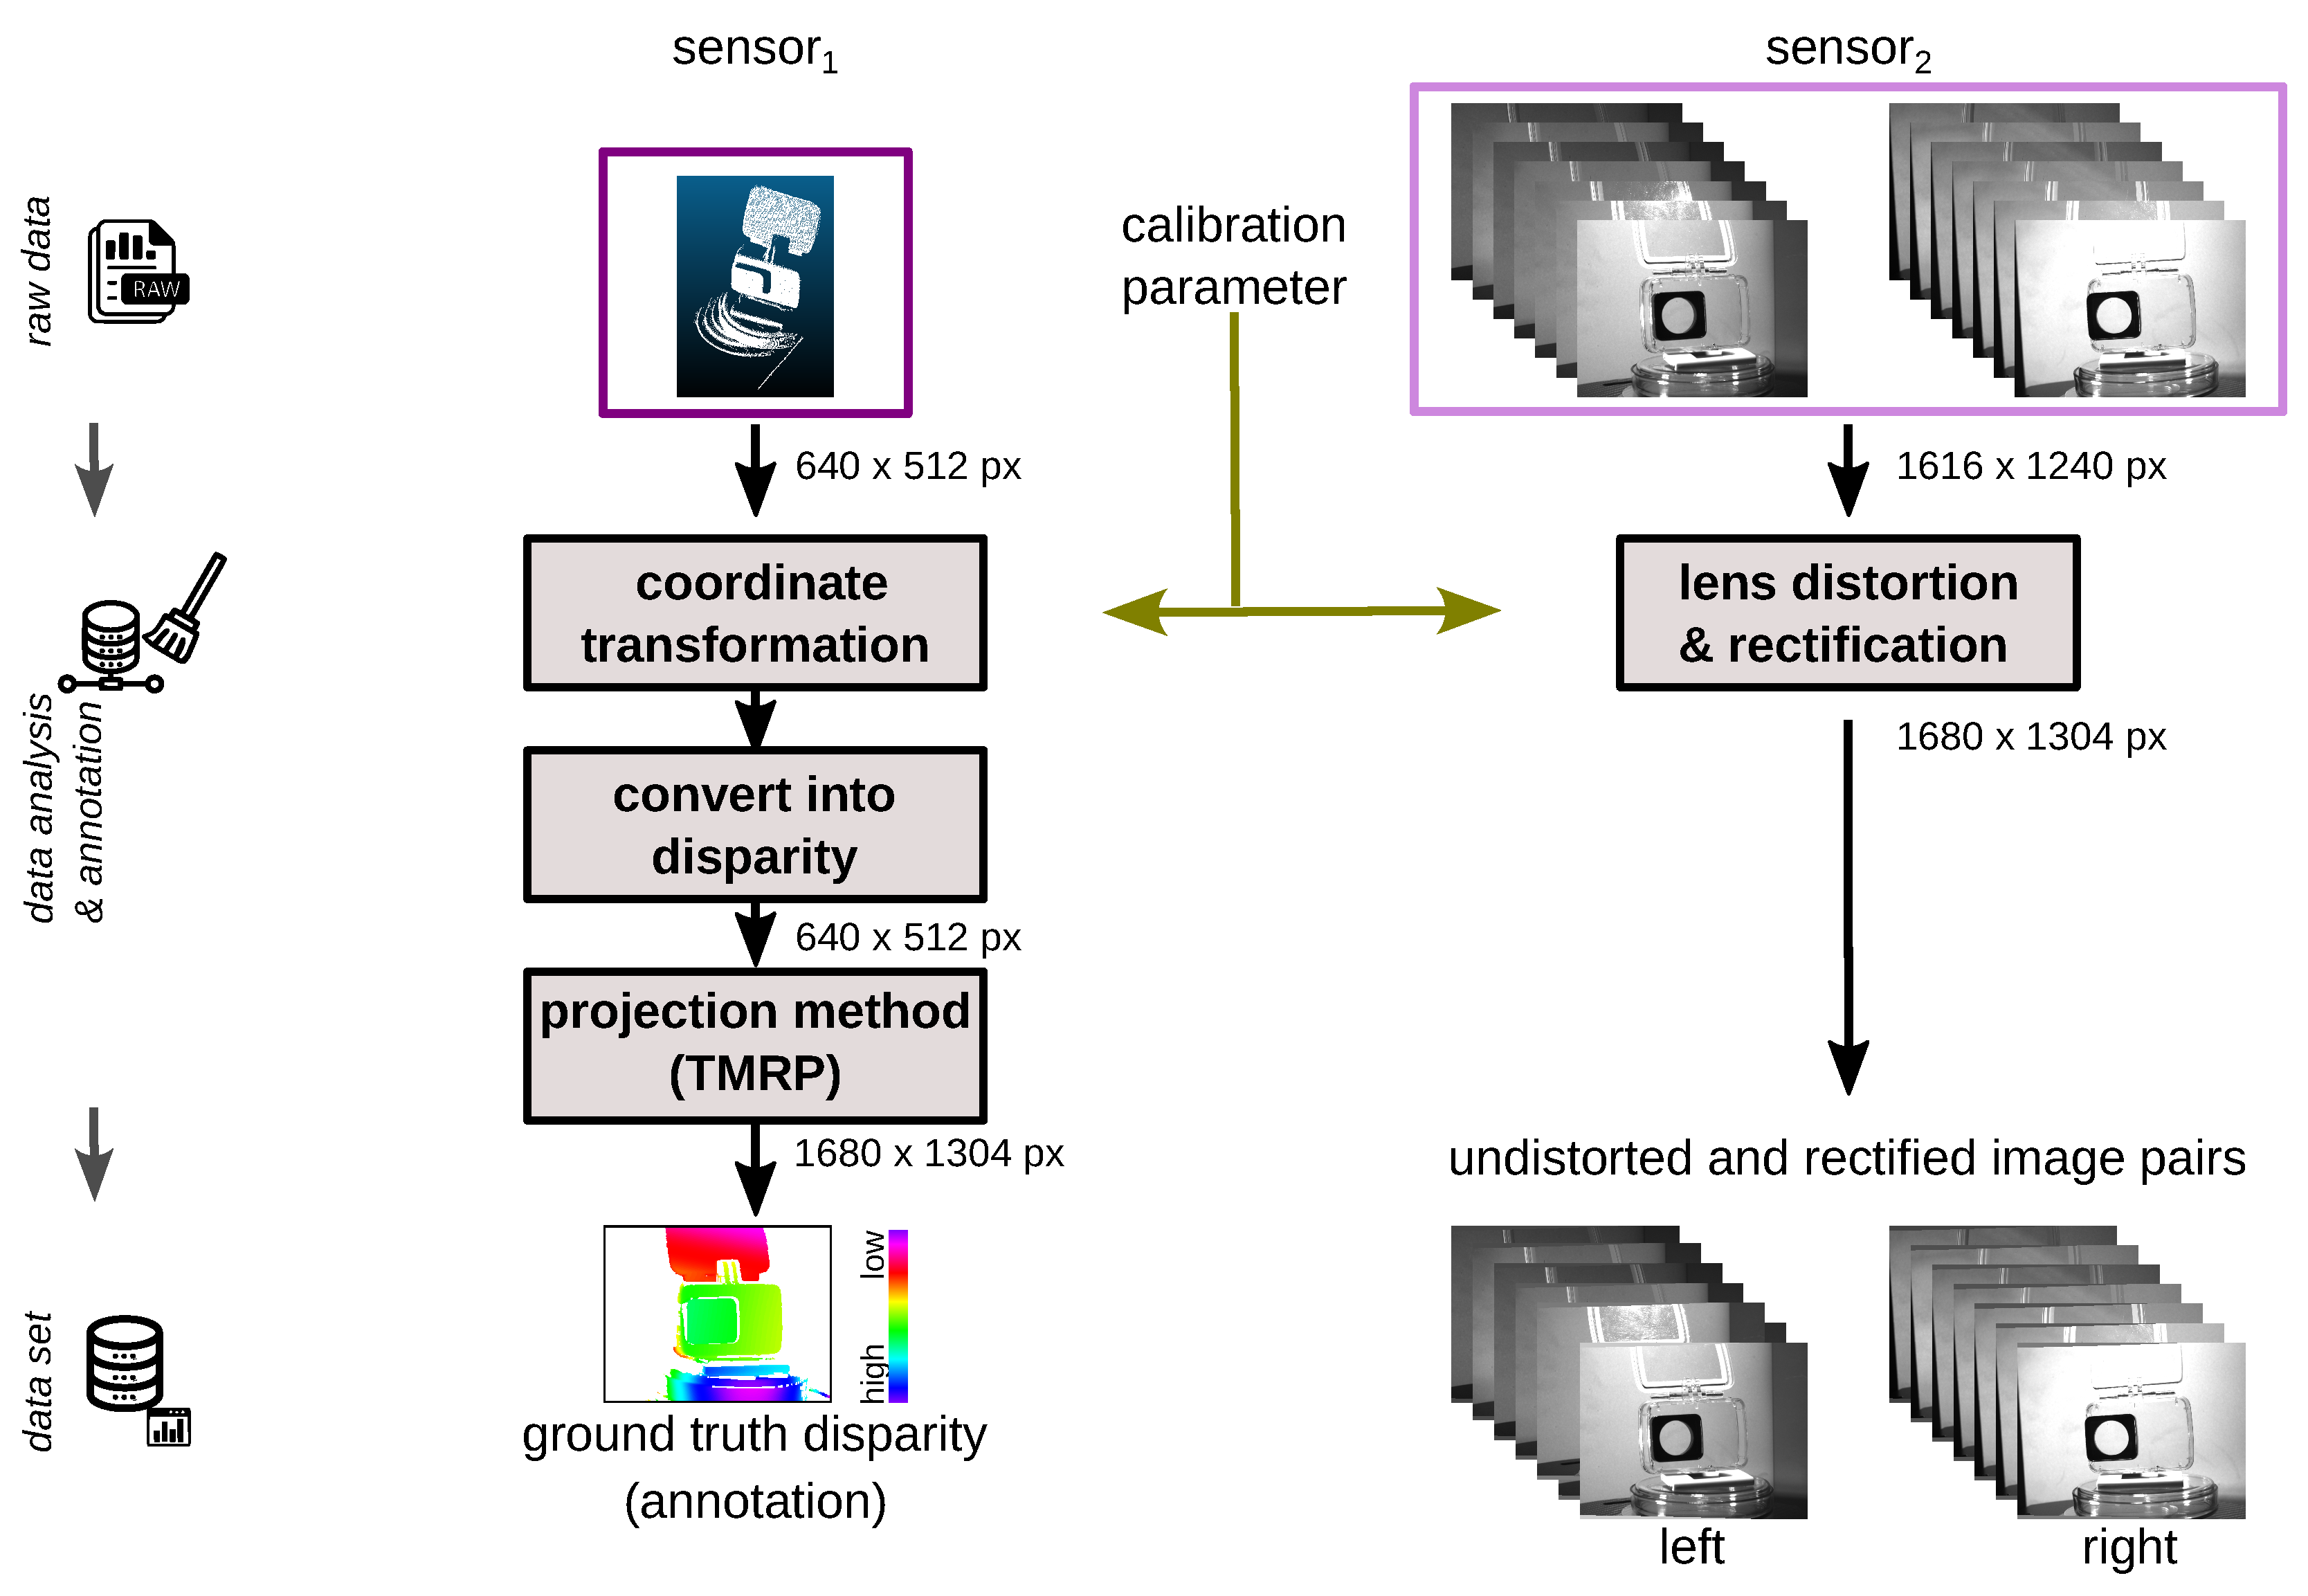
We apply this measurement principle to generate our data set
TranSpec3D. For this, we use a conventional NIR 3D sensor and the thermal 3D sensor [
30]. To enlarge the data set naturally (data augmentation), we record each scene with different NIR emitter positions. After the data collection, a data analysis and annotation of ground truth disparities takes place. To ensure that the ground truth disparity map has the same resolution as the stereo images, the Triangle-Mesh-Rasterization-Projection (TMRP) method [
39] is used. Our data set
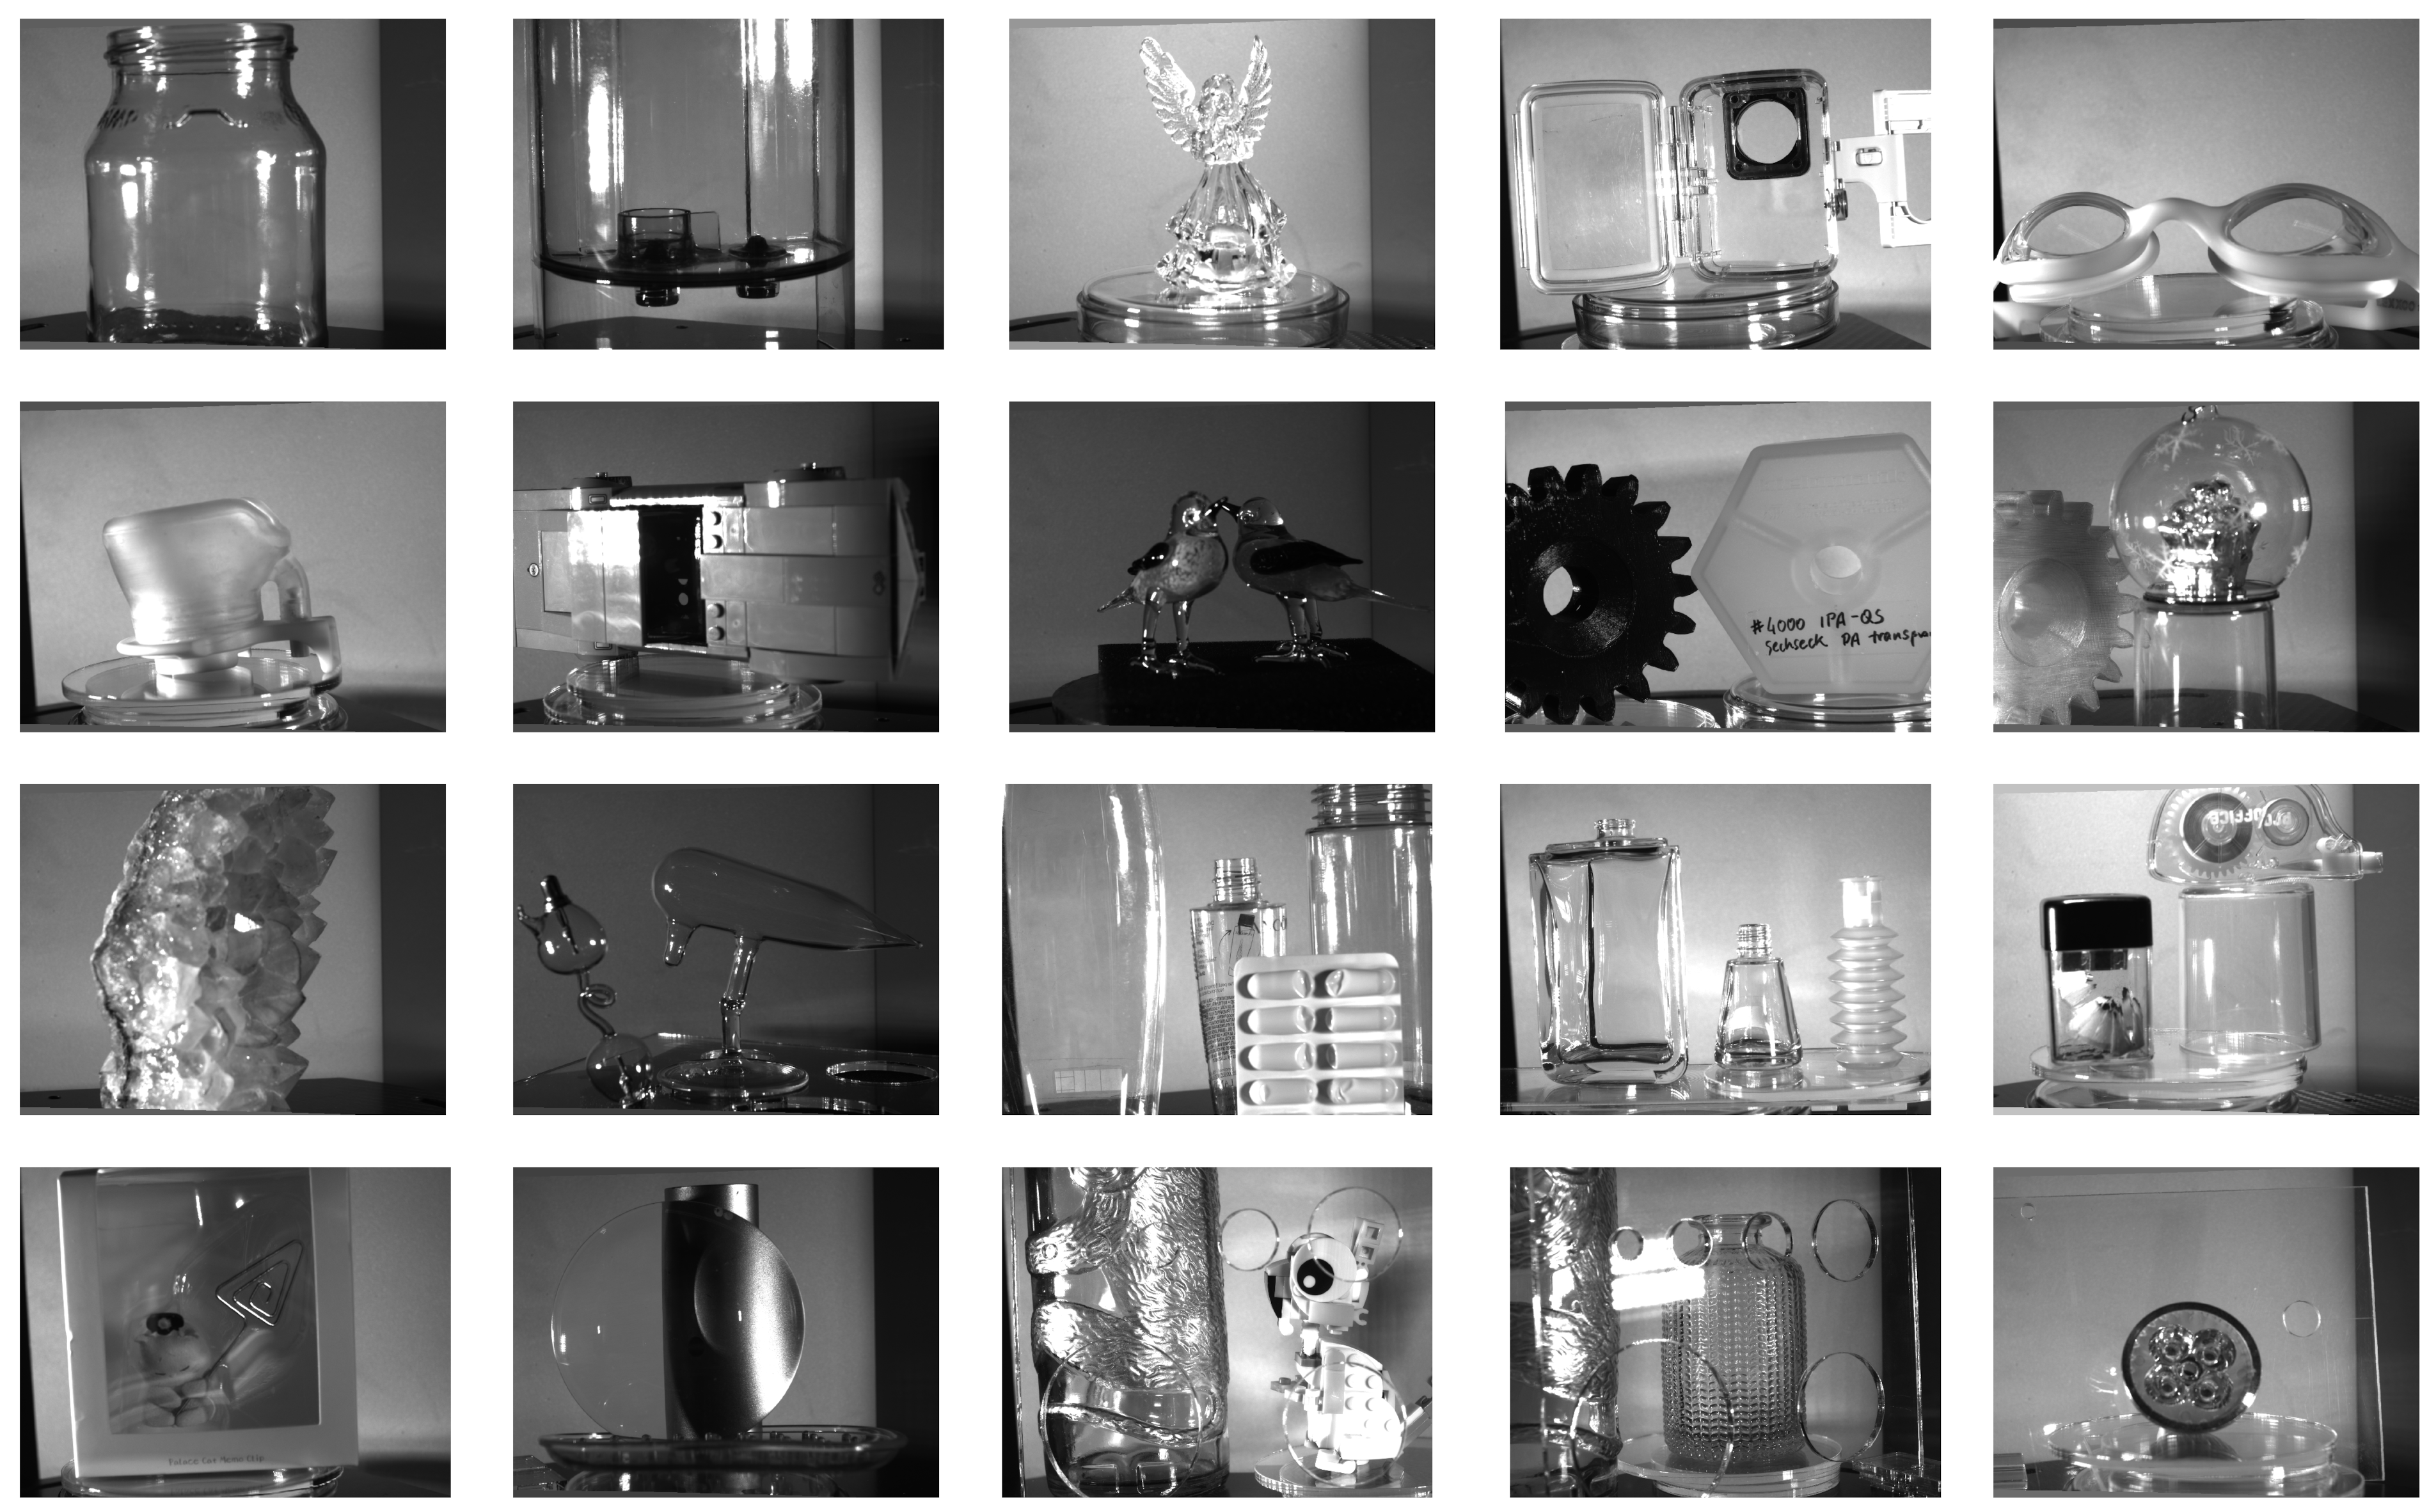
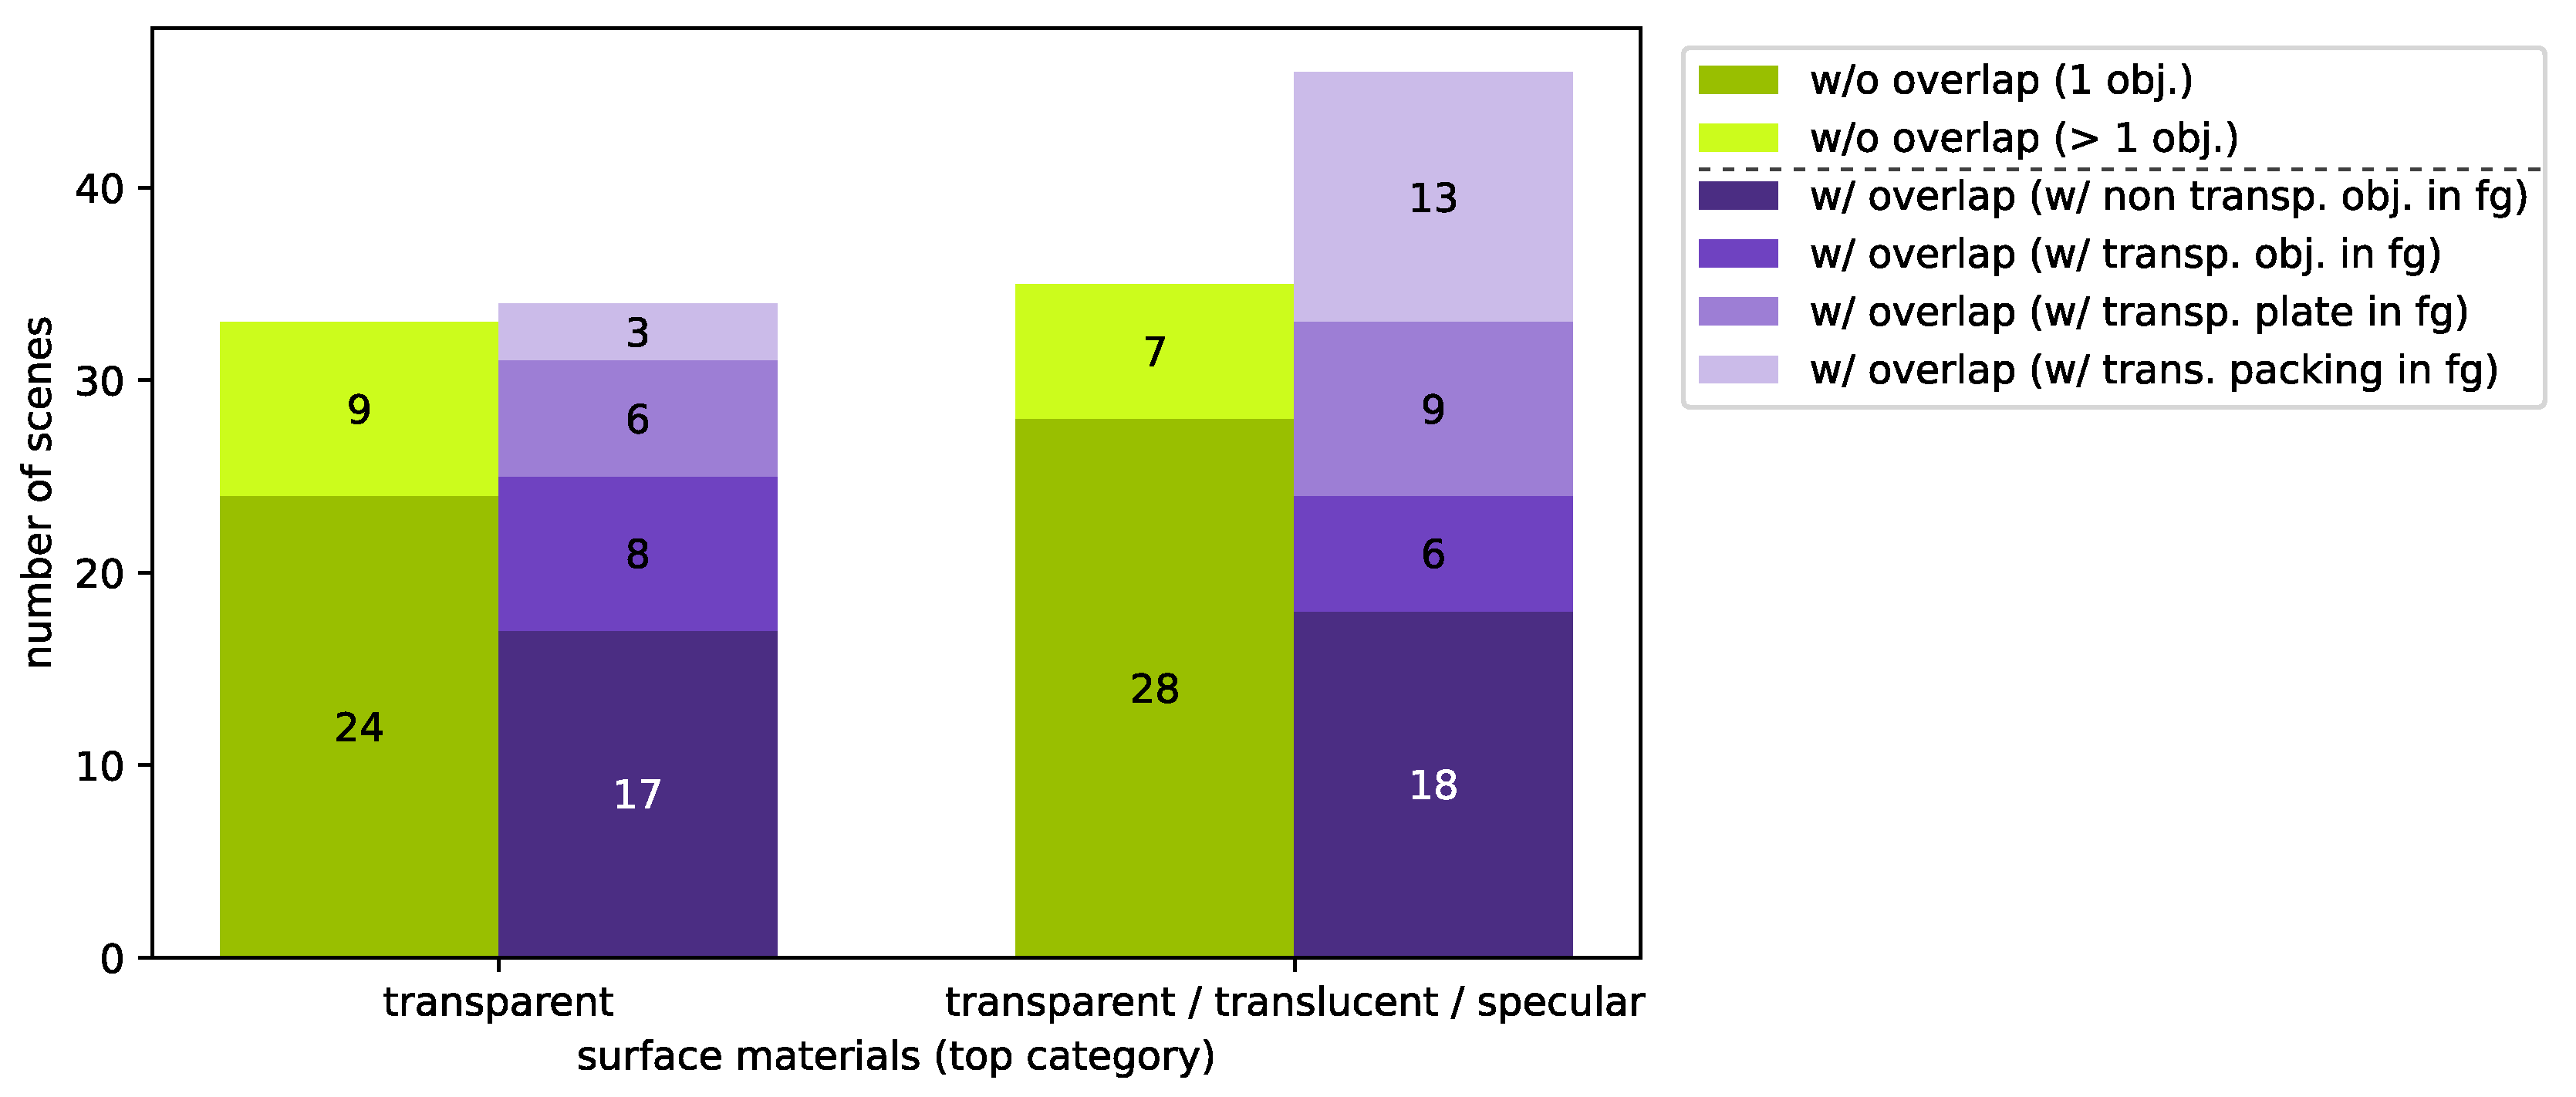
TranSpec3D consists of stereo imagery (raw as well as undistorted and rectified) and ground truth disparity maps. We capture 110 different objects (transparent, translucent or specular) at different illumination environments, thus increasing the data set and creating different reflections on the surface (natural data augmentation). We categorize the captured 148 scenes by surface materials (top category) and complexity (sub category) (
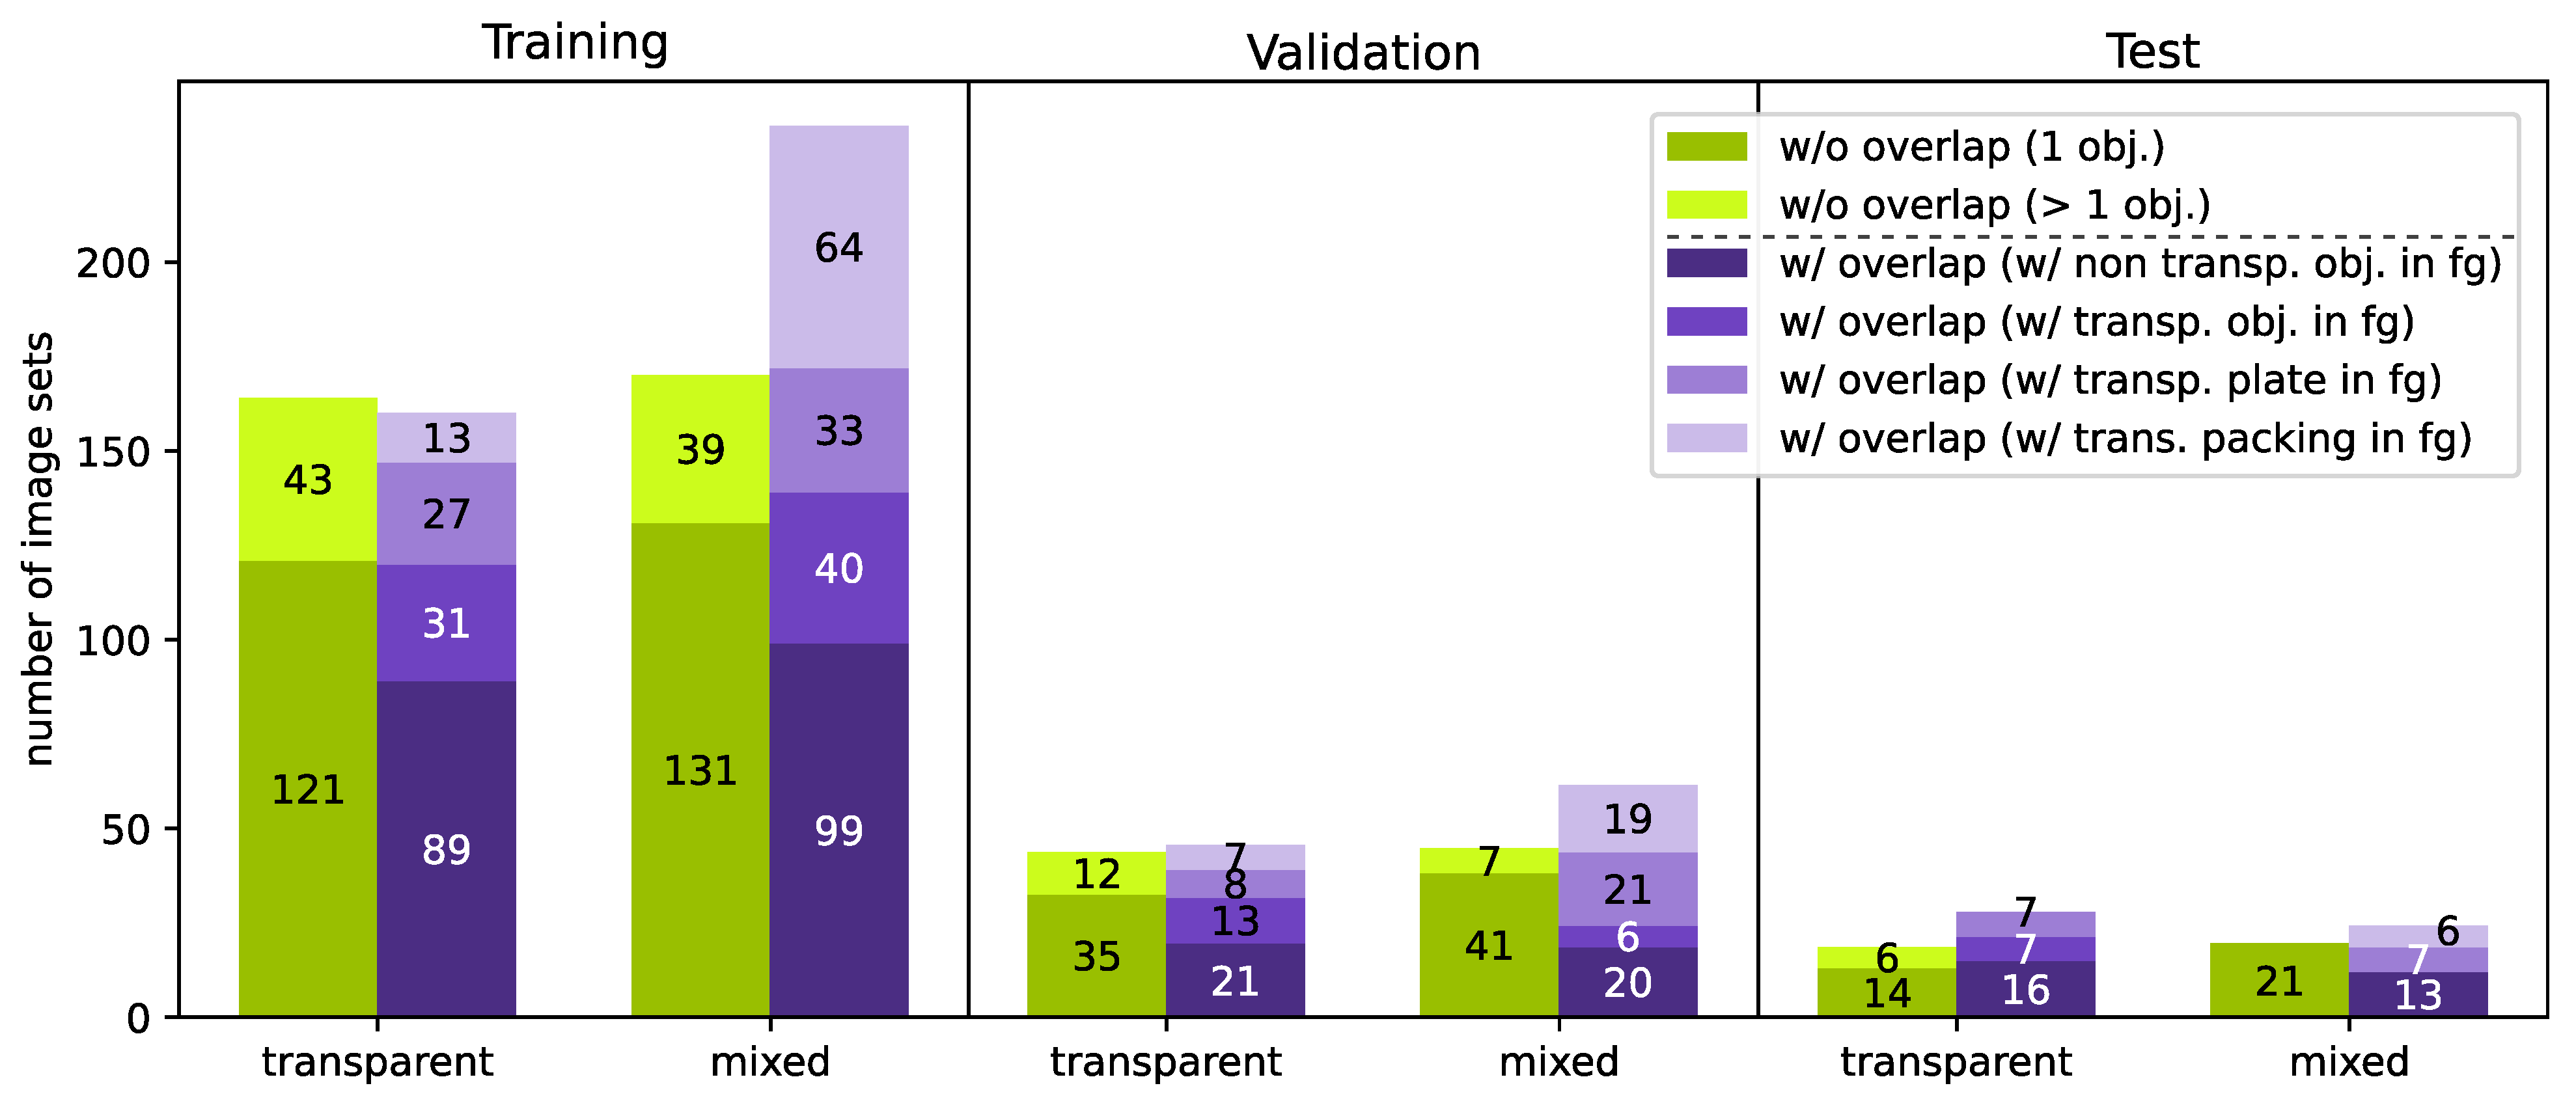
Figure 11). This allows us to have a balanced split of the data set into training/validation/test data sets (
Figure A3). Our data set consists of 1037 image sets (consisting of stereo image and disparity map). Our data set is available at
https://QBV-tu-ilmenau.github.io/TranSpec3D-web (accessed on 6 September 2023). We present the advantages and disadvantages of our method by comparing our
TranSpec3D data set with the
Booster data set [
18] (cf.
Table 4).


