

User QoS-Based Optimized Handover Algorithm for Wireless Networks


Abstract
:1. Introduction
2. Related Work
3. User QoS-Based Optimized Handover Algorithm
3.1. Optimized Handover Algorithm
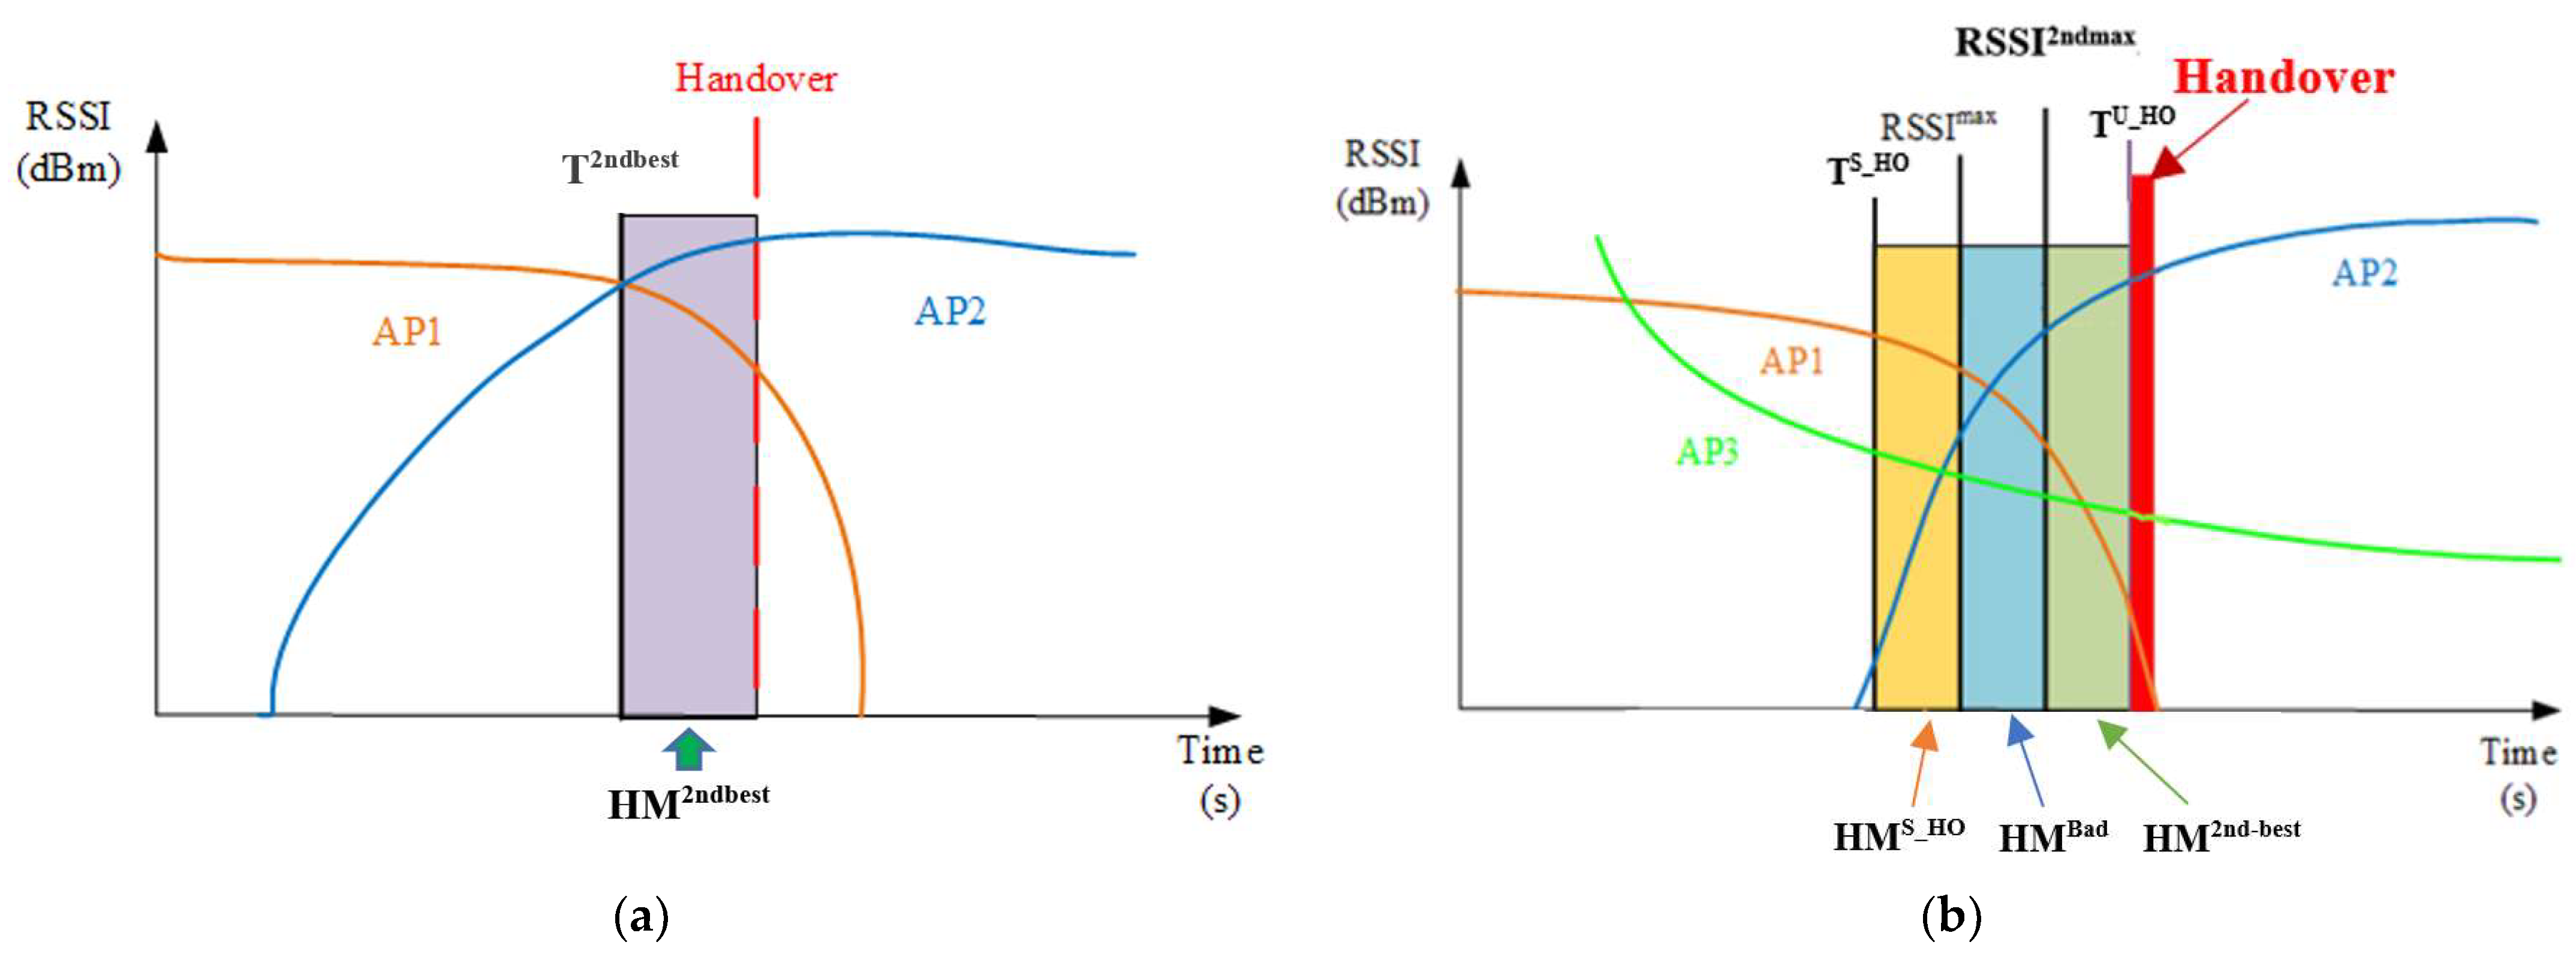
- The signal strength quality of the AP near the UE is the best (RSSIMax) and better than the sum of the signal strength of the currently connected AP (RSSIC) and the HM with a good signal quality (HMGood). Since the signal strength quality of neighboring APs is excellent, the handover procedure can be performed (i.e., RSSIMax ≥ RSSIC + HMGood).
- “The minimum signal quality threshold for should handover” (TS_HO) is better than the sum of the signal strength of the currently connected AP (RSSIC) and “the minimum signal quality HM for should handover” (HMS_HO). The handover process is not performed until the signal strength quality of the currently connected AP is in this condition, which can effectively reduce the occurrence of the ping-pong effect (i.e., TS_HO ≥ RSSIC + HMS_HO).
- The signal strength quality of the AP near the UE is the best (RSSIMax) and better than the sum of the signal strength of the second-best AP (RSSI2nd-best) and the HM with the second-best signal strength in the good signal interval (HM2ndgood). This means that for the UE, the quality of service of the nearby AP with the best signal strength is much better than the service quality of the second-best nearby AP (i.e., RSSIMax ≥ RSSI2nd-best + HM2ndgood).
- When selecting the best nearby AP for handover, the AP with the largest signal increment will be selected as the best handover AP; that is, the UE keeps moving to it (i.e., UE is moving toward RSSIMax AP).
- The signal strength quality of the AP near the UE is the best (RSSIMax) and better than the sum of the signal strength of the currently connected AP (RSSIC) and the HM with a bad signal interval (HMBad). Since the signal strength quality of neighboring APs is excellent, the handover procedure can be performed (i.e., RSSIMax ≥ RSSIC + HMBad).
- The minimum signal quality threshold for handover (TS_HO) is better than the sum of the signal strength of the currently connected AP (RSSIC) and “the minimum signal quality HM for should handover” (HMS_HO). The handover process is not performed until the signal strength and quality of the currently connected AP are in this condition, which can effectively reduce the occurrence of the ping-pong effect (i.e., TS_HO ≥ RSSIC + HMS_HO).
- The signal strength quality of the AP near the UE is the best (RSSIMax) and better than the sum of the signal strength of the second-best AP (RSSI2nd-best) and the HM with the second-best signal strength in the bad signal quality (HM2ndbad). This means that for the UE, the quality of service of the nearby AP with the best signal strength is much better than the service quality of the second-best nearby AP (i.e., RSSIMax ≥ RSSI2nd-best + HM2ndbad).
- When selecting the best nearby AP for handover, the AP with the largest signal increment will be selected as the best handover AP; that is, the UE keeps moving to it (i.e., UE is moving toward RSSIMax AP).
- “The worst acceptable signal strength that urgently requires handover” (TU_HO) should be considered as a top priority when making handover decisions. If the signal strength between the UE and the currently connected AP is lower than the worst acceptable signal strength that urgently requires handover for the connection, this means that the signal quality of the current connection is extremely poor, and the UE must immediately initiate a handover procedure to connect to a nearby AP with better signal quality (i.e., TU_HO ≥ RSSIC).
| Algorithm 1 Optimized Handover Algorithm |
| 1: Function HAND-OFF TRIGGERING |
| 2: if (RSSIC ≥ T) then |
| 3: if (RSSI2nd-best ≥ T 2nd-best−HM2nd-best) AND (UE is moving toward RSSI2nd-best AP) then |
| 4: return True |
| 5: else if (RSSIMax ≥ RSSIC + HMGood) AND (T S_HO ≥ RSSIC+ HMS_HO) AND (RSSIMax ≥ RSSI2nd-best + HM2ndgood) AND (UE is moving toward RSSIMax AP) then |
| 6: return True |
| 7: end if |
| 8: else |
| 9: if (RSSI2nd-best ≥ T 2nd-best−HM2nd-best) AND (UE is moving toward RSSI2nd-best AP) then |
| 10: return True |
| 11: else if [(RSSIMax ≥ RSSIC + HMBad) AND (T S_HO ≥ RSSIC + HMS_HO) AND (RSSIMax ≥ RSSI2nd-best+ HM2ndbad) AND (UE is moving toward RSSIMax AP)] OR (T U_HO ≥ RSSIC) then |
| 12: return True |
| 13: end if |
| 14: end if |
| 15: return False |
| 16: end function |
3.2. Optimized Handover Algorithm with QoS Requirements (OHAQR)
| Algorithm 2 Optimized Handover Algorithm with QoS Requirements |
| 1: Function HAND-OFF TRIGGERING |
| 2: if (RSSIC ≥ T) then |
| 3: if (RSSI2nd-best ≥ T 2nd-best−HM2nd-best) AND (UE is moving toward RSSI2nd-best AP) then |
| 4: return True |
| 5: else if (RSSIMax ≥ RSSIC + HMGood) AND (T S_HO ≥ RSSIC + HMS_HO) AND (RSSIMax ≥ RSSI2nd-best + HM2ndgood) AND (UE is moving toward RSSIMax AP) then |
| 6: return True |
| 7: end if |
| 8: else |
| 9: if (RSSI2nd-best ≥ T 2nd-best−HM2nd-best) AND (UE is moving toward RSSI2nd-best AP) then |
| 10: return True |
| 11: else if [(RSSIMax ≥ RSSIC + HMBad) AND (T S_HO ≥ RSSIC + HMS_HO) AND (RSSIMax ≥ RSSI2nd-best + HM2ndbad) AND (UE is moving toward RSSIMax AP)] OR (Q < TQoS) OR (T U_HO ≥ RSSIC) then |
| 12: return True |
| 13: end if |
| 14: end if |
| 15: return False |
| 16: end function |
4. Experimental Results
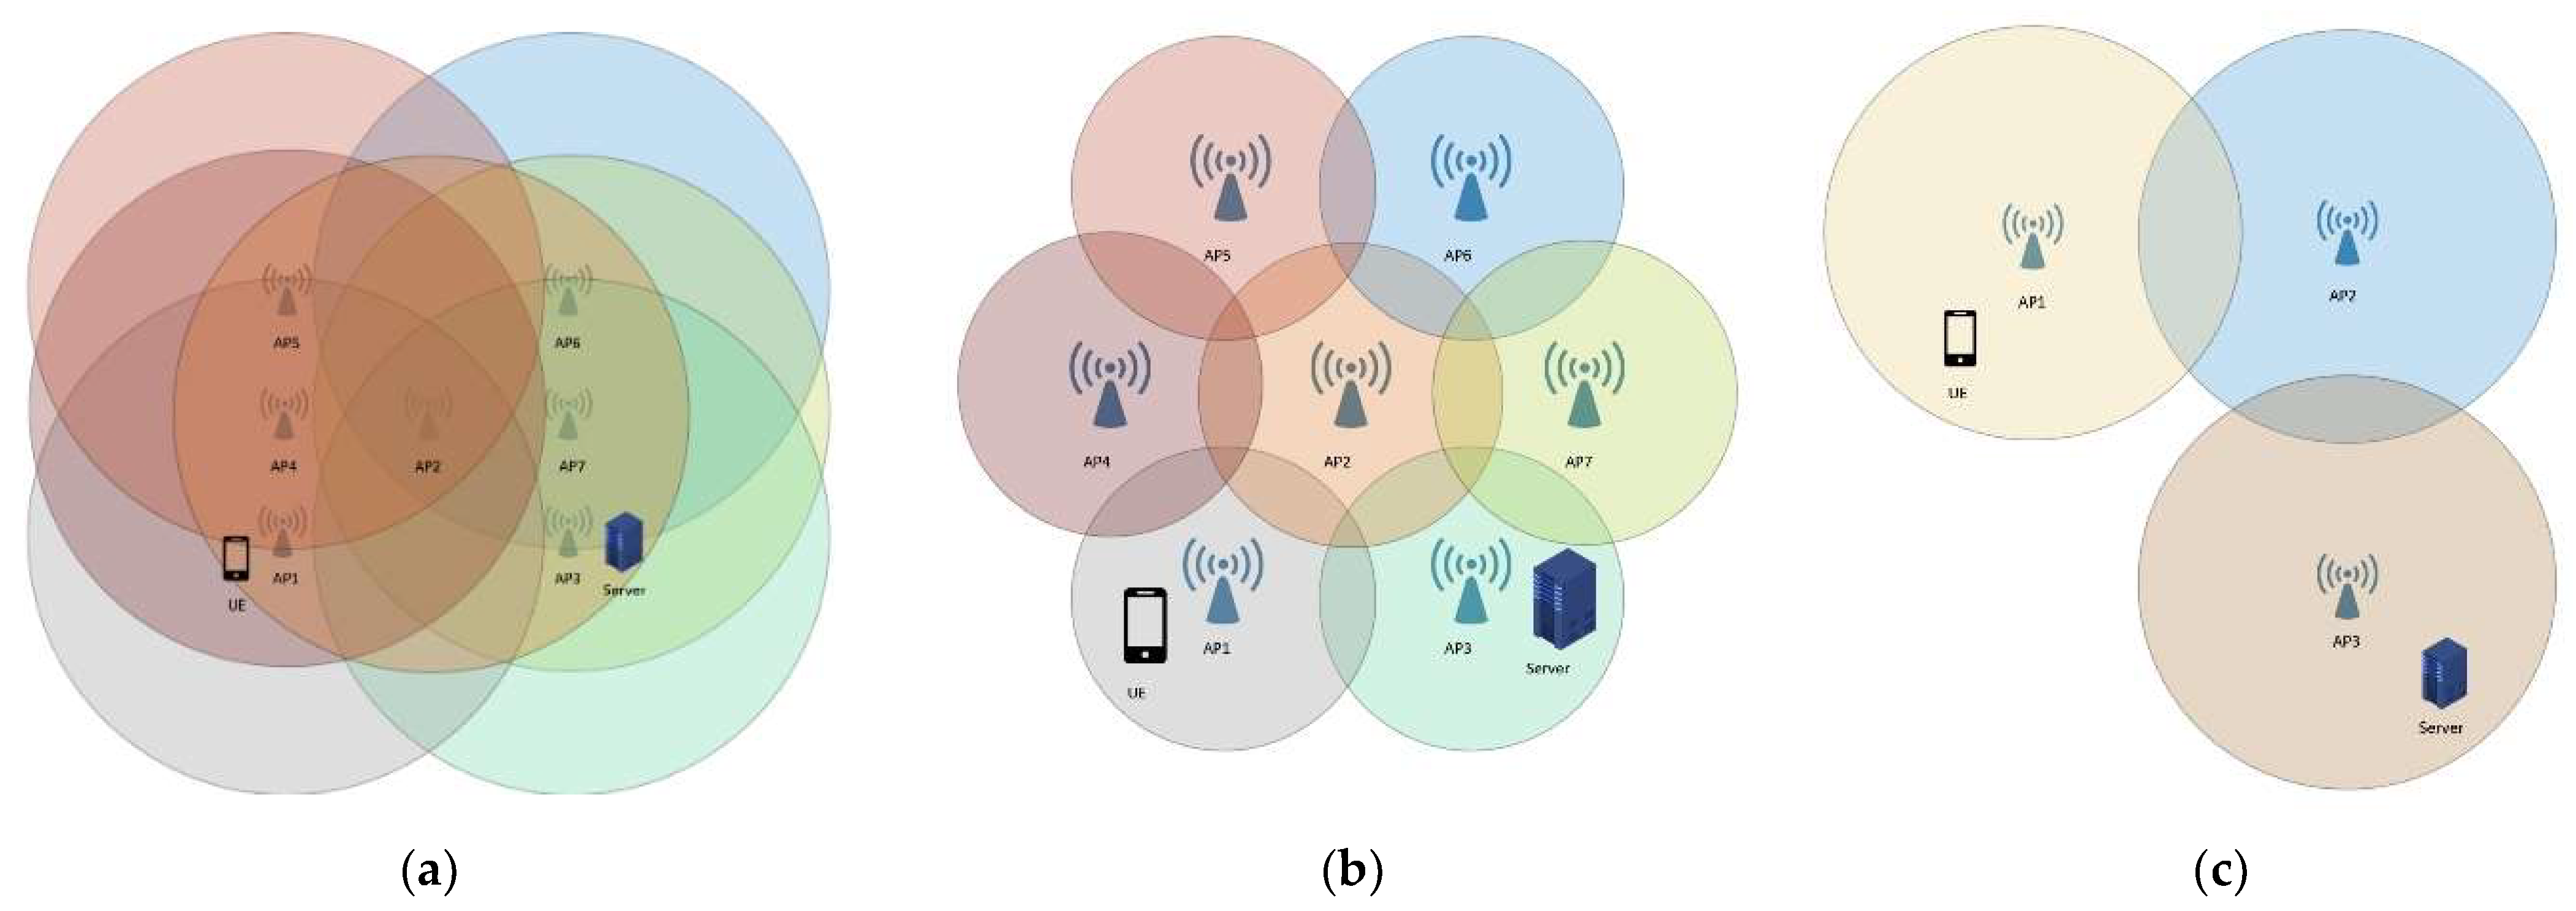
4.1. Experimental Scenarios
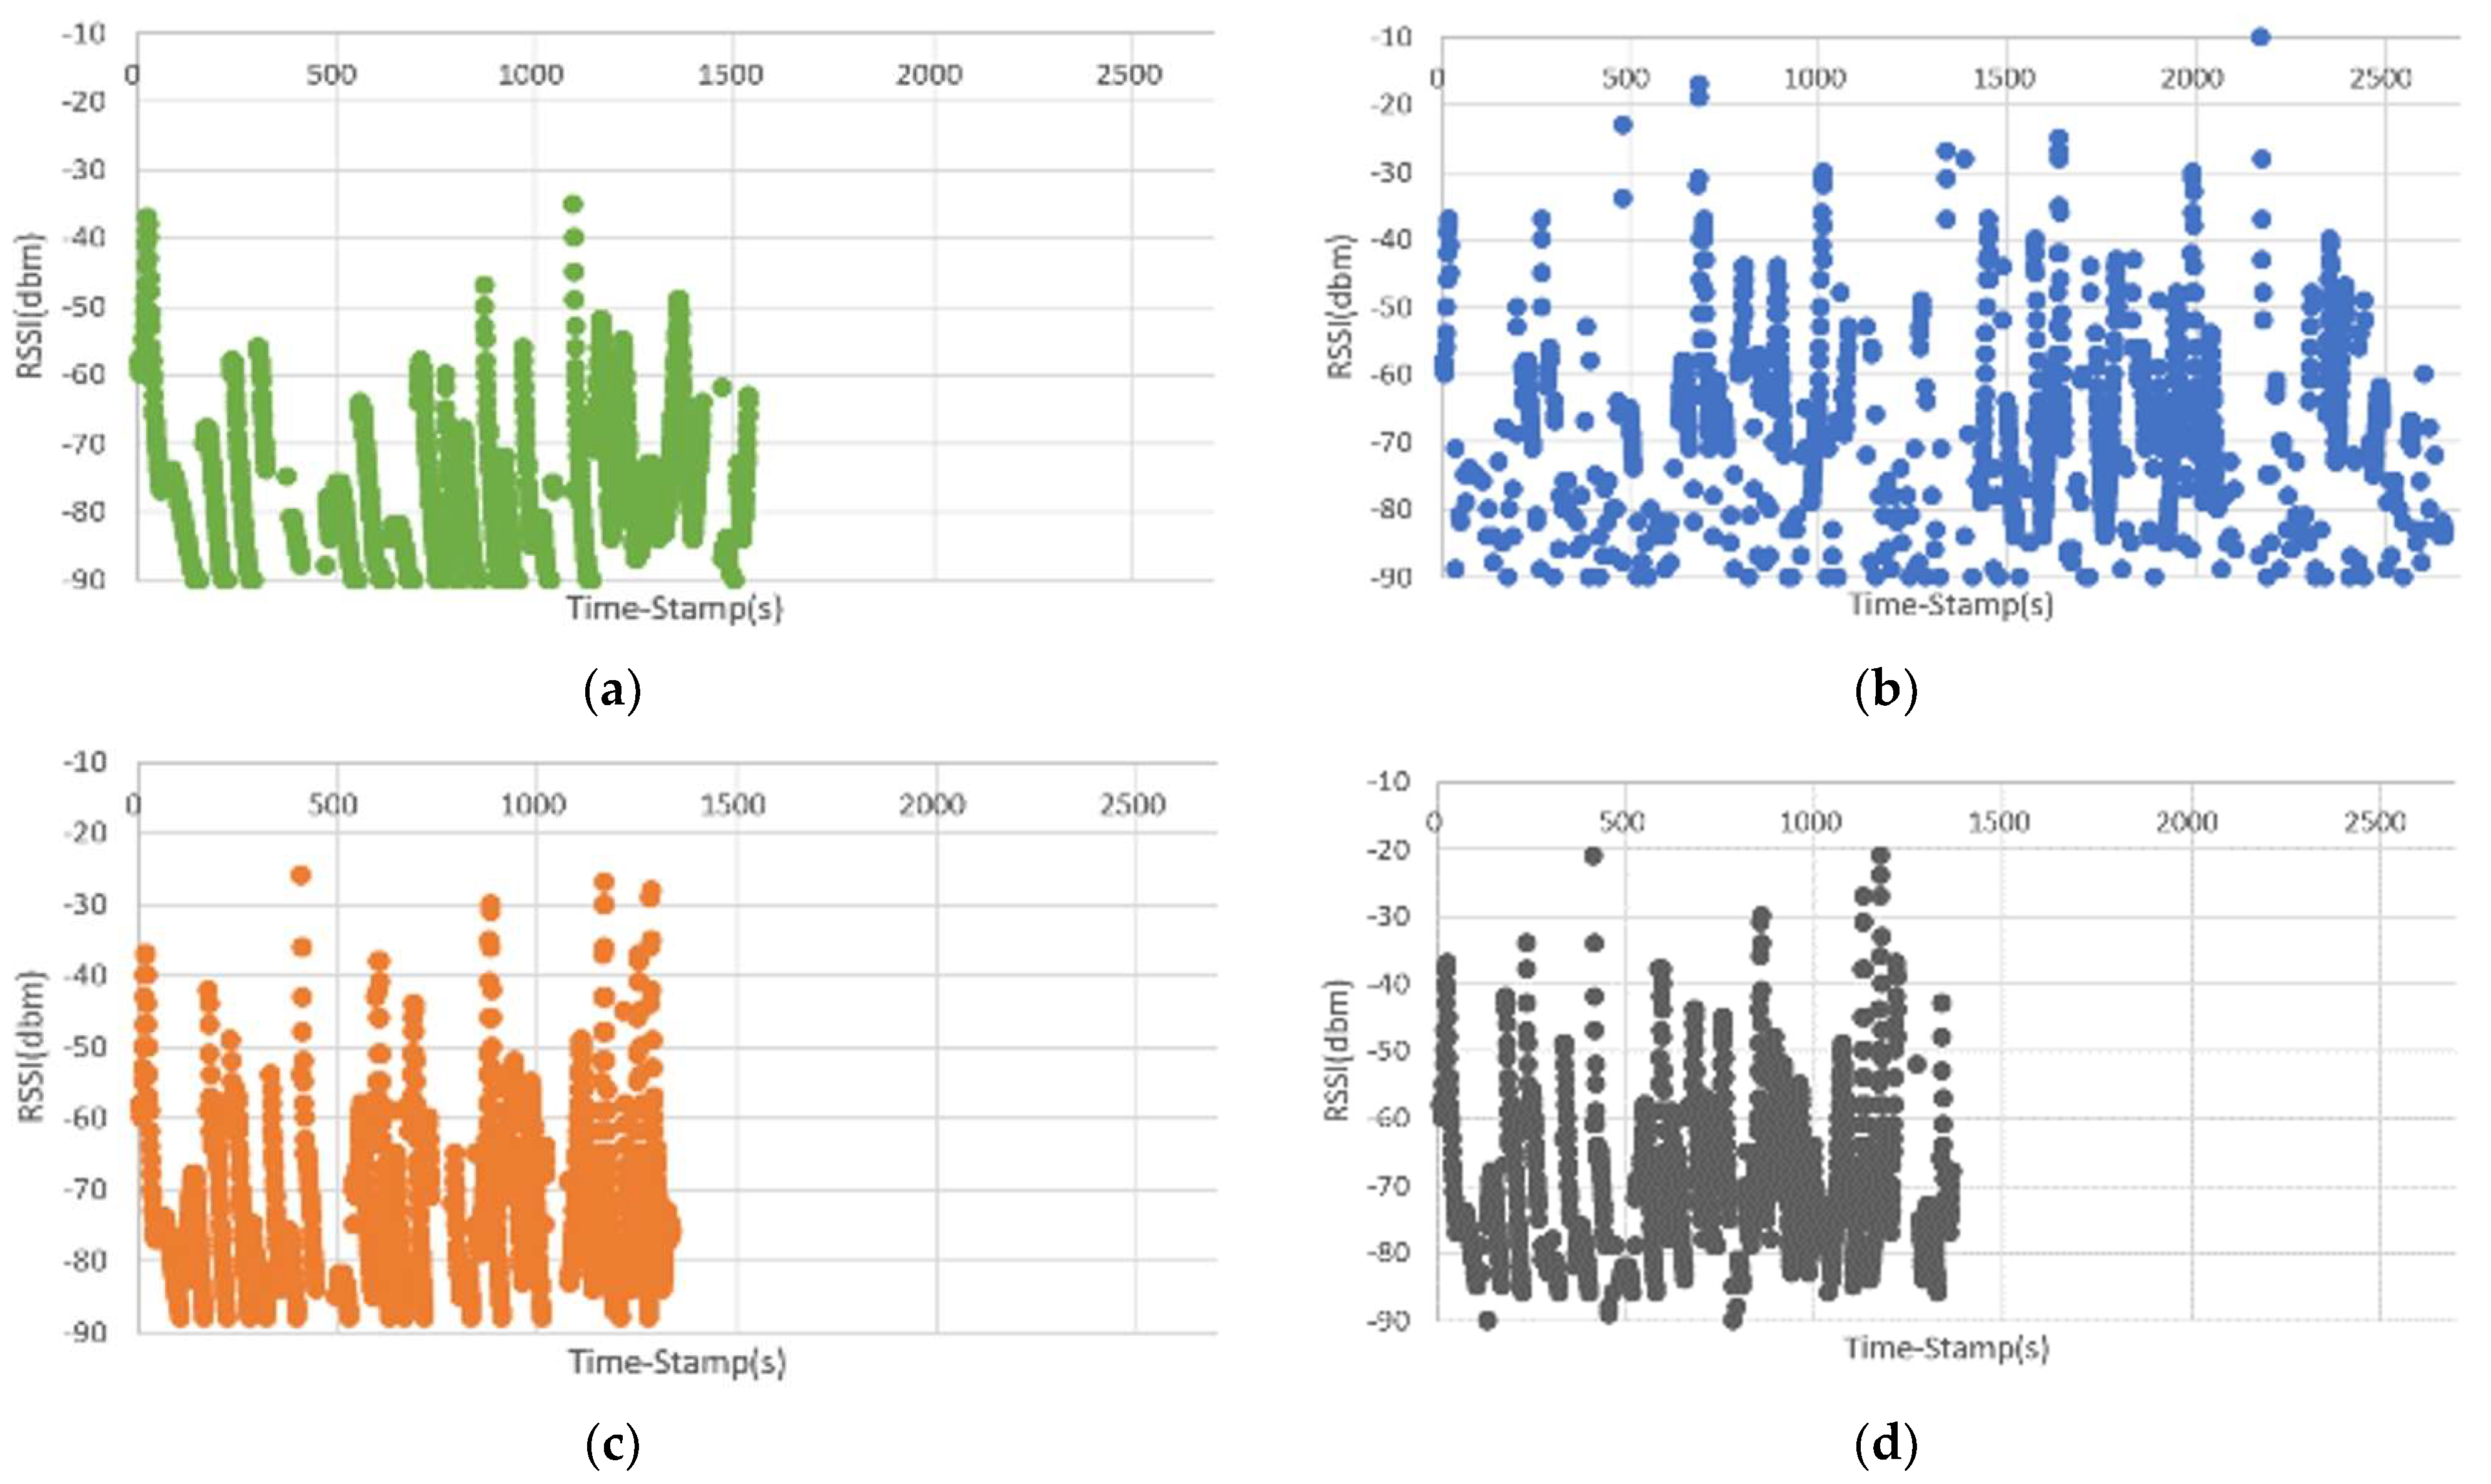
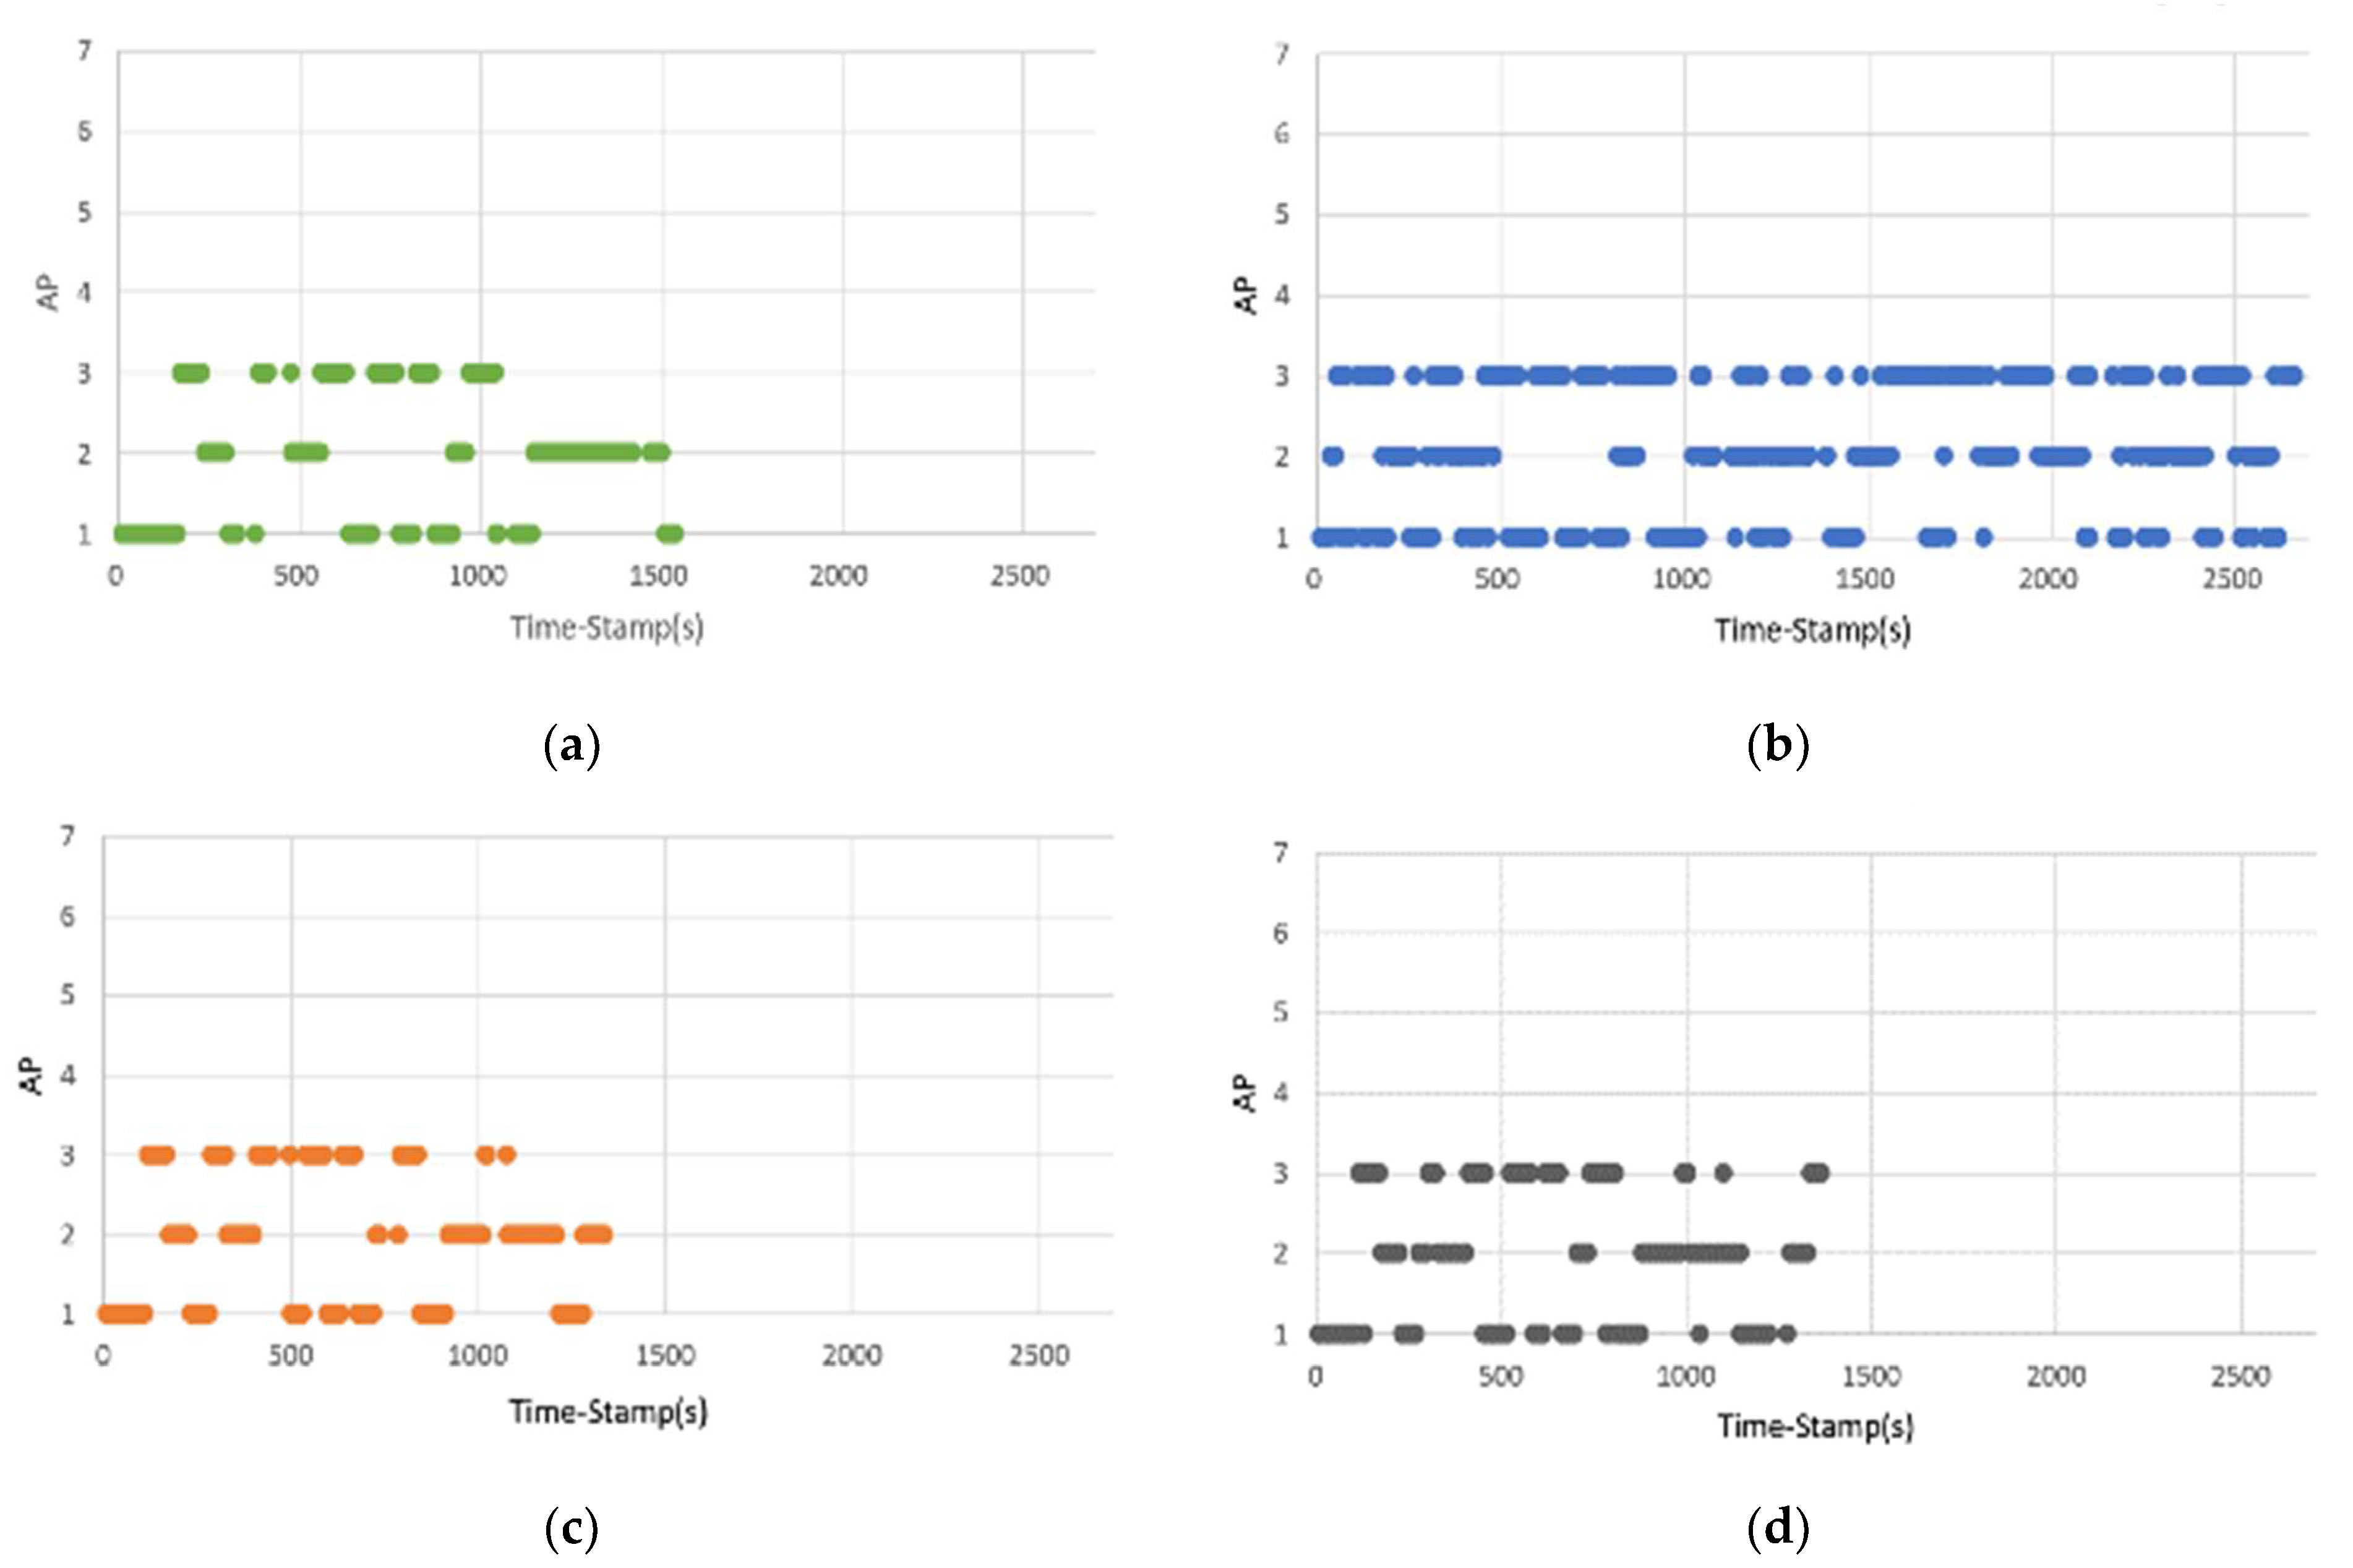
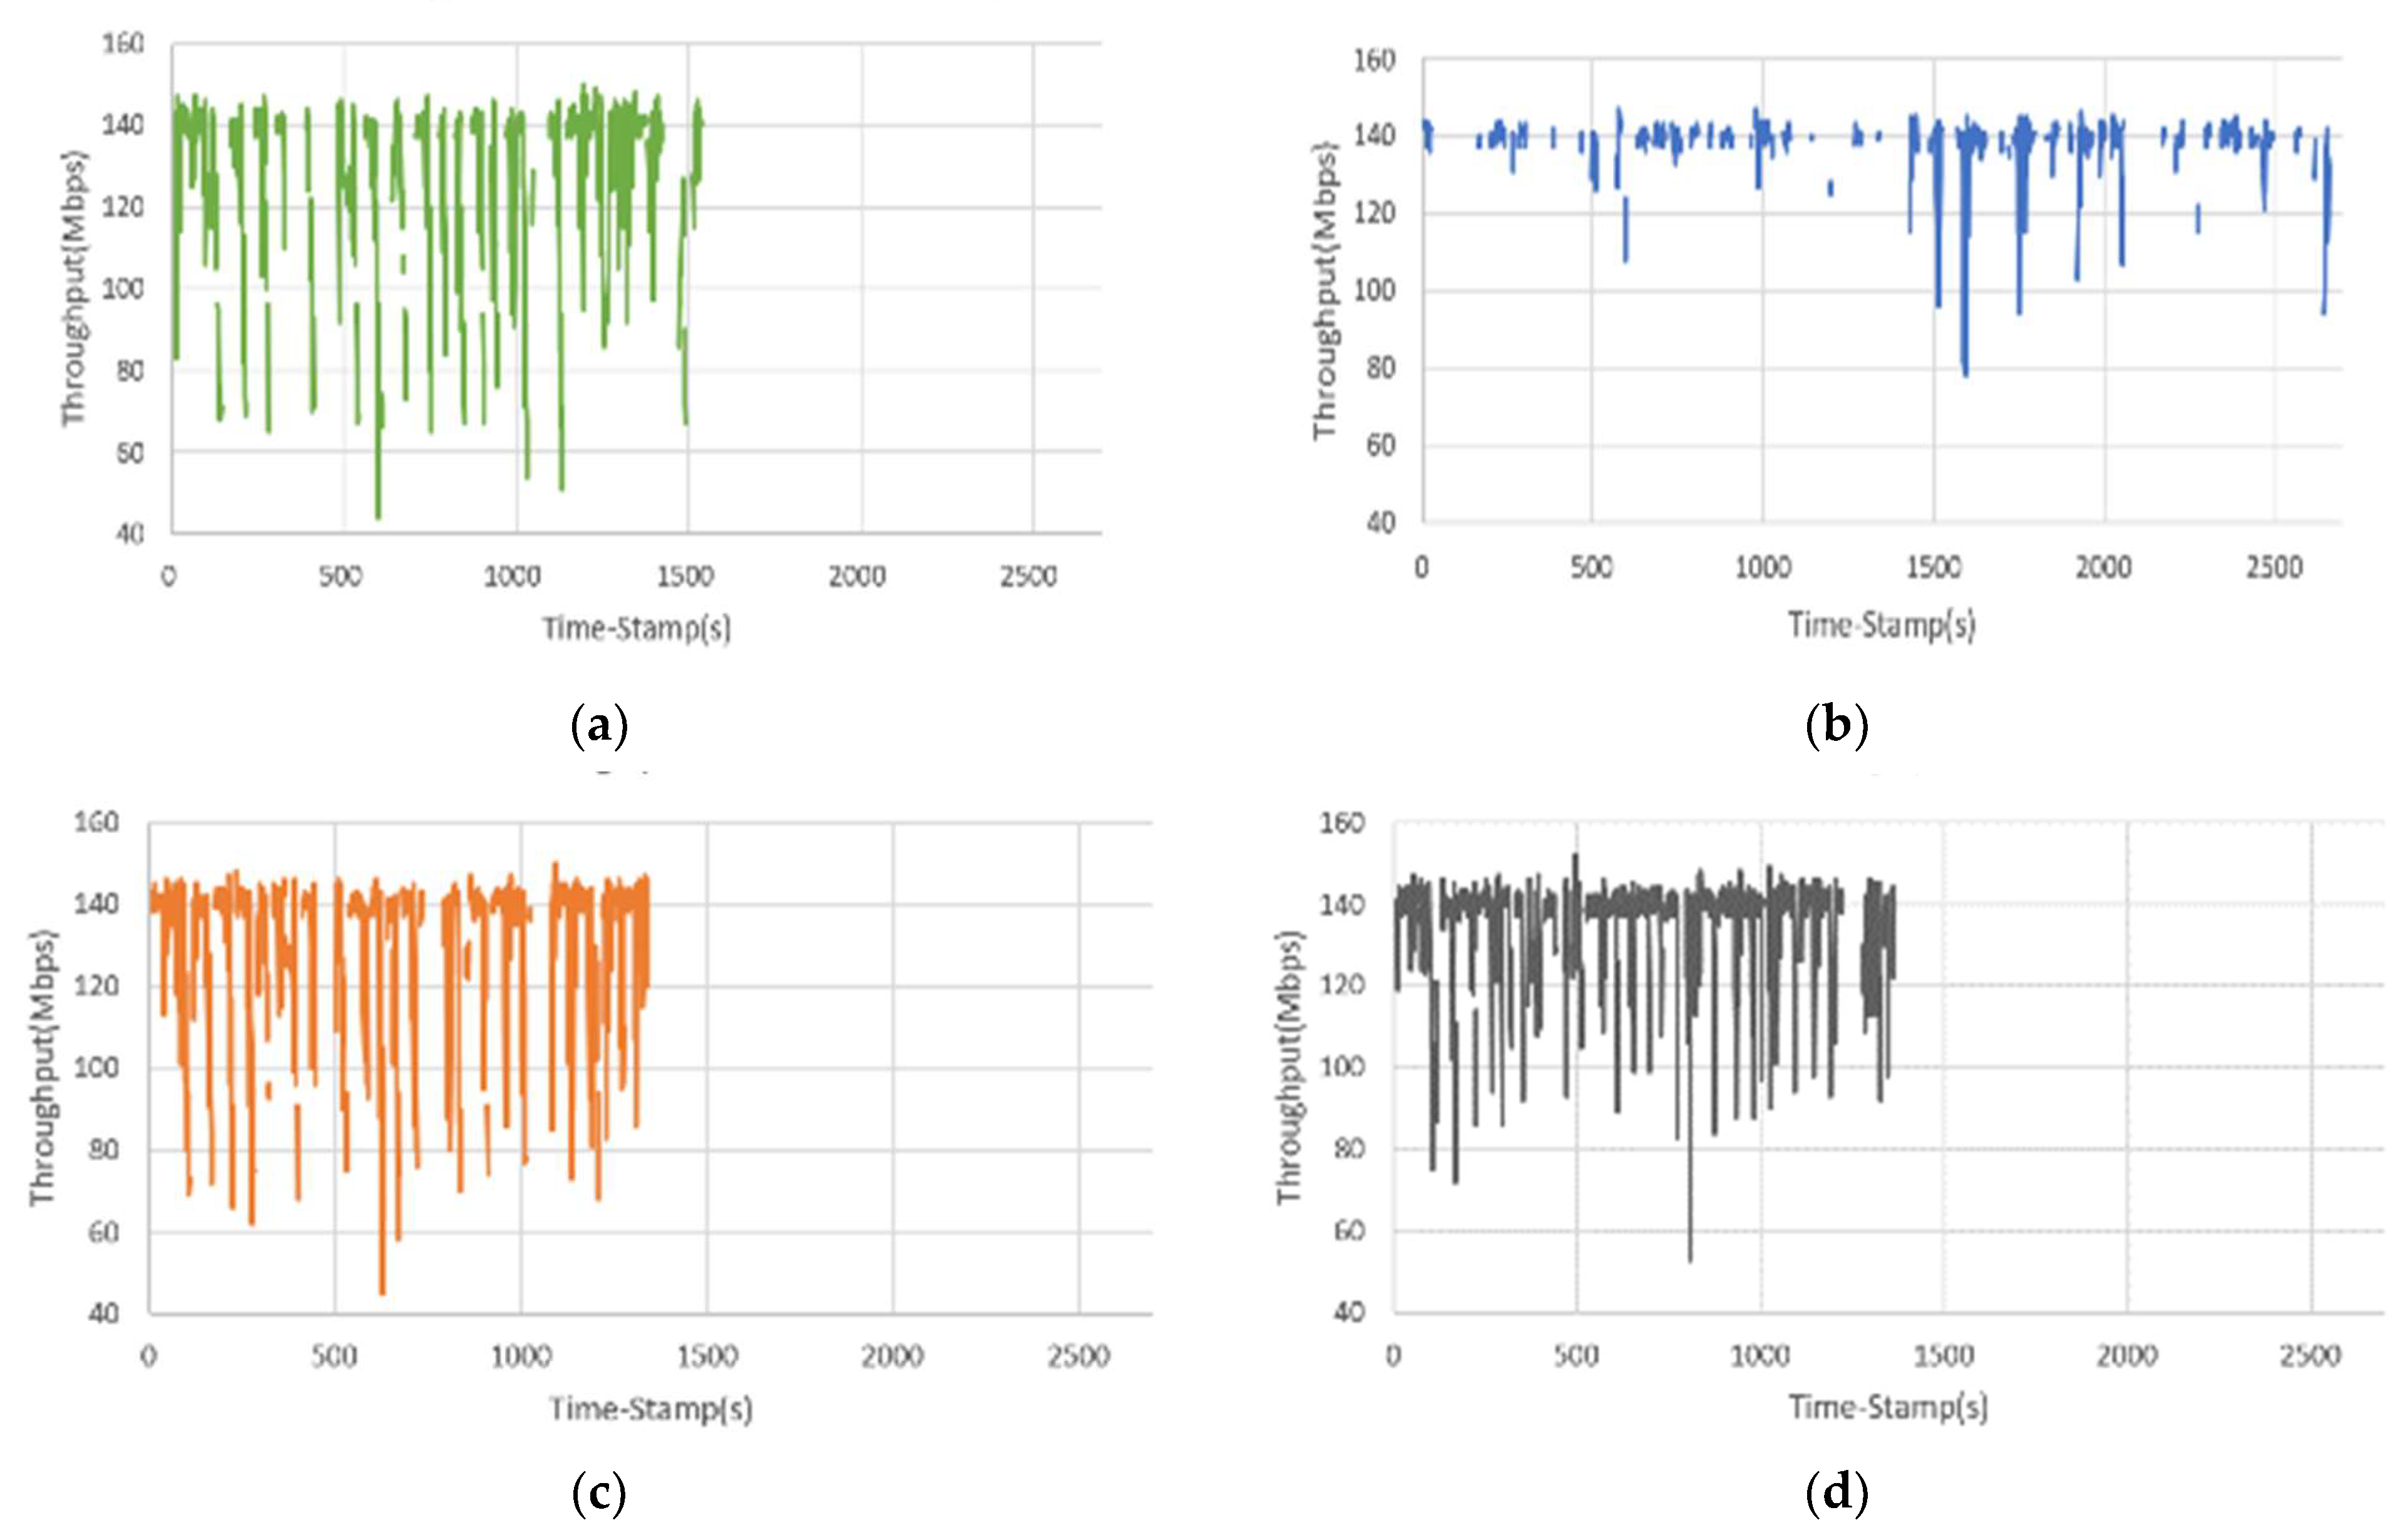
4.2. Performance Analysis
5. Conclusions
Author Contributions
Funding
Institutional Review Board Statement
Informed Consent Statement
Data Availability Statement
Conflicts of Interest
References
- Nahida, K.; Yin, C.; Hu, Y.; Arain, Z.A.; Pan, C.; Khan, I.; Zhang, Y.; Rahman, G.M.S. Handover based on AP load in software defined Wi-Fi systems. J. Commun. Netw. 2017, 19, 596–604. [Google Scholar] [CrossRef]
- Choudhari, D.P.; Dorle, S.S. Maximization of packet delivery ratio for DADCQ protocol after removal of Eavesdropping and DDoS attacks in VANET. In Proceedings of the 2019 10th International Conference on Computing, Communication and Networking Technologies (ICCCNT), IEEE, Kanpur, India, 6–8 July 2019; pp. 1–8. [Google Scholar]
- Shi, J.; Wang, Y.; Li, C.; Jiang, Y. Test method of power and packet loss rate in smart home. In Proceedings of the 2013 International Conference on Mechatronic Sciences, Electric Engineering and Computer (MEC), IEEE, Shenyang, China, 20–22 December 2013; pp. 729–732. [Google Scholar]
- Neeraja, S.; Rao, G.S. A Comparative Study on Handoff Algorithms for GSM and CDMA Cellular Networks. Int. J. Electr. Comput. Eng. 2017, 7, 1219–1227. [Google Scholar] [CrossRef]
- Shayea, I.; Ismail, M.; Nordin, R. Advanced handover techniques in LTE-Advanced system. In Proceedings of the 2012 International Conference on Computer and Communication Engineering (ICCCE), IEEE, Kuala Lumpur, Malaysia, 3–5 July 2012; pp. 74–79. [Google Scholar]
- Rehman, A.U.; Roslee, M.B.; Jiat, T.J. A Survey of Handover Management in Mobile HetNets: Current Challenges and Future Directions. Appl. Sci. 2023, 13, 3367. [Google Scholar] [CrossRef]
- Ahuja, K.; Singh, B.; Khanna, R. Network selection algorithm based on link quality parameters for heterogeneous wireless networks. Optik 2014, 125, 3657–3662. [Google Scholar] [CrossRef]
- Yew, H.T.; Chekima, A.; Kiring, A.; Mbulwa, A.I.; Dargham, J.A.; Chung, S.K. RSS Based Vertical Handover Schemes in Heterogeneous Wireless Networks: Past, Present & Future. In Proceedings of the 2020 IEEE 2nd International Conference on Artificial Intelligence in Engineering and Technology (IICAIET), IEEE, Kota Kinabalu, Malaysia, 26–27 September 2020; pp. 1–5. [Google Scholar]
- Dhar Roy, S.; Vamshidhar Reddy, S.R. Signal strength ratio based vertical handoff decision algorithms in integrated heterogeneous networks. Wirel. Pers. Commun. 2014, 77, 2565–2585. [Google Scholar] [CrossRef]
- Bhatt, M.C.; Ahluwalia, H.S. Travelling distance prediction based handoff optimization in wireless networks. In Proceedings of the 2017 International Conference on Intelligent Computing and Control Systems (ICICCS), IEEE, Madurai, India, 15–16 June 2017; pp. 947–952. [Google Scholar]
- Bhushan, S.; Bali, R.S.; Kaur, A. Spectrum hand off in cognitive radio network using dynamic threshold. In Proceedings of the 2015 International Conference on Green Computing and Internet of Things (ICGCIoT), IEEE, Greater Noida, India, 8–10 October 2015; pp. 1292–1297. [Google Scholar]
- Chung, S.K.; Goh, M.I.; Yew, H.T.; Chua, B.L.; Husain, S.S.; Mbulwa, A.I. Enhanced Bandwidth Based Handover Decision Making Algorithm For Small Cell Wireless Networks. In Proceedings of the 2020 IEEE 2nd International Conference on Artificial Intelligence in Engineering and Technology (IICAIET), IEEE, Kota Kinabalu, Malaysia, 26–27 September 2020; pp. 1–6. [Google Scholar]
- Jayarekha, P.; Masali, S.; Bhargavi, D.K. Effective algorithm to minimize target FAPs during hand-in and hand-off for 3GPP-LTE femtocell network. In Proceedings of the 2015 IEEE International Advance Computing Conference (IACC), Bangalore, India, 12–13 June 2015; pp. 211–216. [Google Scholar]
- Aisa, J.; Fotouhi, H.; Almeida, L.; Villarroel, J.L. DoTHa-a Double-Threshold Hand-off algorithm for managing mobility in wireless mesh networks. In Proceedings of the 2016 IEEE 21st International Conference on Emerging Technologies and Factory Automation (ETFA), Berlin, Germany, 6–9 September 2016; pp. 1–8. [Google Scholar]
- Kaur, A. An overview of quality of service computer network. Indian J. Comput. Sci. Eng. 2011, 2, 470–475. [Google Scholar]
- Wishnu, A.; Sugiantoro, B. Analysis of Quality of Service (QoS) Youtube Streaming Video Service in Wireless Network in Faculty of Science and Technology UIN Sunan Kalijaga. Int. J. Inform. Dev. 2018, 7, 74–79. [Google Scholar] [CrossRef]
- Rizkallah, J.; Akkari, N. SDN-based vertical handover decision scheme for 5G networks. In Proceedings of the 2018 IEEE Middle East and North Africa Communications Conference (MENACOMM), IEEE, Jounieh, Lebanon, 18–20 April 2018; pp. 1–6. [Google Scholar]
- Munde, S.S.; Jadhav, V. Implementation of an Efficient Handover Algorithm on AP Using Software-Defined Wi-Fi Systems. In Recent Trends in Electronics and Communication, Lecture Notes in Electrical Engineering; Springer: Singapore, 2022; Volume 777, pp. 1213–1226. [Google Scholar]
- Kyung, Y.; Kim, T.-K. QoS-Aware Flexible Handover Management in Software-Defined Mobile Networks. Appl. Sci. 2020, 10, 4264. [Google Scholar] [CrossRef]
- Zhang, M.; Li, N.; Jing, Z.; Xing, Y. Research and application of 2.4 G wireless precise positioning in substation. In Proceedings of the 2017 IEEE Conference on Energy Internet and Energy System Integration (EI2), IEEE, Beijing, China, 26–28 November 2017; pp. 1–5. [Google Scholar]
- Fontes, R.R.; Afzal, S.; Brito, S.H.; Santos, M.A.; Rothenberg, C.E. Mininet-WiFi: Emulating software-defined wireless networks. In Proceedings of the 2015 11th International Conference on Network and Service Management (CNSM), IEEE, Barcelona, Spain, 9–13 November 2015; pp. 384–389. [Google Scholar]
- Rothenberg, C.; Fontes, R. Wireless Network Emulation with Mininet-WiFi; Christian Esteve Rothenberg: Campinas, Brazil, 2019. [Google Scholar]
- Larasati, H.T.; Ilma, F.H.; Nuhamara, B.; Mustafa, A.; Hakimi, R.; Mulyana, E. Performance evaluation of handover association mechanisms in sdn-based wireless network. In Proceedings of the 2017 3rd International Conference on Wireless and Telematics (ICWT), IEEE, Palembang, Indonesia, 27–28 July 2017; pp. 103–108. [Google Scholar]
- Iperf Network Traffic Generation Tool. Available online: https://iperf.fr/ (accessed on 12 March 2022).
- Christensen, M.J.; Richter, T. Achieving reliable UDP transmission at 10 Gb/s using BSD socket for data acquisition systems. J. Instrum. 2020, 15, T09005. [Google Scholar] [CrossRef]


| Parameter | Scenario 1 | Scenario 2 | Scenario 3 |
|---|---|---|---|
| Number of APs | 7 | 7 | 3 |
| AP Coverage | 125 m | 125 m | 25 m |
| AP Operating Mode | 802.11 ac | 802.11 ac | 802.11 ac |
| Channel Testbed | 5G Hz | 5G Hz | 5G Hz |
| Testruns | 1000 | 1000 | 1000 |
| UE Mobility Model | Random Direction | Random Direction | Random Direction |
| UE Moving Velocity | 0.9~1.5 m/s | 0.9~1.5 m/s | 0.9~1.5 m/s |
| Symbol | Value | Symbol | Value |
|---|---|---|---|
| T | −70 dBm | HM2ndgood | 40 dBm |
| HMGood | 50 dBm | HM2ndbad | 20 dBm |
| HMBad | 30 dBm | TQoS | 0.78 |
| TS_HO | −70 dBm | HMQoS | 10 |
| HMS_HO | 5 dBm | RSSIMax | −1 dBm |
| TU_HO | −88 dBm | RSSIMin | −90 dBm |
| Handover Algorithm Experimental Results | Mininet-WiFi | DoTHa | OHA | OHAQR | |
|---|---|---|---|---|---|
| Scenario 1 | Number of Handovers | 17 | 248 | 13 | 15 |
| Act. TP (Mbps) | 81 | 106 | 106 | 123 | |
| Avg. TP (Mbps) | 127 | 134 | 131 | 135 | |
| Avg. PLR (%) | 8 | 5 | 7 | 5 | |
| Scenario 2 | Number of Handovers | 10 | 214 | 17 | 27 |
| Act. TP (Mbps) | 100 | 101 | 119 | 102 | |
| Avg. TP (Mbps) | 125 | 129 | 133 | 135 | |
| Avg. PLR (%) | 10 | 7 | 6 | 4 | |
| Scenario 3 | Number of Handovers | 1 | 2 | 2 | 2 |
| Act. TP (Mbps) | 45 | 59 | 60 | 68 | |
| Avg. TP (Mbps) | 119 | 132 | 119 | 126 | |
| Avg. PLR (%) | 13 | 5 | 12 | 9 | |
Disclaimer/Publisher’s Note: The statements, opinions and data contained in all publications are solely those of the individual author(s) and contributor(s) and not of MDPI and/or the editor(s). MDPI and/or the editor(s) disclaim responsibility for any injury to people or property resulting from any ideas, methods, instructions or products referred to in the content. |
© 2023 by the authors. Licensee MDPI, Basel, Switzerland. This article is an open access article distributed under the terms and conditions of the Creative Commons Attribution (CC BY) license (https://creativecommons.org/licenses/by/4.0/).
Share and Cite
Chu, H.-C.; Wong, C.-E.; Cheng, W.-M.; Lai, H.-C. User QoS-Based Optimized Handover Algorithm for Wireless Networks. Sensors 2023, 23, 4877. https://doi.org/10.3390/s23104877
Chu H-C, Wong C-E, Cheng W-M, Lai H-C. User QoS-Based Optimized Handover Algorithm for Wireless Networks. Sensors. 2023; 23(10):4877. https://doi.org/10.3390/s23104877
Chicago/Turabian StyleChu, Hung-Chi, Chia-En Wong, Wei-Min Cheng, and Hong-Cheng Lai. 2023. "User QoS-Based Optimized Handover Algorithm for Wireless Networks" Sensors 23, no. 10: 4877. https://doi.org/10.3390/s23104877
APA StyleChu, H.-C., Wong, C.-E., Cheng, W.-M., & Lai, H.-C. (2023). User QoS-Based Optimized Handover Algorithm for Wireless Networks. Sensors, 23(10), 4877. https://doi.org/10.3390/s23104877