
A Memetic Algorithm for Solving the Robust Influence Maximization Problem on Complex Networks against Structural Failures


Abstract
:1. Introduction
2. Related Works
2.1. Influence Spreading Model and Evaluation Method
2.2. Definition, Evaluation, and Optimization Methods of Network Structure Robustness
3. Robust Influence Evaluation of Seeds under Network Structure Damage
3.1. Robust Influence Performance Evaluation Method
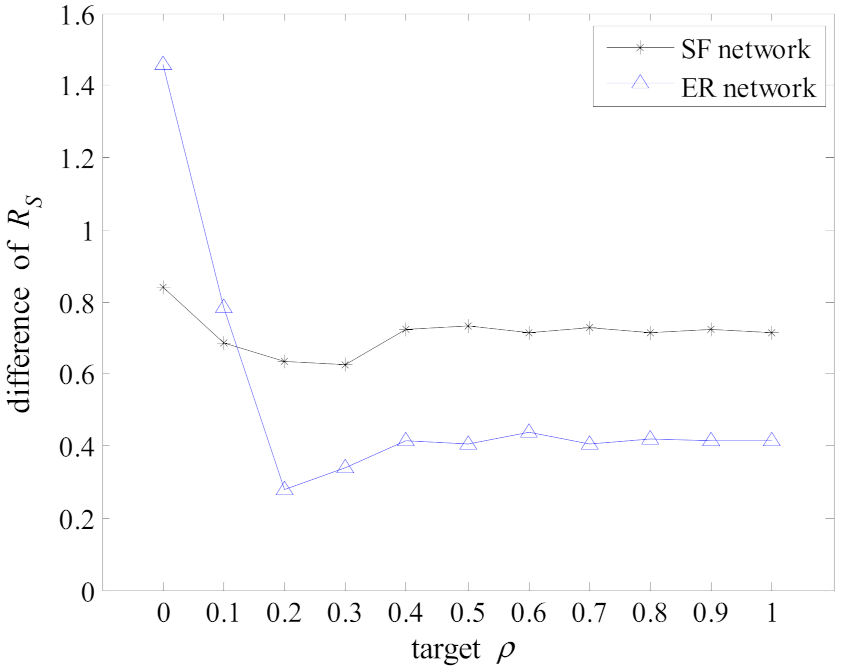
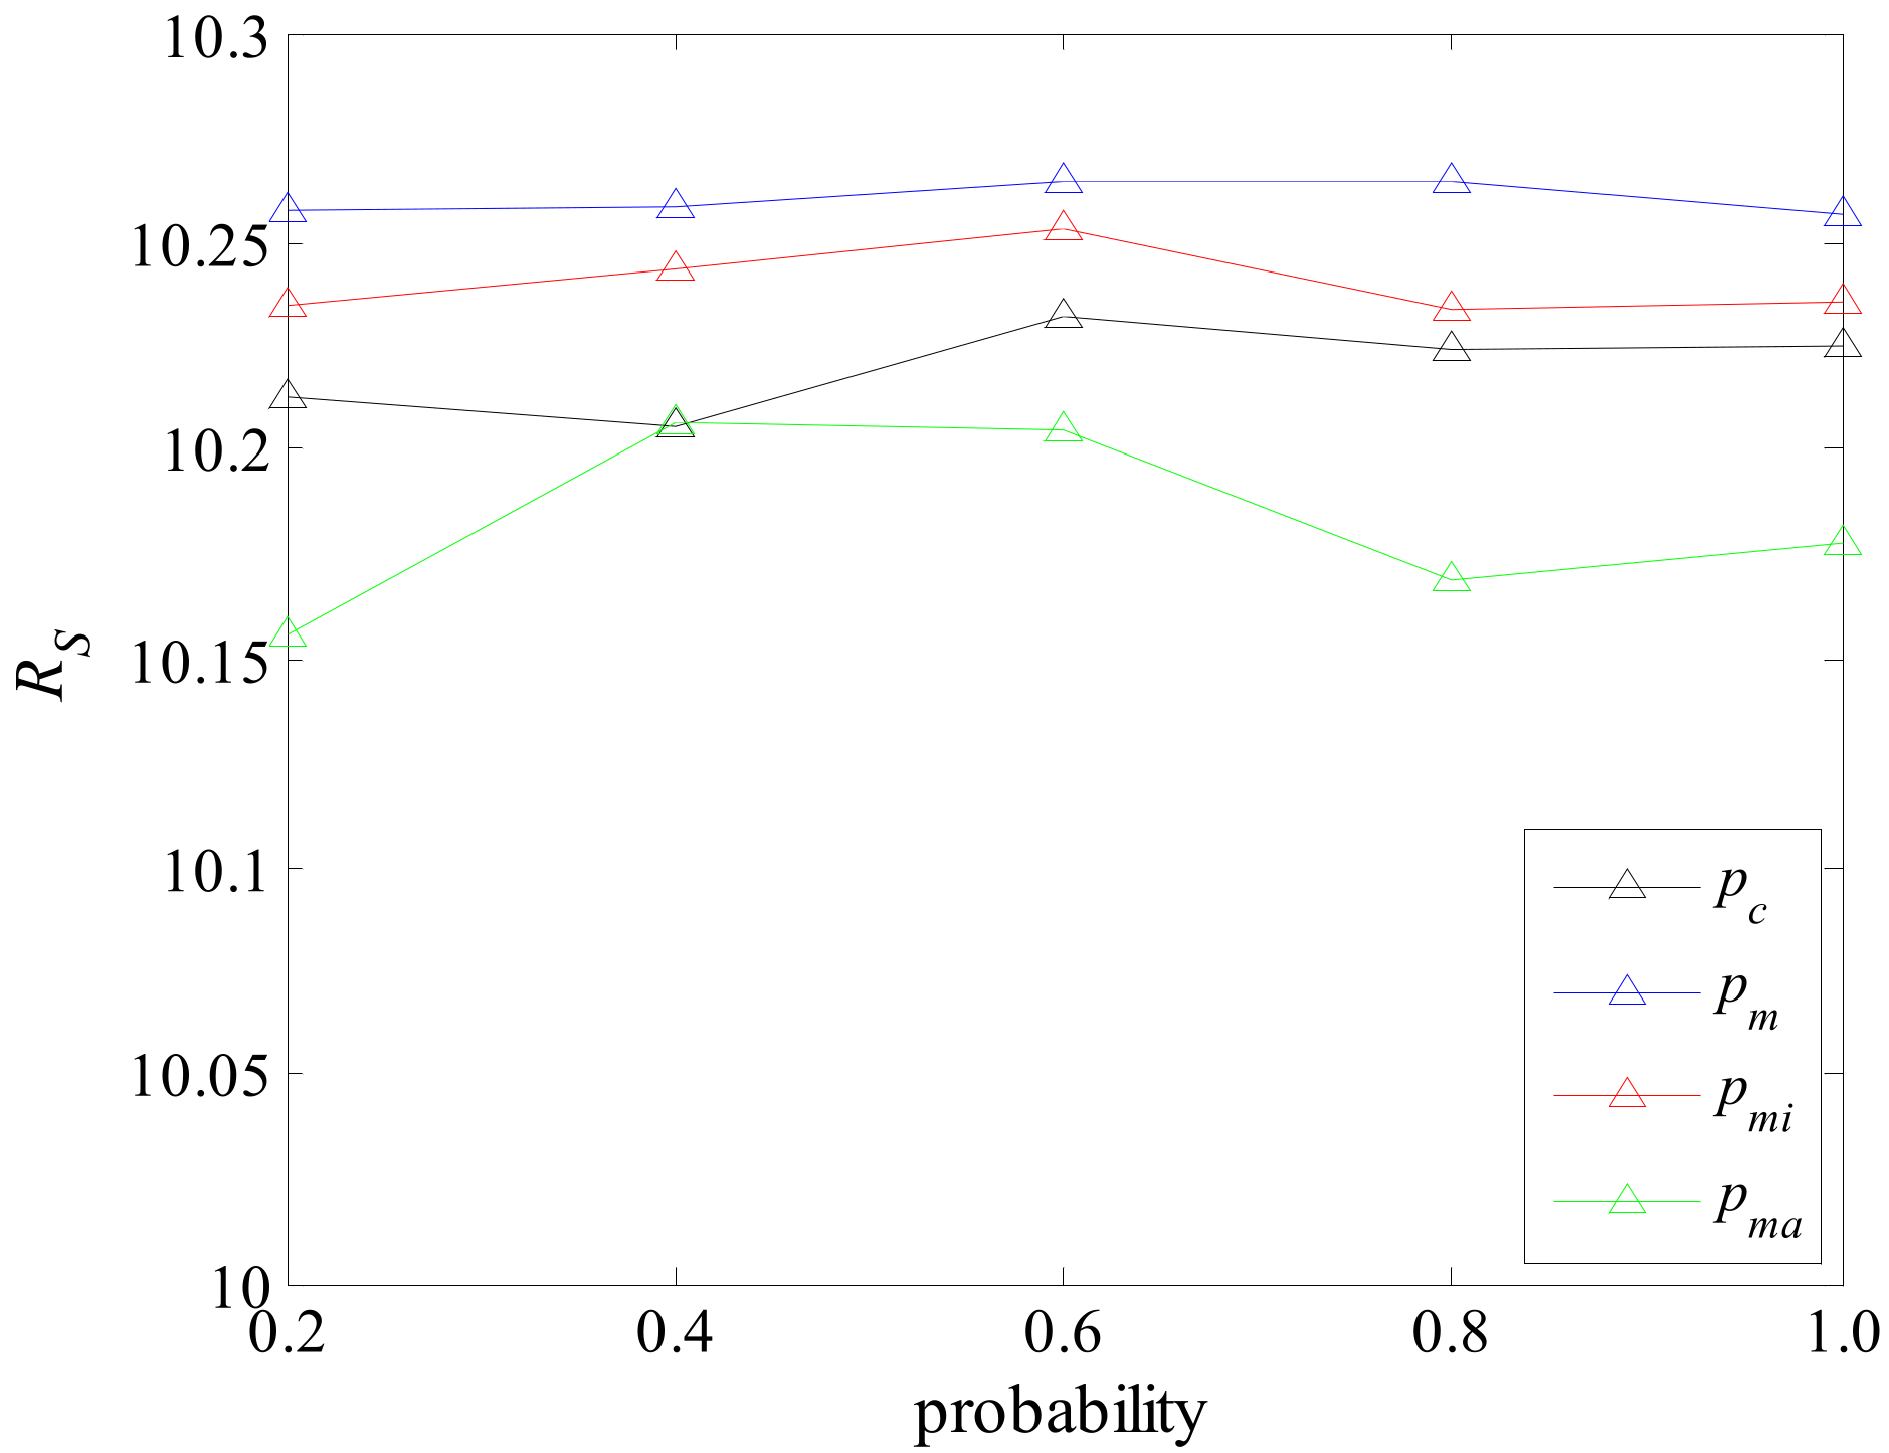
3.2. Parameter Calibration in
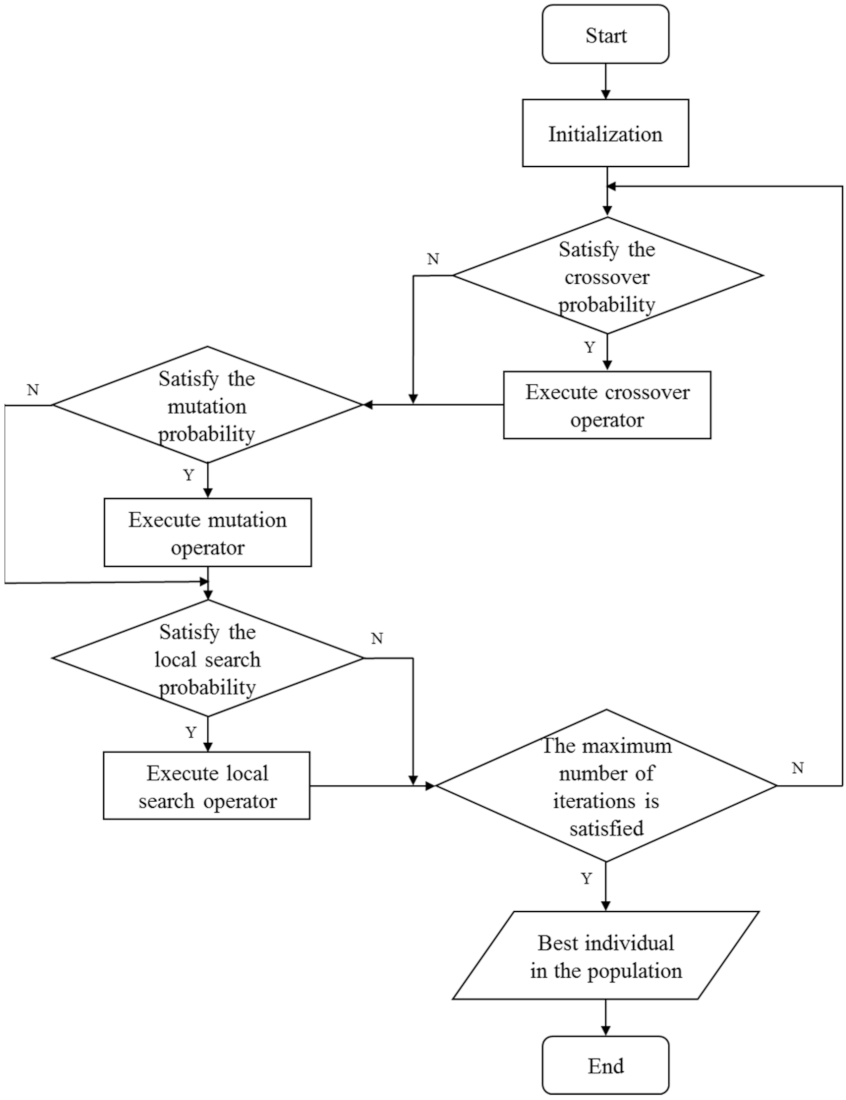
4. RIMMA Algorithm
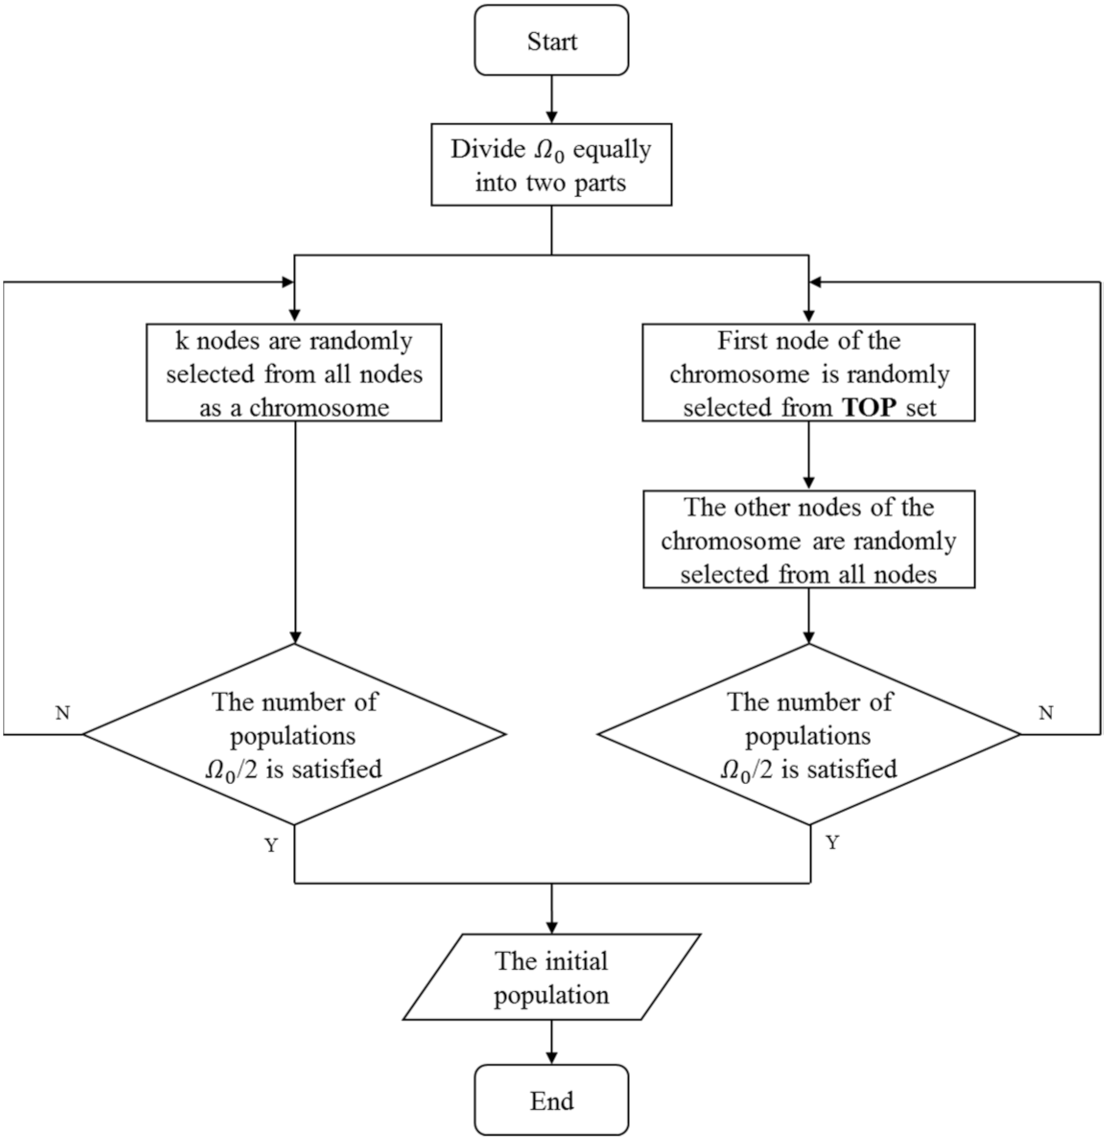
4.1. Initialization
| Algorithm 1. Initialization |
| Input: |
| Initial population size |
| Size of seed set; |
| Target network; |
| Output: |
| Initial population; |
| for to do |
| for to do |
| Randomly select a node from nodes in as the -th element in the |
| while (the -th node in is the same as the rest) do |
| Randomly select a node from nodes in to replace -th node |
| end while |
| end for |
| end for |
| for to do |
| The first node of is randomly selected from TOP set |
| for to do |
| Randomly select a node from nodes as the -th element in the |
| end for |
| end for |
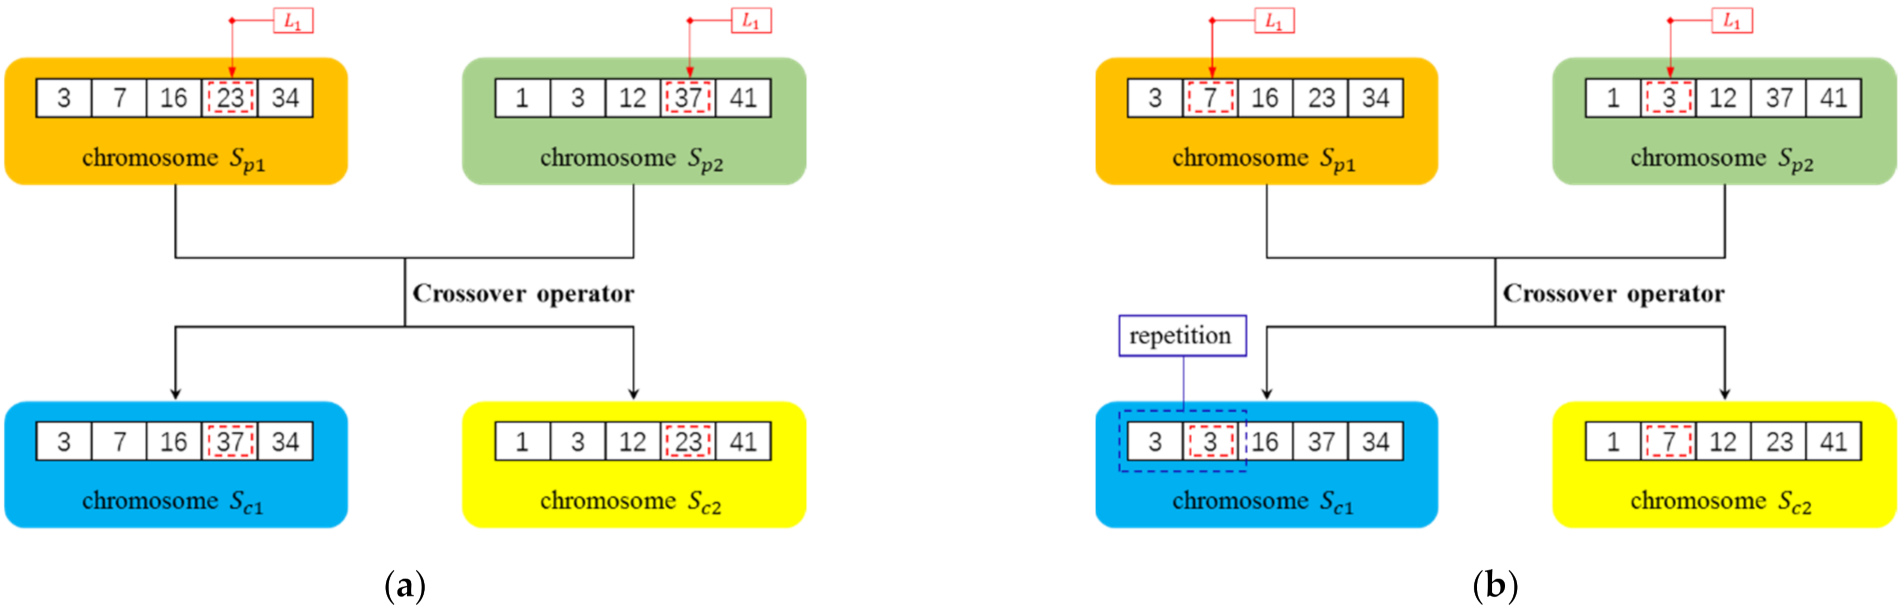
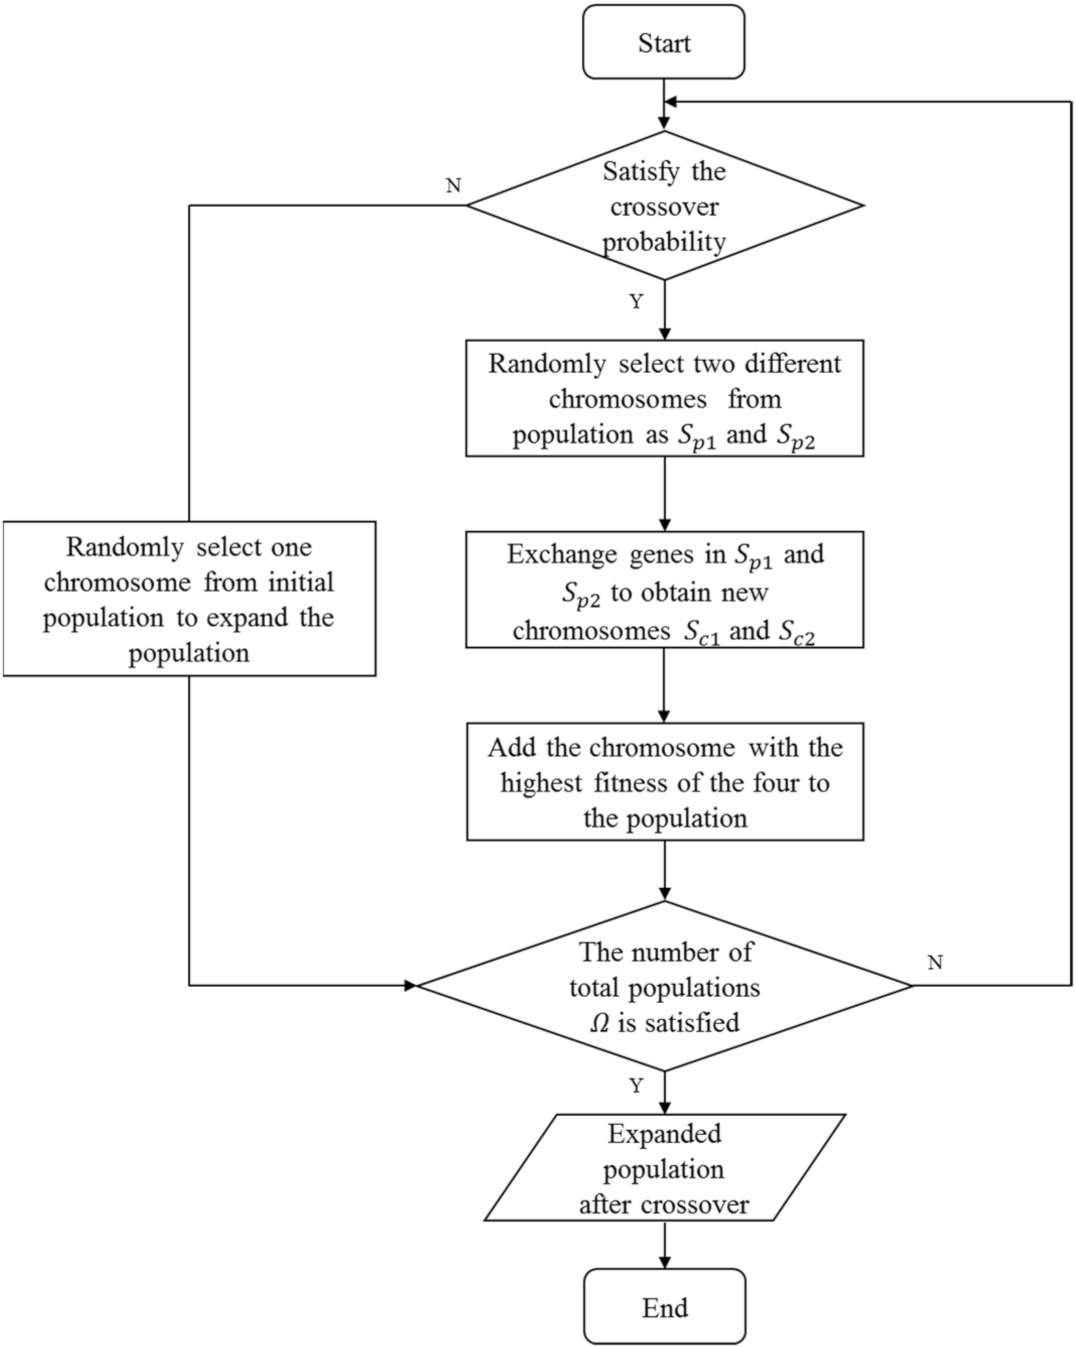
4.2. Crossover Operator
| Algorithm 2. Crossover |
| Input: |
| Initial population size |
| Total population size |
| Current generation population |
| Crossover probability; |
| Output: |
| Population after crossover; |
| for to do |
| if /* is a random number subjecting to uniform distribution between [0,1] */ |
| Randomly select two different chromosomes from the population as the parent chromosomes and |
| Randomly generate an integer in the range of |
| while (gene at on one parent chromosome is duplicated with the other) do |
| Randomly generate an integer again |
| end while |
| , |
| Remove the node at from and add the node at from to |
| Remove the node at from and add the node at from to |
| Calculate the fitness of , , , , and the chromosome with the largest fitness is denoted as |
| add to |
| else |
| randomly select a chromosome from |
| add to |
| end if |
| end for |
| Output the expanded population ; |
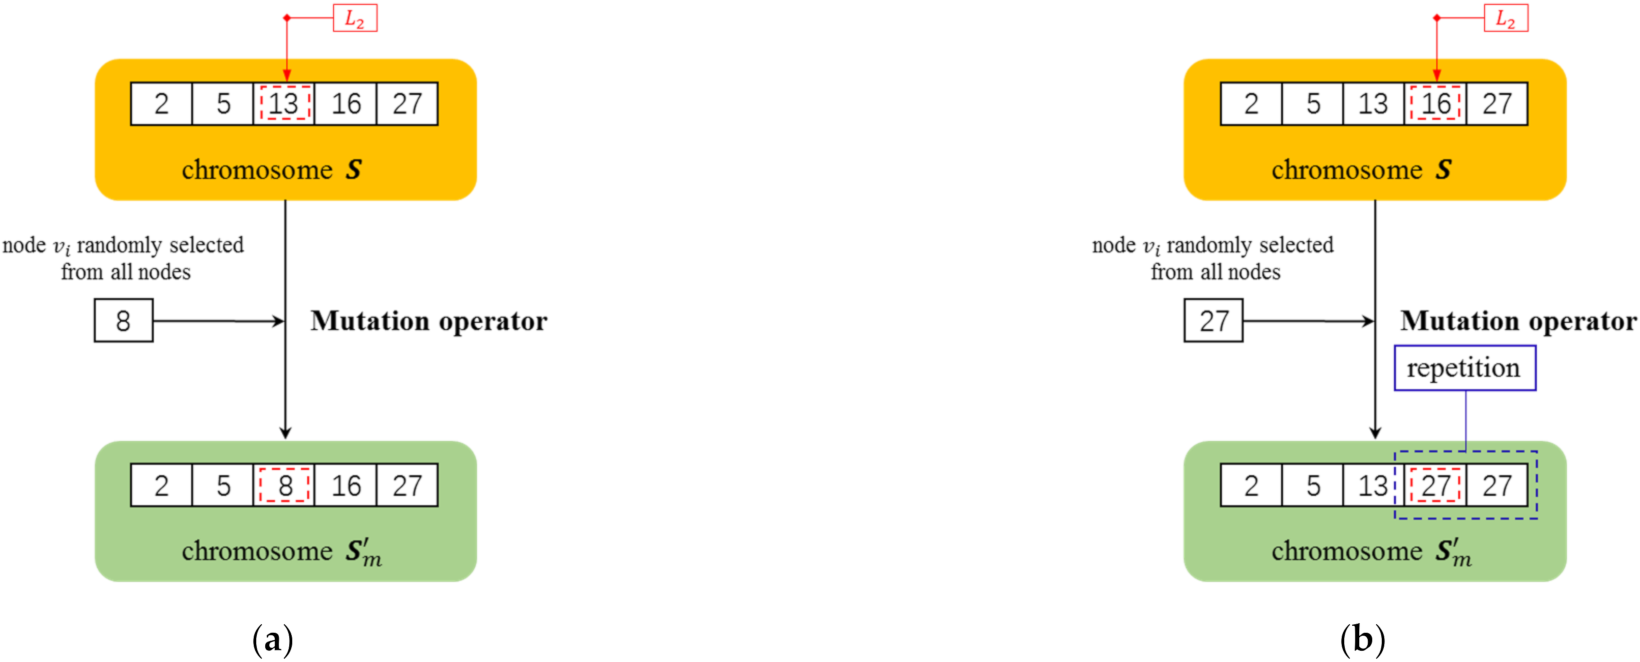
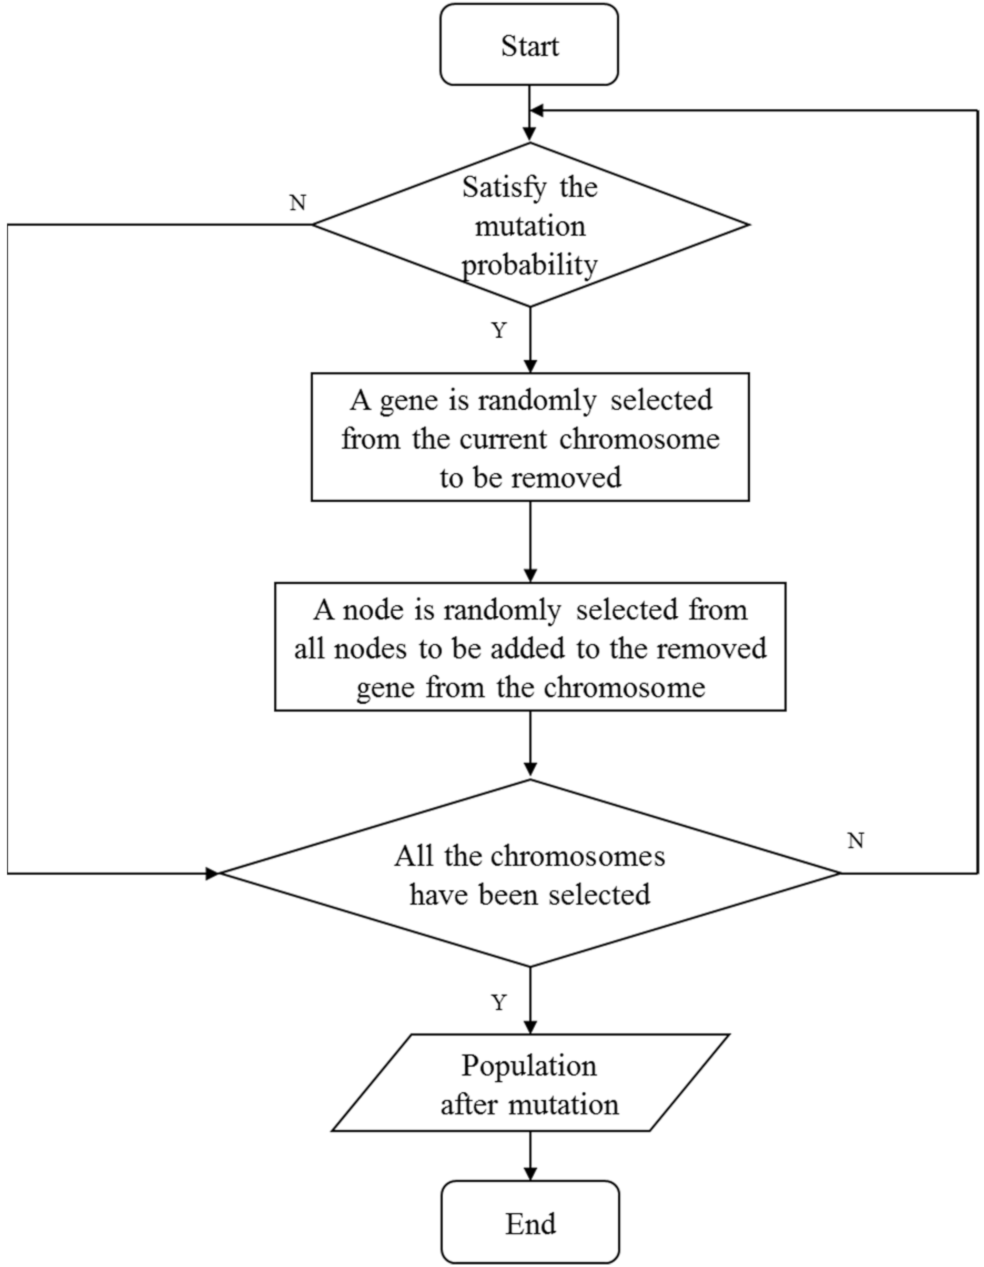
4.3. Mutation Operator
| Algorithm 3. Mutation |
| Input: |
| Population before mutation |
| Mutation probability; |
| Output: |
| Population after mutation; |
| for (each chromosome in ) do |
| if /* is a random number subjecting to uniform distribution between [0,1] */ |
| Randomly generate an integer in the range of |
| Randomly select a node from all nodes |
| while ( is duplicated with all nodes in ) do |
| Randomly select a node from all nodes again |
| end while |
| Remove the node at from and add the node to |
| end if |
| end for |
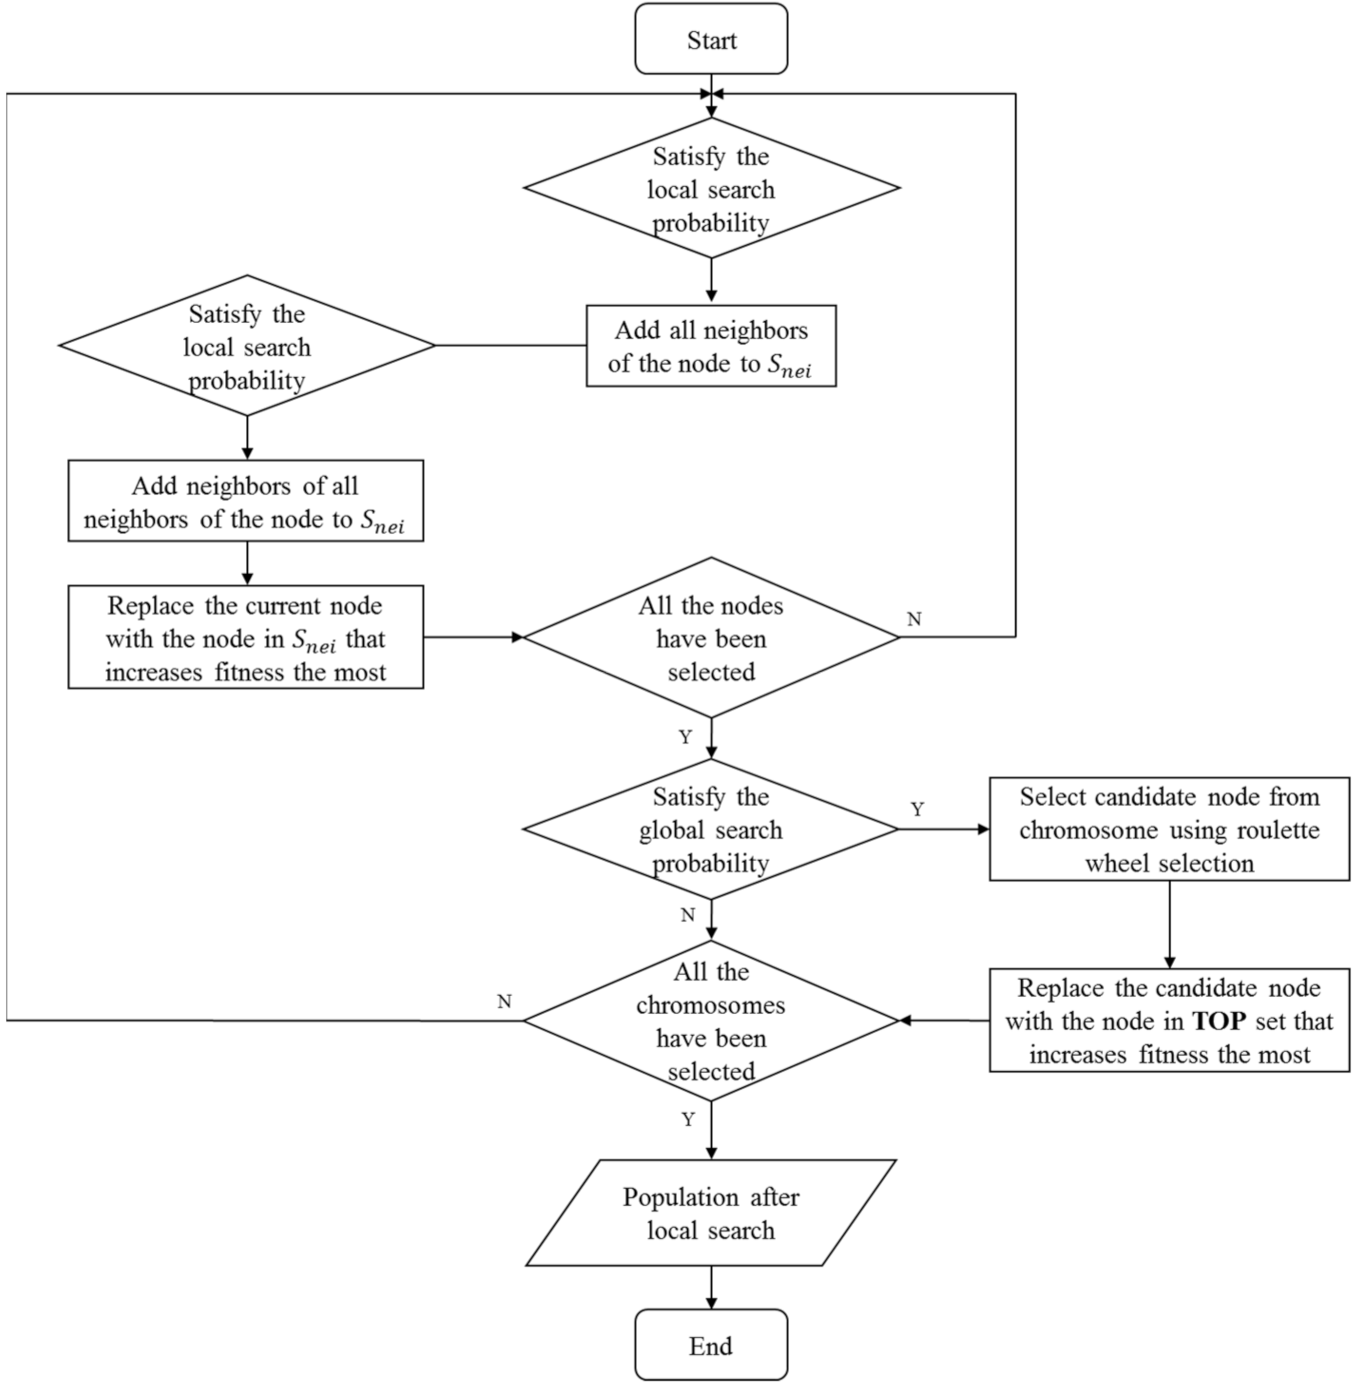
4.4. Local Search Operator
| Algorithm 4. Local Search |
| Input: |
| Current generation population |
| Local search probability |
| Global search probability |
| Current iteration |
| : Maximum iterations; |
| Output: |
| Population after local search; |
| for (each chromosome in ) do |
| for (each seed in ) do |
| if /* is a random number subjecting to uniform distribution between [0,1] */ |
| for (each neighbor node of ) do |
| Add into the set |
| for (each neighbor node of ) do |
| if |
| Add into the set |
| end if |
| end for |
| end for |
| Try to replace with each node in the set . If the fitness is improved, the neighbor node with the largest fitness is recorded as |
| Remove and add into |
| end if |
| if |
| Obtain the TOP set of nodes with a large degree accounting for 2% of the total nodes; |
| Select a node from using roulette wheel selection |
| /* The smaller the degree, the higher the probability of being selected */ |
| Try to replace with each node in the TOP set. If the fitness is improved, the node with the largest fitness is recorded as |
| Remove and add into |
| end if |
| end for |
| end for |
4.5. RIMMA Framework
| Algorithm 5. |
| Input: |
| Target network |
| Initial population size |
| Total population size |
| Size of seed set |
| Crossover probability |
| Mutation probability |
| Local search probability |
| Global search probability |
| : Maximum iterations; |
| Output: |
| Optimal seed set; |
| Initialization |
| for to do |
| Repeat |
| Randomly select two different chromosomes from the population as the parent chromosomes and |
| ()Crossover () |
| Until (all chromosomes in have been selected) |
| for (each chromosome in and ) do |
| Mutation (,) |
| end for |
| for (each chromosome in ) do |
| Local_Search (,) |
| end for |
| Selection_Operator (); |
| end for |
| Output the current best individual; |
5. Experiments
5.1. Experiments on the Synthetic Networks
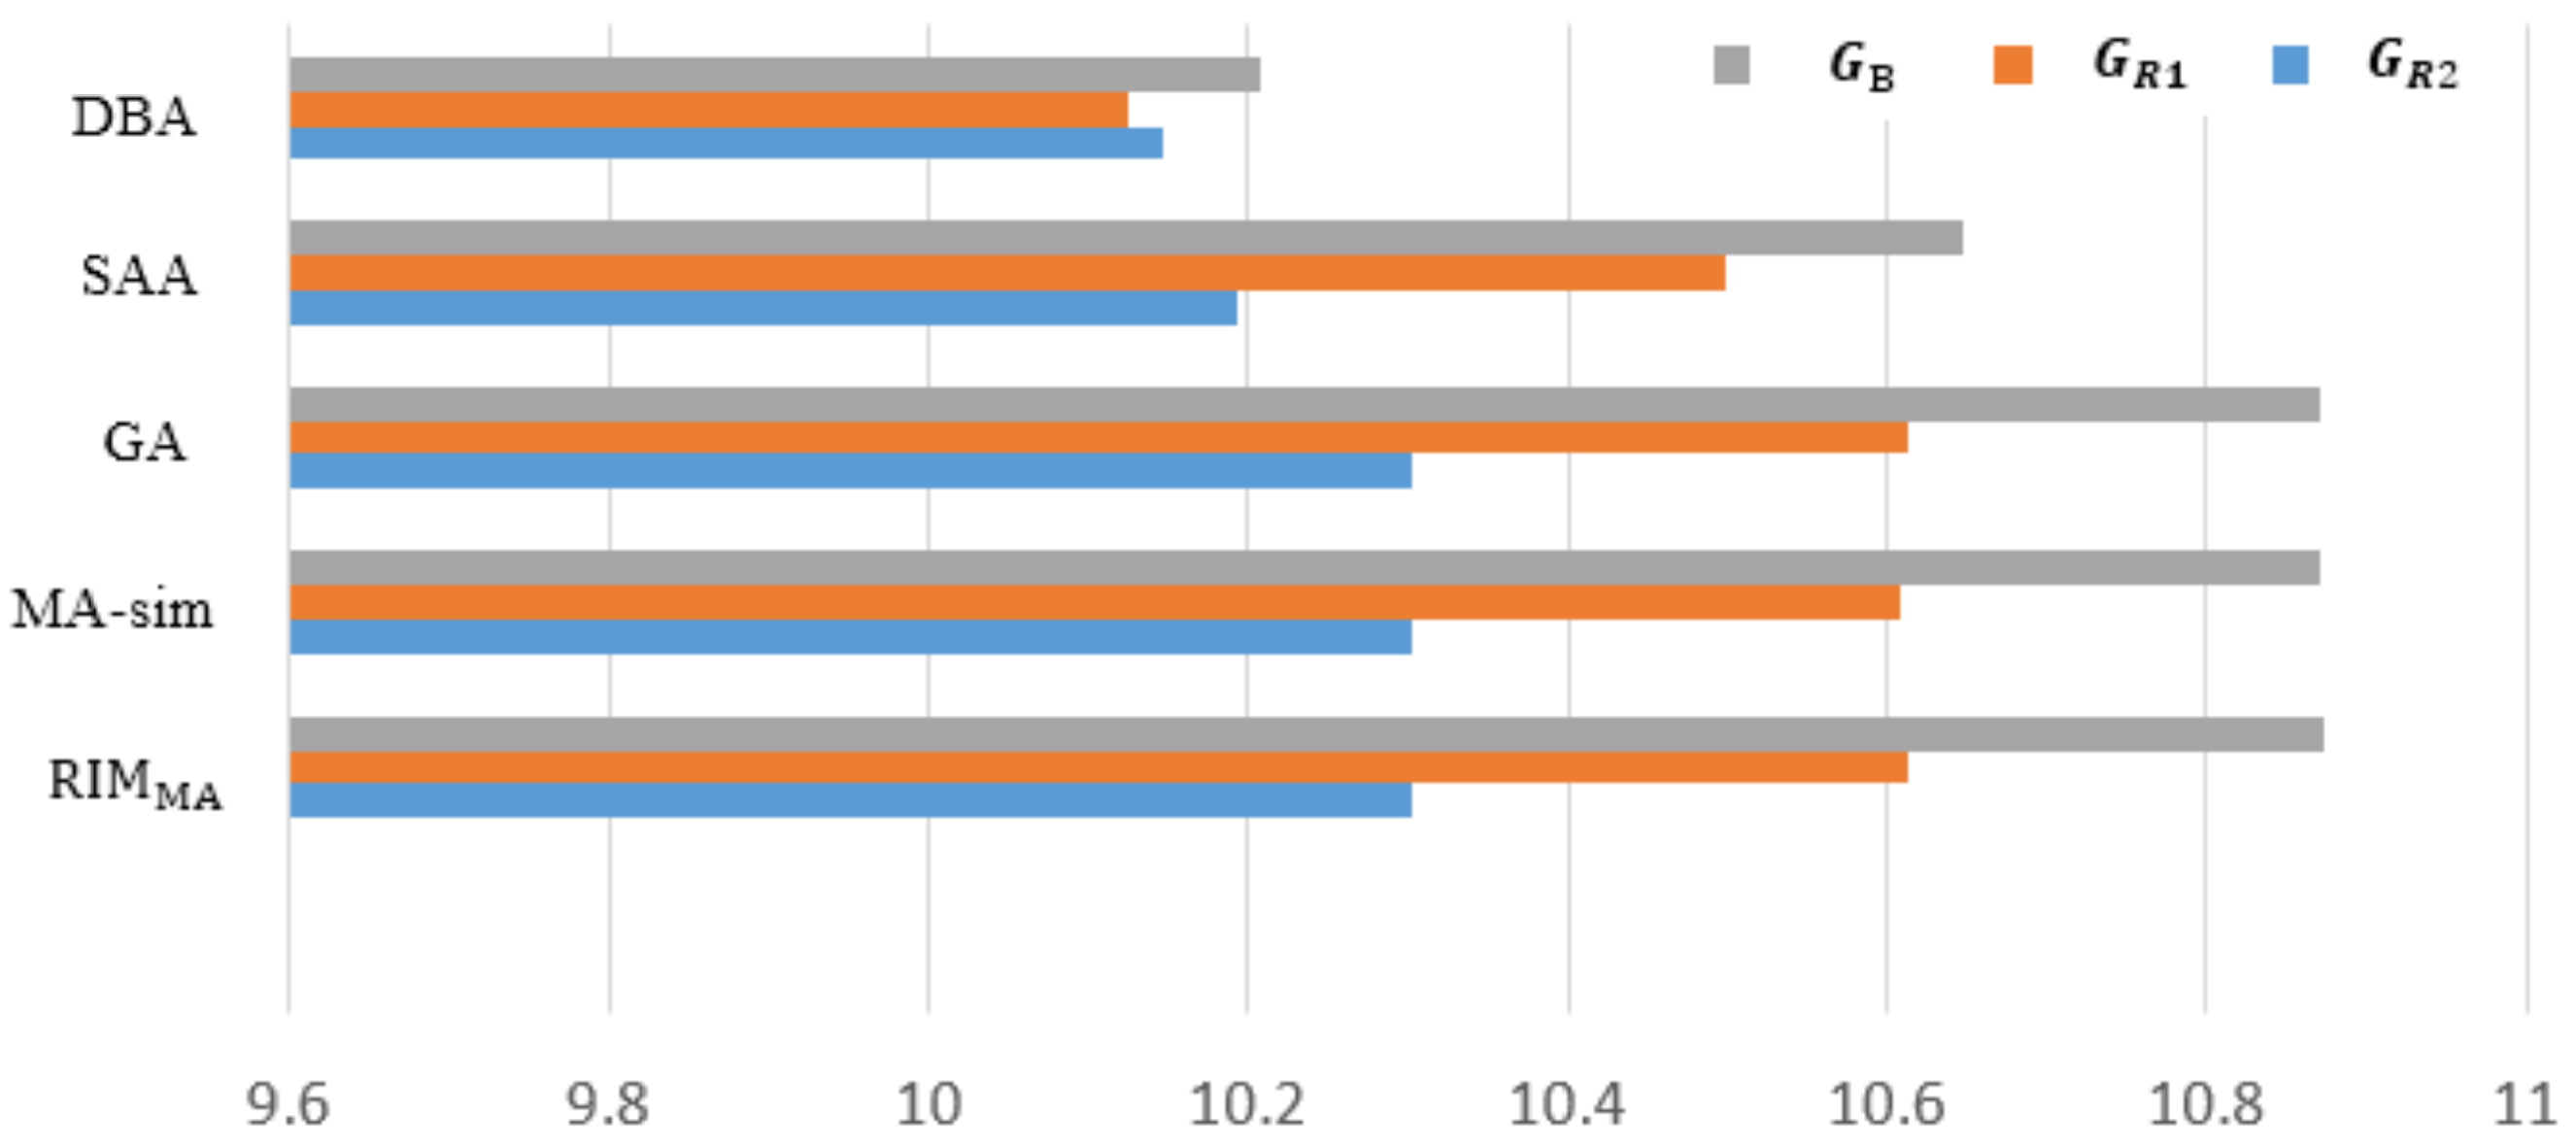
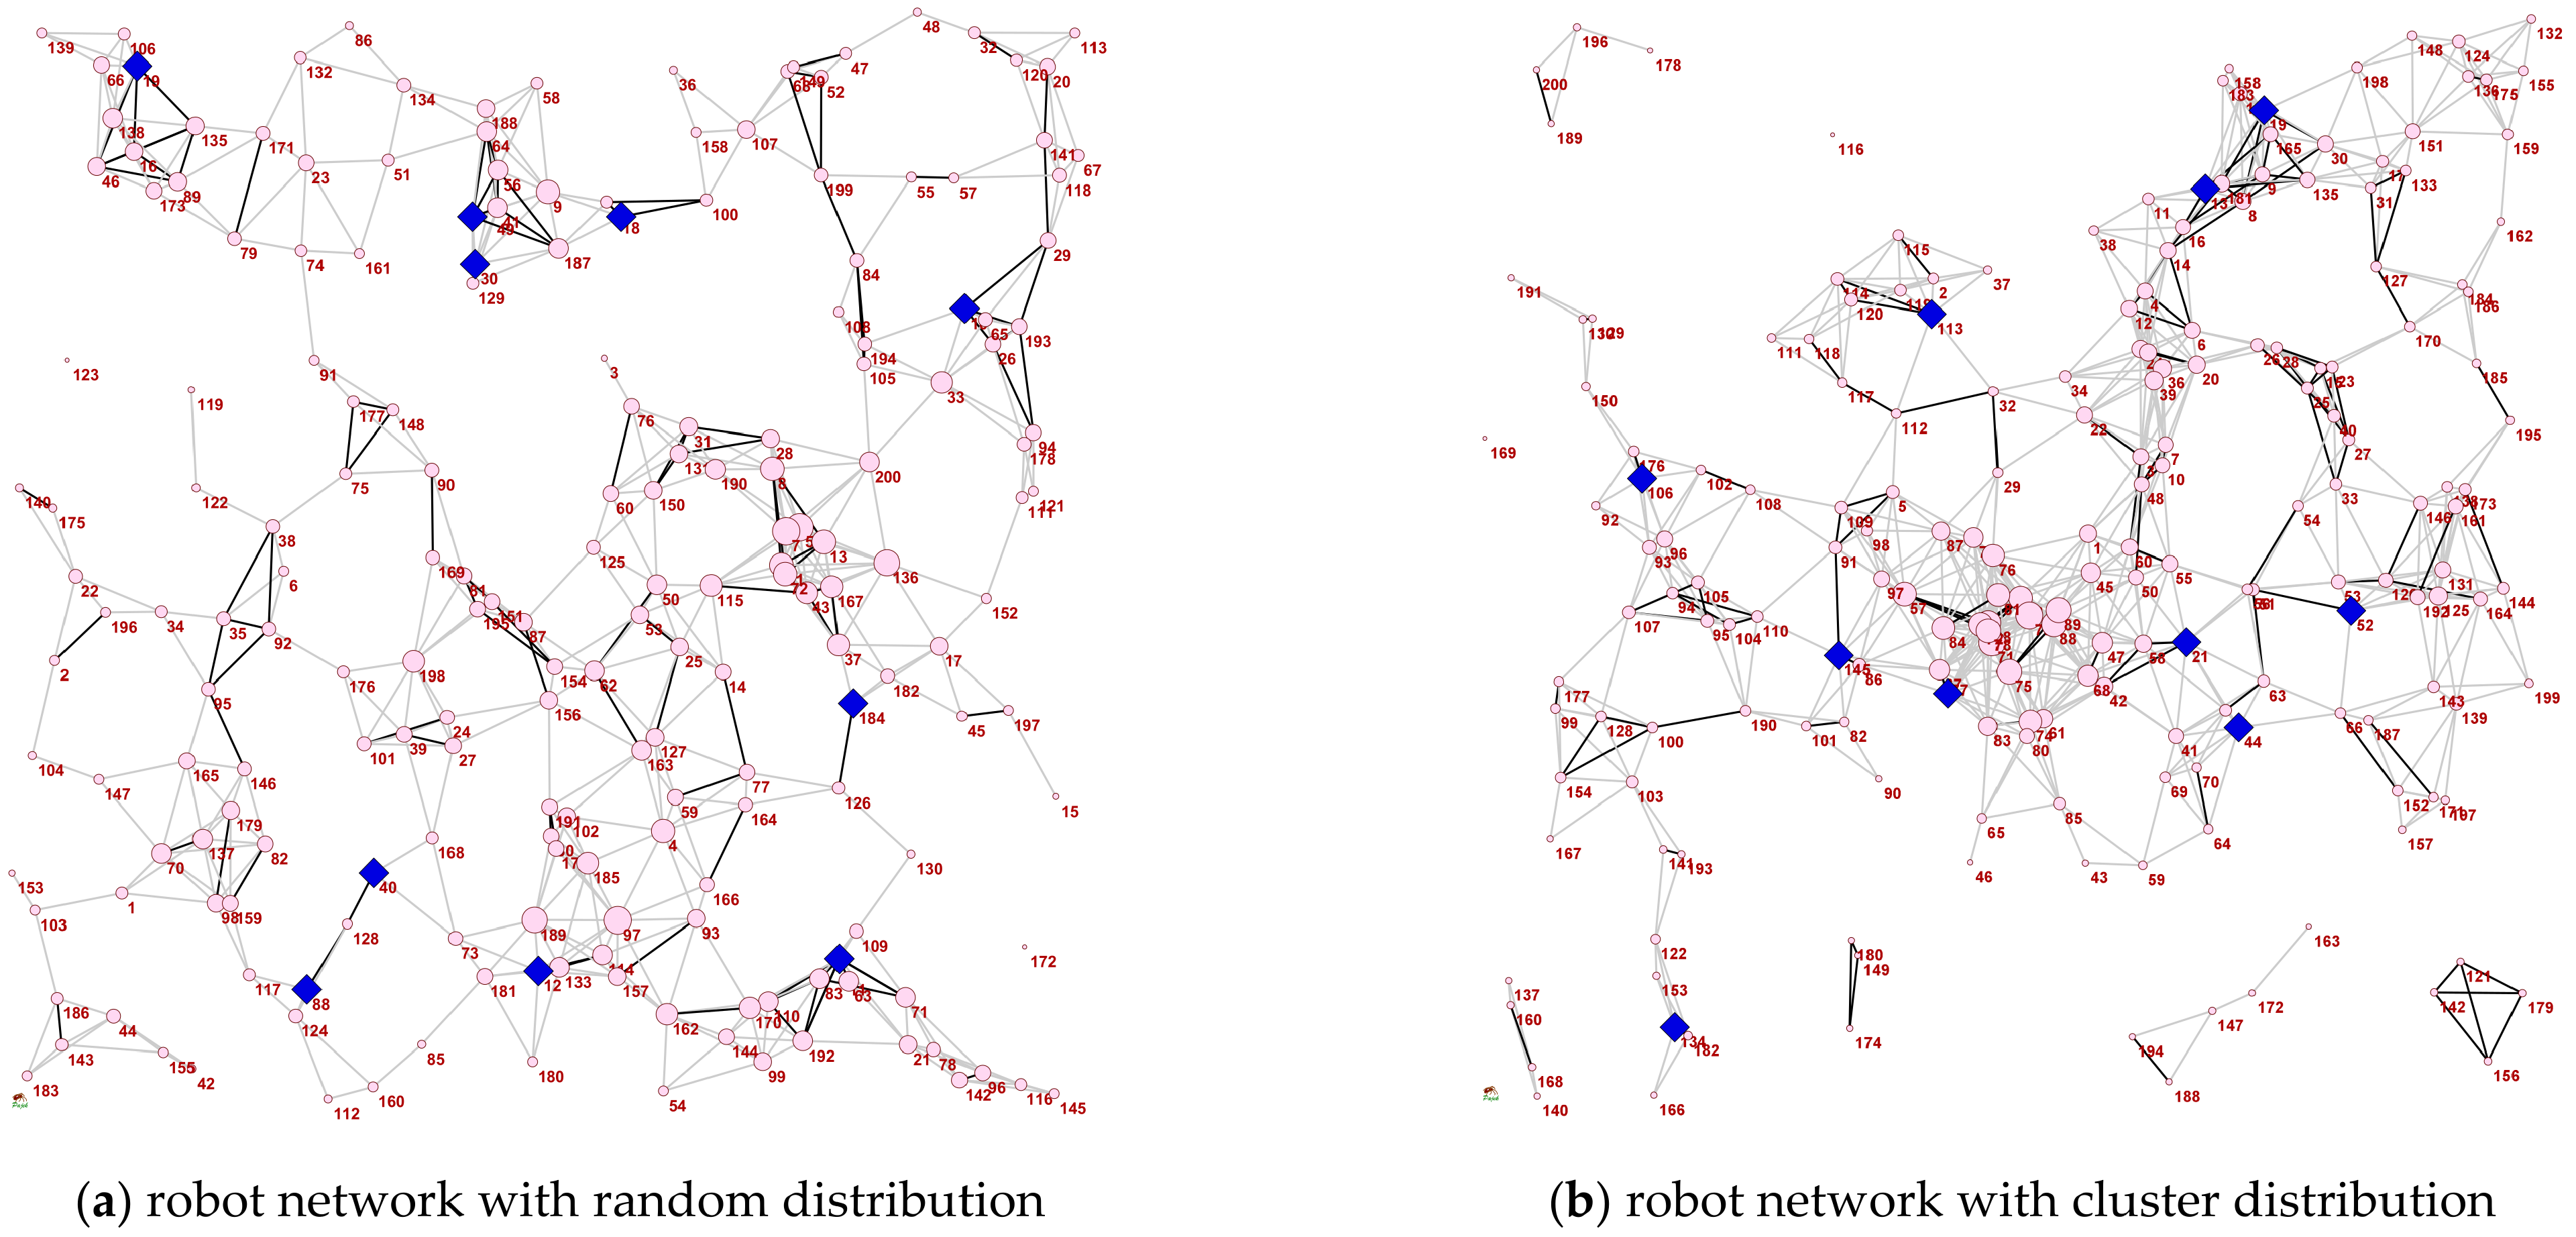
5.2. Experiments on the Realistic Land Transportation Networks
6. Conclusions
Author Contributions
Funding
Institutional Review Board Statement
Informed Consent Statement
Data Availability Statement
Conflicts of Interest
References
- Newman, M.E.J. Networks: An Introduction; Oxford University Press: New York, NY, USA, 2010. [Google Scholar]
- Wang, J.; Luo, H.; Tan, X. Path Planning for Automatic Guided Vehicles (AGVs) Fusing MH-RRT with Improved TEB. Actuators 2021, 10, 314. [Google Scholar] [CrossRef]
- Barabási, L.; Albert, R. Emergence of scaling in random networks. Science 1999, 286, 509–512. [Google Scholar] [CrossRef] [PubMed] [Green Version]
- Erdõs, P.; Rényi, A. On the evolution of random graphs. Publ. Math. Inst. Hung. Acad. Sci. 1960, 5, 17–61. [Google Scholar]
- Gong, M.; Yan, J.; Shen, B.; Ma, L.; Cai, Q. Influence maximization in social networks based on discrete particle swarm optimization. Inf. Sci. 2016, 367, 600–614. [Google Scholar] [CrossRef]
- Wang, C.; Ma, X.; Jiang, W.; Zhao, L.; Lin, N.; Shi, J. IMCR: Influence Maximisation-Based Cluster Routing Algorithm for SDVN. In Proceedings of the 2019 IEEE 21st International Conference on High Performance Computing and Communications; IEEE 17th International Conference on Smart City; IEEE 5th International Conference on Data Science and Systems (HPCC/SmartCity/DSS), Zhangjiajie, China, 10–12 August 2019; pp. 2580–2586. [Google Scholar]
- Zhao, B.; Xu, C.; Liu, S.; Zhao, J.; Li, L. A Congestion Diffusion Model with Influence Maximization for Traffic Bottlenecks Identification in Metrocity Scales. In Proceedings of the 2019 IEEE International Conference on Big Data (Big Data), Los Angeles, CA, USA, 9–12 December 2019; pp. 1717–1722. [Google Scholar]
- Kempe, D.; Kleinberg, J.; Tardos, É. Maximizing the spread of influence through a social network. In Proceedings of the 9th ACM SIGKDD International Conference on Knowledge Discovery and Data Mining, Washington, DC, USA, 24–27 August 2003; pp. 137–146. [Google Scholar]
- Chen, W.; Wang, Y.; Yang, S. Efficient influence maximization in social networks. In Proceedings of the 15th ACM SIGKDD International Conference on Knowledge Discovery and Data Mining, Paris, France, 28 June–1 July 2009; pp. 199–208. [Google Scholar]
- Rahimkhani, K.; Aleahmad, A.; Rahgozar, M.; Moeini, A. A fast algorithm for finding most influential people based on the linear threshold model. Expert Syst. Appl. 2015, 42, 1353–1361. [Google Scholar] [CrossRef]
- Lee, J.-R.; Chung, C.-W. A fast approximation for influence maximization in large social networks. In Proceedings of the 23rd International Conference on World Wide Web, Seoul, Korea, 7–11 April 2014; pp. 1157–1162. [Google Scholar]
- Zhou, M.; Liu, J. A two-phase multiobjective evolutionary algorithm for enhancing the robustness of scale-free networks against multiple malicious attacks. IEEE Trans. Cybern. 2017, 47, 539–552. [Google Scholar] [CrossRef]
- Wang, S.; Liu, J. Constructing robust community structure against edge-based attacks. IEEE Syst. J. 2019, 13, 582–592. [Google Scholar] [CrossRef]
- Holme, P.; Kim, B.J.; Yoon, C.N.; Han, S.K. Attack vulnerability of complex networks. Phys. Rev. E 2002, 65, 056109. [Google Scholar] [CrossRef] [Green Version]
- Zhang, J.; Wang, S.; Wang, X. Comparison analysis on vulnerability of metro networks based on complex network. Phys. A 2018, 496, 72–78. [Google Scholar] [CrossRef]
- Yin, R.; Yuan, H.; Zhu, H.; Song, X. Model and analyze the cascading failure of scale-Free network considering the selective forwarding attack. IEEE Access 2021, 9, 49025–49035. [Google Scholar] [CrossRef]
- Tefek, U.; Tandon, A.; Lim, T.J. Malicious relay detection using sentinels: A stochastic geometry framework. J. Commun. Netw. 2020, 22, 303–315. [Google Scholar] [CrossRef]
- Ma, L.; Gong, M.; Cai, Q.; Jiao, L. Enhancing community integrity of networks against multilevel targeted attacks. Phys. Rev. E 2013, 88, 022810. [Google Scholar] [CrossRef] [PubMed] [Green Version]
- Luptáková, D.; Pospíchal, J. Community cut-off attack on malicious networks. In Proceedings of the Conference on Creativity in Intelligent Technologies and Data Science, Volgograd, Russia, 12–14 September 2017; pp. 697–708. [Google Scholar]
- Schneider, C.M.; Moreira, A.A.; Andrade, J.S.; Havlin, S.; Herrmann, H.J. Mitigation of malicious attacks on networks. Proc. Natl. Acad. Sci. USA 2011, 108, 3838–3841. [Google Scholar] [CrossRef] [PubMed] [Green Version]
- Buldyrev, S.; Parshani, R.; Paul, G.; Stanley, H.; Havlin, S. Catastrophic cascade of failures in interdependent networks. Nature 2010, 464, 1025–1028. [Google Scholar] [CrossRef] [Green Version]
- Zhou, M.; Liu, J. A memetic algorithm for enhancing the robustness of scale-free networks against malicious attacks. Phys. A 2014, 410, 131–143. [Google Scholar] [CrossRef]
- Wang, S.; Liu, J. A multi-objective evolutionary algorithm for promoting the emergence of cooperation and controllable robustness on directed networks. IEEE Trans. Netw. Sci. Eng. 2018, 5, 92–100. [Google Scholar] [CrossRef]
- Wang, J.; Li, J.; Shi, Y.; Lai, J.; Tan, X. AM3Net: Adaptive mutual-learning-based multimodal data fusion network. IEEE Trans. Circuits Syst. Video Technol. 2022. Early Access. [Google Scholar] [CrossRef]
- Gong, M.; Song, C.; Duan, C.; Ma, L.; Shen, B. An efficient memetic algorithm for influence maximization in social networks. IEEE Comput. Intell. Mag. 2016, 11, 22–33. [Google Scholar] [CrossRef]
- Saito, K.; Kimura, M.; Ohara, K.; Motoda, H. Super mediator—A new centrality measure of node importance for information diffusion over social network. Inf. Sci. 2016, 329, 985–1000. [Google Scholar] [CrossRef] [Green Version]
- Li, D.; Wang, C.; Zhang, S.; Zhou, G.; Chu, D.; Wu, C. Positive influence maximization in signed social networks based on simulated annealing. Neurocomputing 2017, 260, 69–78. [Google Scholar] [CrossRef]
- Zhang, K.; Du, H.; Feldman, M.W. Maximizing influence in a social network: Improved results using a genetic algorithm. Phys. A 2017, 478, 20–30. [Google Scholar] [CrossRef]
- Chen, W.; Lin, T.; Tan, Z.; Zhao, M.; Zhou, X. Community cut-off attack on malicious networks. In Proceedings of the 22nd ACM SIGKDD International Conference on Knowledge Discovery and Data Mining, San Francisco, CA, USA, 13–17 August 2016; pp. 795–804. [Google Scholar]
- He, X.; Kempe, D. Stability and robustness in influence maximization. ACM Trans. Knowl. Disc. Data (TKDD) 2018, 12, 1–34. [Google Scholar] [CrossRef]
- Zeng, A.; Liu, W. Enhancing network robustness against malicious attacks. Phys. Rev. E 2012, 85, 066130. [Google Scholar] [CrossRef] [Green Version]
- Kim, J.; Sarkar, S.; Venkatesh, S.S.; Ryerson, M.S.; Starobinski, D. An epidemiological diffusion framework for vehicular messaging in general transportation networks. Transp. Res. Part B Methodol. 2020, 131, 160–190. [Google Scholar] [CrossRef]
- Baus, P.; Redi, J. Movement control algorithms for realization of fault-tolerant ad hoc robot networks. IEEE Netw. 2004, 18, 36–44. [Google Scholar] [CrossRef]
- Fazlollahtabar, H.; Saidi-Mehrabad, M. Methodologies to optimize automated guided vehicle scheduling and routing problems: A review study. J. Intell. Robot. Syst. 2015, 77, 525–545. [Google Scholar] [CrossRef]
- Zhang, B.; Tang, L.; Decastro, J.; Roemer, M.J.; Goebel, K. A recursive receding horizon planning for unmanned vehicles. IEEE Trans. Ind. Electron. 2015, 62, 2912–2920. [Google Scholar] [CrossRef]
- Wang, S.; Liu, J. Community robustness and its enhancement in interdependent networks. Appl. Soft Comput. 2019, 77, 665–677. [Google Scholar] [CrossRef]
- Watts, D.J.; Strogatz, S.H. Collective dynamics of ‘small-world’ networks. Nature 1998, 393, 440–442. [Google Scholar] [CrossRef]
- Farid, A.M. Symmetrica: Test case for transportation electrification research. Infrastruct. Complex. 2015, 2, 1–10. [Google Scholar] [CrossRef] [Green Version]
- Wang, S.; Liu, J. Robustness of single and interdependent scale-free interaction networks with various parameters. Phys. A 2016, 460, 139–151. [Google Scholar] [CrossRef]
- Wang, N.; Jin, Z.; Zhao, J. Cascading failures of overload behaviors on interdependent networks. Phys. A 2021, 574, 125989. [Google Scholar] [CrossRef]


| INDEX | GA | SAA | DBA | |
|---|---|---|---|---|
| /time (s) | 10.341/2.3 s | 10.338/2.3 s | 10.276/2.3 s | 10.125/2.3 s |
| /time (s) | 10.340/0.2 s | 10.337/0.2 s | 10.276/0.2 s | 10.124/0.2 s |
| NETWORK | N | RIMMA | MA-SIM | GA | SAA | DBA |
|---|---|---|---|---|---|---|
| SF | 100 | 10.33951 | 10.33763 | 10.33724 | 10.27430 | 10.12350 |
| 300 | 10.39330 | 10.39202 | 10.38694 | 10.30001 | 10.07035 | |
| 500 | 10.37831 | 10.37818 | 10.37654 | 10.28429 | 10.06847 | |
| 1000 | 10.38623 | 10.38380 | 10.38086 | 10.27163 | 10.04240 | |
| ER | 100 | 10.44711 | 10.44512 | 10.44495 | 10.36656 | 10.14899 |
| 300 | 10.49732 | 10.49529 | 10.49528 | 10.38567 | 10.08195 | |
| 500 | 10.50606 | 10.50525 | 10.50349 | 10.39711 | 10.07562 | |
| 1000 | 10.51805 | 10.51729 | 10.51593 | 10.38548 | 10.02223 | |
| SW | 100 | 10.40811 | 10.40824 | 10.40782 | 10.35068 | 10.13332 |
| 300 | 10.43799 | 10.43788 | 10.43650 | 10.36159 | 10.04350 | |
| 500 | 10.44381 | 10.44228 | 10.44194 | 10.38061 | 10.04867 | |
| 1000 | 10.46810 | 10.46741 | 10.46730 | 10.38103 | 10.10572 |
| NETWORK | N | RIMMA | MA-SIM | GA | SAA | DBA |
|---|---|---|---|---|---|---|
| GB | 224 | 10.30328 | 10.30262 | 10.30187 | 10.19373 | 10.14699 |
| GR1 | 200 | 10.61319 | 10.60826 | 10.61282 | 10.49883 | 10.12651 |
| GR2 | 200 | 10.87442 | 10.87051 | 10.87071 | 10.64649 | 10.20853 |
Publisher’s Note: MDPI stays neutral with regard to jurisdictional claims in published maps and institutional affiliations. |
© 2022 by the authors. Licensee MDPI, Basel, Switzerland. This article is an open access article distributed under the terms and conditions of the Creative Commons Attribution (CC BY) license (https://creativecommons.org/licenses/by/4.0/).
Share and Cite
Huang, D.; Tan, X.; Chen, N.; Fan, Z. A Memetic Algorithm for Solving the Robust Influence Maximization Problem on Complex Networks against Structural Failures. Sensors 2022, 22, 2191. https://doi.org/10.3390/s22062191
Huang D, Tan X, Chen N, Fan Z. A Memetic Algorithm for Solving the Robust Influence Maximization Problem on Complex Networks against Structural Failures. Sensors. 2022; 22(6):2191. https://doi.org/10.3390/s22062191
Chicago/Turabian StyleHuang, Delin, Xiaojun Tan, Nanjie Chen, and Zhengping Fan. 2022. "A Memetic Algorithm for Solving the Robust Influence Maximization Problem on Complex Networks against Structural Failures" Sensors 22, no. 6: 2191. https://doi.org/10.3390/s22062191
APA StyleHuang, D., Tan, X., Chen, N., & Fan, Z. (2022). A Memetic Algorithm for Solving the Robust Influence Maximization Problem on Complex Networks against Structural Failures. Sensors, 22(6), 2191. https://doi.org/10.3390/s22062191