
Is This the Real Life, or Is This Just Laboratory? A Scoping Review of IMU-Based Running Gait Analysis


Abstract
1. Introduction
2. Materials and Methods
2.1. Registration
2.2. Eligibility Criteria
2.3. Search Strategy
2.4. Study Selection
2.5. Data Extraction
2.5.1. Conditions
Location
Running Surface
Speed
Full Distance or Duration
Analyzed Distance
2.5.2. Device(s)
Brand and Model
Device Location(s)
Sensors
2.5.3. Analysis
Statistical Approach
Metrics
2.5.4. Participants
Sex
Type
Injury Status
Age
2.5.5. Study Details
Country
Study Design
Purpose
2.6. Quality Assessment
3. Results
3.1. Study Selection
3.2. Data Extraction
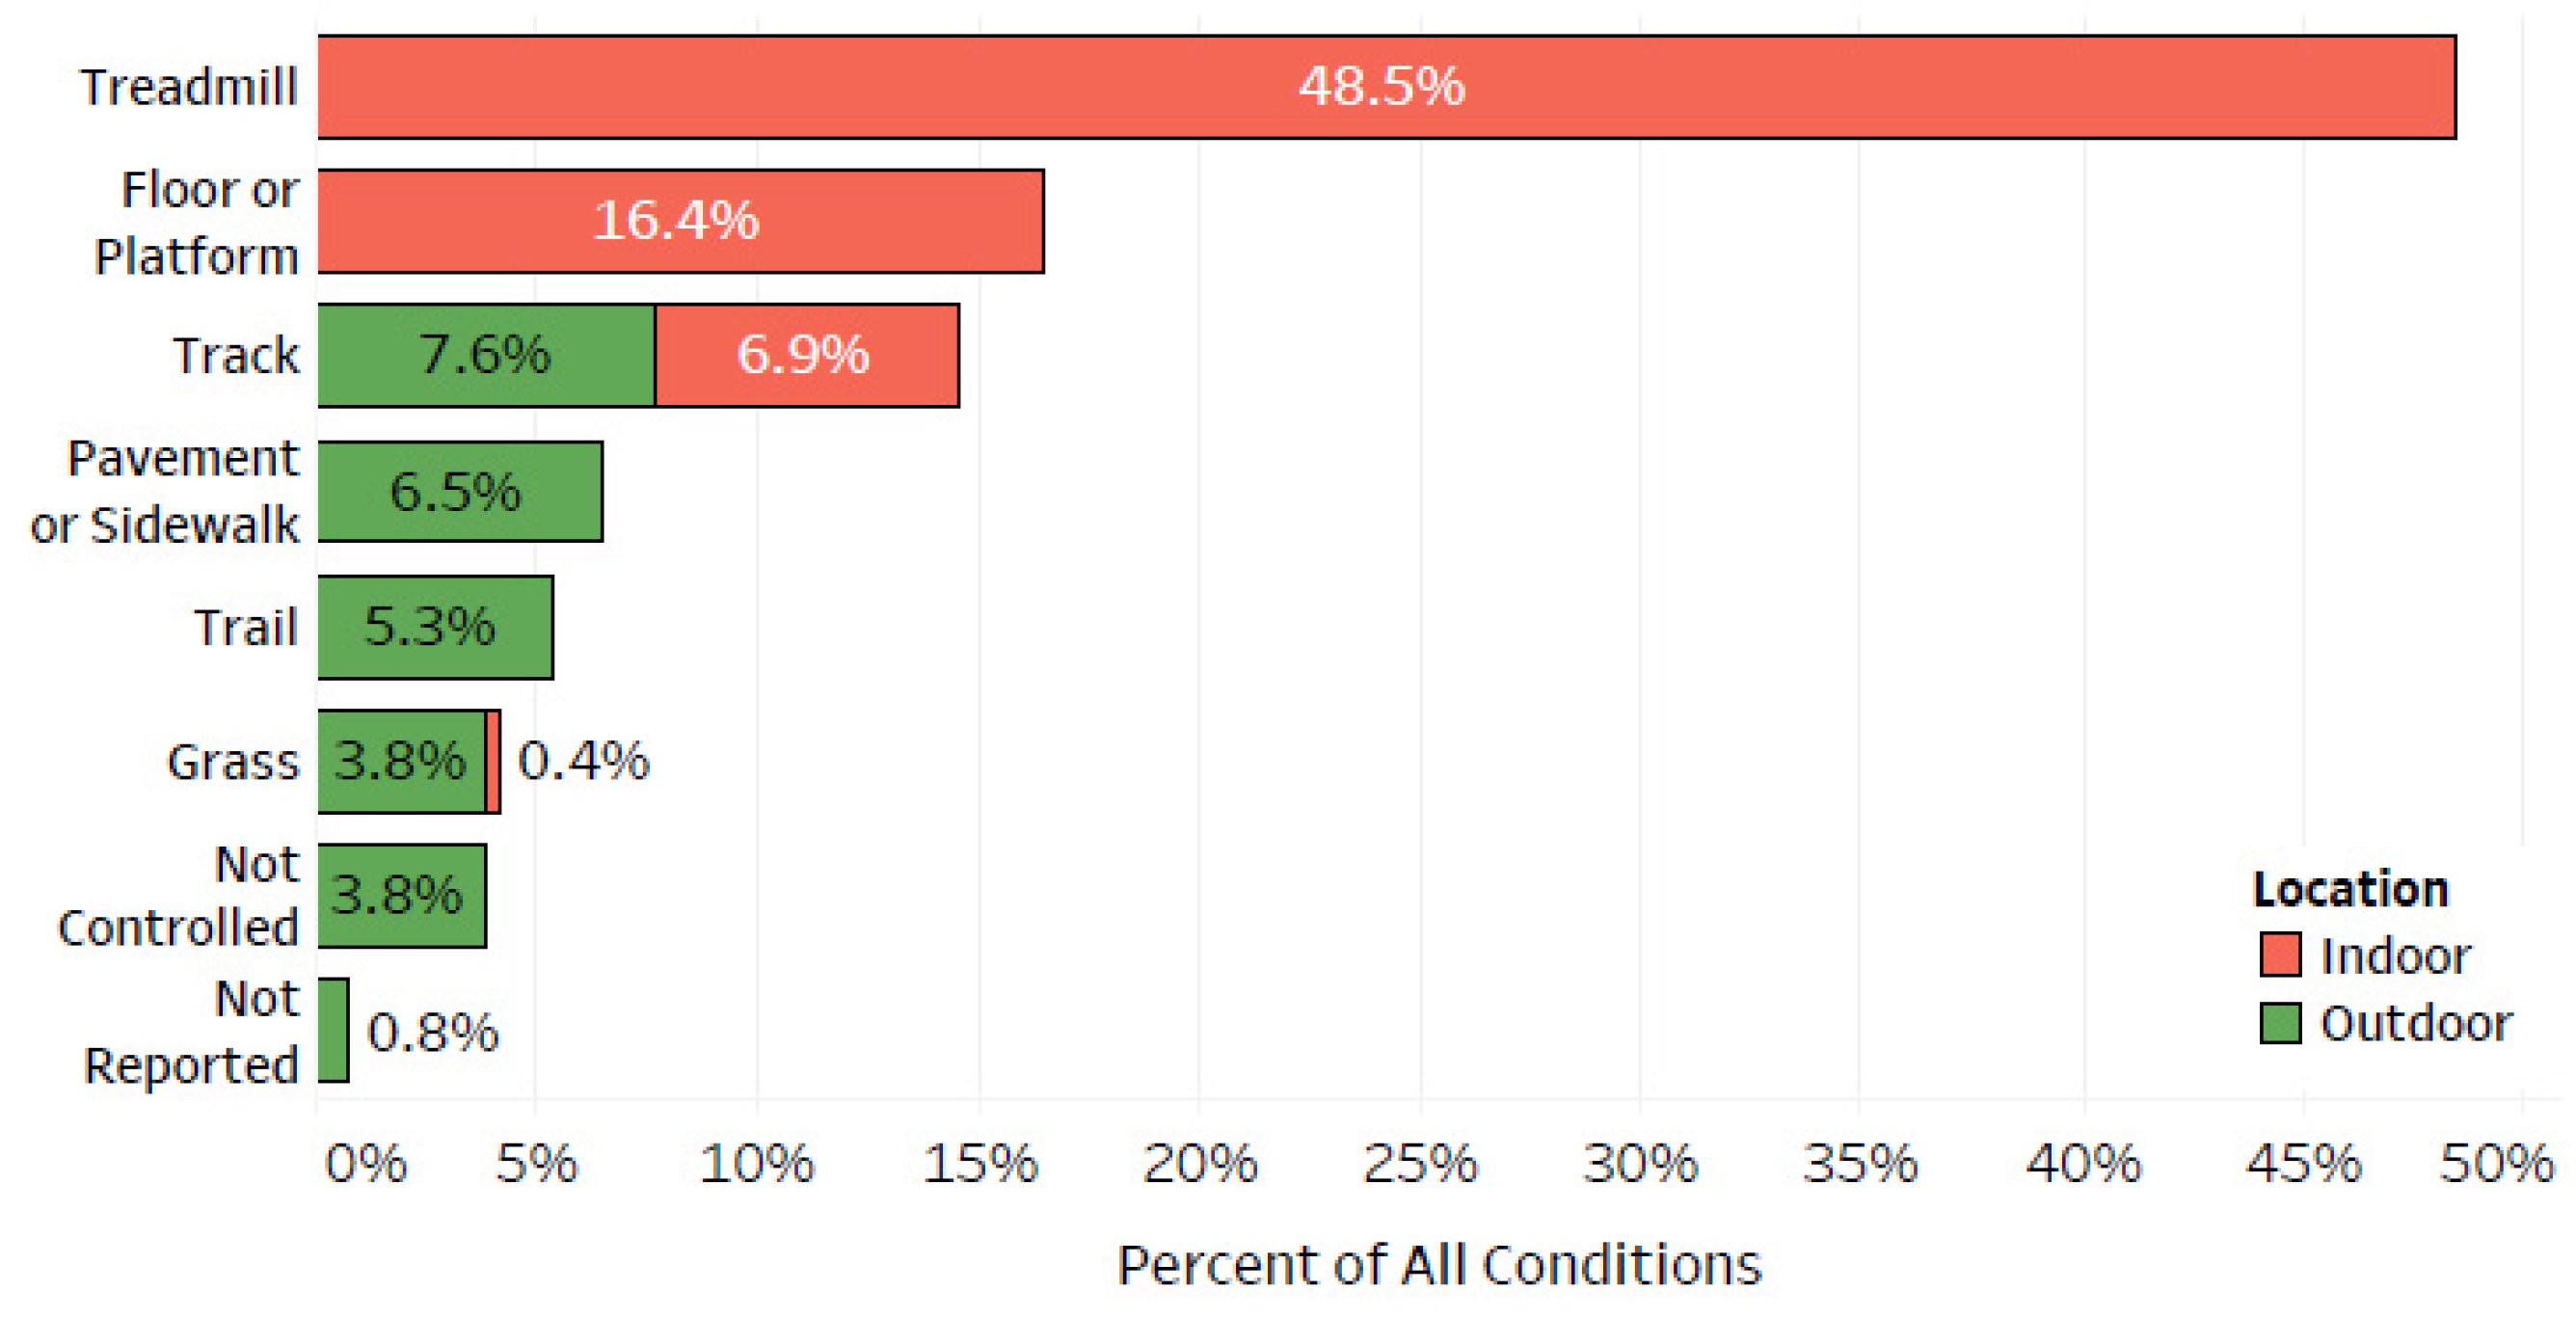
3.2.1. Conditions
3.2.2. Device(s)
3.2.3. Analysis
3.2.4. Participants
3.2.5. Study Details
3.3. Quality Assessment
4. Discussion
4.1. Running Environments
4.2. IMU Considerations
4.3. Changing Running Biomechanics
4.4. Participant Characteristics
4.5. Limitations
5. Conclusions
Author Contributions
Funding
Institutional Review Board Statement
Informed Consent Statement
Data Availability Statement
Acknowledgments
Conflicts of Interest
References
- Benson, L.C.; Räisänen, A.M.; Volkova, V.G.; Pasanen, K.; Emery, C.A. Workload a-WEAR-ness: Monitoring Workload in Team Sports with Wearable Technology. A Scoping Review. J. Orthop. Sports Phys. Ther. 2020, 50, 549–563. [Google Scholar] [CrossRef] [PubMed]
- Willy, R.W. Innovations and pitfalls in the use of wearable devices in the prevention and rehabilitation of running related injuries. Phys. Ther. Sport 2018, 29, 26–33. [Google Scholar] [CrossRef] [PubMed]
- Moore, I.S.; Willy, R.W. Use of Wearables: Tracking and Retraining in Endurance Runners. Curr. Sports Med. Rep. 2019, 18, 437–444. [Google Scholar] [CrossRef] [PubMed]
- Johnston, W.; Heiderscheit, B. Mobile Technology in Running Science and Medicine: Are We Ready? J. Orthop. Sports Phys. Ther. 2019, 49, 122–125. [Google Scholar] [CrossRef]
- Benson, L.C.; Clermont, C.A.; Ferber, R. New Considerations for Collecting Biomechanical Data Using Wearable Sensors: The Effect of Different Running Environments. Front. Bioeng. Biotechnol. 2020, 8, 86. [Google Scholar] [CrossRef]
- Van Hooren, B.; Goudsmit, J.; Restrepo, J.; Vos, S. Real-time feedback by wearables in running: Current approaches, challenges and suggestions for improvements. J. Sports Sci. 2020, 38, 214–230. [Google Scholar] [CrossRef]
- Napier, C.; Esculier, J.-F.; Hunt, M.A. Gait retraining: Out of the lab and onto the streets with the benefit of wearables. Br. J. Sports Med. 2017, 51, 1642–1643. [Google Scholar] [CrossRef]
- Benson, L.C.; Clermont, C.A.; Bošnjak, E.; Ferber, R. The use of wearable devices for walking and running gait analysis outside of the lab: A systematic review. Gait Posture 2018, 63, 124–138. [Google Scholar] [CrossRef]
- Watari, R.; Hettinga, B.; Osis, S.; Ferber, R. Validation of a Torso-Mounted Accelerometer for Measures of Vertical Oscillation and Ground Contact Time During Treadmill Running. J. Appl. Biomech. 2016, 32, 306–310. [Google Scholar] [CrossRef]
- Benson, L.C.; Clermont, C.A.; Watari, R.; Exley, T.; Ferber, R. Automated accelerometer-based gait event detection during multiple running conditions. Sensors 2019, 19, 1483. [Google Scholar] [CrossRef]
- Lenhart, R.L.; Thelen, D.G.; Wille, C.M.; Chumanov, E.S.; Heiderscheit, B.C. Increasing Running Step Rate Reduces Patellofemoral Joint Forces. Med. Sci. Sports Exerc. 2014, 46, 557–564. [Google Scholar] [CrossRef] [PubMed]
- Hafer, J.; Brown, A.M.; DeMille, P.; Hillstrom, H.J.; Garber, C. The effect of a cadence retraining protocol on running biomechanics and efficiency: A pilot study. J. Sports Sci. 2015, 33, 724–731. [Google Scholar] [CrossRef] [PubMed]
- Bood, R.J.; Nijssen, M.; van der Kamp, J.; Roerdink, M. The Power of Auditory-Motor Synchronization in Sports: Enhancing Running Performance by Coupling Cadence with the Right Beats. PLoS ONE 2013, 8, e70758. [Google Scholar] [CrossRef] [PubMed]
- Billat, V.L.; Mille-Hamard, L.; Petit, B.; Koralsztein, J.P. The Role of Cadence on the V˙O2 Slow Component in Cycling and Running in Triathletes. Int. J. Sports Med. 1999, 20, 429–437. [Google Scholar] [CrossRef] [PubMed]
- Aubol, K.G.; Hawkins, J.L.; Milner, C.E. Tibial Acceleration Reliability and Minimal Detectable Difference During Overground and Treadmill Running. J. Appl. Biomech. 2020, 36, 457–459. [Google Scholar] [CrossRef]
- Blackah, N.; Bradshaw, E.J.; Kemp, J.G.; Shoushtarian, M. The Effect of Exercise-Induced Muscle Damage on Shock Dissipation during Treadmill Running. Asian J. Exerc. Sports Sci. 2013, 10, 16–30. [Google Scholar]
- Boyer, K.A.; Nigg, B.M. Soft tissue vibrations within one soft tissue compartment. J. Biomech. 2006, 39, 645–651. [Google Scholar] [CrossRef]
- Chadefaux, D.; Gueguen, N.; Thouze, A.; Rao, G. 3D propagation of the shock-induced vibrations through the whole lower-limb during running. J. Biomech. 2019, 96, 109343. [Google Scholar] [CrossRef]
- Clansey, A.C.; Hanlon, M.; Wallace, E.S.; Lake, M.J. Effects of Fatigue on Running Mechanics Associated with Tibial Stress Fracture Risk. Med. Sci. Sports Exerc. 2012, 44, 1917–1923. [Google Scholar] [CrossRef]
- Crowell, H.P.; Davis, I.S. Gait retraining to reduce lower extremity loading in runners. Clin. Biomech. 2011, 26, 78–83. [Google Scholar] [CrossRef]
- Edwards, S.; White, S.; Humphreys, S.; Robergs, R.; O’Dwyer, N. Caution using data from triaxial accelerometers housed in player tracking units during running. J. Sports Sci. 2018, 37, 810–818. [Google Scholar] [CrossRef]
- Gil-Rey, E.; Deere, K.C.; Maldonado-Martín, S.; Palacios-Samper, N.; Azpeitia, A.; Gorostiaga, E.M.; Tobias, J. Investigation of the Relationship Between Peak Vertical Accelerations and Aerobic Exercise Intensity During Graded Walking and Running in Postmenopausal Women. J. Aging Phys. Act. 2021, 29, 71–79. [Google Scholar] [CrossRef] [PubMed]
- Hagen, M.; Hennig, E.M. Effects of different shoe-lacing patterns on the biomechanics of running shoes. J. Sports Sci. 2009, 27, 267–275. [Google Scholar] [CrossRef] [PubMed]
- Havens, K.L.; Cohen, S.C.; Pratt, K.A.; Sigward, S.M. Accelerations from wearable accelerometers reflect knee loading during running after anterior cruciate ligament reconstruction. Clin. Biomech. 2018, 58, 57–61. [Google Scholar] [CrossRef] [PubMed]
- Higgins, S.; Higgins, L.Q.; Vallabhajosula, S. Site-specific Concurrent Validity of the ActiGraph GT9X Link in the Estimation of Activity-related Skeletal Loading. Med. Sci. Sports Exerc. 2021, 53, 951–959. [Google Scholar] [CrossRef]
- Lam, W.-K.; Liebenberg, J.; Woo, J.; Park, S.-K.; Yoon, S.-H.; Cheung, R.T.H.; Ryu, J. Do running speed and shoe cushioning influence impact loading and tibial shock in basketball players? PeerJ 2018, 6, e4753. [Google Scholar] [CrossRef]
- Laughton, C.A.; Davis, I.M.; Hamill, J. Effect of Strike Pattern and Orthotic Intervention on Tibial Shock during Running. J. Appl. Biomech. 2003, 19, 153–168. [Google Scholar] [CrossRef]
- Mavor, M.P.; Ross, G.B.; Clouthier, A.L.; Karakolis, T.; Graham, R.B. Validation of an IMU Suit for Military-Based Tasks. Sensors 2020, 20, 4280. [Google Scholar] [CrossRef]
- Meinert, I.; Brown, N.; Alt, W. Effect of Footwear Modifications on Oscillations at the Achilles Tendon during Running on a Treadmill and Over Ground: A Cross-Sectional Study. PLoS ONE 2016, 11, e0152435. [Google Scholar] [CrossRef]
- Mercer, J.A.; Bezodis, N.E.; Russell, M.; Purdy, A.; Delion, D. Kinetic consequences of constraining running behavior. J. Sports Sci. Med. 2005, 4, 144–152. [Google Scholar]
- Milner, C.E.; Hawkins, J.L.; Aubol, K.G. Tibial Acceleration during Running Is Higher in Field Testing Than Indoor Testing. Med. Sci. Sports Exerc. 2020, 52, 1361–1366. [Google Scholar] [CrossRef]
- Milner, C.E.; Ferber, R.; Pollard, C.D.; Hamill, J.; Davis, I.S. Biomechanical Factors Associated with Tibial Stress Fracture in Female Runners. Med. Sci. Sports Exerc. 2006, 38, 323–328. [Google Scholar] [CrossRef]
- Nedergaard, N.J.; Verheul, J.; Drust, B.; Etchells, T.; Lisboa, P.; Robinson, M.A.; Vanrenterghem, J. The feasibility of predicting ground reaction forces during running from a trunk accelerometry driven mass-spring-damper model. PeerJ 2018, 6, e6105. [Google Scholar] [CrossRef]
- Ogon, M.; Aleksiev, A.R.; Spratt, K.F.; Pope, M.H.; Saltzman, C.L. Footwear Affects the Behavior of Low Back Muscles When Jogging. Int. J. Sports Med. 2001, 22, 414–419. [Google Scholar] [CrossRef]
- Rowlands, A.; Stiles, V. Accelerometer counts and raw acceleration output in relation to mechanical loading. J. Biomech. 2012, 45, 448–454. [Google Scholar] [CrossRef]
- Sayer, T.A.; Hinman, R.S.; Paterson, K.L.; Bennell, K.L.; Hall, M.; Allison, K.; Bryant, A.L. Running-related muscle activation patterns and tibial acceleration across puberty. J. Electromyogr. Kinesiol. 2020, 50, 102381. [Google Scholar] [CrossRef]
- Sinclair, J.; Dillon, S. The Influence of Energy Boost and Springblade Footwear on The Kinetics and Kinematics of Running. Hum. Mov. 2016, 17, 112–118. [Google Scholar] [CrossRef]
- Sinclair, J.; Sant, B. The effects of cross-fit footwear on the kinetics and kinematics of running. Footwear Sci. 2016, 9, 41–48. [Google Scholar] [CrossRef]
- Sinclair, J.; Fau-Goodwin, J.; Richards, J.; Shore, H. The influence of minimalist and maximalist footwear on the kinetics and kinematics of running. Footwear Sci. 2016, 8, 33–39. [Google Scholar] [CrossRef]
- Sinclair, J.; Naemi, R.; Chockalingam, N.; Taylor, P.J.; Shore, H. The effects of shoe temperature on the kinetics and kinematics of running. Footwear Sci. 2015, 7, 173–180. [Google Scholar] [CrossRef][Green Version]
- Sinclair, J.; Rooney, E.; Naemi, R.; Atkins, S.; Chockalingam, N. Effects of Footwear Variations on Three-Dimensional Kinematics and Tibial Accelerations of Specific Movements in American Football. J. Mech. Med. Biol. 2017, 17, 1750026. [Google Scholar] [CrossRef]
- Thompson, M.; Seegmiller, J.; McGowan, C.P. Impact Accelerations of Barefoot and Shod Running. Int. J. Sports Med. 2016, 37, 364–368. [Google Scholar] [CrossRef]
- Trama, R.; Blache, Y.; Hautier, C. Effect of rocker shoes and running speed on lower limb mechanics and soft tissue vibrations. J. Biomech. 2019, 82, 171–177. [Google Scholar] [CrossRef]
- Berghe, P.V.D.; Six, J.; Gerlo, J.; Leman, M.; De Clercq, D. Validity and reliability of peak tibial accelerations as real-time measure of impact loading during over-ground rearfoot running at different speeds. J. Biomech. 2019, 86, 238–242. [Google Scholar] [CrossRef]
- Wundersitz, D.W.T.; Netto, K.J.; Aisbett, B.; Gastin, P.B. Validity of an upper-body-mounted accelerometer to measure peak vertical and resultant force during running and change-of-direction tasks. Sports Biomech. 2013, 12, 403–412. [Google Scholar] [CrossRef]
- Adams, D.; Pozzi, F.; Carroll, A.; Rombach, A.; Zeni, J. Validity and Reliability of a Commercial Fitness Watch for Measuring Running Dynamics. J. Orthop. Sports Phys. Ther. 2016, 46, 471–476. [Google Scholar] [CrossRef]
- Adams, D.; Pozzi, F.; Willy, R.W.; Carrol, A.; Zeni, J. Altering Cadence or Vertical Oscillation During Running: Effects on Running Related Injury Factors. Int. J. Sports Phys. Ther. 2018, 13, 633–642. [Google Scholar] [CrossRef]
- Bayram, H.A.; Yalcin, B. The influence of biofeedback on physiological and kinematic variables of treadmill running. Int. J. Perform. Anal. Sport 2021, 21, 156–169. [Google Scholar] [CrossRef]
- Armitage, M.; Beato, M.; McErlain-Naylor, S.A. Inter-unit reliability of IMU Step metrics using IMeasureU Blue Trident inertial measurement units for running-based team sport tasks. J. Sports Sci. 2021, 39, 1512–1518. [Google Scholar] [CrossRef]
- Backes, A.; Skejø, S.D.; Gette, P.; Nielsen, R.Ø.; Sørensen, H.; Morio, C.; Malisoux, L. Predicting cumulative load during running using field-based measures. Scand. J. Med. Sci. Sports 2020, 30, 2399–2407. [Google Scholar] [CrossRef]
- Bailey, G.P.; Harle, R.K. Sampling Rates and Sensor Requirements for Kinematic Assessment During Running Using Foot Mounted IMUs. Interakt. Syst. 2015, 556, 42–56. [Google Scholar] [CrossRef]
- Barnes, M.; Guy, J.; Elsworthy, N.; Scanlan, A. A Comparison of PlayerLoadTM and Heart Rate during Backwards and Forwards Locomotion during Intermittent Exercise in Rugby League Players. Sports 2021, 9, 21. [Google Scholar] [CrossRef]
- Bastiaansen, B.; Wilmes, E.; Brink, M.; De Ruiter, C.J.; Savelsbergh, G.J.; Steijlen, A.; Jansen, K.; Van Der Helm, F.C.; Goedhart, E.A.; Van Der Laan, D.; et al. An Inertial Measurement Unit Based Method to Estimate Hip and Knee Joint Kinematics in Team Sport Athletes on the Field. J. Vis. Exp. 2020, e60857. [Google Scholar] [CrossRef]
- Benson, L.C.; Clermont, C.A.; Osis, S.T.; Kobsar, D.; Ferber, R. Classifying running speed conditions using a single wearable sensor: Optimal segmentation and feature extraction methods. J. Biomech. 2018, 71, 94–99. [Google Scholar] [CrossRef]
- Bergamini, E.; Picerno, P.; Pillet, H.; Natta, F.; Thoreux, P.; Camomilla, V. Estimation of temporal parameters during sprint running using a trunk-mounted inertial measurement unit. J. Biomech. 2012, 45, 1123–1126. [Google Scholar] [CrossRef]
- Boey, H.; Aeles, J.; Schütte, K.; Vanwanseele, B. The effect of three surface conditions, speed and running experience on vertical acceleration of the tibia during running. Sports Biomech. 2016, 16, 166–176. [Google Scholar] [CrossRef]
- Boyer, K.A.; Nigg, B.M. Quantification of the input signal for soft tissue vibration during running. J. Biomech. 2007, 40, 1877–1880. [Google Scholar] [CrossRef]
- Boyer, K.A.; Nigg, B.M. Muscle activity in the leg is tuned in response to impact force characteristics. J. Biomech. 2004, 37, 1583–1588. [Google Scholar] [CrossRef]
- Brayne, L.; Barnes, A.; Heller, B.; Wheat, J. Using a wireless consumer accelerometer to measure tibial acceleration during running: Agreement with a skin-mounted sensor. Sports Eng. 2018, 21, 487–491. [Google Scholar] [CrossRef]
- Buchheit, M.; Gray, A.; Morin, J.-B. Assessing Stride Variables and Vertical Stiffness with GPS-Embedded Accel-erometers: Preliminary Insights for the Monitoring of Neuromuscular Fatigue on the Field. J. Sports Sci. Med. 2015, 14, 698–701. [Google Scholar]
- Butler, R.J.; Davis, I.M.; Laughton, C.M.; Hughes, M. Dual-Function Foot Orthosis: Effect on Shock and Control of Rearfoot Motion. Foot Ankle Int. 2003, 24, 410–414. [Google Scholar] [CrossRef] [PubMed]
- Camelio, K.; Gruber, A.H.; Powell, D.W.; Paquette, M.R. Influence of Prolonged Running and Training on Tibial Acceleration and Movement Quality in Novice Runners. J. Athl. Train. 2020, 55, 1292–1299. [Google Scholar] [CrossRef] [PubMed]
- Carrier, B.; Creer, A.; Williams, L.R.; Holmes, T.M.; Jolley, B.D.; Dahl, S.; Weber, E.; Standifird, T. Validation of Garmin Fenix 3 HR Fitness Tracker Biomechanics and Metabolics (VO2max). J. Meas. Phys. Behav. 2020, 3, 331–337. [Google Scholar] [CrossRef]
- Castillo, E.R.; Lieberman, D.E. Shock attenuation in the human lumbar spine during walking and running. J. Exp. Biol. 2018, 221, jeb177949. [Google Scholar] [CrossRef]
- Chen, C.-H.; Yang, W.-W.; Chen, Y.-P.; Chen, V.C.-F.; Liu, C.; Shiang, T.-Y. High vibration frequency of soft tissue occurs during gait in power-trained athletes. J. Sports Sci. 2021, 39, 439–445. [Google Scholar] [CrossRef]
- Cheung, R.T.H.; An, W.W.; Au, I.P.H.; Zhang, J.H.; Chan, Z.Y.S.; MacPhail, A.J. Control of impact loading during distracted running before and after gait retraining in runners. J. Sports Sci. 2017, 36, 1497–1501. [Google Scholar] [CrossRef]
- Cheung, R.T.H.; Zhang, J.H.; Chan, Z.Y.S.; An, W.W.; Au, I.P.; MacPhail, A.; Davis, I.S. Shoe-mounted accelerometers should be used with caution in gait retraining. Scand. J. Med. Sci. Sports 2019, 29, 835–842. [Google Scholar] [CrossRef]
- Ching, E.; An, W.W.-K.; Au, I.P.H.; Zhang, J.H.; Chan, Z.Y.; Shum, G.; Cheung, R.T. Impact Loading During Distracted Running Before and After Auditory Gait Retraining. Int. J. Sports Med. 2018, 39, 1075–1080. [Google Scholar] [CrossRef]
- Chu, J.J.; Caldwell, G.E. Stiffness and Damping Response Associated with Shock Attenuation in Downhill Running. J. Appl. Biomech. 2004, 20, 291–308. [Google Scholar] [CrossRef]
- Clark, R.A.; Bartold, S.; Bryant, A.L. Tibial acceleration variability during consecutive gait cycles is influenced by the menstrual cycle. Clin. Biomech. 2010, 25, 557–562. [Google Scholar] [CrossRef]
- Creaby, M.W.; Smith, M.M.F. Retraining running gait to reduce tibial loads with clinician or accelerometry guided feedback. J. Sci. Med. Sport 2016, 19, 288–292. [Google Scholar] [CrossRef] [PubMed]
- Crowell, H.P.; Milner, C.E.; Hamill, J.; Davis, I.S. Reducing Impact Loading During Running With the Use of Real-Time Visual Feedback. J. Orthop. Sports Phys. Ther. 2010, 40, 206–213. [Google Scholar] [CrossRef] [PubMed]
- Day, E.M.; Alcantara, R.S.; McGeehan, M.A.; Grabowski, A.M.; Hahn, M.E. Low-pass filter cutoff frequency affects sacral-mounted inertial measurement unit estimations of peak vertical ground reaction force and contact time during treadmill running. J. Biomech. 2021, 119, 110323. [Google Scholar] [CrossRef]
- De La Fuente, C.; Henriquez, H.; Andrade, D.C.; Yañez, A. Running Footwear with Custom Insoles for Pressure Distribution Are Appropriate to Diminish Impacts After Shin Splints. Asian J. Sports Med. 2019, 10, 1–7. [Google Scholar] [CrossRef]
- Deflandre, D.; Miny, K.; Schwartz, C.; Dardenne, N.; Leclerc, A.F.; Bury, T. Myotest efficiency in the mechanical analysis of the stride. Gazzetta Medica Ital. Arch. Sci. Mediche 2018, 177, 293–300. [Google Scholar] [CrossRef]
- DeJong, M.A.F.; Hertel, J. Validation of Foot-Strike Assessment Using Wearable Sensors During Running. J. Athl. Train. 2020, 55, 1307–1310. [Google Scholar] [CrossRef] [PubMed]
- Derrick, T.R.; Dereu, D.; McLean, S.P. Impacts and kinematic adjustments during an exhaustive run. Med. Sci. Sports Exerc. 2002, 34, 998–1002. [Google Scholar] [CrossRef]
- Dufek, J.S.; Mercer, J.A.; Griffin, J.R. The Effects of Speed and Surface Compliance on Shock Attenuation Characteristics for Male and Female Runners. J. Appl. Biomech. 2009, 25, 219–228. [Google Scholar] [CrossRef][Green Version]
- Eggers, T.M.; Massard, T.I.; Clothier, P.J.; Lovell, R. Measuring Vertical Stiffness in Sport With Accelerometers: Exercise Caution! J. Strength Cond. Res. 2018, 32, 1919–1922. [Google Scholar] [CrossRef]
- Encarnación-Martínez, A.; Sanchis-Sanchis, R.; Pérez-Soriano, P.; García-Gallart, A. Relationship between muscular extensibility, strength and stability and the transmission of impacts during fatigued running. Sports Biomech. 2020, 1–17. [Google Scholar] [CrossRef]
- Encarnación-Martínez, A.; García-Gallart, A.; Gallardo, A.M.; Sánchez-Sáez, J.A.; Sánchez-Sánchez, J. Effects of structural components of artificial turf on the transmission of impacts in football players. Sports Biomech. 2017, 17, 251–260. [Google Scholar] [CrossRef] [PubMed]
- Encarnación-Martínez, A.; Pérez-Soriano, P.; Sanchis-Sanchis, R.; García-Gallart, A.; Berenguer-Vidal, R. Validity and Reliability of an Instrumented Treadmill with an Accelerometry System for Assessment of Spatio-Temporal Parameters and Impact Transmission. Sensors 2021, 21, 1758. [Google Scholar] [CrossRef]
- Friesenbichler, B.; Stirling, L.M.; Federolf, P.; Nigg, B.M. Tissue vibration in prolonged running. J. Biomech. 2011, 44, 116–120. [Google Scholar] [CrossRef] [PubMed]
- Fu, W.; Fang, Y.; Liu, D.M.S.; Wang, L.; Ren, S.; Liu, Y. Surface effects on in-shoe plantar pressure and tibial impact during running. J. Sport Health Sci. 2015, 4, 384–390. [Google Scholar] [CrossRef]
- Gantz, A.M.; Derrick, T.R. Kinematics and metabolic cost of running on an irregular treadmill surface. J. Sports Sci. 2017, 36, 1103–1110. [Google Scholar] [CrossRef] [PubMed]
- Garcia, M.C.; Gust, G.; Bazett-Jones, D.M. Tibial acceleration and shock attenuation while running over different surfaces in a trail environment. J. Sci. Med. Sport 2021, 24, 1161–1165. [Google Scholar] [CrossRef]
- García-Pérez, J.A.; Pérez-Soriano, P.; Belloch, S.L.; Lucas, A.; Sánchez-Zuriaga, D. Effects of treadmill running and fatigue on impact acceleration in distance running. Sports Biomech. 2014, 13, 259–266. [Google Scholar] [CrossRef]
- Giandolini, M.; Poupard, T.; Gimenez, P.; Horvais, N.; Millet, G.; Morin, J.-B.; Samozino, P. A simple field method to identify foot strike pattern during running. J. Biomech. 2014, 47, 1588–1593. [Google Scholar] [CrossRef]
- Giandolini, M.; Horvais, N.; Farges, Y.; Samozino, P.; Morin, J.-B. Impact reduction through long-term intervention in recreational runners: Midfoot strike pattern versus low-drop/low-heel height footwear. Eur. J. Appl. Physiol. 2013, 113, 2077–2090. [Google Scholar] [CrossRef]
- Glassbrook, D.J.; Fuller, J.T.; Alderson, J.A.; Doyle, T.L.A. Foot accelerations are larger than tibia accelerations during sprinting when measured with inertial measurement units. J. Sports Sci. 2019, 38, 248–255. [Google Scholar] [CrossRef]
- Gullstrand, L.; Halvorsen, K.; Tinmark, F.; Eriksson, M.; Nilsson, J. Measurements of vertical displacement in running, a methodological comparison. Gait Posture 2009, 30, 71–75. [Google Scholar] [CrossRef]
- Hardin, E.C.; Hamill, J. The Influence of Midsole Cushioning on Mechanical and Hematological Responses during a Prolonged Downhill Run. Res. Q. Exerc. Sport 2002, 73, 125–133. [Google Scholar] [CrossRef] [PubMed]
- Iosa, M.; Morelli, D.; Nisi, E.; Sorbara, C.; Negrini, S.; Gentili, P.; Paolucci, S.; Fusco, A. Assessment of upper body accelerations in young adults with intellectual disabilities while walking, running, and dual-task running. Hum. Mov. Sci. 2014, 34, 187–195. [Google Scholar] [CrossRef] [PubMed]
- Morelli, D.; Marro, T.; Paolucci, S.; Fusco, A.; Iosa, M. Ability and Stability of Running and Walking in Children with Cerebral Palsy. Neuropediatrics 2013, 44, 147–154. [Google Scholar] [CrossRef]
- Johnson, C.D.; Outerleys, J.; Jamison, S.T.; Tenforde, A.S.; Ruder, M.; Davis, I.S. Comparison of Tibial Shock during Treadmill and Real-World Running. Med. Sci. Sports Exerc. 2020, 52, 1557–1562. [Google Scholar] [CrossRef] [PubMed]
- Johnson, C.D.; Outerleys, J.; Davis, I.S. Relationships between tibial acceleration and ground reaction force measures in the medial-lateral and anterior-posterior planes. J. Biomech. 2021, 117, 110250. [Google Scholar] [CrossRef] [PubMed]
- Johnson, C.D.; Outerleys, J.; Tenforde, A.S.; Davis, I.S. A comparison of attachment methods of skin mounted inertial measurement units on tibial accelerations. J. Biomech. 2020, 113, 110118. [Google Scholar] [CrossRef]
- Kawabata, M.; Goto, K.; Fukusaki, C.; Sasaki, K.; Hihara, E.; Mizushina, T.; Ishii, N. Acceleration patterns in the lower and upper trunk during running. J. Sports Sci. 2013, 31, 1841–1853. [Google Scholar] [CrossRef]
- Kenneally-Dabrowski, C.J.; Serpell, B.G.; Spratford, W. Are accelerometers a valid tool for measuring overground sprinting symmetry? Int. J. Sports Sci. Coach. 2017, 13, 270–277. [Google Scholar] [CrossRef]
- Khassetarash, A.; Hassannejad, R.; Ettefagh, M.M.; Sari-Sarraf, V. Fatigue and soft tissue vibration during prolonged running. Hum. Mov. Sci. 2015, 44, 157–167. [Google Scholar] [CrossRef]
- Kobsar, D.; Osis, S.T.; Hettinga, B.A.; Ferber, R. Classification accuracy of a single tri-axial accelerometer for training background and experience level in runners. J. Biomech. 2014, 47, 2508–2511. [Google Scholar] [CrossRef] [PubMed]
- Koldenhoven, R.M.; Hertel, J. Validation of a Wearable Sensor for Measuring Running Biomechanics. Digit. Biomark. 2018, 2, 74–78. [Google Scholar] [CrossRef] [PubMed]
- Le Bris, R.; Billat, V.; Auvinet, B.; Chaleil, D.; Hamard, L.; Barrey, E. Effect of fatigue on stride pattern continuously measured by an accelerometric gait recorder in middle distance runners. J. Sports Med. Phys. Fit. 2006, 46, 227–231. [Google Scholar]
- LeDuc, C.; Tee, J.; Lacome, M.; Weakley, J.; Cheradame, J.; Ramirez, C.; Jones, B. Convergent Validity, Reliability, and Sensitivity of a Running Test to Monitor Neuromuscular Fatigue. Int. J. Sports Physiol. Perform. 2020, 15, 1067–1073. [Google Scholar] [CrossRef]
- Lee, J.B.; Sutter, K.J.; Askew, C.D.; Burkett, B.J. Identifying symmetry in running gait using a single inertial sensor. J. Sci. Med. Sport 2010, 13, 559–563. [Google Scholar] [CrossRef]
- Lee, Y.-S.; Ho, C.-S.; Shih, Y.; Chang, S.-Y.; Róbert, F.J.; Shiang, T.-Y. Assessment of walking, running, and jumping movement features by using the inertial measurement unit. Gait Posture 2015, 41, 877–881. [Google Scholar] [CrossRef]
- Lin, S.-P.; Sung, W.-H.; Kuo, F.-C.; Kuo, T.B.; Chen, J.-J. Impact of Center-of-Mass Acceleration on the Performance of Ultramarathon Runners. J. Hum. Kinet. 2014, 44, 41–52. [Google Scholar] [CrossRef]
- Lindsay, T.R.; Yaggie, J.A.; McGregor, S.J. A wireless accelerometer node for reliable and valid measurement of lumbar accelerations during treadmill running. Sports Biomech. 2016, 15, 11–22. [Google Scholar] [CrossRef]
- Lindsay, T.R.; Yaggie, J.A.; McGregor, S.J. Contributions of lower extremity kinematics to trunk accelerations during moderate treadmill running. J. Neuroeng. Rehabilit. 2014, 11, 162. [Google Scholar] [CrossRef]
- Lucas-Cuevas, A.G.; Encarnación-Martínez, A.; Camacho-García, A.; Llana-Belloch, S.; Pérez-Soriano, P. The location of the tibial accelerometer does influence impact acceleration parameters during running. J. Sports Sci. 2016, 35, 1734–1738. [Google Scholar] [CrossRef]
- Lucas-Cuevas, A.G.; Quesada, J.I.P.; Giménez, J.V.; Aparicio, I.; Jimenez-Perez, I.; Pérez-Soriano, P. Initiating running barefoot: Effects on muscle activation and impact accelerations in habitually rearfoot shod runners. Eur. J. Sport Sci. 2016, 16, 1145–1152. [Google Scholar] [CrossRef] [PubMed]
- Lucas-Cuevas, A.G.; García, A.C.; Llinares, R.; Quesada, J.I.P.; Llana-Belloch, S.; Pérez-Soriano, P. Influence of custom-made and prefabricated insoles before and after an intense run. PLoS ONE 2017, 12, e0173179. [Google Scholar] [CrossRef] [PubMed]
- Macadam, P.; Nuell, S.; Cronin, J.B.; Diewald, S.; Neville, J. Thigh positioned wearable resistance improves 40 m sprint performance: A longitudinal single case design study. J. Aust. Strength Cond. 2019, 27, 39–45. [Google Scholar]
- Macadam, P.; Cronin, J.B.; Uthoff, A.M.; Nagahara, R.; Zois, J.; Diewald, S.; Tinwala, F.; Neville, J. Thigh loaded wearable resistance increases sagittal plane rotational work of the thigh resulting in slower 50-m sprint times. Sports Biomech. 2020, 1–12. [Google Scholar] [CrossRef] [PubMed]
- Macadam, P.; Nuell, S.; Cronin, J.B.; Diewald, S.; Rowley, R.; Forster, J.; Fosch, P. Load effects of thigh wearable resistance on angular and linear kinematics and kinetics during non-motorised treadmill sprint-running. Eur. J. Sport Sci. 2021, 21, 531–538. [Google Scholar] [CrossRef] [PubMed]
- Macdermid, P.W.; Fink, P.W.; Stannard, S.R. Shock attenuation, spatio-temporal and physiological parameter comparisons between land treadmill and water treadmill running. J. Sport Health Sci. 2015, 6, 482–488. [Google Scholar] [CrossRef]
- Mangubat, A.L.S.; Zhang, J.H.; Chan, Z.Y.-S.; MacPhail, A.J.; Au, I.P.-H.; Cheung, R.T.-H. Biomechanical Outcomes Due to Impact Loading in Runners While Looking Sideways. J. Appl. Biomech. 2018, 34, 483–487. [Google Scholar] [CrossRef]
- Masci, I.; Vannozzi, G.; Bergamini, E.; Pesce, C.; Getchell, N.; Cappozzo, A. Assessing locomotor skills development in childhood using wearable inertial sensor devices: The running paradigm. Gait Posture 2013, 37, 570–574. [Google Scholar] [CrossRef]
- McGregor, S.J.; Busa, M.A.; Skufca, J.; Yaggie, J.A.; Bollt, E.M. Control entropy identifies differential changes in complexity of walking and running gait patterns with increasing speed in highly trained runners. Chaos Interdiscip. J. Nonlinear Sci. 2009, 19, 026109. [Google Scholar] [CrossRef]
- Mercer, J.A.; Chona, C. Stride length–velocity relationship during running with body weight support. J. Sport Health Sci. 2015, 4, 391–395. [Google Scholar] [CrossRef]
- Mercer, J.A.; Vance, J.; Hreljac, A.; Hamill, J. Relationship between shock attenuation and stride length during running at different velocities. Graefe’s Arch. Clin. Exp. Ophthalmol. 2002, 87, 403–408. [Google Scholar] [CrossRef] [PubMed]
- Mercer, J.A.; Devita, P.; Derrick, T.R.; Bates, B.T. Individual Effects of Stride Length and Frequency on Shock Attenuation during Running. Med. Sci. Sports Exerc. 2003, 35, 307–313. [Google Scholar] [CrossRef] [PubMed]
- Mercer, J.A.; Dufek, J.S.; Mangus, B.C.; Rubley, M.D.; Bhanot, K.; Aldridge, J.M. A Description of Shock Attenuation for Children Running. J. Athl. Train. 2010, 45, 259–264. [Google Scholar] [CrossRef] [PubMed]
- Mercer, J.A.; Bates, B.T.; Dufek, J.; Hreljac, A. Characteristics of shock attenuation during fatigued running. J. Sports Sci. 2003, 21, 911–919. [Google Scholar] [CrossRef]
- Meyer, U.; Ernst, D.; Schott, S.; Riera, C.; Hattendorf, J.; Romkes, J.; Granacher, U.; Göpfert, B.; Kriemler, S. Validation of two accelerometers to determine mechanical loading of physical activities in children. J. Sports Sci. 2015, 33, 1702–1709. [Google Scholar] [CrossRef] [PubMed]
- Meyer, C.; Mohr, M.; Falbriard, M.; Nigg, S.R.; Nigg, B.M. Influence of footwear comfort on the variability of running kinematics. Footwear Sci. 2017, 10, 29–38. [Google Scholar] [CrossRef]
- Mitschke, C.; Öhmichen, M.; Milani, T.L. A Single Gyroscope Can Be Used to Accurately Determine Peak Eversion Velocity during Locomotion at Different Speeds and in Various Shoes. Appl. Sci. 2017, 7, 659. [Google Scholar] [CrossRef]
- Mitschke, C.; Zaumseil, F.; Milani, T.L. The influence of inertial sensor sampling frequency on the accuracy of measurement parameters in rearfoot running. Comput. Methods Biomech. Biomed. Eng. 2017, 20, 1502–1511. [Google Scholar] [CrossRef]
- Mitschke, C.; Kiesewetter, P.; Milani, T.L. The Effect of the Accelerometer Operating Range on Biomechanical Parameters: Stride Length, Velocity, and Peak Tibial Acceleration during Running. Sensors 2018, 18, 130. [Google Scholar] [CrossRef]
- Montgomery, G.; Abt, G.; Dobson, C.; Smith, T.; Ditroilo, M. Tibial impacts and muscle activation during walking, jogging and running when performed overground, and on motorised and non-motorised treadmills. Gait Posture 2016, 49, 120–126. [Google Scholar] [CrossRef]
- Moran, M.; Rickert, B.J.; Greer, B.K. Tibial Acceleration and Spatiotemporal Mechanics in Distance Runners During Reduced-Body-Weight Conditions. J. Sport Rehabilit. 2017, 26, 221–226. [Google Scholar] [CrossRef] [PubMed]
- Morrow, M.M.B.; Hurd, W.J.; Fortune, E.; Lugade, V.; Aufman, K.R.K. Accelerations of the Waist and Lower Extremities over a Range of Gait Velocities to Aid in Activity Monitor Selection for Field-Based Studies. J. Appl. Biomech. 2014, 30, 581–585. [Google Scholar] [CrossRef][Green Version]
- Neugebauer, J.M.; Hawkins, D.A.; Beckett, L. Estimating Youth Locomotion Ground Reaction Forces Using an Accelerometer-Based Activity Monitor. PLoS ONE 2012, 7, e48182. [Google Scholar] [CrossRef] [PubMed]
- Nüesch, C.; Roos, E.; Pagenstert, G.; Muendermann, A. Measuring joint kinematics of treadmill walking and running: Comparison between an inertial sensor based system and a camera-based system. J. Biomech. 2017, 57, 32–38. [Google Scholar] [CrossRef] [PubMed]
- O’Connor, K.M.; Hamill, J. Does Running on a Cambered Road Predispose a Runner to Injury? J. Appl. Biomech. 2002, 18, 3–14. [Google Scholar] [CrossRef]
- Provot, T.; Chiementin, X.; Oudin, E.; Bolaers, F.; Murer, S. Validation of a High Sampling Rate Inertial Measurement Unit for Acceleration During Running. Sensors 2017, 17, 1958. [Google Scholar] [CrossRef]
- Provot, T.; Chiementin, X.; Bolaers, F.; Murer, S. Effect of running speed on temporal and frequency indicators from wearable MEMS accelerometers. Sports Biomech. 2021, 20, 831–843. [Google Scholar] [CrossRef]
- Rabuffetti, M.; Scalera, G.M.; Ferrarin, M. Effects of Gait Strategy and Speed on Regularity of Locomotion Assessed in Healthy Subjects Using a Multi-Sensor Method. Sensors 2019, 19, 513. [Google Scholar] [CrossRef]
- Raper, D.P.; Witchalls, J.; Philips, E.J.; Knight, E.; Drew, M.K.; Waddington, G. Use of a tibial accelerometer to measure ground reaction force in running: A reliability and validity comparison with force plates. J. Sci. Med. Sport 2018, 21, 84–88. [Google Scholar] [CrossRef]
- Reenalda, J.; Maartens, E.; Buurke, J.H.; Gruber, A.H. Kinematics and shock attenuation during a prolonged run on the athletic track as measured with inertial magnetic measurement units. Gait Posture 2019, 68, 155–160. [Google Scholar] [CrossRef]
- Schütte, K.H.; Maas, E.A.; Exadaktylos, V.; Berckmans, D.; Venter, R.; Vanwanseele, B. Wireless Tri-Axial Trunk Accelerometry Detects Deviations in Dynamic Center of Mass Motion Due to Running-Induced Fatigue. PLoS ONE 2015, 10, e0141957. [Google Scholar] [CrossRef] [PubMed]
- Schütte, K.H.; Aeles, J.; De Beéck, T.O.; van der Zwaard, B.C.; Venter, R.; Vanwanseele, B. Surface effects on dynamic stability and loading during outdoor running using wireless trunk accelerometry. Gait Posture 2016, 48, 220–225. [Google Scholar] [CrossRef] [PubMed]
- Schütte, K.H.; Sackey, S.; Venter, R.; Vanwanseele, B. Energy cost of running instability evaluated with wearable trunk accelerometry. J. Appl. Physiol. 2018, 124, 462–472. [Google Scholar] [CrossRef] [PubMed]
- Setuain, I.; Lecumberri, P.; Izquierdo, M. Sprint mechanics return to competition follow-up after hamstring injury on a professional soccer player: A case study with an inertial sensor unit based methodological approach. J. Biomech. 2017, 63, 186–191. [Google Scholar] [CrossRef]
- Setuain, I.; Lecumberri, P.; Ahtiainen, J.P.; Mero, A.A.; Häkkinen, K.; Izquierdo, M. Sprint mechanics evaluation using inertial sensor-based technology: A laboratory validation study. Scand. J. Med. Sci. Sports 2017, 28, 463–472. [Google Scholar] [CrossRef]
- Sheerin, K.R.; Besier, T.; Reid, D.; Hume, P.A. The one-week and six-month reliability and variability of three-dimensional tibial acceleration in runners. Sports Biomech. 2017, 17, 531–540. [Google Scholar] [CrossRef]
- Sheerin, K.R.; Besier, T.; Reid, D. The influence of running velocity on resultant tibial acceleration in runners. Sports Biomech. 2020, 19, 750–760. [Google Scholar] [CrossRef]
- Shiang, T.-Y.; Hsieh, T.-Y.; Lee, Y.-S.; Wu, C.-C.; Yu, M.-C.; Mei, C.-H.; Tai, I.-H. Determine the Foot Strike Pattern Using Inertial Sensors. J. Sens. 2016, 2016, 1–6. [Google Scholar] [CrossRef]
- Simoni, L.; Pancani, S.; Vannetti, F.; Macchi, C.; Pasquini, G. Relationship between Lower Limb Kinematics and Upper Trunk Acceleration in Recreational Runners. J. Healthc. Eng. 2020, 2020, 1–7. [Google Scholar] [CrossRef]
- Stickford, A.S.; Chapman, R.F.; Johnston, J.D.; Stager, J.M. Lower-Leg Compression, Running Mechanics, and Economy in Trained Distance Runners. Int. J. Sports Physiol. Perform. 2015, 10, 76–83. [Google Scholar] [CrossRef]
- TenBroek, T.M.; Rodrigues, P.A.; Frederick, E.C.; Hamill, J. Midsole Thickness Affects Running Patterns in Habitual Rearfoot Strikers During a Sustained Run. J. Appl. Biomech. 2014, 30, 521–528. [Google Scholar] [CrossRef] [PubMed]
- Tenforde, A.S.; Hayano, T.; Jamison, S.T.; Outerleys, J.; Davis, I.S. Tibial Acceleration Measured from Wearable Sensors Is Associated with Loading Rates in Injured Runners. PM&R 2020, 12, 679–684. [Google Scholar] [CrossRef]
- Thomas, J.M.; Derrick, T.R. Effects of Step Uncertainty on Impact Peaks, Shock Attenuation, and Knee/Subtalar Synchrony in Treadmill Running. J. Appl. Biomech. 2003, 19, 60–70. [Google Scholar] [CrossRef]
- Tirosh, O.; Steinberg, N.; Nemet, D.; Eliakim, A.; Orland, G. Visual feedback gait re-training in overweight children can reduce excessive tibial acceleration during walking and running: An experimental intervention study. Gait Posture 2019, 68, 101–105. [Google Scholar] [CrossRef] [PubMed]
- Tirosh, O.; Orland, G.; Eliakim, A.; Nemet, D.; Steinberg, N. Tibial impact accelerations in gait of primary school children: The effect of age and speed. Gait Posture 2017, 57, 265–269. [Google Scholar] [CrossRef] [PubMed]
- Tirosh, O.; Orland, G.; Eliakim, A.; Nemet, D.; Steinberg, N. Attenuation of Lower Body Acceleration in Overweight and Healthy-Weight Children During Running. J. Appl. Biomech. 2020, 36, 33–38. [Google Scholar] [CrossRef]
- Van Werkhoven, H.; Farina, K.; Langley, M.H. Using A Soft Conformable Foot Sensor to Measure Changes in Foot Strike Angle During Running. Sports 2019, 7, 184. [Google Scholar] [CrossRef]
- Walsh, G.S. Dynamics of Modular Neuromotor Control of Walking and Running during Single and Dual Task Conditions. Neurosci. 2021, 465, 1–10. [Google Scholar] [CrossRef]
- Waite, N.; Goetschius, J.; Lauver, J.D. Effect of Grade and Surface Type on Peak Tibial Acceleration in Trained Distance Runners. J. Appl. Biomech. 2021, 37, 2–5. [Google Scholar] [CrossRef]
- Winter, S.C.; Lee, J.B.; Leadbetter, R.I.; Gordon, S.J. Validation of a Single Inertial Sensor for Measuring Running Kinematics Overground during a Prolonged Run. J. Fit. Res. 2016, 5, 14–23. [Google Scholar]
- Wixted, A.; Billing, D.C.; James, D. Validation of trunk mounted inertial sensors for analysing running biomechanics under field conditions, using synchronously collected foot contact data. Sports Eng. 2010, 12, 207–212. [Google Scholar] [CrossRef]
- Wood, C.M.; Kipp, K. Use of audio biofeedback to reduce tibial impact accelerations during running. J. Biomech. 2014, 47, 1739–1741. [Google Scholar] [CrossRef] [PubMed]
- Wundersitz, D.; Gastin, P.B.; Richter, C.; Robertson, S.J.; Netto, K. Validity of a trunk-mounted accelerometer to assess peak accelerations during walking, jogging and running. Eur. J. Sport Sci. 2015, 15, 382–390. [Google Scholar] [CrossRef] [PubMed]
- Zhang, J.H.; Chan, Z.Y.-S.; Au, I.P.-H.; An, W.W.; Shull, P.B.; Cheung, R.T.-H. Transfer Learning Effects of Biofeedback Running Retraining in Untrained Conditions. Med. Sci. Sports Exerc. 2019, 51, 1904–1908. [Google Scholar] [CrossRef] [PubMed]
- Zhang, J.H.; An, W.W.; Au, I.P.; Chen, T.L.; Cheung, R.T. Comparison of the correlations between impact loading rates and peak accelerations measured at two different body sites: Intra- and inter-subject analysis. Gait Posture 2016, 46, 53–56. [Google Scholar] [CrossRef]
- Aubry, R.L.; Power, G.A.; Burr, J.F. An Assessment of Running Power as a Training Metric for Elite and Recreational Runners. J. Strength Cond. Res. 2018, 32, 2258–2264. [Google Scholar] [CrossRef]
- Austin, C.L.; Hokanson, J.F.; McGinnis, P.M.; Patrick, S. The Relationship between Running Power and Running Economy in Well-Trained Distance Runners. Sports 2018, 6, 142. [Google Scholar] [CrossRef]
- Barrett, S.; Midgley, A.; Lovell, R. PlayerLoadTM: Reliability, Convergent Validity, and Influence of Unit Position during Treadmill Running. Int. J. Sports Physiol. Perform. 2014, 9, 945–952. [Google Scholar] [CrossRef]
- De Brabandere, A.; De Beéck, T.O.; Schütte, K.H.; Meert, W.; Vanwanseele, B.; Davis, J. Data fusion of body-worn accelerometers and heart rate to predict VO2max during submaximal running. PLoS ONE 2018, 13, e0199509. [Google Scholar] [CrossRef]
- Cher, P.H.; Worringham, C.J.; Stewart, I.B. Human runners exhibit a least variable gait speed. J. Sports Sci. 2016, 35, 2211–2219. [Google Scholar] [CrossRef]
- Clansey, A.C.; Lake, M.J.; Wallace, E.S.; Feehally, T.; Hanlon, M. Can Trained Runners Effectively Attenuate Impact Acceleration During Repeated High-Intensity Running Bouts? J. Appl. Biomech. 2016, 32, 261–268. [Google Scholar] [CrossRef][Green Version]
- Clermont, C.A.; Benson, L.C.; Osis, S.T.; Kobsar, D.; Ferber, R. Running patterns for male and female competitive and recreational runners based on accelerometer data. J. Sports Sci. 2019, 37, 204–211. [Google Scholar] [CrossRef] [PubMed]
- Clermont, C.A.; Pohl, A.J.; Ferber, R. Fatigue-Related Changes in Running Gait Patterns Persist in the Days Following a Marathon Race. J. Sport Rehabilit. 2020, 29, 934–941. [Google Scholar] [CrossRef] [PubMed]
- Dériaz, O.; Najafi, B.; Ballabeni, P.; Crettenand, A.; Gobelet, C.; Aminian, K.; Rizzoli, R.; Gremion, G. Proximal tibia volumetric bone mineral density is correlated to the magnitude of local acceleration in male long-distance runners. J. Appl. Physiol. 2010, 108, 852–857. [Google Scholar] [CrossRef] [PubMed]
- Enders, H.; von Tscharner, V.; Nigg, B.M. The effects of preferred and non-preferred running strike patterns on tissue vibration properties. J. Sci. Med. Sport 2014, 17, 218–222. [Google Scholar] [CrossRef]
- Garcia-Byrne, F.; Wycherley, T.; Bishop, C.; Schwerdt, S.; Porter, J.; Buckley, J. Accelerometer detected lateral sway during a submaximal running test correlates with endurance exercise performance in elite Australian male cricket players. J. Sci. Med. Sport 2019, 23, 519–523. [Google Scholar] [CrossRef]
- Giandolini, M.; Horvais, N.; Rossi, J.; Millet, G.; Samozino, P.; Morin, J.-B. Foot strike pattern differently affects the axial and transverse components of shock acceleration and attenuation in downhill trail running. J. Biomech. 2016, 49, 1765–1771. [Google Scholar] [CrossRef]
- Giandolini, M.; Horvais, N.; Rossi, J.; Millet, G.; Morin, J.-B.; Samozino, P. Effects of the foot strike pattern on muscle activity and neuromuscular fatigue in downhill trail running. Scand. J. Med. Sci. Sports 2016, 27, 809–819. [Google Scholar] [CrossRef]
- Horvais, N.; Samozino, P.; Chiementin, X.; Morin, J.-B.; Giandolini, M. Cushioning perception is associated with both tibia acceleration peak and vibration magnitude in heel-toe running. Footwear Sci. 2019, 11, 35–44. [Google Scholar] [CrossRef]
- Hughes, T.; Jones, R.K.; Starbuck, C.; Sergeant, J.C.; Callaghan, M. The value of tibial mounted inertial measurement units to quantify running kinetics in elite football (soccer) players. A reliability and agreement study using a research orientated and a clinically orientated system. J. Electromyogr. Kinesiol. 2019, 44, 156–164. [Google Scholar] [CrossRef]
- Koska, D.; Gaudel, J.; Hein, T.; Maiwald, C. Validation of an inertial measurement unit for the quantification of rearfoot kinematics during running. Gait Posture 2018, 64, 135–140. [Google Scholar] [CrossRef] [PubMed]
- Melo, C.C.; Carpes, F.P.; Vieira, T.M.; Mendes, T.T.; de Paula, L.V.; Chagas, M.H.; Peixoto, G.H.; de Andrade, A.G.P. Correlation between running asymmetry, mechanical efficiency, and performance during a 10 km run. J. Biomech. 2020, 109, 109913. [Google Scholar] [CrossRef] [PubMed]
- Moltó, I.N.; Albiach, J.P.; Amer-Cuenca, J.J.; Segura-Ortí, E.; Gabriel, W.; Martínez-Gramage, J. Wearable Sensors Detect Differences between the Sexes in Lower Limb Electromyographic Activity and Pelvis 3D Kinematics during Running. Sensors 2020, 20, 6478. [Google Scholar] [CrossRef] [PubMed]
- Morio, C.; Sevrez, V.; Chavet, P.; Berton, E.; Nicol, C. Neuro-mechanical adjustments to shod versus barefoot treadmill runs in the acute and delayed stretch-shortening cycle recovery phases. J. Sports Sci. 2016, 34, 738–745. [Google Scholar] [CrossRef]
- Murray, A.M.; Ryu, J.H.; Sproule, J.; Turner, A.P.; Graham-Smith, P.; Cardinale, M. A Pilot Study Using Entropy as a Noninvasive Assessment of Running. Int. J. Sports Physiol. Perform. 2017, 12, 1119–1122. [Google Scholar] [CrossRef][Green Version]
- Navalta, J.W.; Montes, J.; Bodell, N.G.; Aguilar, C.D.; Radzak, K.; Manning, J.W.; DeBeliso, M. Reliability of Trail Walking and Running Tasks Using the Stryd Power Meter. Int. J. Sports Med. 2019, 40, 498–502. [Google Scholar] [CrossRef]
- Olin, E.D.; Gutierrez, G.M. EMG and tibial shock upon the first attempt at barefoot running. Hum. Mov. Sci. 2013, 32, 343–352. [Google Scholar] [CrossRef]
- Perrotin, N.; Gardan, N.; Lesprillier, A.; Le Goff, C.; Seigneur, J.-M.; Abdi, E.; Sanudo, B.; Taiar, R. Biomechanics of Trail Running Performance: Quantification of Spatio-Temporal Parameters by Using Low Cost Sensors in Ecological Conditions. Appl. Sci. 2021, 11, 2093. [Google Scholar] [CrossRef]
- Provot, T.; Munera, M.; Bolaers, F.; Vitry, G.; Chiementin, X. Intra and Inter Test Repeatability of Accelerometric Indicators Measured While Running. Procedia Eng. 2016, 147, 573–577. [Google Scholar] [CrossRef]
- Reenalda, J.; Maartens, E.; Homan, L.; Buurke, J. (Jaap) Continuous three dimensional analysis of running mechanics during a marathon by means of inertial magnetic measurement units to objectify changes in running mechanics. J. Biomech. 2016, 49, 3362–3367. [Google Scholar] [CrossRef]
- Seeley, M.K.; Evans-Pickett, A.; Collins, G.Q.; Tracy, J.B.; Tuttle, N.J.; Rosquist, P.G.; Merrell, A.J.; Christensen, W.F.; Fullwood, D.T.; Bowden, A.E. Predicting vertical ground reaction force during running using novel piezoresponsive sensors and accelerometry. J. Sports Sci. 2020, 38, 1844–1858. [Google Scholar] [CrossRef] [PubMed]
- Shih, Y.; Ho, C.-S.; Shiang, T.-Y. Measuring kinematic changes of the foot using a gyro sensor during intense running. J. Sports Sci. 2013, 32, 550–556. [Google Scholar] [CrossRef] [PubMed]
- Tirosh, O.; Orland, G.; Eliakim, A.; Nemet, D.; Steinberg, N. Repeatability of tibial acceleration measurements made on children during walking and running. J. Sci. Med. Sport 2019, 22, 91–95. [Google Scholar] [CrossRef] [PubMed]
- Ueberschär, O.; Fleckenstein, D.; Wüstenfeld, J.C.; Warschun, F.; Falz, R.; Wolfarth, B. Running on the hypogravity treadmill AlterG® does not reduce the magnitude of peak tibial impact accelerations. Sports Orthop. Traumatol. 2019, 35, 423–434. [Google Scholar] [CrossRef]
- Berghe, P.V.D.; Lorenzoni, V.; Derie, R.; Six, J.; Gerlo, J.; Leman, M.; De Clercq, D. Music-based biofeedback to reduce tibial shock in over-ground running: A proof-of-concept study. Sci. Rep. 2021, 11, 4091. [Google Scholar] [CrossRef]
- van der Bie, J.; Kröse, B. Happy Running? Hybrid Learn. Educ. 2015, 9425, 357–360. [Google Scholar] [CrossRef]
- Weich, C.; Jensen, R.L.; Vieten, M. Triathlon transition study: Quantifying differences in running movement pattern and precision after bike-run transition. Sports Biomech. 2017, 18, 215–228. [Google Scholar] [CrossRef]
- Bigelow, E.M.; Elvin, N.G.; Elvin, A.A.; Arnoczky, S.P. Peak Impact Accelerations during Track and Treadmill Running. J. Appl. Biomech. 2013, 29, 639–644. [Google Scholar] [CrossRef]
- Brahms, C.M.; Zhao, Y.; Gerhard, D.; Barden, J.M. Long-range correlations and stride pattern variability in recreational and elite distance runners during a prolonged run. Gait Posture 2020, 92, 487–492. [Google Scholar] [CrossRef]
- Clermont, C.A.; Benson, L.C.; Edwards, W.B.; Hettinga, B.A.; Ferber, R. New Considerations for Wearable Technology Data: Changes in Running Biomechanics During a Marathon. J. Appl. Biomech. 2019, 35, 401–409. [Google Scholar] [CrossRef]
- DeJong, M.A.F.; Hertel, J. Outdoor Running Activities Captured Using Wearable Sensors in Adult Competitive Runners. Int. J. Athl. Ther. Train. 2020, 25, 76–85. [Google Scholar] [CrossRef]
- Giandolini, M.; Pavailler, S.; Samozino, P.; Morin, J.-B.; Horvais, N. Foot strike pattern and impact continuous measurements during a trail running race: Proof of concept in a world-class athlete. Footwear Sci. 2015, 7, 127–137. [Google Scholar] [CrossRef]
- Gómez-Carmona, C.D.; Bastida-Castillo, A.; González-Custodio, A.; Olcina, G.; Pino-Ortega, J. Using an Inertial Device (WIMU PRO) to Quantify Neuromuscular Load in Running: Reliability, Convergent Validity, and Influence of Type of Surface and Device Location. J. Strength Cond. Res. 2020, 34, 365–373. [Google Scholar] [CrossRef] [PubMed]
- Hoenig, T.; Hamacher, D.; Braumann, K.-M.; Zech, A.; Hollander, K. Analysis of running stability during 5000 m running. Eur. J. Sport Sci. 2019, 19, 413–421. [Google Scholar] [CrossRef] [PubMed]
- Provot, T.; Chiementin, X.; Bolaers, F.; Munera, M. A time to exhaustion model during prolonged running based on wearable accelerometers. Sports Biomech. 2021, 20, 330–343. [Google Scholar] [CrossRef] [PubMed]
- Rojas-Valverde, D.; Sánchez-Ureña, B.; Pino-Ortega, J.; Gómez-Carmona, C.; Gutierrez-Vargas, R.; Timón, R.; Olcina, G. External Workload Indicators of Muscle and Kidney Mechanical Injury in Endurance Trail Running. Int. J. Environ. Res. Public Health 2019, 16, 3909. [Google Scholar] [CrossRef]
- Rojas-Valverde, D.; Timón, R.; Sánchez-Ureña, B.; Pino-Ortega, J.; Martínez-Guardado, I.; Olcina, G. Potential Use of Wearable Sensors to Assess Cumulative Kidney Trauma in Endurance Off-Road Running. J. Funct. Morphol. Kinesiol. 2020, 5, 93. [Google Scholar] [CrossRef]
- Schütte, K.H.; Seerden, S.; Venter, R.; Vanwanseele, B. Influence of outdoor running fatigue and medial tibial stress syndrome on accelerometer-based loading and stability. Gait Posture 2018, 59, 222–228. [Google Scholar] [CrossRef]
- Ueberschär, O.; Fleckenstein, D.; Warschun, F.; Walter, N.; Hoppe, M.W. Case report on lateral asymmetries in two junior elite long-distance runners during a high-altitude training camp. Sports Orthop. Traumatol. 2019, 35, 399–406. [Google Scholar] [CrossRef]
- Ahamed, N.U.; Kobsar, D.; Benson, L.C.; Clermont, C.A.; Osis, S.T.; Ferber, R. Subject-specific and group-based running pattern classification using a single wearable sensor. J. Biomech. 2019, 84, 227–233. [Google Scholar] [CrossRef]
- Ahamed, N.U.; Kobsar, D.; Benson, L.; Clermont, C.; Kohrs, R.; Osis, S.T.; Ferber, R. Using wearable sensors to classify subject-specific running biomechanical gait patterns based on changes in environmental weather conditions. PLoS ONE 2018, 13, e0203839. [Google Scholar] [CrossRef]
- Ahamed, N.U.; Benson, L.C.; Clermont, C.A.; Pohl, A.J.; Ferber, R. New Considerations for Collecting Biomechanical Data Using Wearable Sensors: How Does Inclination Influence the Number of Runs Needed to Determine a Stable Running Gait Pattern? Sensors 2019, 19, 2516. [Google Scholar] [CrossRef] [PubMed]
- Benson, L.C.; Ahamed, N.U.; Kobsar, D.; Ferber, R. New considerations for collecting biomechanical data using wearable sensors: Number of level runs to define a stable running pattern with a single IMU. J. Biomech. 2019, 85, 187–192. [Google Scholar] [CrossRef]
- Cartón-Llorente, A.; García-Pinillos, F.; Royo-Borruel, J.; Rubio-Peirotén, A.; Jaén-Carrillo, D.; Roche-Seruendo, L.E. Estimating Functional Threshold Power in Endurance Running from Shorter Time Trials Using a 6-Axis Inertial Measurement Sensor. Sensors 2021, 21, 582. [Google Scholar] [CrossRef] [PubMed]
- Cerezuela-Espejo, V.; Hernández-Belmonte, A.; Courel-Ibáñez, J.; Conesa-Ros, E.; Martínez-Cava, A.; Pallarés, J.G. Running power meters and theoretical models based on laws of physics: Effects of environments and running conditions. Physiol. Behav. 2020, 223, 112972. [Google Scholar] [CrossRef] [PubMed]
- Colapietro, M.; Fraser, J.J.; Resch, J.E.; Hertel, J. Running mechanics during 1600 meter track runs in young adults with and without chronic ankle instability. Phys. Ther. Sport 2019, 42, 16–25. [Google Scholar] [CrossRef]
- Gregory, C.J.; Koldenhoven, R.M.; Higgins, M.; Hertel, J. External ankle supports alter running biomechanics: A field-based study using wearable sensors. Physiol. Meas. 2019, 40, 044003. [Google Scholar] [CrossRef]
- Hollander, K.; Hamacher, D.; Zech, A. Running barefoot leads to lower running stability compared to shod running - results from a randomized controlled study. Sci. Rep. 2021, 11, 4376. [Google Scholar] [CrossRef]
- Hollis, C.R.; Koldenhoven, R.M.; Resch, J.E.; Hertel, J. Running biomechanics as measured by wearable sensors: Effects of speed and surface. Sports Biomech. 2021, 20, 521–531. [Google Scholar] [CrossRef]
- Kiernan, D.; Hawkins, D.A.; Manoukian, M.A.; McKallip, M.; Oelsner, L.; Caskey, C.F.; Coolbaugh, C.L. Accelerometer-based prediction of running injury in National Collegiate Athletic Association track athletes. J. Biomech. 2018, 73, 201–209. [Google Scholar] [CrossRef]
- Koldenhoven, R.M.; Virostek, M.A.; DeJong, M.A.F.; Higgins, M.; Hertel, J. Increased Contact Time and Strength Deficits in Runners With Exercise-Related Lower Leg Pain. J. Athl. Train. 2020, 55, 1247–1254. [Google Scholar] [CrossRef] [PubMed]
- McGregor, S.J.; Busa, M.A.; Yaggie, J.A.; Bollt, E.M. High Resolution MEMS Accelerometers to Estimate VO2 and Compare Running Mechanics between Highly Trained Inter-Collegiate and Untrained Runners. PLoS ONE 2009, 4, e7355. [Google Scholar] [CrossRef] [PubMed]
- Nüesch, C.; Roos, E.; Egloff, C.; Pagenstert, G.; Mündermann, A. The effect of different running shoes on treadmill running mechanics and muscle activity assessed using statistical parametric mapping (SPM). Gait Posture 2019, 69, 1–7. [Google Scholar] [CrossRef] [PubMed]
- Olcina, G.; Perez-Sousa, M. Ángel; Escobar-Alvarez, J.A.; Timón, R. Effects of Cycling on Subsequent Running Performance, Stride Length, and Muscle Oxygen Saturation in Triathletes. Sports 2019, 7, 115. [Google Scholar] [CrossRef]
- Rochat, N.; Seifert, L.; Guignard, B.; Hauw, D. An enactive approach to appropriation in the instrumented activity of trail running. Cogn. Process. 2019, 20, 459–477. [Google Scholar] [CrossRef]
- Ruder, M.; Jamison, S.T.; Tenforde, A.; Mulloy, F.; Davis, I.S. Relationship of Foot Strike Pattern and Landing Impacts during a Marathon. Med. Sci. Sports Exerc. 2019, 51, 2073–2079. [Google Scholar] [CrossRef]
- Ryan, M.R.; Napier, C.; Greenwood, D.; Paquette, M.R. Comparison of different measures to monitor week-to-week changes in training load in high school runners. Int. J. Sports Sci. Coach. 2021, 16, 370–379. [Google Scholar] [CrossRef]
- Strohrmann, C.; Harms, H.; Kappeler-Setz, C.; Troster, G. Monitoring Kinematic Changes with Fatigue in Running Using Body-Worn Sensors. IEEE Trans. Inf. Technol. Biomed. 2012, 16, 983–990. [Google Scholar] [CrossRef]
- Berghe, P.V.D.; Gosseries, M.; Gerlo, J.; Lenoir, M.; Leman, M.; De Clercq, D. Change-Point Detection of Peak Tibial Acceleration in Overground Running Retraining. Sensors 2020, 20, 1720. [Google Scholar] [CrossRef]
- Vanwanseele, B.; De Beéck, T.O.; Schütte, K.; Davis, J. Accelerometer Based Data Can Provide a Better Estimate of Cumulative Load During Running Compared to GPS Based Parameters. Front. Sports Act. Living 2020, 2, 575596. [Google Scholar] [CrossRef]
- Willis, S.J.; Gellaerts, J.; Mariani, B.; Basset, P.; Borrani, F.; Millet, G.P. Level Versus Uphill Economy and Mechanical Responses in Elite Ultratrail Runners. Int. J. Sports Physiol. Perform. 2019, 14, 1001–1005. [Google Scholar] [CrossRef] [PubMed]
- Bielik, V. Gender differences of running kinematics and economy in trained distance runners. Gazz. Med. Ital. Arch. Sci. Med. 2019, 178, 403–410. [Google Scholar] [CrossRef]
- Bielik, V.; Clementis, M. Running mechanics in recreational runners, soccer and tennis players. Gazzetta Medica Ital. Arch. Sci. Mediche 2017, 176, 461–466. [Google Scholar] [CrossRef]
- Butler, R.J.; Hamill, J.; Davis, I. Effect of footwear on high and low arched runners’ mechanics during a prolonged run. Gait Posture 2007, 26, 219–225. [Google Scholar] [CrossRef]
- Cooper, G.; Sheret, I.; McMillan, L.; Siliverdis, K.; Sha, N.; Hodgins, D.; Kenney, L.; Howard, D. Inertial sensor-based knee flexion/extension angle estimation. J. Biomech. 2009, 42, 2678–2685. [Google Scholar] [CrossRef]
- de Fontenay, B.P.; Roy, J.S.; Dubois, B.; Bouyer, L.; Esculier, J.F. Validating Commercial Wearable Sensors for Running Gait Parameters Estimation. IEEE Sens. J. 2020, 20, 7783–7791. [Google Scholar] [CrossRef]
- Dufek, J.S.; Mercer, J.A.; Teramoto, K.; Mangus, B.C.; Freedman, J.A. Impact attenuation and variability during running in females: A lifespan investigation. J. Sport Rehabilit. 2008, 17, 230–242. [Google Scholar] [CrossRef]
- Garrett, J.; Graham, S.R.; Eston, R.G.; Burgess, D.J.; Garrett, L.J.; Jakeman, J.; Norton, K. A Novel Method of Assessment for Monitoring Neuromuscular Fatigue in Australian Rules Football Players. Int. J. Sports Physiol. Perform. 2019, 14, 598–605. [Google Scholar] [CrossRef]
- Gurchiek, R.D.; McGinnis, R.; Needle, A.R.; McBride, J.M.; van Werkhoven, H. The use of a single inertial sensor to estimate 3-dimensional ground reaction force during accelerative running tasks. J. Biomech. 2017, 61, 263–268. [Google Scholar] [CrossRef]
- Sheerin, K.R.; Reid, D.; Taylor, D.; Besier, T.F. The effectiveness of real-time haptic feedback gait retraining for reducing resultant tibial acceleration with runners. Phys. Ther. Sport 2020, 43, 173–180. [Google Scholar] [CrossRef]
- Ueberschär, O.; Fleckenstein, D.; Warschun, F.; Kränzler, S.; Walter, N.; Hoppe, M.W. Measuring biomechanical loads and asymmetries in junior elite long-distance runners through triaxial inertial sensors. Sports Orthop. Traumatol. 2019, 35, 296–308. [Google Scholar] [CrossRef]
- Zadeh, A.; Taylor, D.; Bertsos, M.; Tillman, T.; Nosoudi, N.; Bruce, S. Predicting Sports Injuries with Wearable Technology and Data Analysis. Inf. Syst. Front. 2021, 23, 1023–1037. [Google Scholar] [CrossRef]
- Taunton, J.E.; Ryan, M.B.; Clement, D.B.; McKenzie, D.C.; Lloyd-Smith, D.R.; Zumbo, B.D. A prospective study of running injuries: The Vancouver Sun Run “In Training” clinics. Br. J. Sports Med. 2003, 37, 239–244. [Google Scholar] [CrossRef] [PubMed]
- Bertelsen, M.L.; Hulme, A.; Petersen, J.; Brund, R.K.; Sørensen, H.; Finch, C.F.; Parner, E.; Nielsen, R.O. A framework for the etiology of running-related injuries. Scand. J. Med. Sci. Sports 2017, 27, 1170–1180. [Google Scholar] [CrossRef] [PubMed]
- Van Hooren, B.; Fuller, J.T.; Buckley, J.D.; Miller, J.R.; Sewell, K.; Rao, G.; Barton, C.; Bishop, C.; Willy, R.W. Is Motorized Treadmill Running Biomechanically Comparable to Overground Running? A Systematic Review and Meta-Analysis of Cross-Over Studies. Sports Med. 2020, 50, 785–813. [Google Scholar] [CrossRef]
- Moe-Nilssen, R.; Helbostad, J.L. Estimation of gait cycle characteristics by trunk accelerometry. J. Biomech. 2004, 37, 121–126. [Google Scholar] [CrossRef]
- Janssen, M.; Scheerder, J.; Thibaut, E.; Brombacher, A.; Vos, S. Who uses running apps and sports watches? Determinants and consumer profiles of event runners’ usage of running-related smartphone applications and sports watches. PLoS ONE 2017, 12, e0181167. [Google Scholar] [CrossRef]
- Pobiruchin, M.; Suleder, J.; Zowalla, R.; Wiesner, M.; Wilson, G.; Mauriello, M.L.; Cena, F. Accuracy and Adoption of Wearable Technology Used by Active Citizens: A Marathon Event Field Study. JMIR mHealth uHealth 2017, 5, e24. [Google Scholar] [CrossRef]
- Clermont, C.A.; Duffett-Leger, L.; Hettinga, B.A.; Ferber, R. Runners’ Perspectives on ‘Smart’ Wearable Technology and Its Use for Preventing Injury. Int. J. Hum.-Comput. Interact. 2019, 36, 31–40. [Google Scholar] [CrossRef]
- Aderem, J.; Louw, Q.A. Biomechanical risk factors associated with iliotibial band syndrome in runners: A systematic review. BMC Musculoskelet. Disord. 2015, 16, 356. [Google Scholar] [CrossRef]
- Andersen, J.J. The State of Running 2019. Available online: https://runrepeat.com/state-of-running?fbclid=IwAR3x_Z4MeyKxCaLBwOTBL8uSqcAnz64s5H_Lh8aGHbsm72GxRz_G4Su1zcU (accessed on 26 May 2021).
- Costello, J.; Bieuzen, F.; Bleakley, C. Where are all the female participants in Sports and Exercise Medicine research? Eur. J. Sport Sci. 2014, 14, 847–851. [Google Scholar] [CrossRef] [PubMed]
- Horsley, B.J.; Tofari, P.J.; Halson, S.L.; Kemp, J.G.; Dickson, J.; Maniar, N.; Cormack, S.J. Does Site Matter? Impact of Inertial Measurement Unit Placement on the Validity and Reliability of Stride Variables During Running: A Systematic Review and Meta-analysis. Sports Med. 2021, 51, 1449–1489. [Google Scholar] [CrossRef] [PubMed]


| Ref. | Author | Year | Location | Surface | Speed | Distance/Duration | Type | Number (Sex) | Overall Age | Metric(s) |
|---|---|---|---|---|---|---|---|---|---|---|
| [15] | Aubol, et al. | 2020 | Indoor | Floor | 3.0 m/s | 30 m | Rec. | 19 (10 F, 9 M) | Mean: 31; SD: 6 | VT, Res. |
| [16] | Blackah, et al. | 2013 | Indoor | Treadmill | 3.83 m/s | 2 min | Rec. | 9 (0 F, 9 M) | Mean: 19; SD: 1 | VT, Shock-time, Shock-frequency |
| [17] | Boyer and Nigg | 2006 | Indoor | Floor | 3 m/s | 320 m | Non | 5 (0 F, 5 M) | Mean: 24.6; SD: 2.5 | VT, Shock-frequency |
| [18] | Chadefaux, et al. | 2019 | Indoor | Floor | 3.1 m/s | 175 m | Rec. | 10 (0 F, 10 M) | Mean: 21; SD: 3 | VT, AP, ML, Res., Freq. |
| [19] | Clansey, et al. | 2012 | Indoor | Floor | 4.5 m/s | 270 m | Rec. | 21 (0 F, 21 M) | Mean: 36.2; SD: 12.5 | VT, Loading Rate |
| [20] | Crowell and Davis | 2011 | Indoor | Floor | 3.7 m/s | 230 m | Rec. | 10 (6 F, 4 M) | Mean: 26; SD: 7 | VT, Loading Rate |
| [21] | Edwards, et al. | 2019 | Indoor | Floor | 3.3., 5.0, and 6.7 m/s | ≥450 m | Comp. | 10 (0 F, 10 M) | Mean: 21; SD: 2 | VT |
| [22] | Gil-Rey, et al. | 2021 | Indoor | Track | incremental from 1.69 m/s | ≥40 min | Non | 82 (82 F, 0 M) | Mean: 59.1; SD: 5.4 | VT, AP, ML |
| [23] | Hagen, et al. | 2009 | Indoor | Floor | 3.3 m/s | NR | Rec. | 20 (0 F, 20 M) | Mean: 32; SD: 10 | VT |
| [24] | Havens, et al. | 2018 | Indoor | Floor | self-selected | 90 m | Non | 14 (7 F, 7 M) | Mean: 29; SD: 12 | VT |
| [25] | Higgins, et al. | 2021 | Indoor | Floor | self-selected | 368 m | Non | 30 (15 F, 15 M) | Mean: 23.0; SD: 4.5 | VT, Res. |
| [26] | Lam, et al. | 2018 | Indoor | Floor | 3.0 and 6.0 m/s | 230 m | Comp. | 18 (0 F, 18 M) | Mean: 25.0; SD: 2.3 | VT |
| [27] | Laughton, et al. | 2003 | Indoor | Floor | 3.7 m/s | ≥57 m | Rec. | 15 (NS) | Mean: 22.46; SD: 4 | VT |
| [28] | Mavor, et al. | 2020 | Indoor | Floor | self-selected | 30 m | Non | 18 (9 F, 9 M) | Mean: 23.7; SD: 3.44 | Joint ROM |
| [29] | Meinert, et al. | 2016 | Indoor | Floor | 2.9 m/s | 30 m | Rec. | 20 (0 F, 20 M) | Mean: 22.7; SD: 2.9 | VT, Res., Shock-frequency, Spectral Energy |
| Indoor | Treadmill | 2.9 m/s | 10 s | |||||||
| [30] | Mercer, et al. | 2005 | Indoor | Floor | comfortable, faster, slower | 800 m | Non | 6 (NS) | Mean: 26; SD: 4.0 | VT, Shock-time |
| [31] | Milner, et al. | 2020 | Indoor | Floor | 3.0 m/s | ≥30 m | Rec. | 19 (10 F, 9 M) | Mean: 31; SD: 6 | VT, AP, ML, Res., Seg. Rot. |
| [32] | Milner, et al. | 2006 | Indoor | Floor | 3.7 m/s | 115 m | Rec. | 40 (40 F, 0 M) | Mean: 26; SD: 9 | VT |
| [33] | Nedergaard, et al. | 2018 | Indoor | Floor | 2, 3, 4, and 5 m/s | ≥64 m | Non | 20 (0 F, 20 M) | Mean: 22; SD: 4 | Res. |
| [34] | Ogon, et al. | 2001 | Indoor | Floor | slow | 144 m | Non | 12 (5 F, 7 M) | Mean: 32.9; SD: 7.9 | Loading Rate |
| [35] | Rowlands, et al. | 2012 | Indoor | Floor | self-selected | 320 m | Non | 10 (5 F, 5 M) | Mean: 29.4; SD: 7.3 | VT, Res., Loading Rate |
| [36] | Sayer, et al. | 2020 | Indoor | Floor | 2.8–3.2 m/s | NR | Non | 64 (64 F, 0 M) | Mean: 13.7; SD: 2.3 | VT, AP |
| [37] | Sinclair and Dillon | 2016 | Indoor | Floor | 4 m/s | 110 m | Rec. | 12 (0 F, 12 M) | Mean: 23.59; SD: 2 | VT, Loading Rate |
| [38] | Sinclair and Sant | 2017 | Indoor | Floor | 4 m/s | NR | Non | 13 (0 F, 13 M) | Mean: 27.81; SD: 7.02 | VT, Loading Rate |
| [39] | Sinclair, et al. | 2016 | Indoor | Floor | 4 m/s | NR | Rec. | 12 (0 F, 12 M) | Mean: 23.11; SD: 5.01 | VT, Loading Rate |
| [40] | Sinclair, et al. | 2015 | Indoor | Floor | 4 m/s | 110 m | Rec. | 12 (12 F, 0 M) | Mean: 21.45; SD: 2.98 | VT, Loading Rate |
| [41] | Sinclair, et al. | 2017 | Indoor | Grass | 4 m/s | NR | Comp. | 12 (0 F, 12 M) | Mean: 22.47; SD: 1.13 | VT |
| [42] | Thompson, et al. | 2016 | Indoor | Floor | self-selected | 450 m | Rec. | 10 (5 F, 5 M) | Mean: 26; SD: 7.3 | Res. |
| [43] | Trama, et al. | 2019 | Indoor | Track | 2.22, 2.92, 3.61, and 4.31 m/s | ≥60 m | Rec. | 20 (0 F, 20 M) | Mean: 23.9; SD: 2.1 | VT, Shock-frequency, Freq., Spectral Energy |
| [44] | Van den Berghe, et al. | 2019 | Indoor | Floor | 2.55, 3.20, and 5.10 m/s | 768 m | Rec. | 13 (NS) | NR | VT, Res. |
| [45] | Wundersitz, et al. | 2013 | Indoor | Floor | maximal | 50 m | Non | 17 (5 F, 12 M) | Mean: 21; SD: 2 | VT, Res. |
| Ref. | Author | Year | Location | Surface | Speed | Distance/Duration | Type | Number (Sex) | Overall Age | Metric(s) |
|---|---|---|---|---|---|---|---|---|---|---|
| [46] | Adams, et al. | 2016 | Indoor | Treadmill | comfortable | 2 min | Rec. | 20 (8 F, 12 M) | Mean: 30.0; SD: 7.0 | COM Disp. |
| [47] | Adams, et al. | 2018 | Indoor | Treadmill | comfortable | 90 s | Rec. | 20 (NS) | NR | COM Disp. |
| [48] | Argunsah Bayram, et al. | 2021 | Indoor | Treadmill | preferred | 15 min | Non | 24 (10 F, 14 M) | Mean: 22.2; SD: 0.9 | Joint ROM, COM Disp., Sym. or Reg. |
| [49] | Armitage, et al. | 2021 | Indoor | Floor | sprint | 21 m | Non | 16 (0 F, 16 M) | Mean: 17; SD: 1 | Res. |
| Indoor | Treadmill | 3.0 m/s | 1 min | |||||||
| [50] | Backes, et al. | 2020 | Indoor | Treadmill | 2.78 and 3.33 m/s | 2 min | Rec. | 39 (6 F, 33 M) | Mean: 41.8; SD: 9.8 | COM Disp. |
| [51] | Bailey and Harle | 2015 | Indoor | Treadmill | 2.3, 2.7, 3.0, and 3.4 m/s | 6 min | Rec. | 3 (1 F, 2 M) | NR | Res., Seg. Rot. |
| Outdoor | Grass | steady state | 100 m | |||||||
| Outdoor | Pavement | steady state | 100 m | |||||||
| Outdoor | Track | steady state | 100 m | |||||||
| Outdoor | Trail | steady state | 100 m | |||||||
| [52] | Barnes, et al. | 2021 | Outdoor | Grass | 2.1, 2.9, and 4.4 m/s | 140 m | Comp. | 29 (0 F, 29 M) | Mean: 25.2; SD: 3.5 | PlayerLoad |
| [53] | Bastiaansen, et al. | 2020 | NR | NR | maximal sprint | 90 m | Non | 5 (0 F, 5 M) | Mean: 22.5; SD: 2.1 | Joint ROM, Joint ω |
| [54] | Benson, et al. | 2018 | Indoor | Treadmill | preferred | 2 min | Rec. | 44 (18 F, 26 M) | Mean: 13.9; SD: 12.3 | VT, AP, ML, Res. |
| [55] | Bergamini, et al. | 2012 | Outdoor | Track | sprint | 180 m | Comp. | 5 (2 F, 3 M) | NR | Res., Joint ω |
| Rec. | 6 (2 F, 4 M) | |||||||||
| [56] | Boey, et al. | 2017 | NR | Pavement | 3.06 m/s | 90 m | Rec. | 23 (11 F, 12 M) | Mean: 23.3; SD: 3.0 | VT |
| NR | Track | 3.06 m/s | 90 m | Non | 12 (6 F, 6 M) | |||||
| NR | Trail | 3.06 m/s | 90 m | |||||||
| [57] | Boyer and Nigg | 2007 | Indoor | Track | 4.8 m/s | NR | Non | 13 (NS) | NR | VT, Freq. |
| [58] | Boyer and Nigg | 2004 | Indoor | Floor | 2.0, 3.0, 4.0, and 5.5 m/s | 960 m | Non | 10 (0 F, 10 M) | Mean: 25; SE: 4.2 | VT, Freq. |
| [59] | Brayne, et al. | 2018 | Indoor | Treadmill | 2.5, 3.5, and 4.5 m/s | 120 s | Rec. | 13 (0 F, 13 M) | Mean: 30; SD: 7 | VT |
| [60] | Buchheit, et al. | 2015 | Indoor | Treadmill | 2.78, 4.72, and 6.67 m/s | 450 s | Non | 1 (0 F, 1 M) | Exact: 36; NA | Stiffness |
| [61] | Butler, et al. | 2003 | Indoor | Floor | 3.4 m/s | 375 m | Rec. | 15 (NS) | NR; Range: 18–45 | VT |
| [62] | Camelio, et al. | 2020 | Indoor | Treadmill | preferred | 36 min | Rec. | 17 (9 F, 8 M) | Mean: 27; SD: 7 | VT |
| [63] | Carrier, et al. | 2020 | Indoor | Treadmill | self-selected | 6 min | Rec. | 17 (8 F, 9 M) | Mean: 28.1; SD: 7.38 | COM Disp. |
| [64] | Castillo and Lieberman | 2018 | Indoor | Treadmill | 3.0 m/s | 2 min | Non | 27 (13 F, 14 M) | NR; Range: 18–45 | Shock-frequency, Spectral Energy, Joint ROM, Joint ω |
| [65] | Chen, et al. | 2021 | Indoor | Treadmill | 2.5 m/s | 3 min | Non | 24 (0 F, 24 M) | NR | Spectral Energy |
| [66] | Cheung, et al. | 2018 | Indoor | Treadmill | typical | 12 min | Rec. | 16 (5 F, 11 M) | Mean: 28.3; SD: 6.2 | VT, Loading Rate |
| [67] | Cheung, et al. | 2019 | Indoor | Treadmill | 2.78 m/s | 10 min | Rec. | 14 (7 F, 7 M) | Mean: 26.4; SD: 11.2 | VT, Loading Rate |
| [68] | Ching, et al. | 2018 | Indoor | Treadmill | self-selected | 20 min | Rec. | 16 (9 F, 7 M) | Mean: 25.1; SD: 7.9 | VT, Loading Rate |
| [69] | Chu and Caldwell | 2004 | Indoor | Treadmill | 4.17 m/s | ≥75 s | Rec. | 10 (0 F, 10 M) | Mean: 26; SD: 6 | VT, Shock-frequency, Spectral Energy |
| [70] | Clark, et al. | 2010 | Indoor | Treadmill | 2.78 m/s | 12 min | Non | 36 (36 F, 0 M) | Mean: 30.3; SD: 5.8 | VT, AP, ML |
| [71] | Creaby and Frattenovich Smith | 2016 | Indoor | Treadmill | 3 m/s | 50 min | Rec. | 22 (0 F, 22 M) | Mean: 25.4; SD: 6.2 | VT |
| [72] | Crowell, et al. | 2010 | Indoor | Treadmill | self-selected | 25 min | Rec. | 5 (5 F, 0 M) | Mean: 26; SD: 2 | VT, Loading Rate |
| [73] | Day, et al. | 2021 | Indoor | Treadmill | 3.8, 4.1, 4.9, and 5.4 m/s | NR | Comp. | 30 (21 F, 9 M) | NR | VT, Spectral Energy |
| [74] | De la Fuente, et al. | 2019 | Indoor | Treadmill | typical | 10 min | Rec. | 20 (0 F, 20 M) | Mean: 30.5; SD: 9.3 | VT, Res., Freq. |
| [75] | Deflandre, et al. | 2018 | Indoor | Treadmill | 2.22 and 4.44 m/s | 6 min | Rec. | 20 (0 F, 20 M) | Mean: 26; SD: 9.5 | Stiffness, Joint ROM, COM Disp., Sym. or Reg. |
| Outdoor | Grass | 2.22, 2.78, and 3.33 m/s | 720 m | Non | 10 (0 F, 10 M) | |||||
| [76] | DeJong and Hertel | 2020 | Indoor | Treadmill | 2.68 and 3.6 m/s | 180 s | Comp. | 20 (12 F, 8 M) | Mean: 20; SD: 2 | Joint ROM |
| [77] | Derrick, et al. | 2002 | Indoor | Treadmill | 3.2 km pace | run to exhaustion | Rec. | 10 (NS) | Mean: 25.8; SD: 7.0 | VT, Shock-time, Shock-frequency, Spectral Energy, Joint ω, Seg. Rot. |
| [78] | Dufek, et al. | 2009 | Indoor | Treadmill | preferred, 10% slower | 102 s | Rec. | 14 (7 F, 7 M) | Mean: 24.9; SD: 4 | VT, Shock-time |
| [79] | Eggers, et al. | 2018 | Indoor | Track | 3.33 m/s | 400 m | Non | 17 (7 F, 10 M) | NR; Range: 18–40 | VT, Stiffness, COM Disp. |
| [80] | Encarnación-Martínez, et al. | 2020 | Indoor | Treadmill | 3.89 m/s | 4 min | Rec. | 17 (0 F, 17 M) | Mean: 28.7; SD: 8.3 | VT, Shock-frequency, Spectral Energy |
| [81] | Encarnación-Martínez, et al. | 2018 | Outdoor | Grass | 3.33 and 4.00 m/s | 480 m | Non | 12 (0 F, 12 M) | Mean: 24.3; SD: 3.7 | VT, Shock-time |
| [82] | Encarnación-Martínez, et al. | 2021 | Indoor | Treadmill | 2.78 m/s | 10 min | Non | 30 (10 F, 20 M) | Mean: 26.3; SD: 7.0 | VT |
| [83] | Friesenbichler, et al. | 2011 | Outdoor | NR | 10 km pace | run to exhaustion | Rec. | 10 (7 F, 3 M) | Mean: 31.7; SD: 7.3 | VT, AP, ML, Freq., Spectral Energy |
| [84] | Fu, et al. | 2015 | Indoor | Treadmill | 3.33 m/s | 6 min | Rec. | 13 (0 F, 13 M) | Mean: 23.7; SD: 1.2 | VT |
| Outdoor | Grass | 3.33 m/s | 90 m | |||||||
| Outdoor | Pavement | 3.33 m/s | 90 m | |||||||
| Outdoor | Track | 3.33 m/s | 90 m | |||||||
| [85] | Gantz and Derrick | 2018 | Indoor | Treadmill | self-selected | ≥6 min | Rec. | 16 (7 F, 9 M) | Mean: 22.9; SD: 3.3 | VT, Shock-frequency, Spectral Energy |
| [86] | Garcia, et al. | 2021 | Outdoor | Pavement | self-selected | 200 m | Rec. | 15 (12 F, 3 M) | Mean: 27.7; SD: 9.1 | VT, AP, ML, Res., Shock-time |
| Outdoor | Trail | self-selected | 400 m | |||||||
| [87] | García-Pérez, et al. | 2014 | Indoor | Treadmill | 4 m/s | 800 m | Rec. | 20 (9 F, 11 M) | Mean: 34; SD: 8 | VT, Loading Rate, Shock-time |
| Outdoor | Track | 4 m/s | 800 m | |||||||
| [88] | Giandolini, et al. | 2014 | Indoor | Treadmill | 3.89 and 4.44 m/s | 8 min | Rec. | 48 (18 F, 30 M) | Mean: 38.4; SD: 6.7 | VT |
| Outdoor | Trail | 2.78 and 3.33 m/s | 6 min | |||||||
| [89] | Giandolini, et al. | 2013 | Indoor | Treadmill | self-selected | 60 min | Non | 30 (8 F, 22 M) | Mean: 18.3; SD: 4.5 | VT |
| [90] | Glassbrook, et al. | 2020 | Indoor | Treadmill | 60%–100% of maximal | 435 s | Non | 16 (6 F, 10 M) | Mean: 24.5; SD: 4.5 | Res. |
| [91] | Gullstrand, et al. | 2009 | Indoor | Treadmill | 2.78, 3.33, 3.89, 4.44, 5.00, 5.56, and 6.11 m/s | ≥210 s | Rec. | 13 (0 F, 13 M) | Mean: 22.7; NR | COM Disp. |
| [92] | Hardin and Hamill | 2002 | Indoor | Treadmill | 3.4 m/s | 30 min | Rec. | 24 (0 F, 24 M) | NR | VT |
| [93] | Iosa, et al. | 2014 | Indoor | Floor | self-selected | 10 m | Non | 25 (NS) | Mean: 15.3; SD: 3.9 | VT, AP, ML, Stability |
| [94] | Iosa, et al. | 2013 | Indoor | Floor | self-selected | 10 m | Non | 40 (16 F, 24 M) | Mean: 5.5; SD: 2.5 | VT, AP, ML, Res., Freq. |
| [95] | Johnson, et al. | 2020 | Indoor | Treadmill | 90% marathon pace | 30 s | Rec. | 192 (87 F, 105 M) | Mean: 44.9; SD: 10.8 | VT, Res. |
| Outdoor | Pavement | not controlled | 42.2 km | |||||||
| [96] | Johnson, et al. | 2021 | Indoor | Treadmill | self-selected | 16 s | Rec. | 18 (8 F, 10 M) | Mean: 33; SD: 11 | AP, ML |
| [97] | Johnson, et al. | 2020 | Indoor | Treadmill | self-selected | 32 s | Rec. | 18 (8 F, 10 M) | Mean: 33; SD: 11 | VT, Res., Loading Rate |
| [98] | Kawabata, et al. | 2013 | Indoor | Treadmill | slow, preferred, fast | 18 min | Non | 13 (0 F, 13 M) | Mean: 23.3; SD: 0.6 | VT, AP, ML |
| Outdoor | Track | slow, preferred, fast | 4800 m | |||||||
| [99] | Kenneally-Dabrowski, et al. | 2018 | Indoor | Track | maximal sprint | 120 m | Comp. | 13 (0 F, 13 M) | Mean: 23.8; SD: 2.4 | VT |
| [100] | Khassetarash, et al. | 2015 | Indoor | Treadmill | 4 m/s | run to exhaustion (10 km max) | Comp. | 8 (0 F, 8 M) | Mean: 26; SD: 3.6 | Shock-frequency |
| [101] | Kobsar, et al. | 2014 | Indoor | Treadmill | self-selected | 135 s | Rec. | 42 (42 F, 0 M) | Mean: 33; SD: 6 | VT, AP, ML, Res., Freq., Axis Ratio, Sym. or Reg. |
| [102] | Koldenhoven and Hertel | 2018 | Indoor | Treadmill | comfortable | 1.5 miles | Rec. | 12 (6 F, 6 M) | Mean: 23.1; SD: 5.5 | Seg. Rot., Seg. Rot. Velocity |
| [103] | Le Bris, et al. | 2006 | NR | Track | maximal aerobic | run to exhaustion | Comp. | 6 (0 F, 6 M) | Mean: 21.6; SD: 4 | Res., Freq., Spectral Energy, Sym. or Reg. |
| [104] | Leduc, et al. | 2020 | Outdoor | NR | 5.00 m/s | 240 m | Comp. | 17 (0 F, 17 M) | Mean: 21.0; SD: 1.3 | VT, AP, ML, Res., PlayerLoad |
| [105] | Lee, et al. | 2010 | Indoor | Treadmill | self-selected, 0.28 m/s above and below | 15 min | Comp. | 10 (4 F, 6 M) | Mean: 30; SD: 8 | VT |
| [106] | Lee, et al. | 2015 | Indoor | Treadmill | 2.0 and 3.5 m/s | 30 s | Non | 15 (0 F, 15 M) | Mean: 26.9; SD: 3.1 | VT, AP, ML, Res., Seg. Rot. Velocity |
| [107] | Lin, et al. | 2014 | Indoor | Treadmill | 1.67, 2.22, 2.50, and 3.33 m/s | 4 min | Comp. | 10 (0 F, 10 M) | Mean: 50.30; SD: 9.40 | VT, AP, ML |
| Outdoor | Not Controlled | not controlled | 12 hours | |||||||
| [108] | Lindsay, et al. | 2016 | Indoor | Treadmill | 2.22, 2.78, and 3.33 m/s | 8.5 min | Non | 15 (4 F, 11 M) | Mean: 23.7; SD: 4.7 | VT, AP, ML, Res. |
| [109] | Lindsay, et al. | 2014 | Indoor | Treadmill | 2.22, 2.78, and 3.33 m/s | 180 s | Non | 18 (0 F, 18 M) | Mean: 24.0; SD: 4.2 | VT, AP, ML, Res. |
| [110] | Lucas-Cuevas, et al. | 2017 | Indoor | Treadmill | 2.22, 2.78, and 3.33 m/s | 6 min | Rec. | 30 (0 F, 30 M) | Mean: 27.3; SD: 6.4 | VT, Shock-time, Shock-frequency, Freq., Spectral Energy |
| [111] | Lucas-Cuevas, et al. | 2016 | Indoor | Treadmill | 60% maximal aerobic | 3 min | Rec. | 22 (NS) | Mean: 28.4; SD: 5.8 | VT, Loading Rate, Shock-time |
| [112] | Lucas-Cuevas, et al. | 2017 | Indoor | Treadmill | 3.33 m/s | 16 min | Rec. | 38 (18 F, 20 M) | Mean: 29.8; SD: 5.3 | VT, Loading Rate, Shock-time |
| [113] | Macadam, et al. | 2019 | Indoor | Track | maximal sprint | 160 m | Comp. | 1 (0 F, 1 M) | Exact: 32; NA | Seg. Rot., Seg. Rot. Velocity |
| [114] | Macadam, et al. | 2020 | NR | NR | sprint | 200 m | Comp. | 15 (0 F, 15 M) | Mean: 21.0; SD: 2.5 | Seg. Rot., Seg. Rot. Velocity |
| [115] | Macadam, et al. | 2020 | Indoor | Treadmill | maximal sprint | 80 s | Non | 14 (NS) | Mean: 24.9; SD: 4.2 | Seg. Rot., Seg. Rot. Velocity |
| [116] | Macdermid, et al. | 2017 | Indoor | Treadmill | 2.61 m/s | 9 min | Rec. | 8 (NS) | Mean: 25; SD: 12 | Res., Loading Rate |
| [117] | Mangubat, et al. | 2018 | Indoor | Treadmill | preferred | 90 s | Rec. | 13 (5 F, 8 M) | Mean: 27.1; SD: 5.1 | VT |
| [118] | Masci, et al. | 2013 | Indoor | Floor | maximal | 15 m | Non | 54 (NS) | Mean: 5; SD: 3 | VT, AP, ML, Res., Stiffness |
| [119] | McGregor, et al. | 2009 | Indoor | Treadmill | incremental from 0.56 m/s | run to exhaustion | Comp. | 7 (0 F, 7 M) | Mean: 21.4; SD: 1.7; Range: 19–24 | VT, AP, ML, Res., Entropy |
| [120] | Mercer and Chona | 2015 | Indoor | Treadmill | 100%, 110%, 120%, and 130% of preferred | 16 min | Non | 10 (6 F, 4 M) | Mean: 21.4; SD: 2.0 | VT |
| [121] | Mercer, et al. | 2002 | Indoor | Treadmill | 50%, 60%, 70%, 80%, 90%, and 100% of maximal | 120 s | Non | 8 (0 F, 8 M) | Mean: 25; SD: 4.6 | VT, Shock-frequency |
| [122] | Mercer, et al. | 2003 | Indoor | Treadmill | 3.8 m/s | 140 s | Rec. | 10 (0 F, 10 M) | Mean: 24; SD: 5.8 | Shock-frequency, Spectral Energy |
| [123] | Mercer, et al. | 2010 | Indoor | Floor | preferred | 200 m | Non | 18 (7 F, 11 M) | Mean: 10.3; SD: 1 | VT, Shock-time |
| Indoor | Treadmill | preferred, 0.5 m/s faster and slower | 6 min | |||||||
| [124] | Mercer, et al. | 2003 | Indoor | Treadmill | 3.1 and 3.8 m/s | 40 s | Non | 10 (0 F, 10 M) | Mean: 24; SD: 6 | VT, Shock-frequency, Spectral Energy |
| [125] | Meyer, et al. | 2015 | Indoor | Floor | 1.67 and 2.78 m/s | 140 m | Non | 13 (3 F, 10 M) | Mean: 10.1; SD: 3.0; Range: 5–16 | VT |
| [126] | Meyer, et al. | 2018 | Indoor | Track | 3.5 m/s | 900 m | Non | 36 (18 F, 18 M) | Mean: 25.4; SD: 3.5 | VT, AP, ML, Variability-any axis |
| Indoor | Treadmill | 3.0 m/s | 1 min | |||||||
| Outdoor | Grass | 3.0 m/s | 1 min | |||||||
| Outdoor | Pavement | 3.0 m/s | 1 min | |||||||
| [127] | Mitschke, et al. | 2017 | Indoor | Track | 2.5 and 3.5 m/s | 450 m | Rec. | 24 (NS) | Mean: 24.7; SD: 4.1 | Seg. Rot. Velocity |
| [128] | Mitschke, et al. | 2017 | Indoor | Track | 3.5 m/s | 450 m | Rec. | 21 (0 F, 21 M) | Mean: 28.9; SD: 10.8 | VT, Seg. Rot., Seg. Rot. Velocity |
| [129] | Mitschke, et al. | 2018 | Indoor | Track | self-selected | 225 m | Rec. | 21 (0 F, 21 M) | Mean: 24.4; SD: 4.2 | VT, Seg. Rot. |
| [130] | Montgomery, et al. | 2016 | Indoor | Floor | natural jog, natural run | 40 m | Non | 15 (NS) | Mean: 24.2; SD: 3.8 | VT, Loading Rate |
| Indoor | Treadmill | natural jog, natural run | 1 min | |||||||
| [131] | Moran, et al. | 2017 | Indoor | Treadmill | 75% of maximum HR | 37 min | Rec. | 15 (6 F, 9 M) | Mean: 20.4; SD: 2.4 | VT |
| [132] | Morrow, et al. | 2014 | Indoor | Floor | slow, normal, fast | ≥504 m | Non | 11 (8 F, 3 M) | Mean: 33.4; SD: 10.5 | VT, AP, ML |
| [133] | Neugebauer, et al. | 2012 | Indoor | Floor | consistent | 540 m | Non | 35 (20 F, 15 M) | Mean: 11.6; SD: 0.7 | Res. |
| [134] | Nüesch, et al. | 2017 | Indoor | Treadmill | self-selected | 6 min | Rec. | 20 (12 F, 8 M) | Mean: 27.4; SD: 8.3 | Joint ROM |
| [135] | O’Connor and Hamill | 2002 | Indoor | Treadmill | 3.8 m/s | 4 min | Non | 12 (0 F, 12 M) | Mean: 27.6; SD: 5.3 | VT |
| [136] | Provot, et al. | 2017 | Indoor | Treadmill | 2.22, 2.78, 3.33, 3.89, 4.44, and 5.00 m/s | 7 min | Non | 1 (0 F, 1 M) | Exact: 33; NA | Res., Spectral Energy |
| [137] | Provot, et al. | 2019 | Indoor | Treadmill | 2.22, 2.50, 2.78, 3.06, 3.33, 3.61, 3.89, 4.44, and 5.00 m/s | 9 min | Rec. | 18 (8 F, 10 M) | Mean: 31.4; SD: 8.9 | Res., Freq., Spectral Energy, Stiffness |
| [138] | Rabuffetti, et al. | 2019 | Indoor | Treadmill | 1.8 and 2.2 m/s | 140 s | Non | 25 (11 F, 14 M) | Mean: 26.5; SD: 4.5; Range: 20–40 | Sym. or Reg. |
| [139] | Raper, et al. | 2018 | Indoor | Track | slow, medium, fast | 50 m | Comp. | 10 (6 F, 4 M) | Mean: 26.90; SD: 4.03 | VT |
| [140] | Reenalda, et al. | 2019 | Outdoor | Track | 10 km pace | 20 min | Rec. | 10 (0 F, 10 M) | Mean: 31; SD: 5 | VT, Shock-time, Joint ROM |
| [141] | Schütte, et al. | 2015 | Indoor | Treadmill | 3.2 km pace | run to exhaustion | Rec. | 20 (8 F, 12 M) | Mean: 21.05; SD: 2.14 | VT, AP, ML, Axis Ratio, Sym. or Reg., Entropy |
| [142] | Schütte, et al. | 2016 | Outdoor | Pavement | self-selected | 180 m | Rec. | 28 (14 F, 14 M) | Mean: 22.62; SD: 3.07 | VT, AP, Freq., Axis Ratio, Sym. or Reg., Entropy |
| Outdoor | Track | self-selected | 180 m | |||||||
| Outdoor | Trail | self-selected | 180 m | |||||||
| [143] | Schütte, et al. | 2018 | Indoor | Treadmill | incremental from 2.22 or 2.50 m/s | run to exhaustion | Rec. | 30 (14 F, 16 M) | Mean: 21.75; SD: 1.40 | VT, AP, ML, Axis Ratio, Sym. or Reg., Entropy |
| [144] | Setuain, et al. | 2017 | Indoor | Floor | maximal sprint | 60 m | Comp. | 1 (0 F, 1 M) | Exact: 19; NA | VT, AP, Res., COM Disp., COM Δv |
| [145] | Setuain, et al. | 2018 | Indoor | Floor | maximal sprint | 80 m | Rec. | 16 (8 F, 8 M) | Mean: 28.8; SD: 5.35 | AP, Res., COM Δv, Power |
| [146] | Sheerin, et al. | 2018 | Indoor | Treadmill | 2.7, 3.0, 3.3, and 3.7 m/s | 8 min | Rec. | 14 (0 F, 14 M) | Mean: 33.6; SD: 11.6 | Res. |
| [147] | Sheerin, et al. | 2018 | Indoor | Treadmill | 2.7, 3.0, 3.3, and 3.7 m/s | 8 min | Rec. | 85 (20 F, 65 M) | Mean: 39.51; SD: 8.92 | Res. |
| [148] | Shiang, et al. | 2016 | Indoor | Treadmill | 1.94, 2.78, and 3.61 m/s | 6 min | Non | 6 (0 F, 6 M) | Mean: 25.4; SD: 1.7 | Seg. Rot. |
| [149] | Simoni, et al. | 2020 | Indoor | Treadmill | self-selected | 1 min | Rec. | 87 (28 F, 59 M) | Mean: 41; SD: 10 | VT, AP, ML |
| [150] | Stickford, et al. | 2015 | Indoor | Treadmill | 3.88, 4.47, and 5.00 m/s | 12 min | Comp. | 16 (0 F, 16 M) | Mean: 22.4; SD: 3 | Stiffness, COM Disp. |
| [151] | TenBroek, et al. | 2014 | Indoor | Treadmill | 3 m/s | 90 min | Rec. | 10 (0 F, 10 M) | NR; Range: 18–55 | VT, Shock-frequency |
| [152] | Tenforde, et al. | 2020 | Indoor | Treadmill | self-selected | 3 min | Rec. | 169 (74 F, 95 M) | Mean: 38.7; SD: 13.1 | VT, Res. |
| [153] | Thomas and Derrick | 2003 | Indoor | Treadmill | preferred | 10 min | Comp. | 12 (6 F, 6 M) | Mean: 20.9; SD: 2.3 | VT, Shock-time, Spectral Energy, Joint ROM, Joint ω |
| [154] | Tirosh, et al. | 2019 | Indoor | Treadmill | 20% above walking | 27 min | Non | 37 (NS) | Mean: 9.2; SD: 1.3 | VT |
| [155] | Tirosh, et al. | 2017 | Indoor | Treadmill | 20% above walking | 2 min | Non | 24 (NS) | Mean: 8.5; SD: 0.9 | VT |
| [156] | Tirosh, et al. | 2020 | Indoor | Treadmill | 20% above walking | 2 min | Non | 32 (15 F, 17 M) | Mean: 9.26; SD: 1.18 | VT, Shock-time |
| [157] | van Werkhoven, et al. | 2019 | Indoor | Treadmill | comfortable | 3 min | Non | 12 (NS) | NR; Range: 18–45 | Joint ROM, Joint ω, Seg. Rot. |
| [158] | Walsh | 2021 | Indoor | Treadmill | 100% and 120% of preferred | 12 min | Non | 18 (9 F, 9 M) | Mean: 29; SD: 6.5 | Stability, Entropy |
| [159] | Waite, et al. | 2021 | Outdoor | Grass | 80% of 1 mile pace | 180 m | Rec. | 13 (5 F, 8 M) | Mean: 20.07; SD: 0.95 | VT |
| Outdoor | Pavement | 80% of 1 mile pace | 360 m | |||||||
| [160] | Winter, et al. | 2016 | Indoor | Floor | self-selected | 8.2 km | Rec. | 10 (4 F, 6 M) | Mean: 27.5; SD: 9.5 | VT, AP, ML |
| [161] | Wixted, et al. | 2010 | Outdoor | Track | race effort | 1500 m | Comp. | 2 (NS) | NR | VT, AP, ML |
| [162] | Wood and Kipp | 2014 | Indoor | Treadmill | comfortable fast jog | 25 min | Rec. | 9 (6 F, 3 M) | Mean: 20; SD: 1.5 | VT, AP, Res. |
| [163] | Wundersitz, et al. | 2015 | Indoor | Treadmill | 3.3, 5.0, and 5.9 m/s | 90 s | Non | 39 (11 F, 28 M) | Mean: 24.2; SD: 2.5 | Res. |
| [164] | Zhang, et al. | 2019 | Indoor | Treadmill | 90%, 100%, and 110% of preferred | 9 min | Rec. | 13 (3 F, 10 M) | Mean: 41.1; SD: 6.9 | VT |
| [165] | Zhang, et al. | 2016 | Indoor | Treadmill | preferred, 15% faster and slower | 18 min | Non | 10 (2 F, 8 M) | Mean: 23.6; SD: 3.8 | VT |
| Ref. | Author | Year | Location | Surface | Speed | Distance/Duration | Type | Number (Sex) | Overall Age | Metric(s) |
|---|---|---|---|---|---|---|---|---|---|---|
| [166] | Aubry, et al. | 2018 | Indoor | Treadmill | 3.06–5.00 m/s | 6 min | Comp. | 11 (0 F, 11 M) | Mean: 33.4; SD: 6.6 | COM Disp., Power |
| Outdoor | Track | 3.06–5.00 m/s | 12 min | Rec. | 13 (0 F, 13 M) | |||||
| [167] | Austin, et al. | 2018 | Indoor | Treadmill | 85–89% VO2max | 8 min | Comp. | 17 (8 F, 9 M) | Mean: 20.6; SD: 2.3 | Power |
| [168] | Barrett, et al. | 2014 | Indoor | Treadmill | incremental from 1.94 m/s | 2 runs to exhaustion | Comp. | 44 (NS) | Mean: 22; SD: 3 | PlayerLoad |
| [5] | Benson, et al. | 2020 | Indoor | Treadmill | preferred | 5 min | Rec. | 69 (31 F, 38 M) | Mean: 33.7; SD: 11.5 | VT, AP, ML, Res., Sym. or Reg. |
| Outdoor | Pavement | preferred | 600 m | |||||||
| [169] | De Brabandere, et al. | 2018 | Indoor | Treadmill | incremental from 2.5 m/s to 4.58 m/s | run to exhaustion | Rec. | 28 (16 F, 12 M) | Mean: 21.8; SD: 1.3 | VT, AP, ML |
| [170] | Cher, et al. | 2017 | Indoor | Treadmill | slow, medium, fast | 60 min | Non | 12 (4 F, 8 M) | Mean: 29.4; SD: 6.8 | VT, AP, ML, Res. |
| [171] | Clansey, et al. | 2016 | Indoor | Treadmill | 95% of onset of blood lactate accumulation | 40 min | Rec. | 13 (0 F, 13 M) | Mean: 35.1; SD: 10.2 | VT, Shock-frequency |
| [172] | Clermont, et al. | 2019 | Indoor | Treadmill | preferred | 5 min | Rec. | 41 (16 F, 25 M) | Mean: 32.5; SD: 12.7 | VT, AP, ML, Res., Sym. or Reg. |
| [173] | Clermont, et al. | 2020 | Indoor | Track | self-selected | 21 min | Rec. | 17 (10 F, 7 M) | Mean: 39.8; SD: 9.6 | VT, AP, ML, Res., Sym. or Reg. |
| Outdoor | Track | not controlled | 6 km | |||||||
| [174] | Deriaz, et al. | 2010 | Indoor | Treadmill | comfortable | 15 min | Rec. | 65 (0 F, 65 M) | Mean: 36.0; SD: 6.8 | VT |
| Non | 16 (0 F, 16 M) | |||||||||
| [175] | Enders, et al. | 2014 | Indoor | Treadmill | 3.5 m/s | 20 min | Rec. | 12 (0 F, 12 M) | Mean: 25.56; SD: 2.88 | VT, Shock-frequency, Freq., Spectral Energy |
| [176] | Garcia-Byrne, et al. | 2020 | Indoor | Floor | 2.22 m/s | 400 m | Comp. | 36 (0 F, 36 M) | Mean: 25; SD: 3 | PlayerLoad |
| [177] | Giandolini, et al. | 2016 | Outdoor | Pavement | self-selected | 6.5 km | Rec. | 23 (0 F, 23 M) | Mean: 39; SD: 11 | VT, ML, Res., Shock-time, Shock-frequency |
| Outdoor | Trail | self-selected | 6.5 km | |||||||
| [178] | Giandolini, et al. | 2017 | Outdoor | Pavement | self-selected | 6.5 km | Rec. | 23 (0 F, 23 M) | Mean: 39; SD: 11 | VT |
| Outdoor | Trail | self-selected | 6.5 km | |||||||
| [179] | Horvais, et al. | 2019 | Indoor | Treadmill | 3.9 m/s | 14 min | Rec. | 10 (0 F, 10 M) | Mean: 27.3; SD: 5.4 | VT, AP, Res., Spectral Energy |
| [180] | Hughes, et al. | 2019 | Indoor | Treadmill | 3.89 and 5.00 m/s | 9 min | Comp. | 16 (NS) | Mean: 17.36; SD: 1.25 | VT |
| [181] | Koska, et al. | 2018 | Indoor | Treadmill | 2.78, 3.33, and 4.17 m/s | 9 min | Rec. | 51 (15 F, 36 M) | Mean: 33.9; SD: 8.2 | Seg. Rot., Seg. Rot. Velocity |
| [182] | Melo, et al. | 2020 | Indoor | Treadmill | 10 km pace | 20 km | Rec. | 13 (5 F, 8 M) | Mean: 36; SD: 4 | COM Disp. |
| [183] | Moltó, et al. | 2020 | Indoor | Treadmill | typical | 3 min | Rec. | 38 (16 F, 22 M) | Mean: 26.7; SD: 7.7 | Seg. Rot. |
| [184] | Morio, et al. | 2016 | Indoor | Treadmill | 3.06 m/s | 12 min | Rec. | 8 (0 F, 8 M) | Mean: 26; SD: 2 | VT, AP, ML |
| [185] | Murray, et al. | 2017 | Indoor | Treadmill | incremental to reach [La]b concentration of 4 mmol/L | run to exhaustion | Comp. | 6 (0 F, 6 M) | Mean: 15.6; SD: 1.2 | VT, AP, ML, Entropy |
| [186] | Navalta, et al. | 2019 | Outdoor | Trail | self-selected | 10 min | Non | 20 (8 F, 12 M) | Mean: 22.2; SD: 5.8 | Stiffness, COM Disp., Power |
| [187] | Olin and Gutierrez | 2013 | Indoor | Treadmill | comfortable | 21 min | Rec. | 18 (12 F, 6 M) | Mean: 31.2; SD: 7.9 | VT |
| [188] | Perrotin, et al. | 2021 | Outdoor | Pavement | not controlled | 1 km | Rec. | 30 (3 F, 27 M) | Mean: 36.4; SD: 8 | Stiffness, COM Disp., Power |
| [189] | Provot, et al. | 2016 | Indoor | Treadmill | 3.33 m/s | 40 min | Rec. | 1 (0 F, 1 M) | Exact: 22; NA | Res., Freq., Spectral Energy, Stiffness |
| [190] | Reenalda, et al. | 2016 | Outdoor | Pavement | not controlled | 42.2 km | Rec. | 3 (0 F, 3 M) | Mean: 38.7; SD: 8.2; Range: 31–50 | VT, Joint ROM, COM Disp. |
| [191] | Seeley, et al. | 2020 | Indoor | Treadmill | 2.68, 3.13, and 3.58 m/s | 12 min | Non | 31 (14 F, 17 M) | Mean: 23; SD: 3 | VT, AP, ML, Res. |
| [192] | Shih, et al. | 2014 | Indoor | Treadmill | 70% of maximal | 30 min | Rec. | 15 (NS) | Mean: 24.5; SD: 1.7 | Joint ROM, Joint ω |
| [193] | Tirosh, et al. | 2019 | Indoor | Floor | 20% above walking | 1 km | Non | 10 (NS) | Mean: 10.7; SD: 1.27 | VT |
| Outdoor | Grass | 3.33, 3.89, 4.44, and 5.00 m/s | 12 min | |||||||
| Outdoor | Pavement | 3.33, 3.89, 4.44, and 5.00 m/s | 12 min | |||||||
| Outdoor | Track | 3.33, 3.89, 4.44, and 5.00 m/s | 12 min | |||||||
| Outdoor | Track | 4.78 m/s | 6 km | |||||||
| [194] | Ueberschar, et al. | 2019 | Indoor | Treadmill | incremental from 1.67 m/s | run to exhaustion | Rec. | 15 (0 F, 15 M) | Mean: 30; SD: 7 | VT, Res. |
| [195] | Van den Berghe, et al. | 2021 | Indoor | Track | 3.2 m/s | 20 min | Rec. | 10 (NS) | Mean: 33; SD: 9; Range: 24–49 | VT |
| [196] | van der Bie and Krose | 2015 | Indoor | Treadmill | ventilatory threshold | run to exhaustion | Non | 18 (14 F, 4 M) | Mean: 23; SD: 3 | VT, AP, ML, Variability-any axis, Entropy |
| [9] | Watari, et al. | 2016 | Indoor | Treadmill | 2.7, 3.0, 3.3, 3.6, and 3.9 m/s | 5 min | Rec. | 22 (8 F, 14 M) | Mean: 28.2; SD: 10.1 | COM Disp. |
| [197] | Weich, et al. | 2019 | Indoor | Track | 95% anaerobic threshold | 5000 m | Rec. | 25 (NS) | Mean: 26.64; SD: 6.86 | VT, AP, ML |
| Non | 9 (NS) |
| Ref. | Author | Year | Location | Surface | Speed | Distance/Duration | Type | Number (Sex) | Overall Age | Metric(s) |
|---|---|---|---|---|---|---|---|---|---|---|
| [198] | Bigelow, et al. | 2013 | Indoor | Track | self-selected | 4 miles | Rec. | 12 (NS) | Mean: 32.8; SD: 9.8 | VT, ML |
| Indoor | Treadmill | self-selected | 4 miles | |||||||
| [199] | Brahms, et al. | 2020 | Indoor | Track | 5 km pace | run to exhaustion | Comp. | 16 (NS) | Mean: 24; SD: 3.9 | Res. |
| Rec. | 16 (NS) | |||||||||
| Indoor | Treadmill | incremental from 2.5 m/s | run to exhaustion | |||||||
| Outdoor | Track | 2.78 m/s | 9 min | |||||||
| Outdoor | Track | incremental from 2.5 m/s | run to exhaustion | |||||||
| [200] | Clermont, et al. | 2019 | Outdoor | Not Controlled | not controlled | 42.2 km | Rec. | 27 (15 F, 12 M) | Mean: 45.1; SD: 11.5 | Joint ROM, Seg. Rot., COM Disp., COM Δv |
| [201] | DeJong and Hertel | 2020 | Outdoor | Pavement | not controlled | 6–21.1 km | Comp. | 5 (4 F, 1 M) | Mean: 30.2; SD: 3.3 | VT, AP, Joint ω |
| Outdoor | Trail | not controlled | 5 km | |||||||
| [202] | Giandolini, et al. | 2015 | Outdoor | Trail | not controlled | 45 km | Comp. | 1 (0 F, 1 M) | Exact: 26; NA | VT, AP, Res., Freq. |
| [203] | Gómez-Carmona, et al. | 2020 | Indoor | Treadmill | incremental from 2.22 m/s | run to exhaustion | Rec. | 20 (0 F, 20 M) | Mean: 27.32; SD: 6.65 | PlayerLoad |
| Outdoor | Track | incremental from 2.22 m/s | run to exhaustion | |||||||
| [204] | Hoenig, et al. | 2019 | NR | Track | maximal | 5000 m | Rec. | 30 (0 F, 30 M) | Mean: 27; SD: 6.0 | Stability |
| [205] | Provot, et al. | 2019 | Indoor | Treadmill | 3.75 m/s | run to exhaustion | Rec. | 10 (5 F, 5 M) | Mean: 38.0; SD: 11.6 | VT, AP, ML, Res., Freq., Spectral Energy, Stiffness |
| [206] | Rojas-Valverde, et al. | 2019 | Outdoor | Trail | not controlled | 35.27 km | Rec. | 20 (0 F, 20 M) | Mean: 38.95; SD: 9.99 | Res., Entropy, PlayerLoad |
| [207] | Rojas-Valverde, et al. | 2020 | Outdoor | Not Controlled | not controlled | 36 km | Rec. | 18 (NS) | Mean: 38.78; SD: 10.38 | Res. |
| [208] | Schütte, et al. | 2018 | Outdoor | Track | 3.2 km pace | 3200 m | Rec. | 16 (6 F, 10 M) | Mean: 20.23; SD: 0.78 | VT, Shock-frequency, Spectral Energy, Axis Ratio, Sym. or Reg., Entropy |
| Rec. | 14 (6 F, 8 M) | |||||||||
| [209] | Ueberschar, et al. | 2019 | Outdoor | Trail | 3.17 m/s | 10 km | Non | 10 (NS) | Mean: 10.7; SD: 1.27 | VT |
| Ref. | Author | Year | Location | Surface | Speed | Distance/Duration | Type | Number (Sex) | Overall Age | Metric(s) |
|---|---|---|---|---|---|---|---|---|---|---|
| [210] | Ahamed, et al. | 2019 | Outdoor | Not Controlled | not controlled | 29 km | Rec. | 11 (10 F, 1 M) | Mean: 44.1; SD: 9.1 | Joint ROM, Seg. Rot., COM Disp., COM Δv |
| [211] | Ahamed, et al. | 2018 | Outdoor | Pavement | not controlled | ≥24 km | Rec. | 6 (5 F, 1 M) | Mean: 44.4; NR | Seg. Rot., COM Disp., COM Δv |
| [212] | Ahamed, et al. | 2019 | Outdoor | Not Controlled | not controlled | 7 runs | Rec. | 35 (25 F, 10 M) | Mean: 49.7; SD: 9.6 | Joint ROM, Seg. Rot., COM Disp., COM Δv |
| [213] | Benson, et al. | 2019 | Outdoor | Not Controlled | not controlled | 10 runs | Rec. | 12 (9 F, 3 M) | Mean: 48.5; SD: 12.0 | Joint ROM, Seg. Rot., COM Disp., COM Δv |
| [214] | Carton-Llorente, et al. | 2021 | Indoor | Treadmill | submaximal | 120 min | Rec. | 22 (0 F, 22 M) | Mean: 34; SD: 7.5 | Power |
| [215] | Cerezuela-Espejo, et al. | 2020 | Indoor | Treadmill | 2.78 m/s | 24 min | Rec. | 12 (0 F, 12 M) | Mean: 25.7; SD: 7.9 | Power |
| [216] | Colapietro, et al. | 2020 | Outdoor | Track | slow, fast | 3200 m | Rec. | 18 (10 F, 8 M) | Mean: 22.7; SD: 4.7 | VT, AP, Joint ROM, Joint ω |
| [217] | Gregory, et al. | 2019 | Outdoor | Track | hard | 1600 m | Non | 12 (6 F, 6 M) | Mean: 22.0; SD: 1.9 | VT, AP, Joint ROM, Joint ω |
| [218] | Hollander, et al. | 2021 | Indoor | Treadmill | 70% VO2max | 105 min | Non | 41 (20 F, 21 M) | Mean: 25.2; SD: 3.1 | Stability |
| [219] | Hollis, et al. | 2019 | Outdoor | Grass | moderate, hard | 3200 m | Rec. | 15 (8 F, 7 M) | Mean: 20; SD: 3.1 | VT, AP, Joint ROM, Joint ω |
| Outdoor | Track | moderate, hard | 3200 m | |||||||
| [220] | Kiernan, et al. | 2018 | Outdoor | Not Controlled | not controlled | 60 day training period | Comp. | 9 (0 F, 9 M) | Mean: 18.7; SD: 1.0 | VT |
| [221] | Koldenhoven, et al. | 2020 | Outdoor | Not Controlled | not controlled | 3 runs | Rec. | 16 (8 F, 8 M) | Mean: 23.5; SD: 5 | AP, Res., Seg. Rot., Seg. Rot. Velocity |
| [116] | Macdermid, et al. | 2017 | Indoor | Treadmill | 2.83 m/s | 30 min | Comp. | 6 (NS) | Mean: 29.8; SD: 13.0 | Loading Rate, Shock-time, COM Disp. |
| [222] | McGregor, et al. | 2009 | Indoor | Treadmill | incremental from 0.56 m/s | 2 runs to exhaustion | Comp. | 7 (0 F, 7 M) | Mean: 26.5; SD: 5.7 | VT, AP, ML, Res. |
| Non | 7 (NS) | |||||||||
| [223] | Nüesch, et al. | 2019 | Indoor | Treadmill | self-selected | 15 min | Rec. | 19 (11 F, 8 M) | Mean: 27.7; SD: 8.6 | Joint ROM |
| [224] | Olcina, et al. | 2019 | NR | Track | maximal | 24 min | Comp. | 10 (2 F, 8 M) | Mean: 25.7; SD: 8.9 | COM Disp. |
| Outdoor | Trail | not controlled | 4.1 km | |||||||
| [225] | Rochat, et al. | 2019 | Outdoor | Trail | not controlled | 15 km | Rec. | 9 (0 F, 9 M) | Mean: 37.8; SD: 7 | VT, COM Disp. |
| [226] | Ruder, et al. | 2019 | Outdoor | Pavement | not controlled | 42.2 km | Rec. | 222 (103 F, 119 M) | Mean: 44.1; SD: 10.8 | VT |
| [227] | Ryan, et al. | 2021 | Outdoor | Not Controlled | not controlled | 10–12 runs | Rec. | 12 (0 F, 12 M) | NR; Range: 14–18 | Res. |
| [228] | Strohrmann, et al. | 2012 | Indoor | Treadmill | 85% of maximal | 45 min | Rec. | 21 (NS) | NR | Res., Joint ω, Seg. Rot., COM Disp. |
| Outdoor | Track | 85% of maximal | 45 min | |||||||
| [209] | Ueberschar, et al. | 2019 | Outdoor | Pavement | 3.64 and 6.67 m/s | 10.7 km | Comp. | 2 (0 F, 2 M) | Mean: 17.6; SD: 1.13 | VT |
| [229] | Van den Berghe, et al. | 2020 | Indoor | Track | 3.2 m/s | 24.5 min | Rec. | 10 (5 F, 5 M) | Mean: 33; SD: 9 | VT |
| [230] | Vanwanseele, et al. | 2020 | Indoor | Treadmill | 2.22, 3.33, and 4.44 m/s | 3 min | Rec. | 68 (NS) | Mean: 29.5; SD: 8.1 | VT, AP, ML |
| Outdoor | Not Controlled | not controlled | 3 month training period | |||||||
| [231] | Willis, et al. | 2019 | Indoor | Treadmill | 2.50, 2.78, 3.61, and 4.17 m/s | 10 min | Comp. | 12 (NS) | Mean: 33.6; SD: 4.3 | Stiffness |
| Ref. | Author | Year | Location | Surface | Speed | Distance/Duration | Type | Number (Sex) | Overall Age | Metric(s) |
|---|---|---|---|---|---|---|---|---|---|---|
| [232] | Bielik | 2019 | Outdoor | Track | 2.78, 3.33, and 4.17 m/s | 15 min | Rec. | 73 (24 F, 49 M) | Mean: 29.2; SD: 4.1 | COM Disp. |
| Outdoor | Treadmill | incremental from 0.28 m/s | run to exhaustion | |||||||
| [233] | Bielik and Clementis | 2017 | Indoor | Treadmill | incremental from 2.22 m/s | run to exhaustion | Comp. | 30 (NS) | NR | COM Disp. |
| Rec. | 24 (NS) | |||||||||
| [234] | Butler, et al. | 2007 | Indoor | Treadmill | self-selected | 2 runs | Rec. | 24 (NS) | Mean: 21.4; SD: 3.1 | VT |
| [235] | Cooper, et al. | 2009 | Indoor | Treadmill | incremental from 0.45 m/s to 2.24 m/s | 5 min | Non | 7 (2 F, 5 M) | Mean: 30; SD: 6 | Joint ROM |
| [236] | de Fontenay, et al. | 2020 | Indoor | Treadmill | self-selected | NR | Non | 32 (13 F, 19 M) | Mean: 27.0; SD: 5.5 | AP, Loading Rate, Joint ROM, COM Disp. |
| [237] | Dufek, et al. | 2008 | Indoor | Treadmill | self-selected | 90 s | Rec. | 31 (31 F, 0 M) | Mean: 26.7; SD: 3.8 | VT, Shock-time |
| [238] | Garrett, et al. | 2019 | NR | NR | 6.25 m/s | 450 m | Comp. | 23 (0 F, 23 M) | Mean: 22.4; SD: 3.6 | PlayerLoad |
| [239] | Gurchiek, et al. | 2017 | Indoor | Floor | sprint | NR | Non | 15 (3 F, 12 M) | Mean: 23.2; SD: 2.11 | Seg. Rot. |
| [240] | Sheerin, et al. | 2020 | Indoor | Treadmill | comfortable | NR | Rec. | 18 (7 F, 11 M) | Mean: 35.2; SD: 9.6 | Res. |
| Outdoor | Track | comfortable | 800 m | |||||||
| [241] | Ueberschar, et al. | 2019 | Indoor | Treadmill | incremental | run to exhaustion | Comp. | 53 (18 F, 35 M) | Mean: 20.07; SD: 3.65 | VT, Shock-time |
| [242] | Zadeh, et al. | 2020 | Outdoor | Not Controlled | not controlled | 36 physical training sessions | Non | 55 (16 F, 39 M) | Mean: 20.8; SD: 3.32 | VT, Res., Loading Rate |
Publisher’s Note: MDPI stays neutral with regard to jurisdictional claims in published maps and institutional affiliations. |
© 2022 by the authors. Licensee MDPI, Basel, Switzerland. This article is an open access article distributed under the terms and conditions of the Creative Commons Attribution (CC BY) license (https://creativecommons.org/licenses/by/4.0/).
Share and Cite
Benson, L.C.; Räisänen, A.M.; Clermont, C.A.; Ferber, R. Is This the Real Life, or Is This Just Laboratory? A Scoping Review of IMU-Based Running Gait Analysis. Sensors 2022, 22, 1722. https://doi.org/10.3390/s22051722
Benson LC, Räisänen AM, Clermont CA, Ferber R. Is This the Real Life, or Is This Just Laboratory? A Scoping Review of IMU-Based Running Gait Analysis. Sensors. 2022; 22(5):1722. https://doi.org/10.3390/s22051722
Chicago/Turabian StyleBenson, Lauren C., Anu M. Räisänen, Christian A. Clermont, and Reed Ferber. 2022. "Is This the Real Life, or Is This Just Laboratory? A Scoping Review of IMU-Based Running Gait Analysis" Sensors 22, no. 5: 1722. https://doi.org/10.3390/s22051722
APA StyleBenson, L. C., Räisänen, A. M., Clermont, C. A., & Ferber, R. (2022). Is This the Real Life, or Is This Just Laboratory? A Scoping Review of IMU-Based Running Gait Analysis. Sensors, 22(5), 1722. https://doi.org/10.3390/s22051722