
AdaSG: A Lightweight Feature Point Matching Method Using Adaptive Descriptor with GNN for VSLAM


 and
and 
Abstract
:1. Introduction
2. Related Work
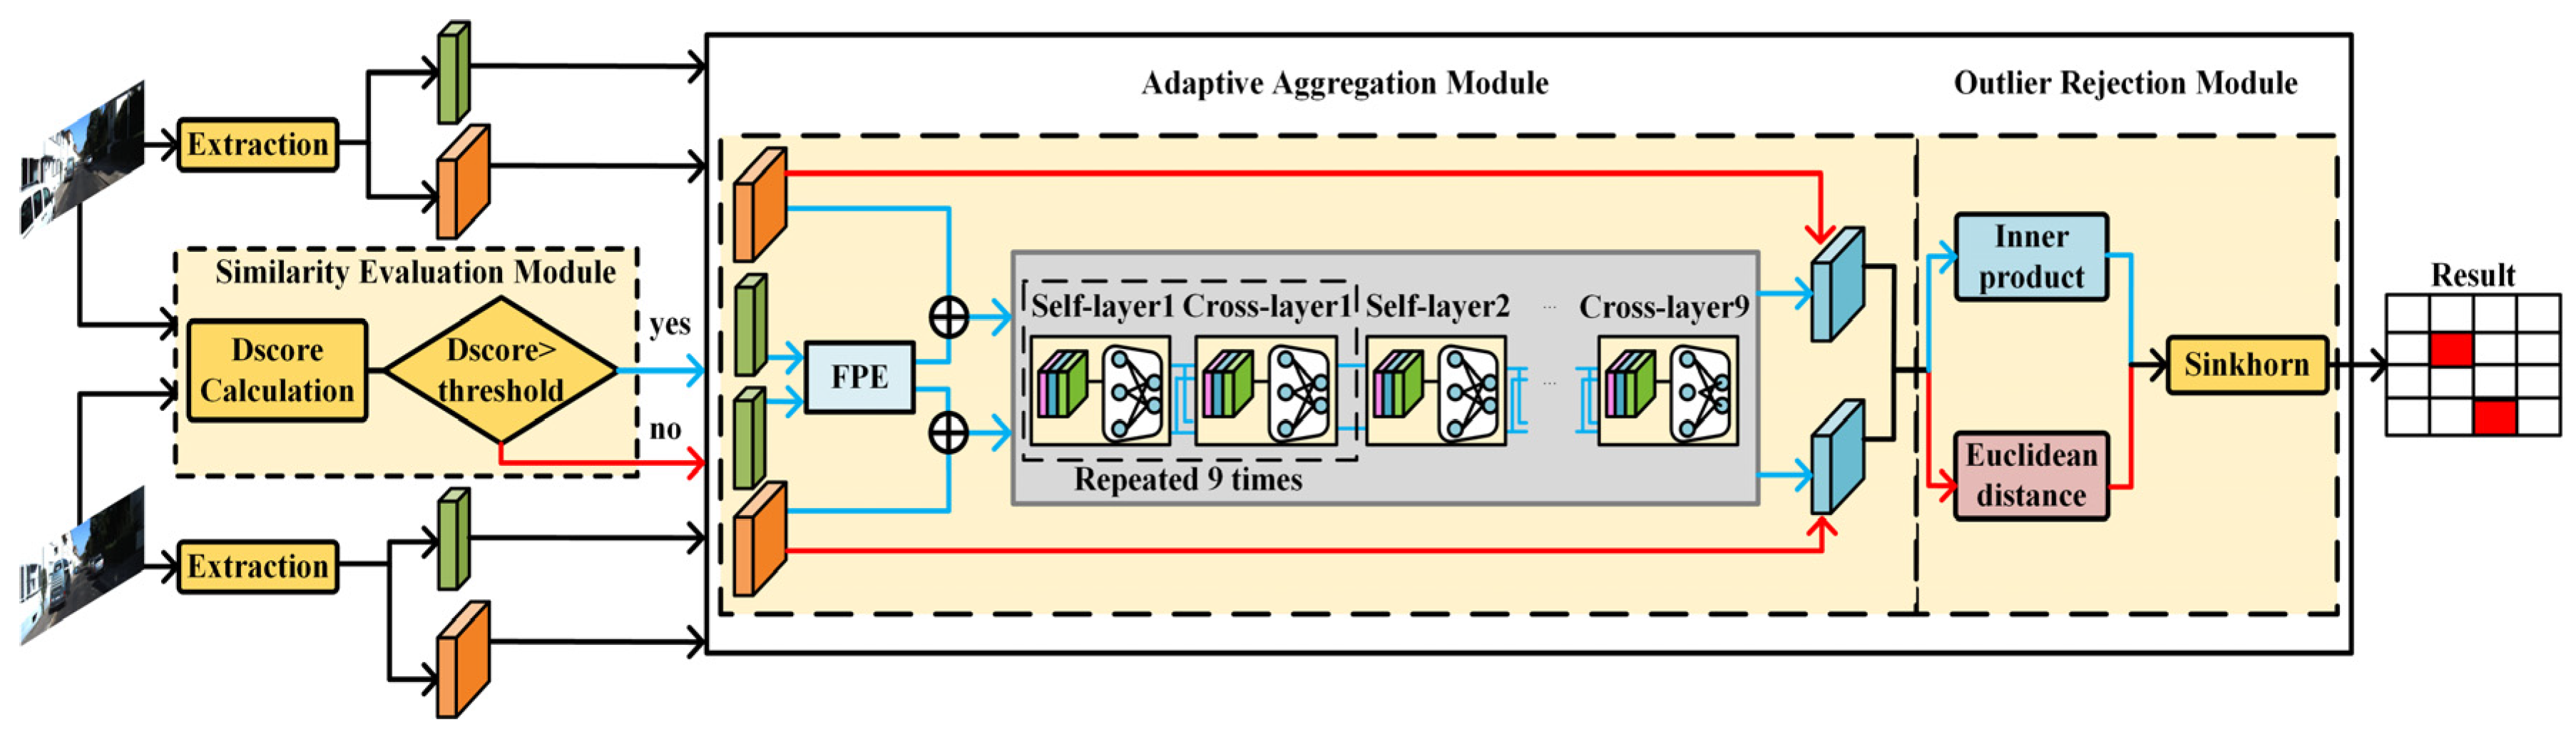
3. Proposed AdaSG
3.1. Similarity Evaluation Module
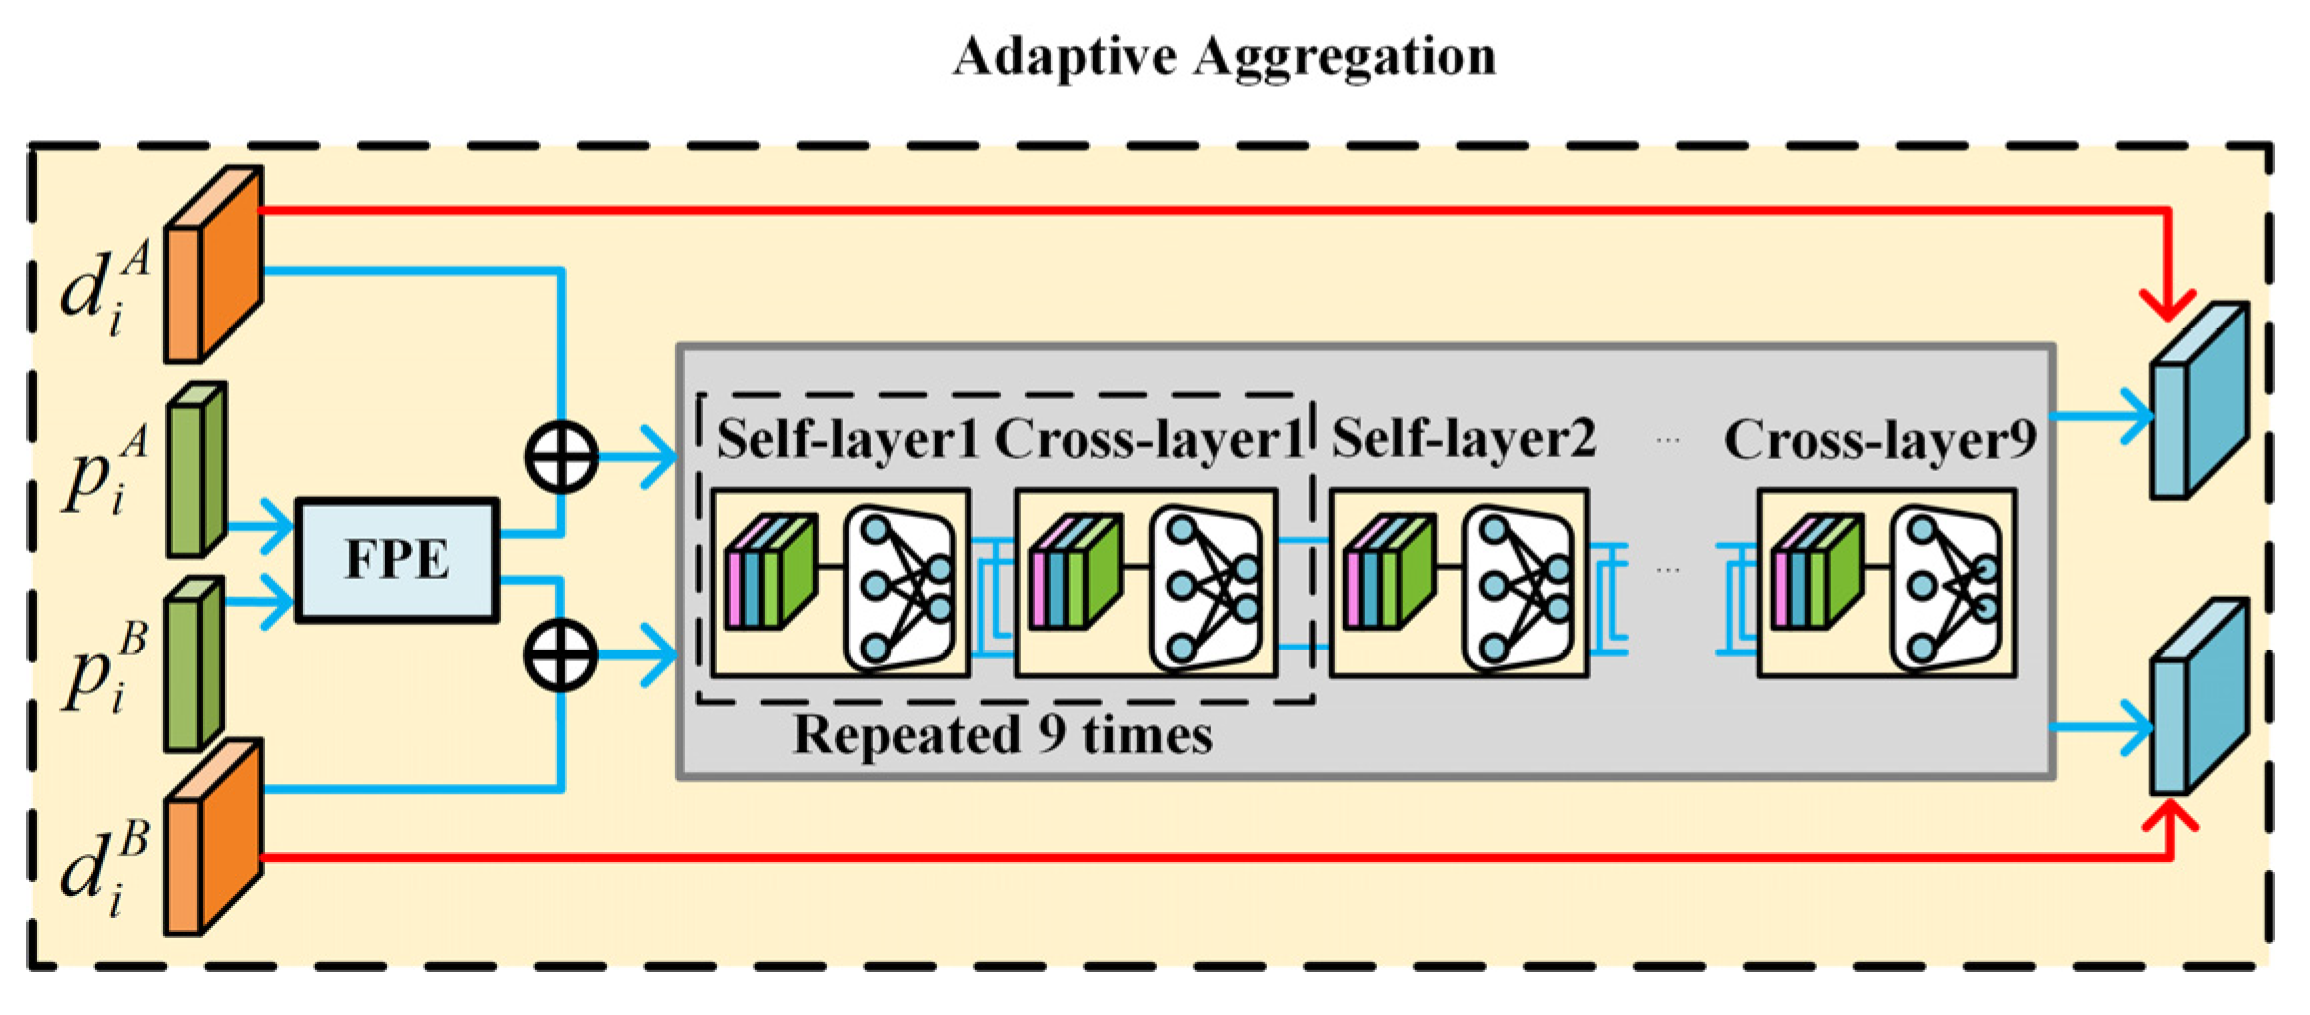
3.2. Adaptive Aggregation Module
3.3. Outlier Rejection Module
4. Experimental Results and Analysis
4.1. Experimental Setup
4.2. Indoor Dataset Experimental Results
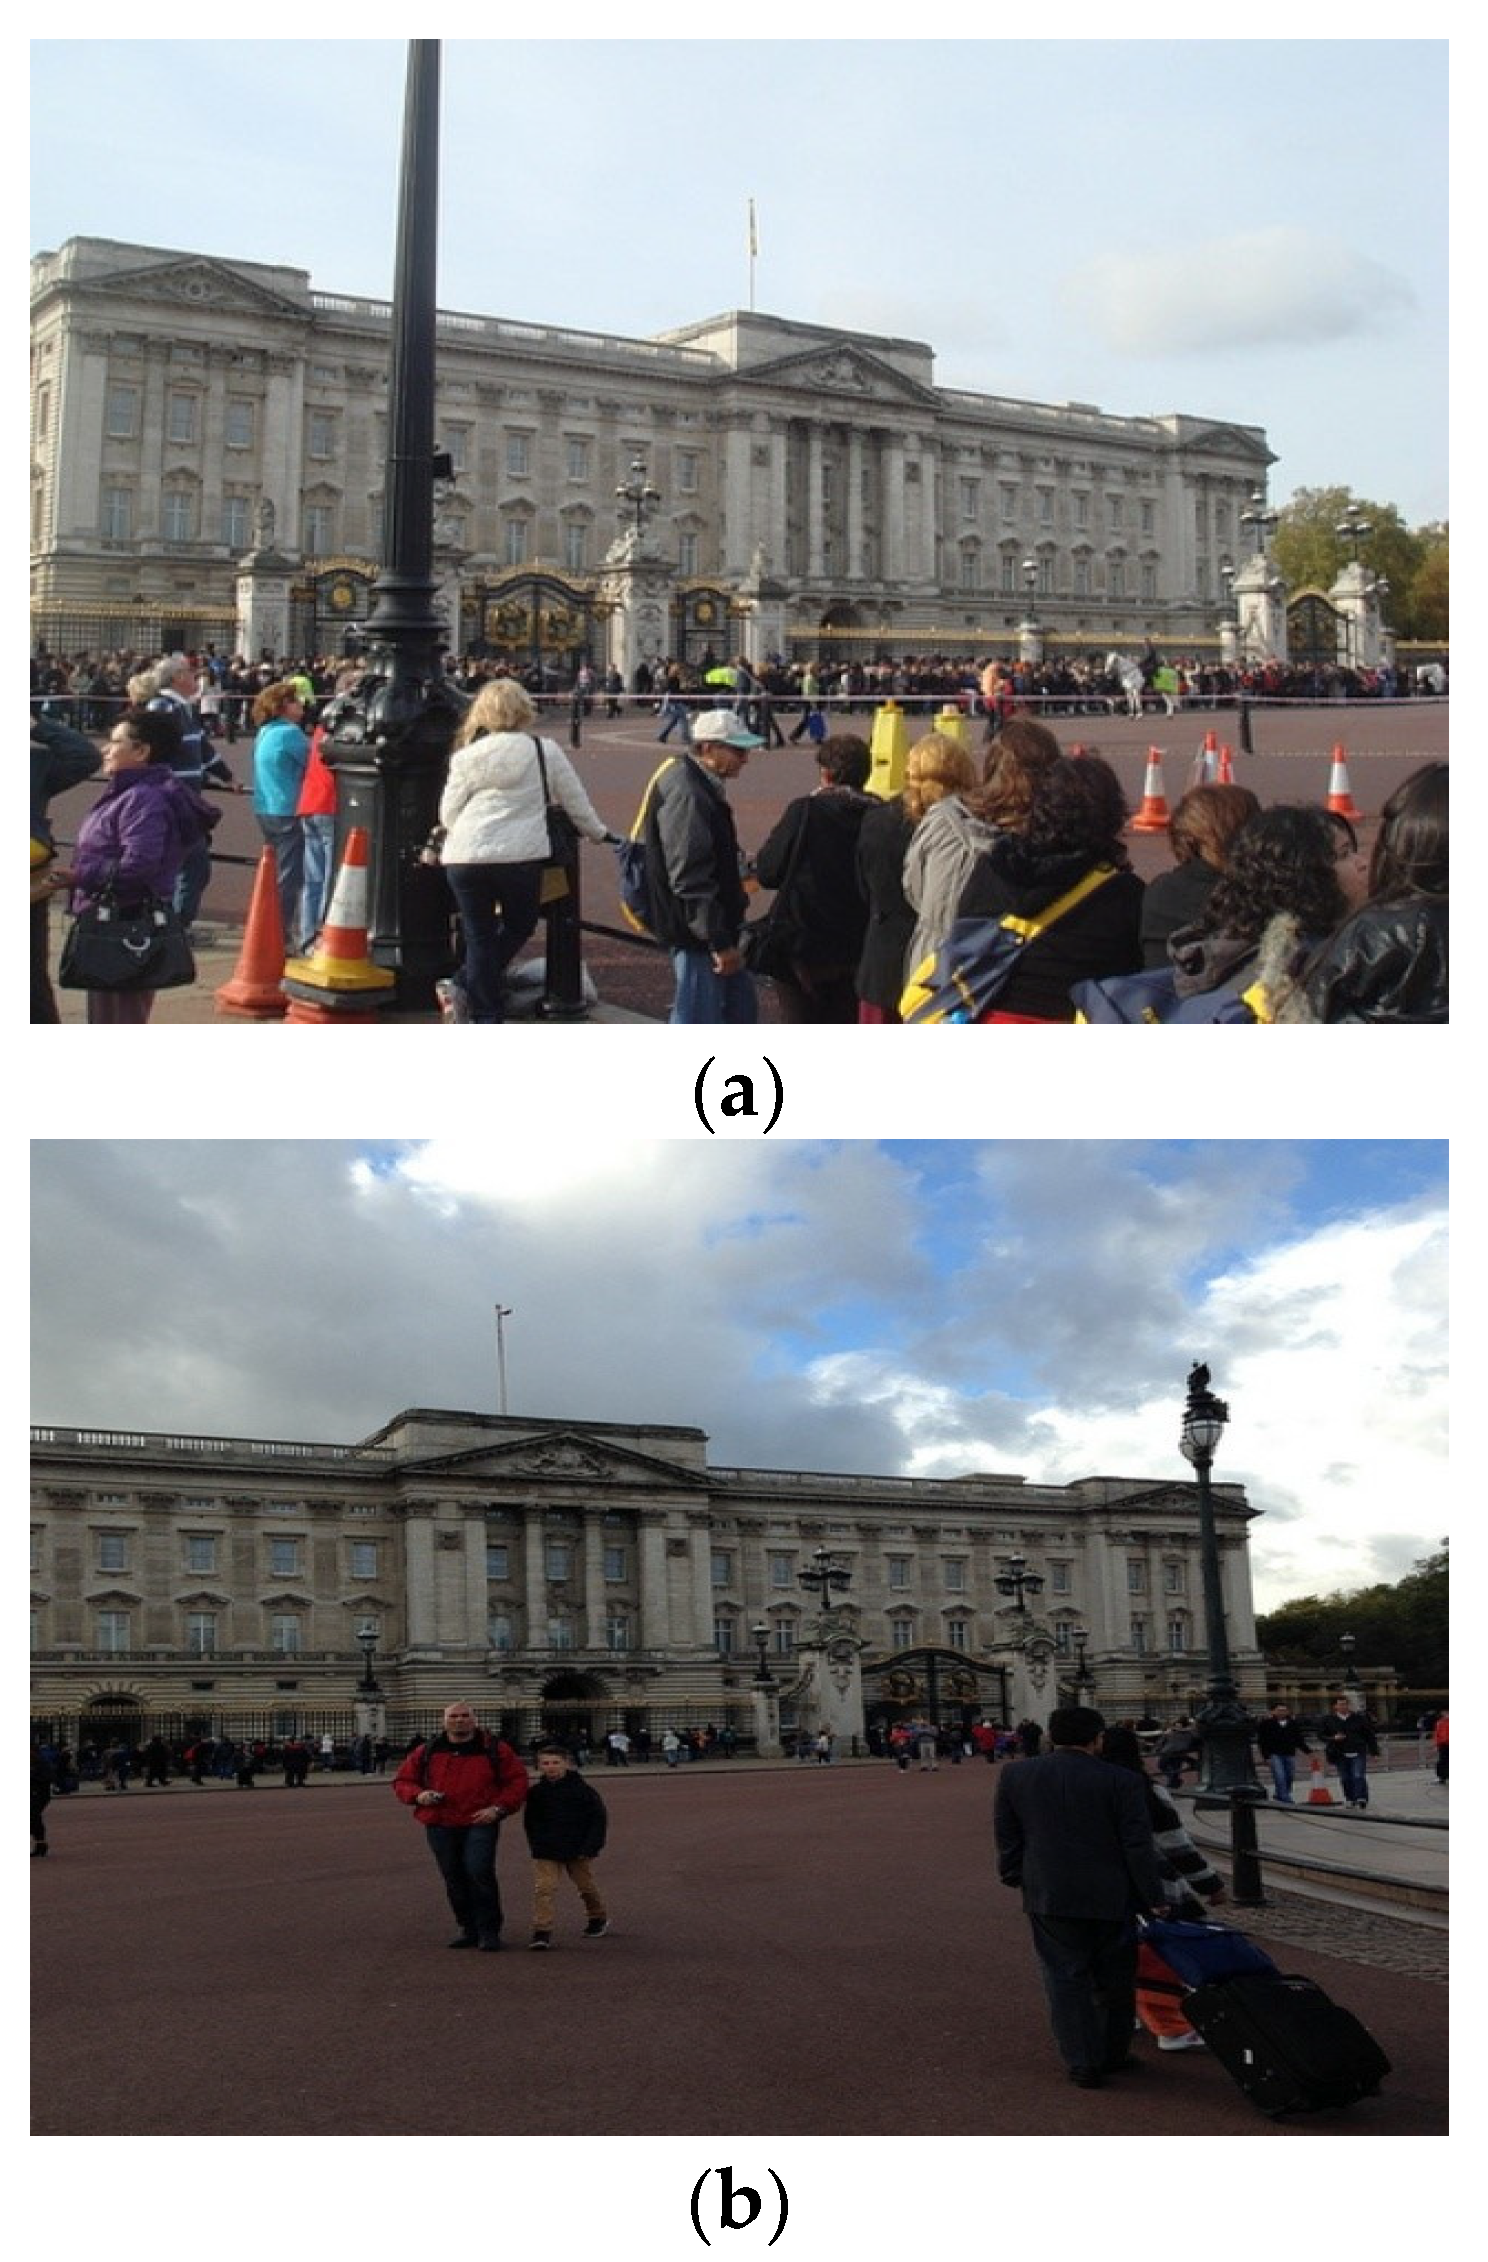
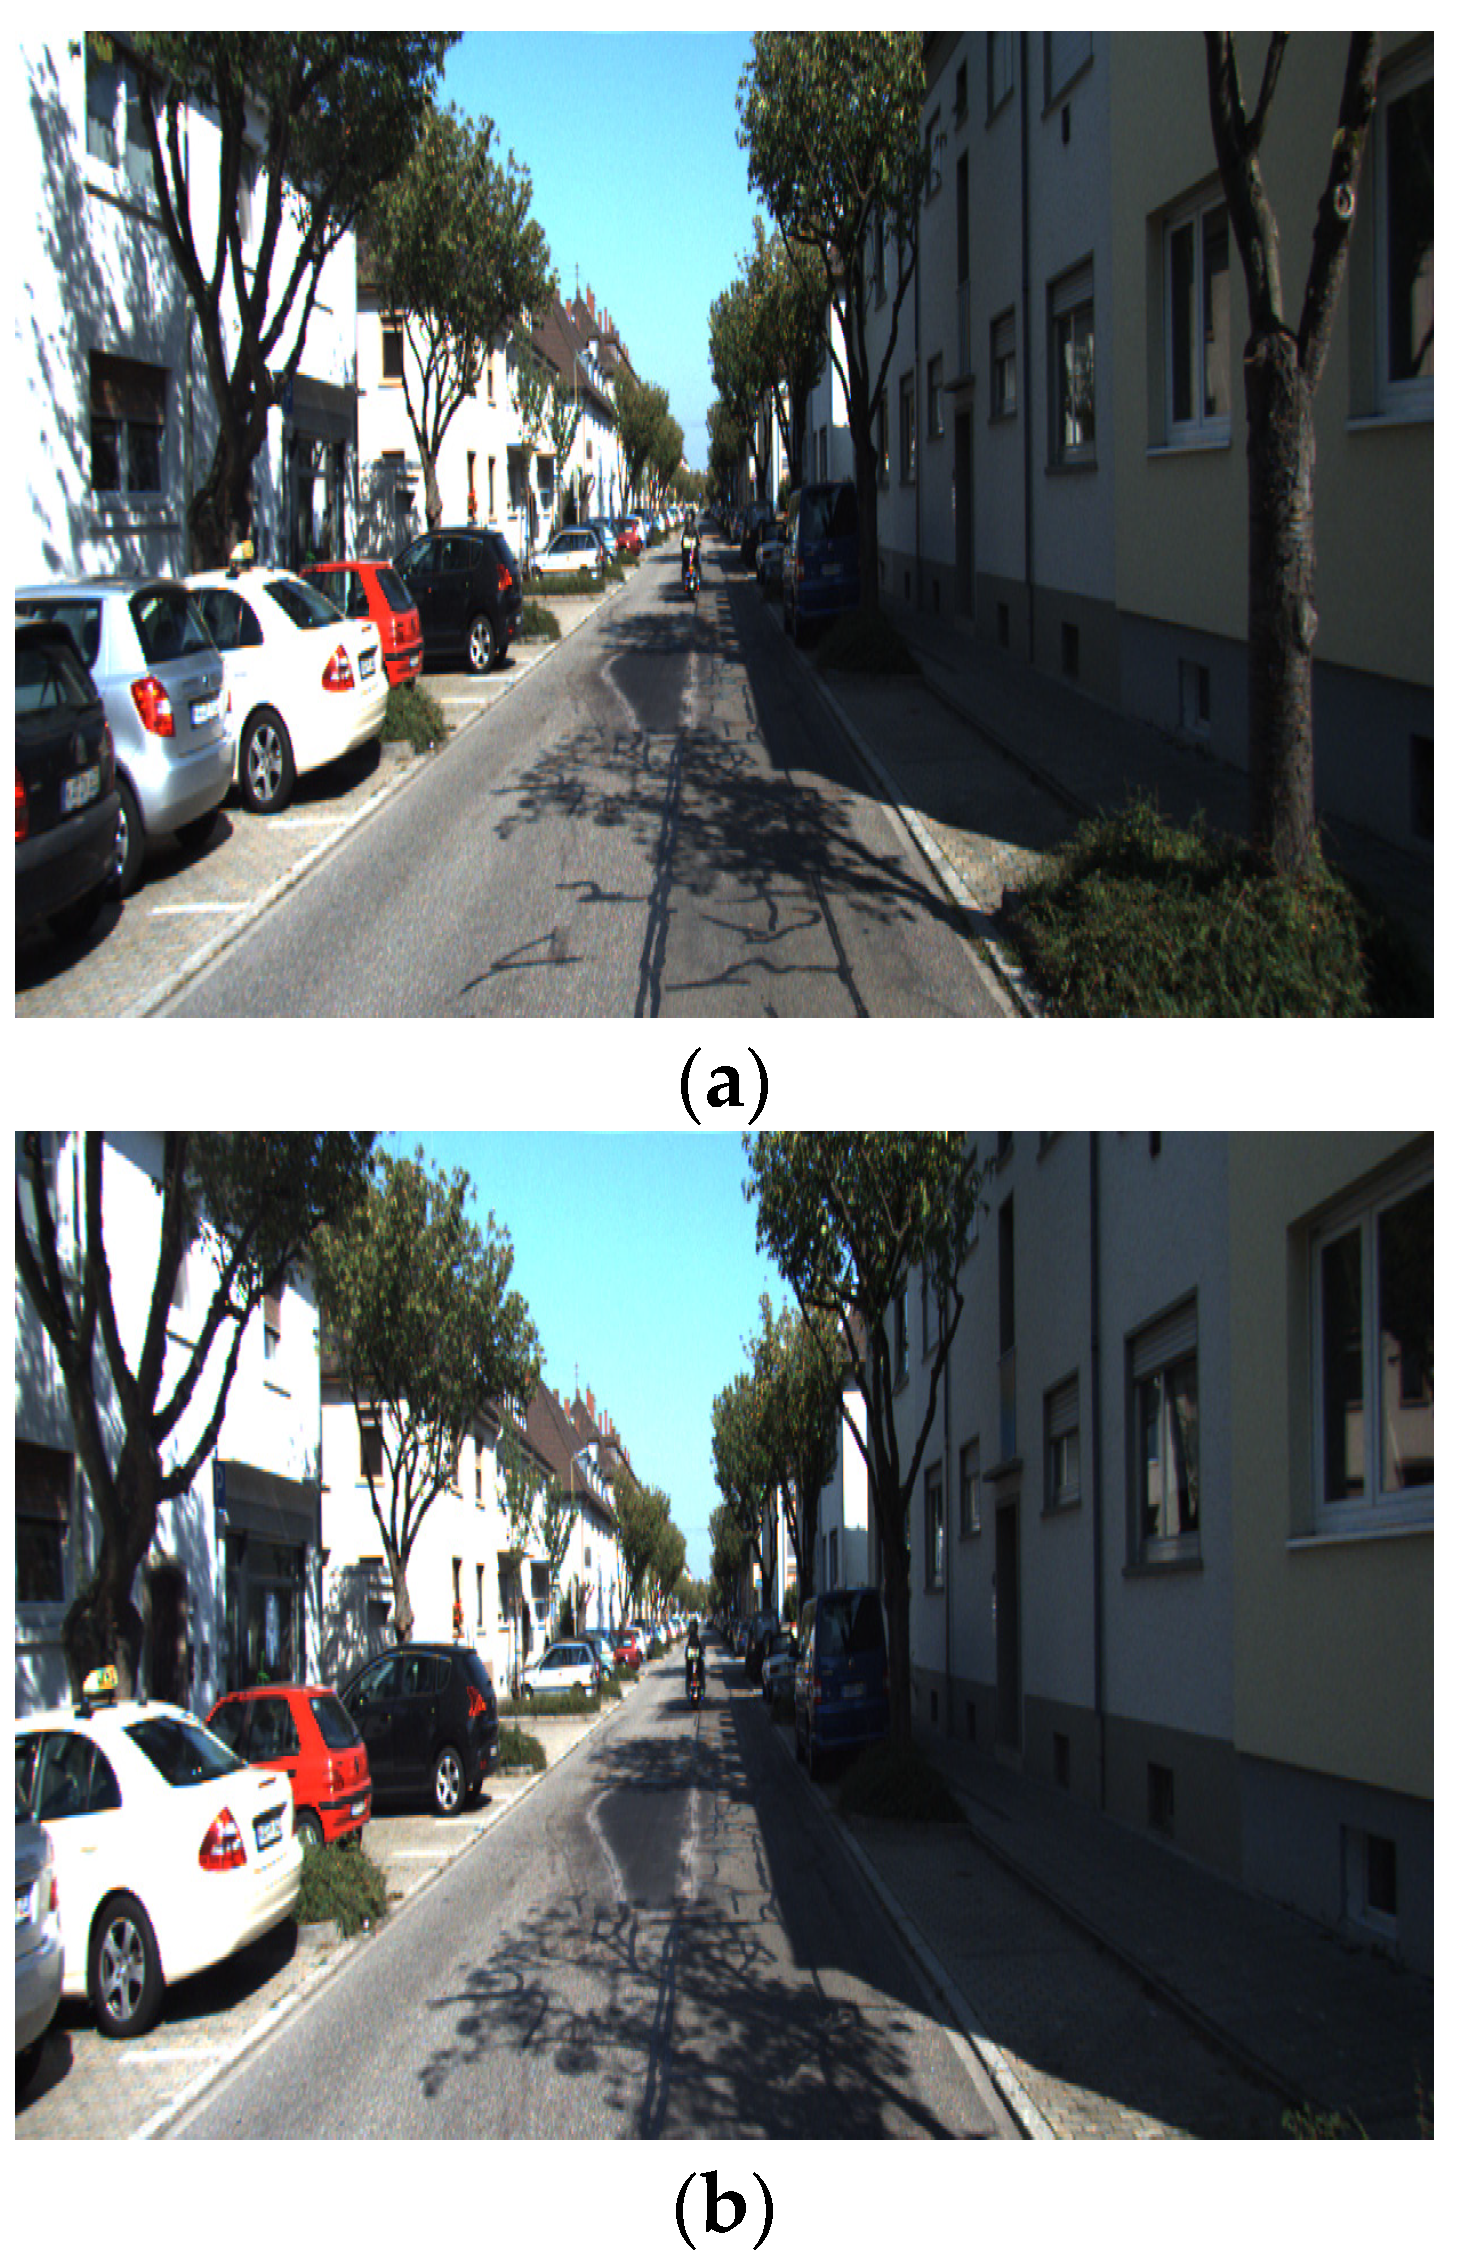
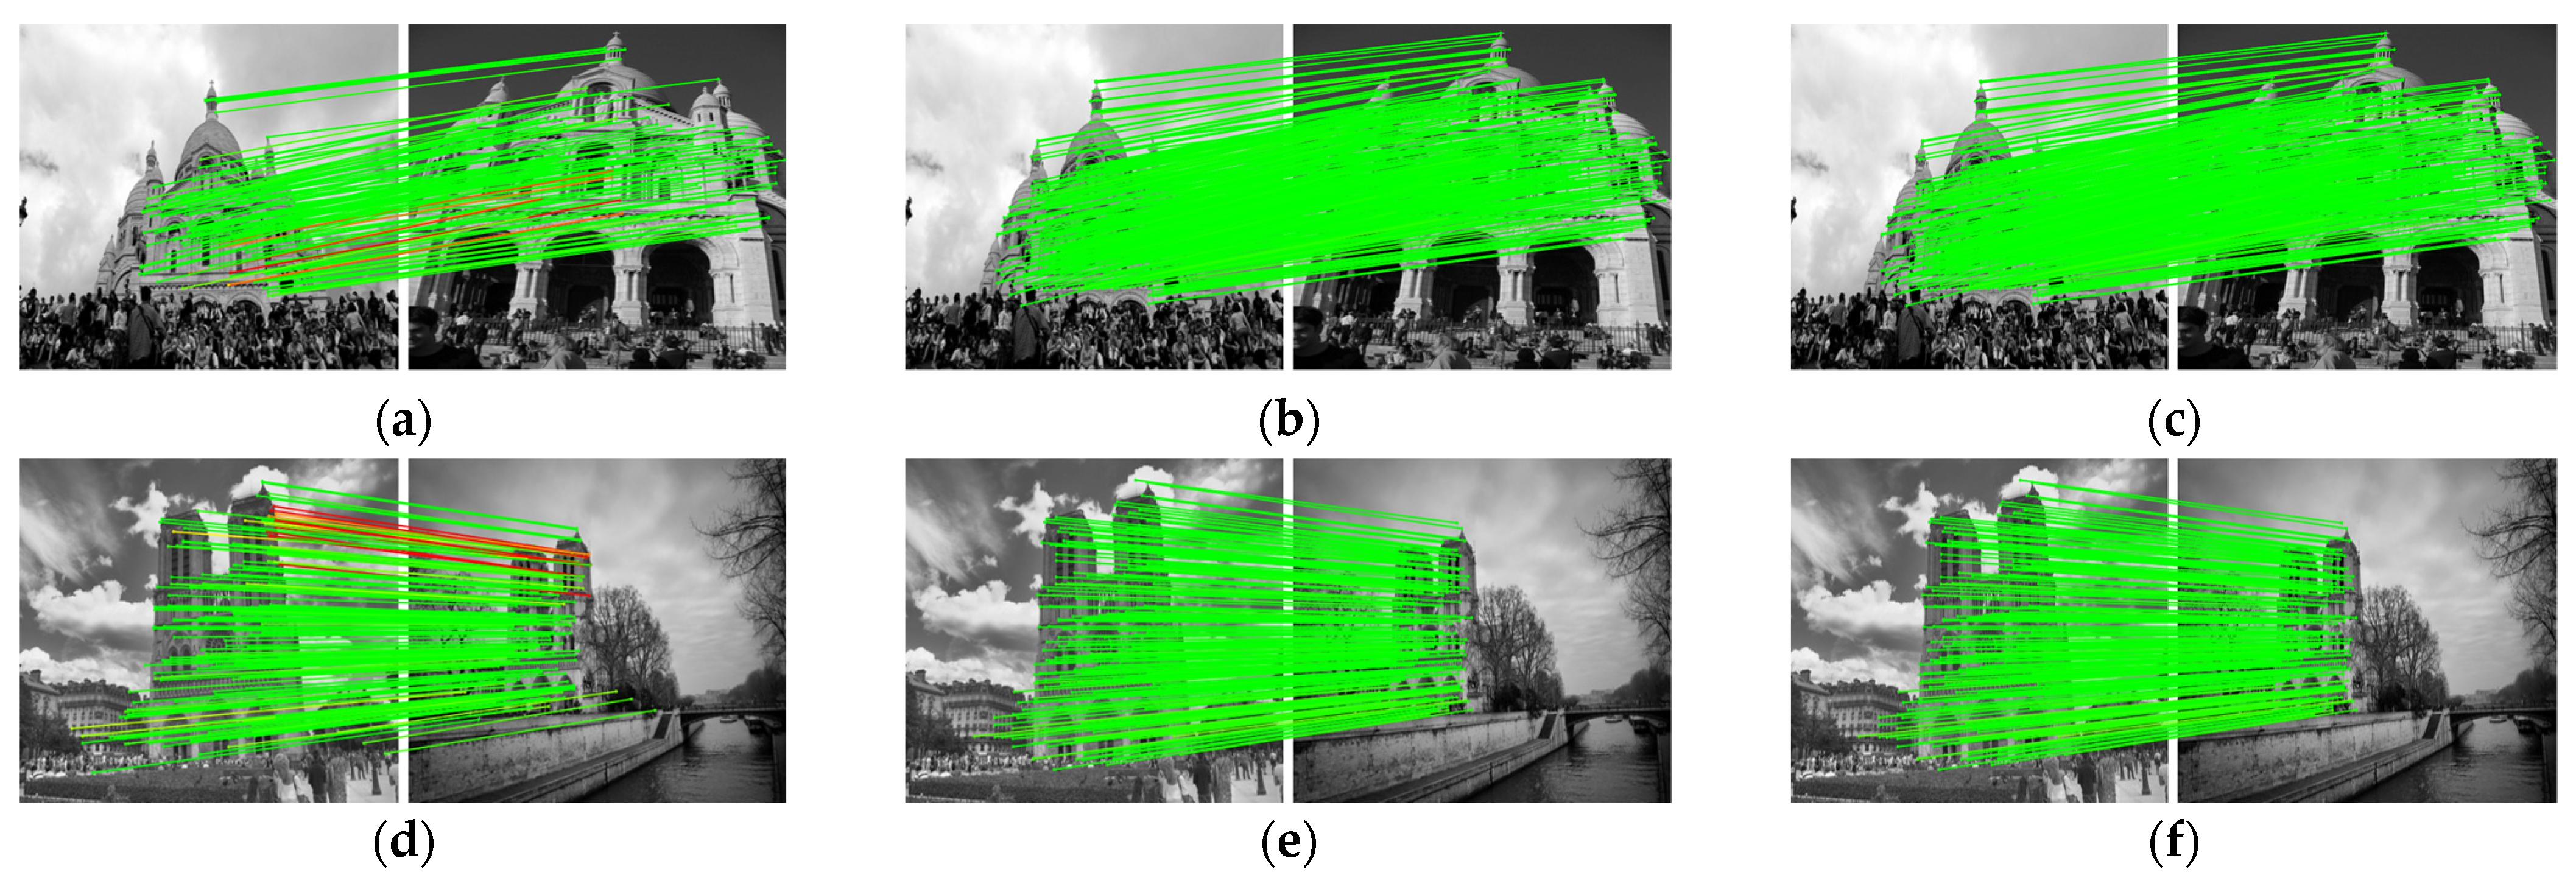
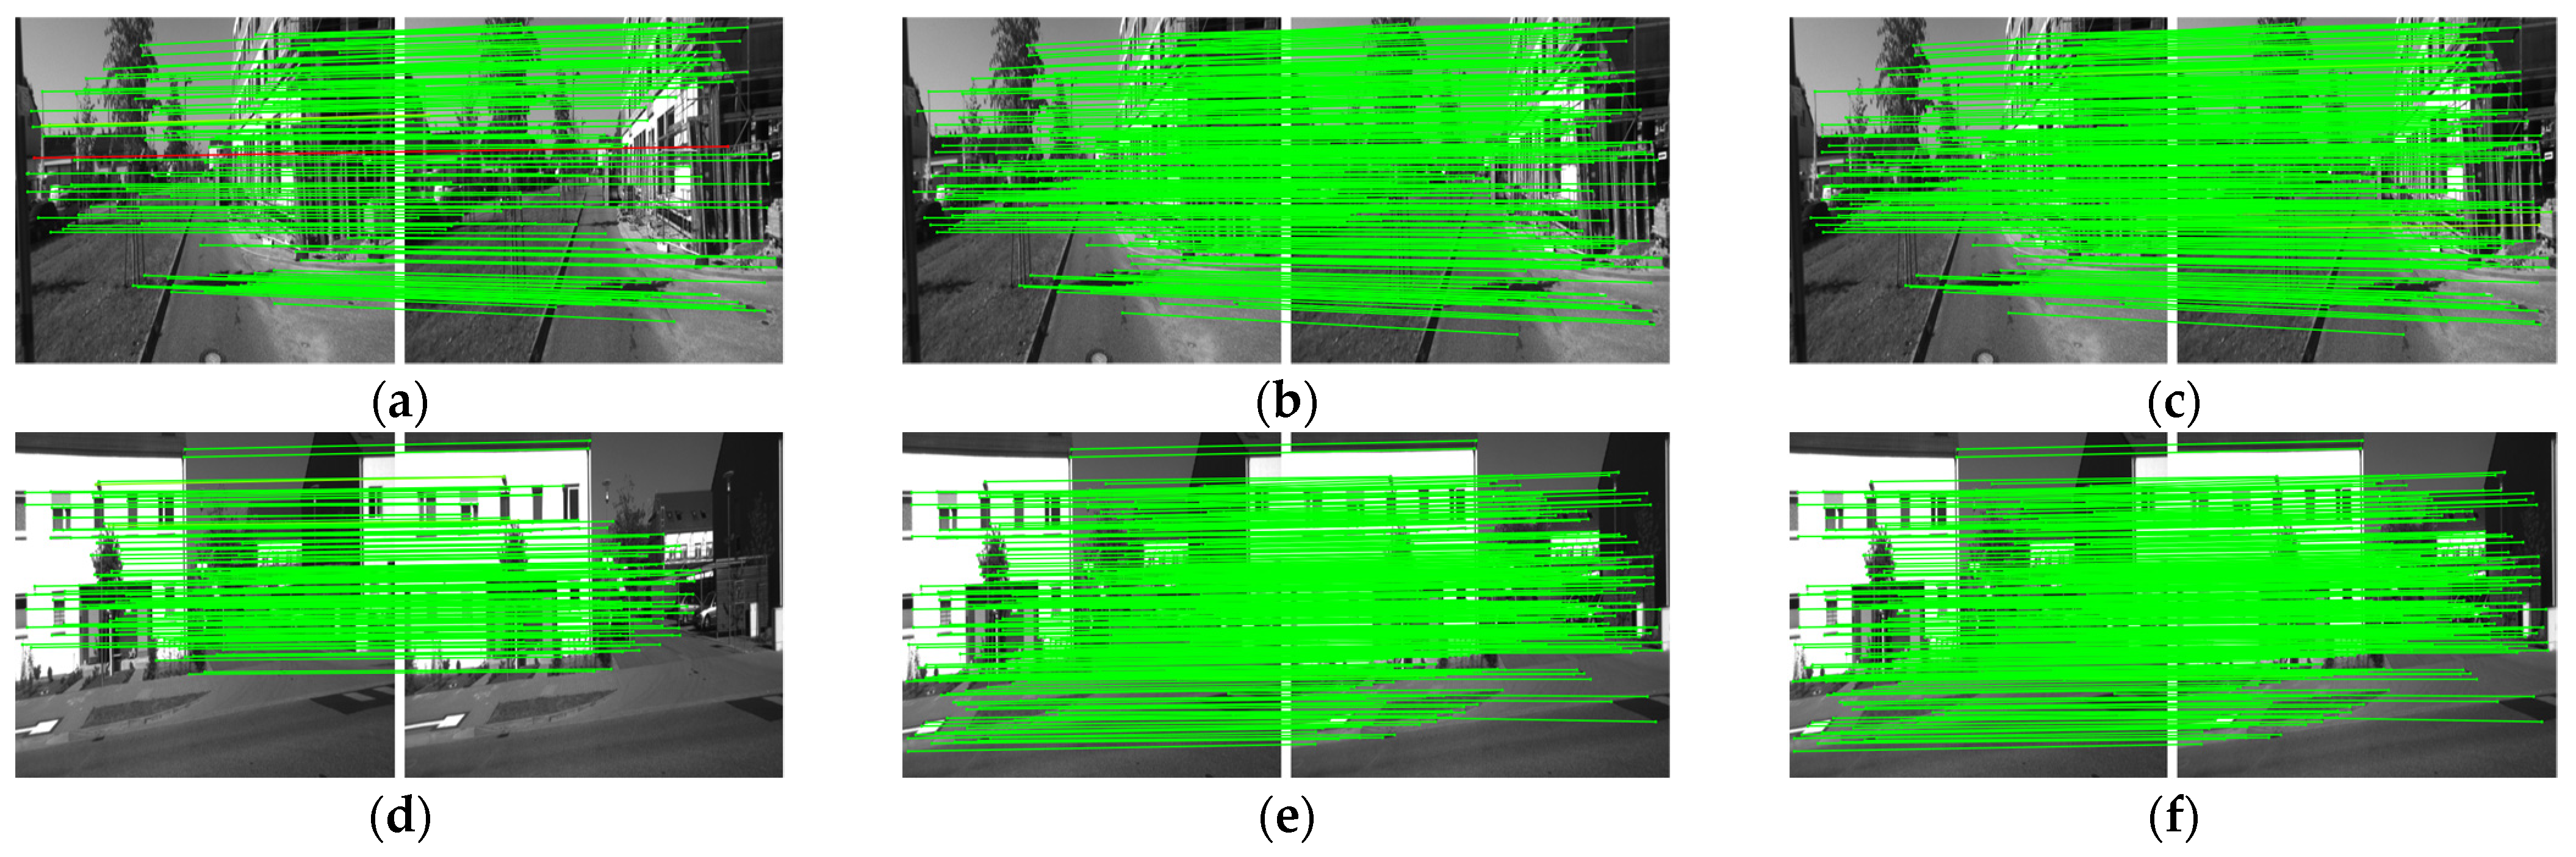
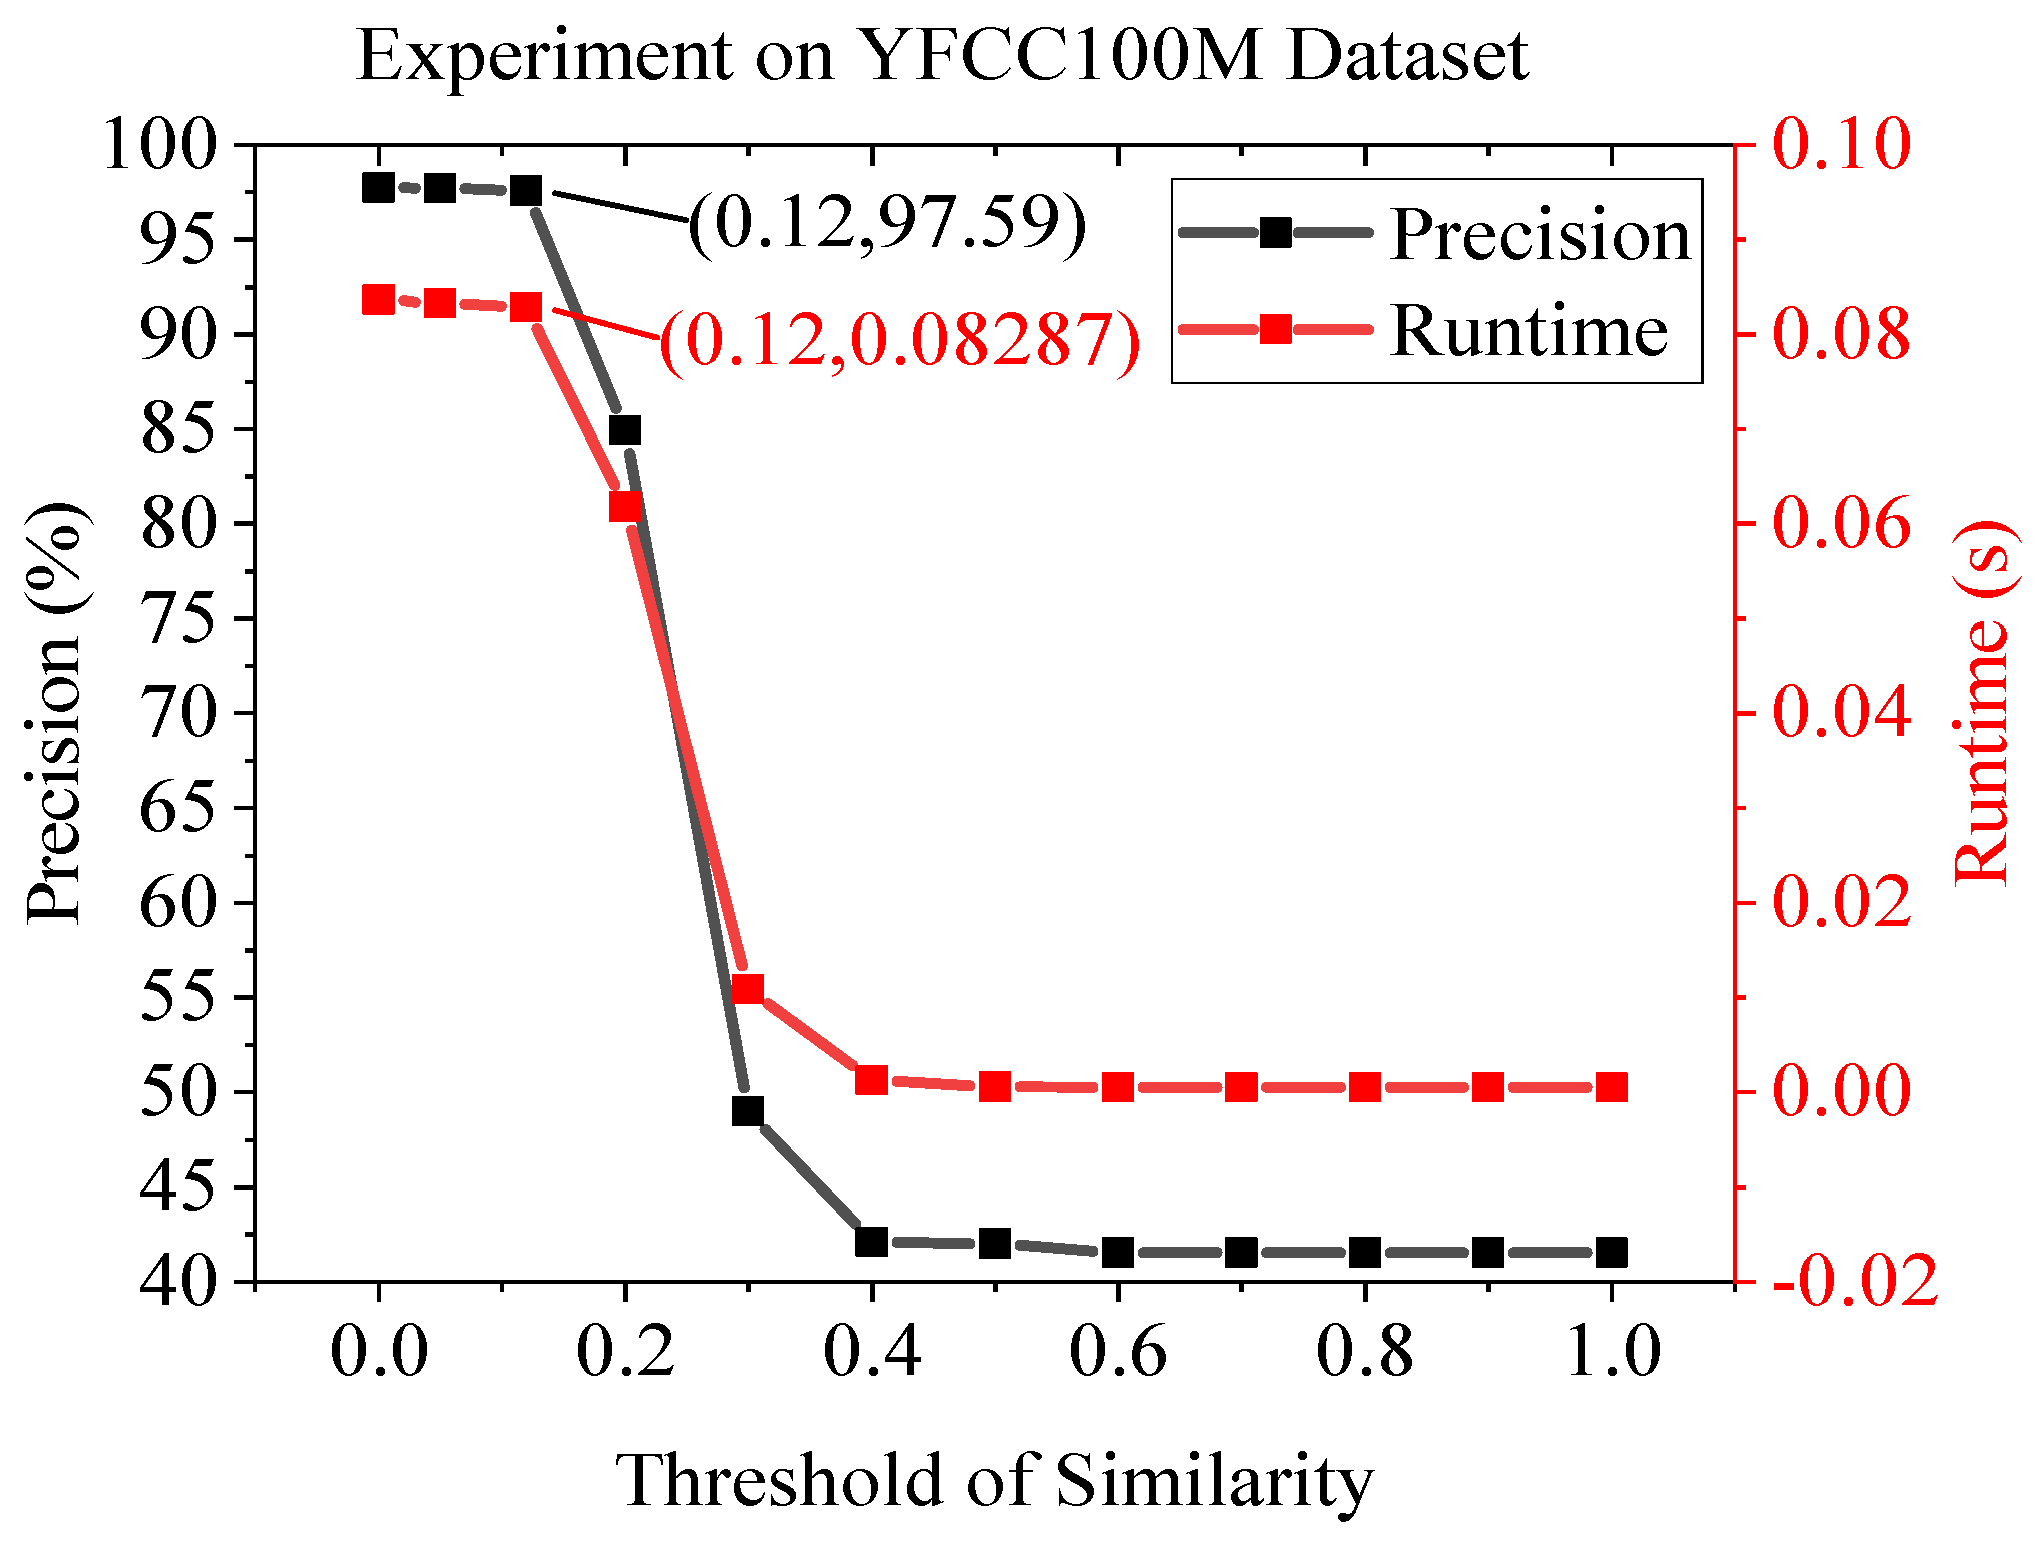
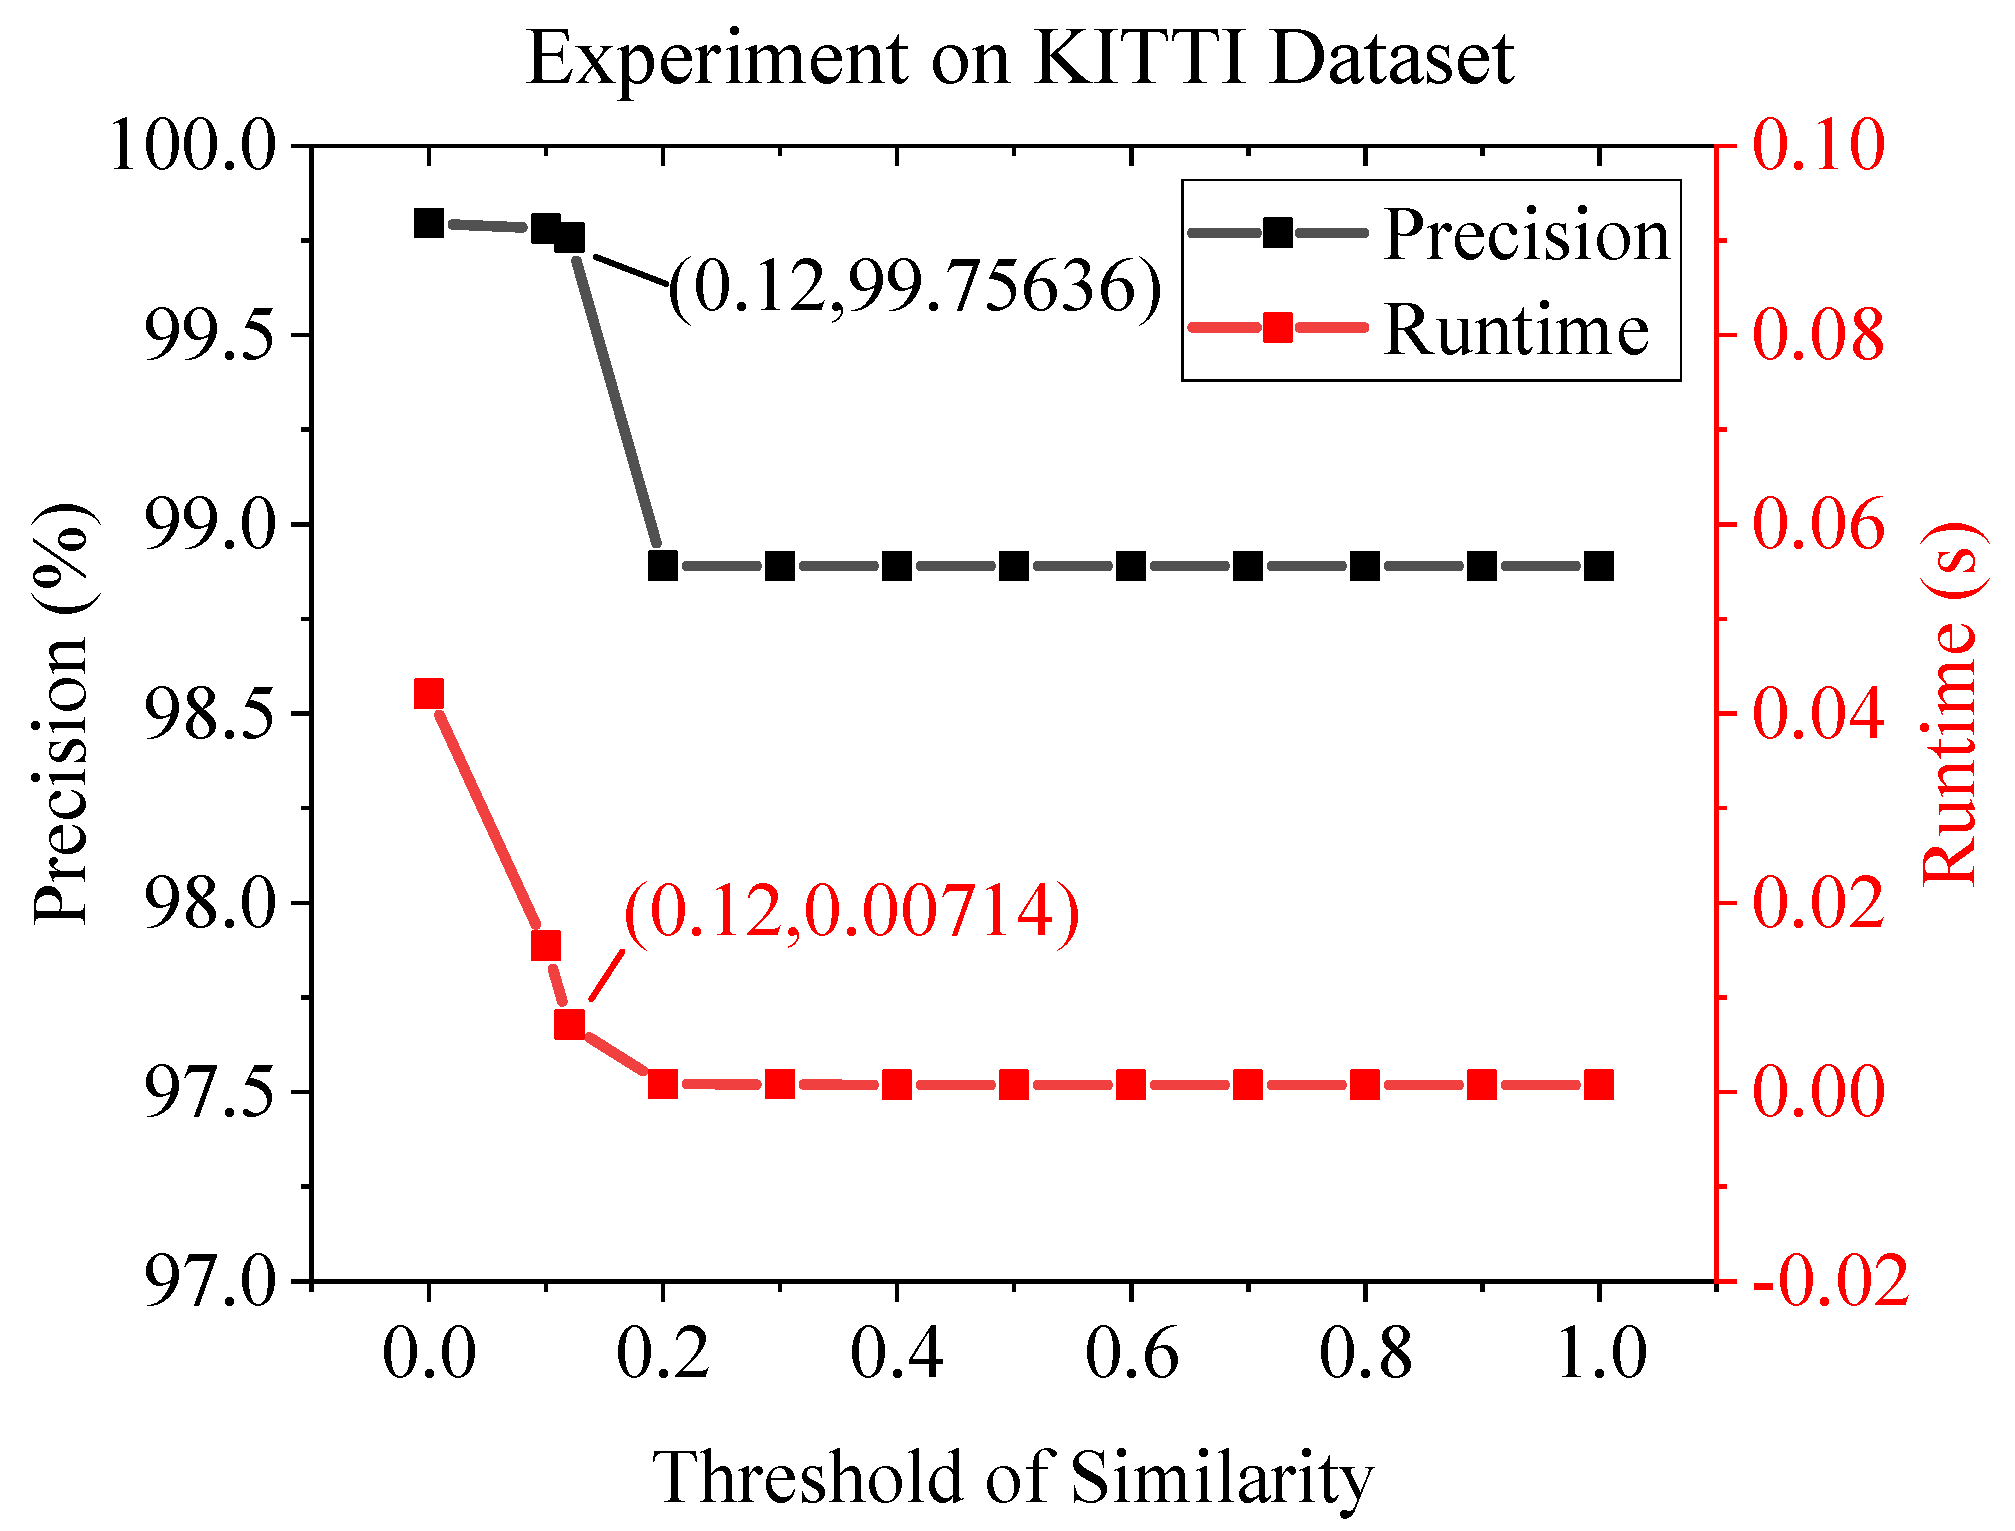
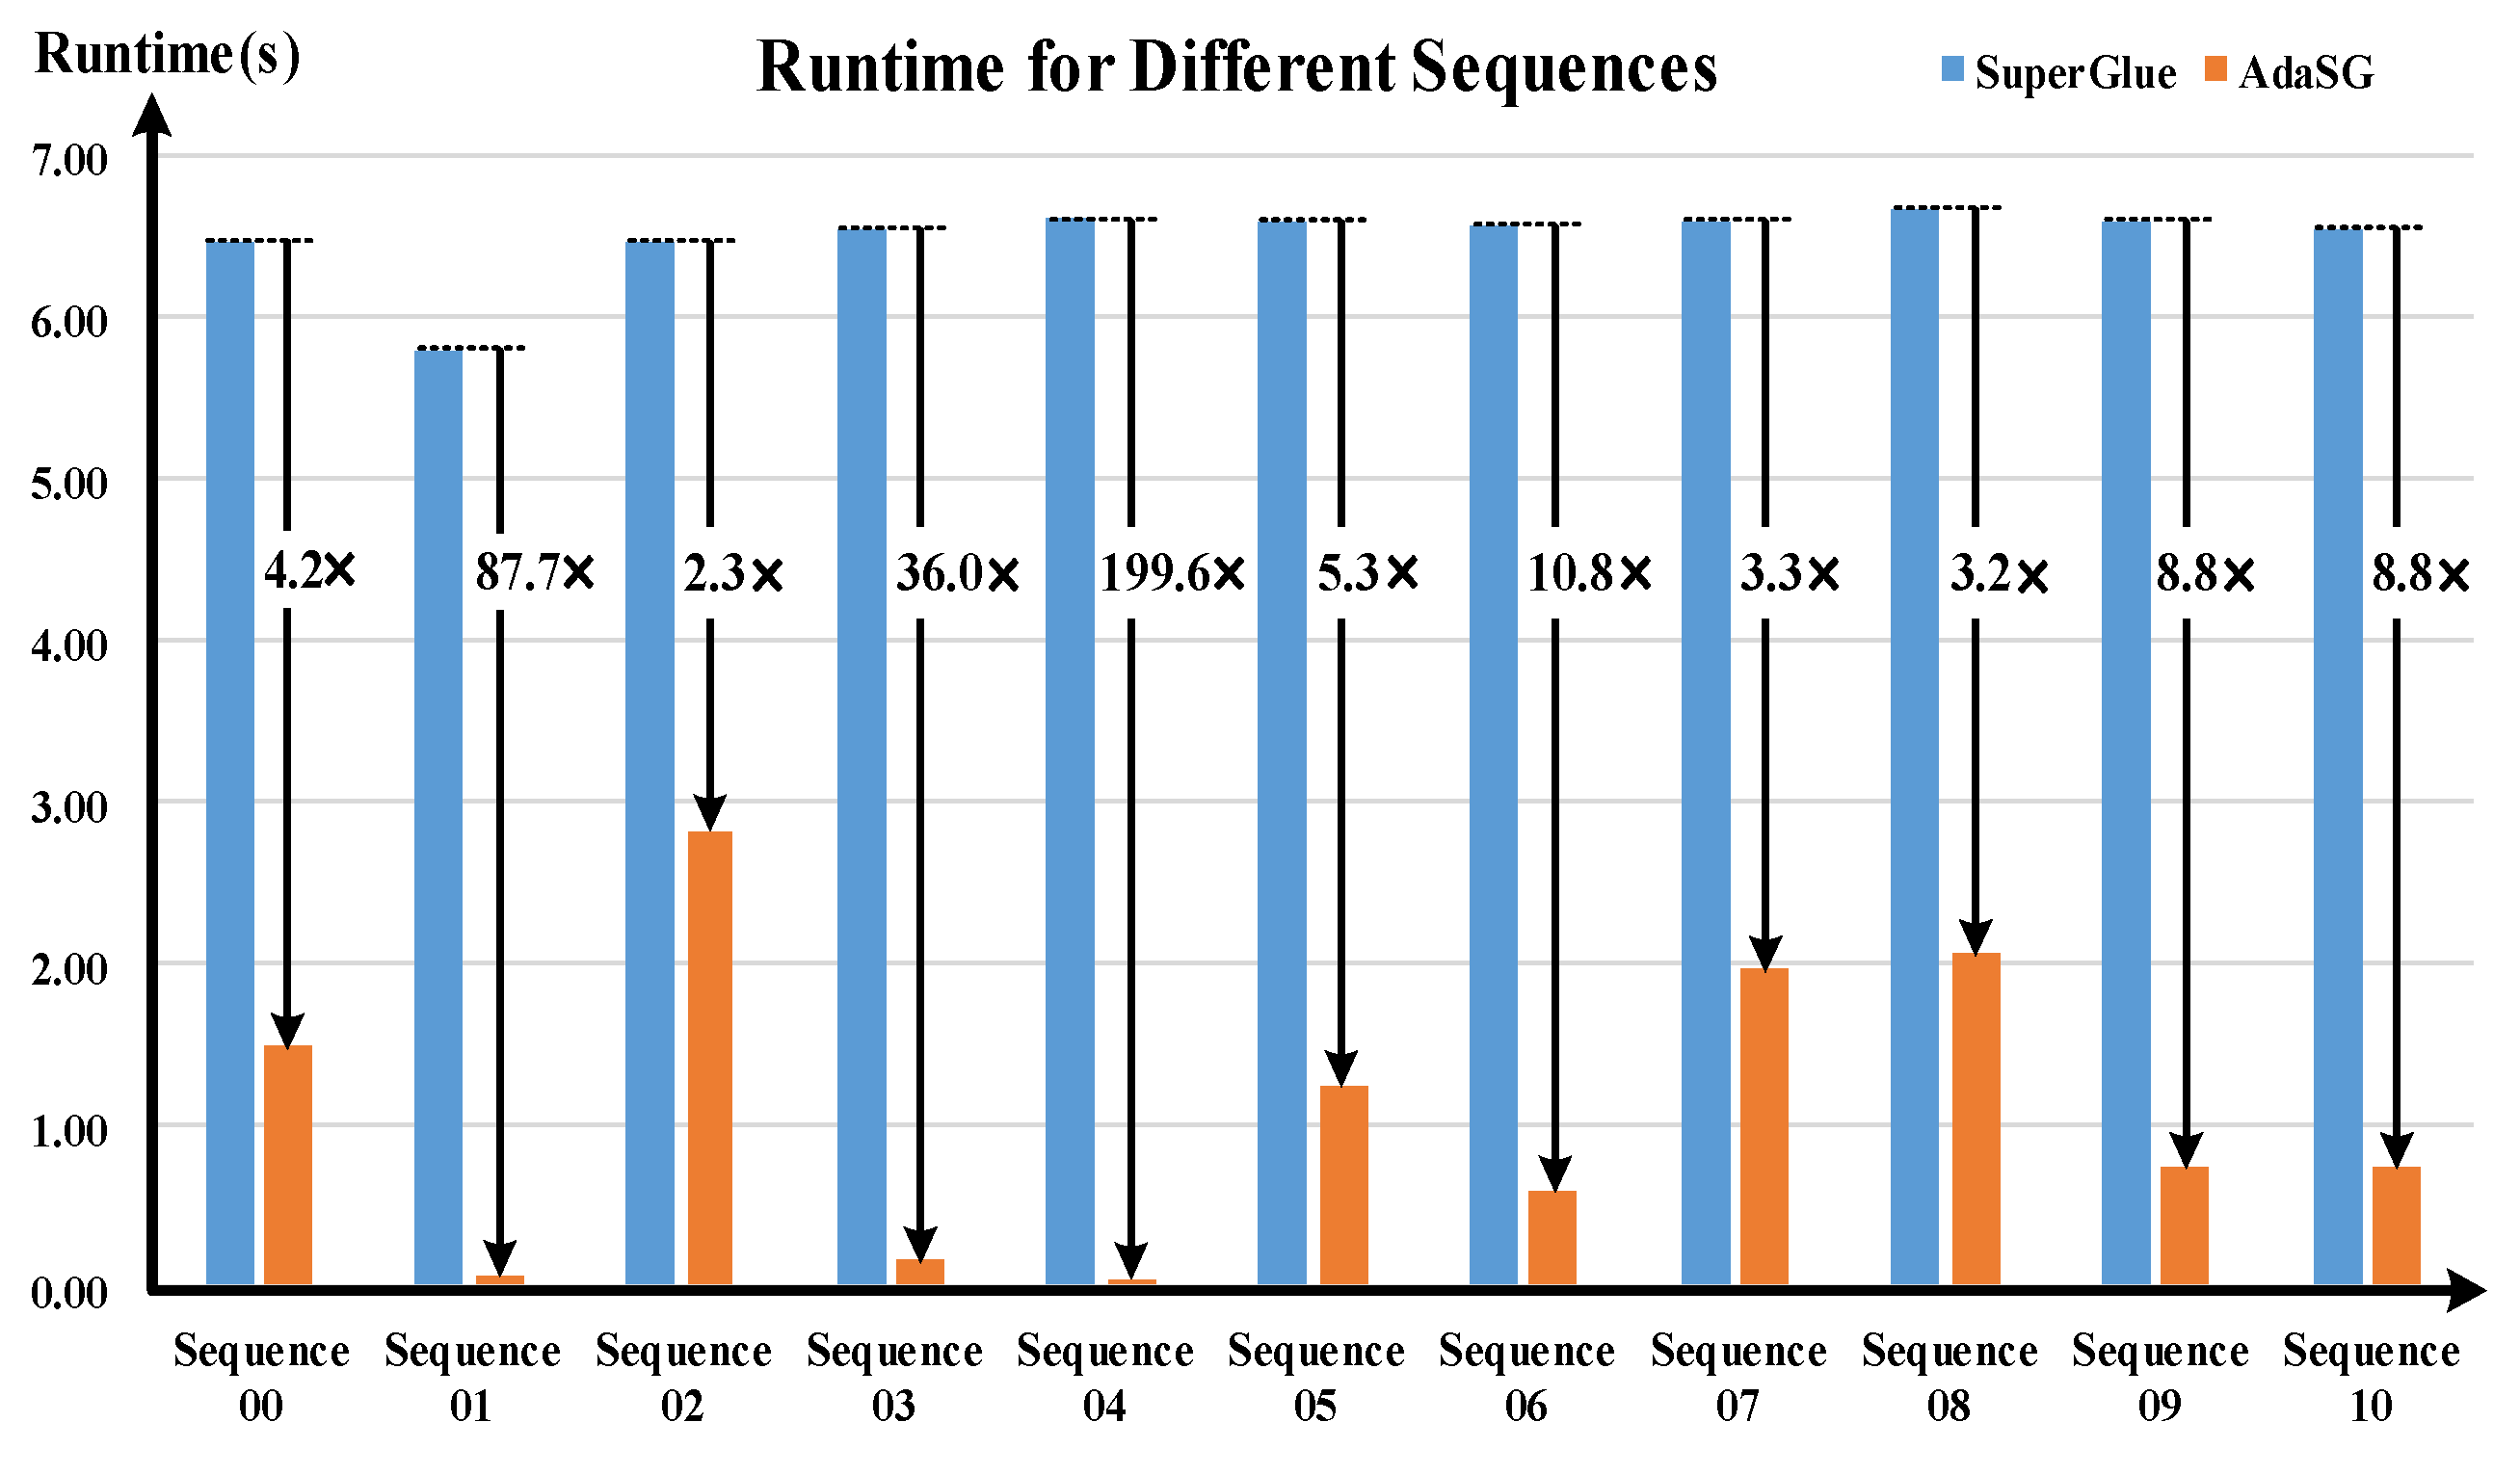
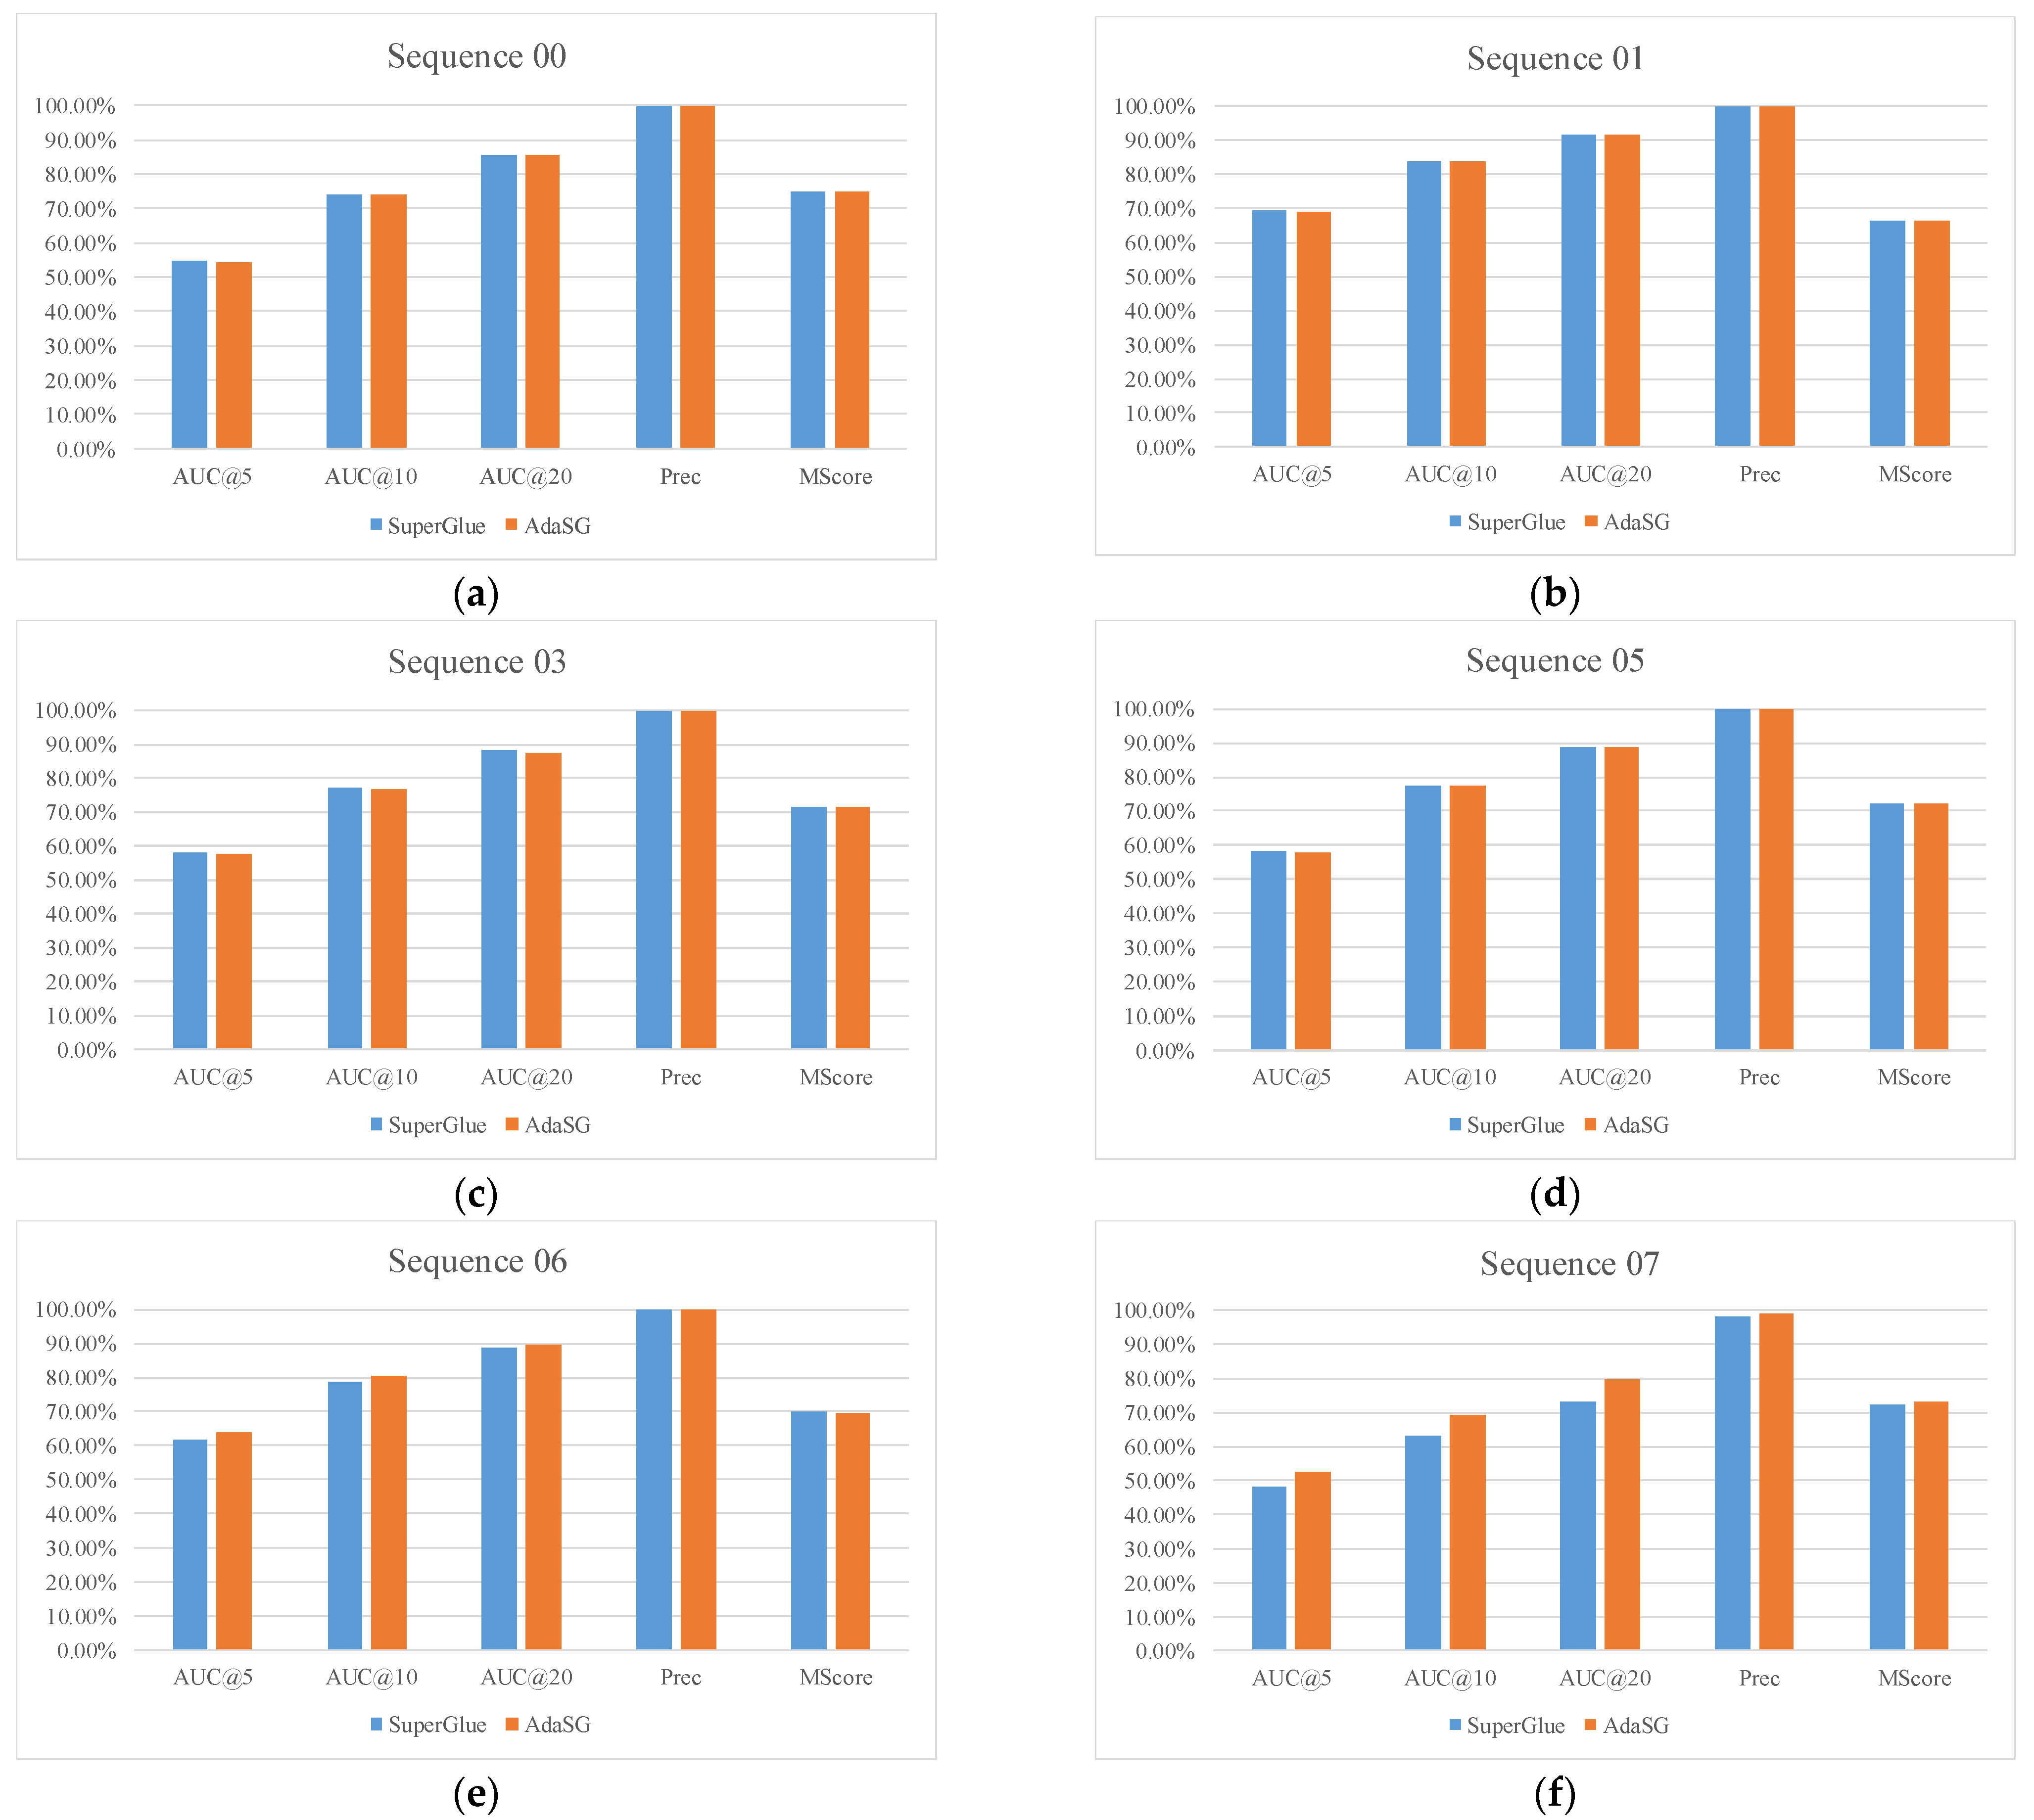
4.3. Outdoor Dataset Experimental Results
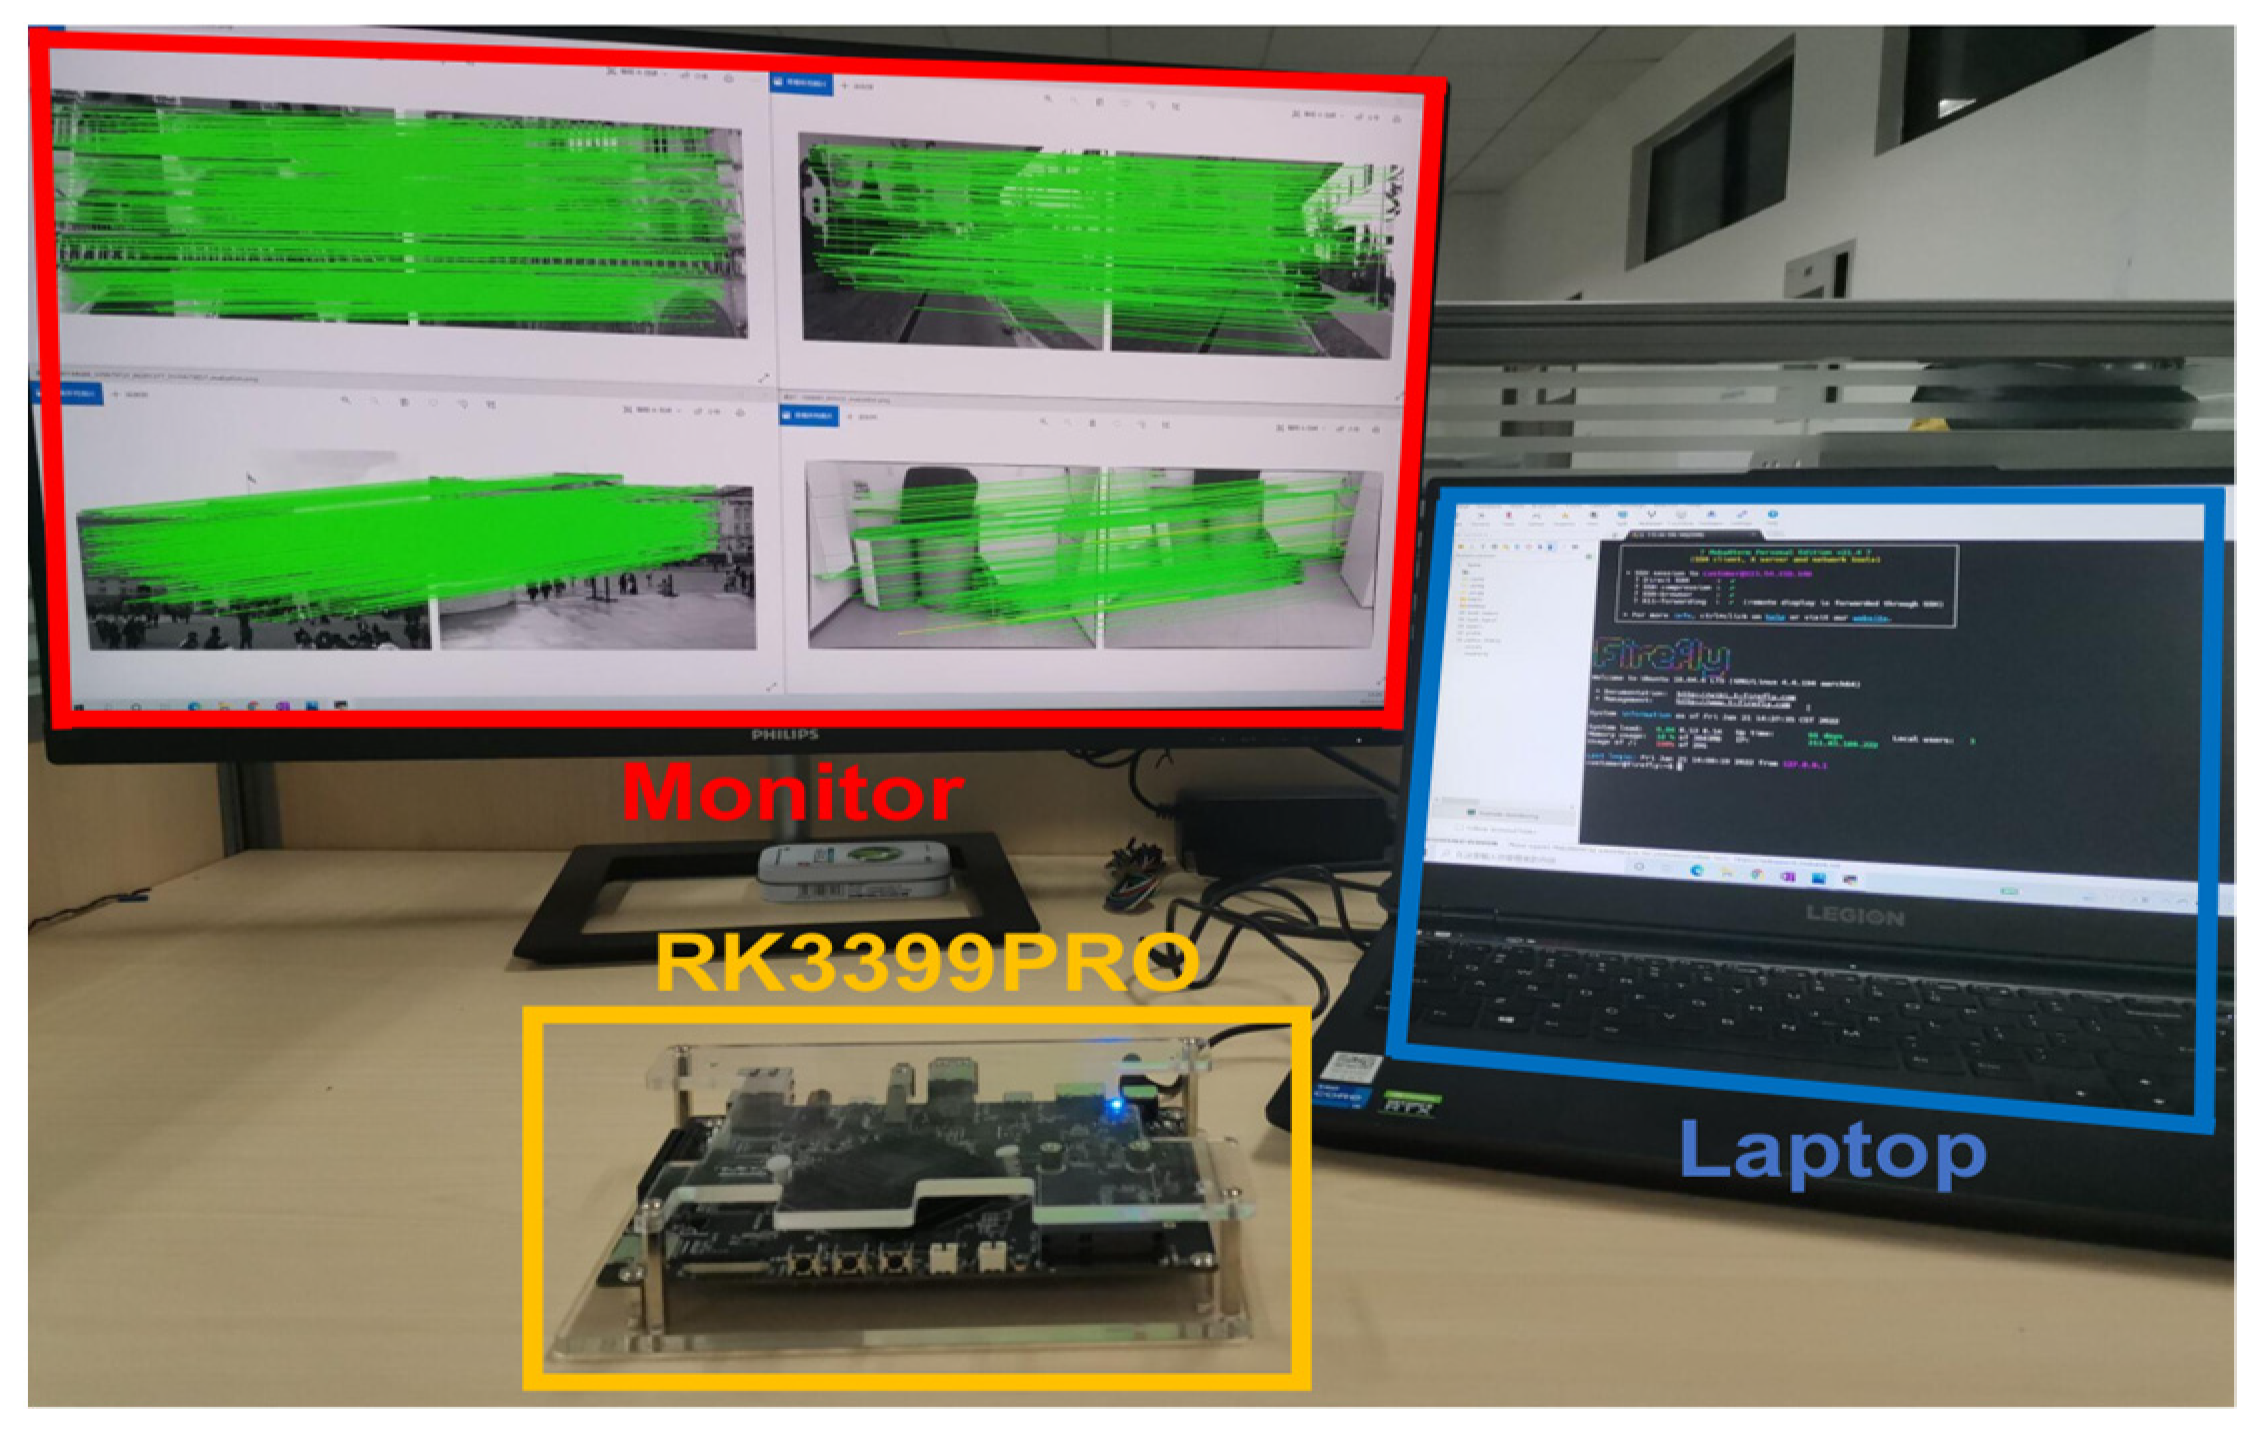
4.4. Experimental Results on Embedded System
5. Conclusions
Author Contributions
Funding
Institutional Review Board Statement
Informed Consent Statement
Conflicts of Interest
References
- Ma, J.; Jiang, X.; Fan, A.; Jiang, J.; Yan, J. Image matching from handcrafted to deep features: A survey. Int. J. Comput. Vis. 2021, 129, 23–79. [Google Scholar] [CrossRef]
- Wang, J.; Zhong, S.; Yan, L.; Cao, Z. An Embedded System-on-Chip Architecture for Real-time Visual Detection and Matching. IEEE Trans. Circuits Syst. Video Technol. 2014, 24, 525–538. [Google Scholar] [CrossRef]
- Cadena, C.; Carlone, L.; Carrillo, H.; Latif, Y.; Scaramuzza, D.; Neira, J.; Reid, I.; Leonard, J.J. Past, present, and future of simultaneous localization and mapping: Toward the robust-perception age. IEEE Trans. Robot. 2016, 32, 1309–1332. [Google Scholar] [CrossRef] [Green Version]
- Fuentes-Pacheco, J.; Ruiz-Ascencio, J.; Rendón-Mancha, J.M. Visual simultaneous localization and mapping: A survey. Artif. Intell. Rev. 2015, 43, 55–81. [Google Scholar] [CrossRef]
- Yuan, Z.; Song, X.; Bai, L.; Wang, Z.; Ouyang, W. Temporal-Channel Transformer for 3D Lidar-Based Video Object Detection for Autonomous Driving. IEEE Trans. Circuits Syst. Video Technol. 2022, 32, 2068–2078. [Google Scholar] [CrossRef]
- Tang, F.; Wu, Y.; Hou, X.; Ling, H. 3D Mapping and 6D Pose Computation for Real Time Augmented Reality on Cylindrical Objects. IEEE Trans. Circuits Syst. Video Technol. 2020, 30, 2887–2899. [Google Scholar] [CrossRef]
- Huang, Z.; Wei, Z.; Zhang, G. RWBD: Learning Robust Weighted Binary Descriptor for Image Matching. IEEE Trans. Circuits Syst. Video Technol. 2018, 28, 1553–1564. [Google Scholar] [CrossRef]
- Huang, F.; Huang, S.; Ker, J.; Chen, Y. High-Performance SIFT Hardware Accelerator for Real-Time Image Feature Extraction. IEEE Trans. Circuits Syst. Video Technol. 2012, 22, 340–351. [Google Scholar] [CrossRef]
- Yi, K.M.; Trulls, E.; Lepetit, V.; Fua, P. Lift: Learned invariant feature transform. In European Conference on Computer Vision; Springer: Berlin/Heidelberg, Germany, 2016; pp. 467–483. [Google Scholar]
- Pan, H.; Chen, Y.; He, Z.; Meng, F.; Fan, N. TCDesc: Learning Topology Consistent Descriptors for Image Matching. IEEE Trans. Circuits Syst. Video Technol. 2021, 32, 2845–2855. [Google Scholar] [CrossRef]
- Le, V.P.; De Tran, C. Key-point matching with post-filter using sift and brief in logo spotting. In Proceedings of the 2015 IEEE RIVF International Conference on Computing & Communication Technologies-Research, Innovation, and Vision for Future (RIVF), Can Tho, Vietnam, 25–28 January 2015; pp. 89–93. [Google Scholar]
- Lowe, D.G. Distinctive image features from scale-invariant keypoints. Int. J. Comput. Vis. 2004, 60, 91–110. [Google Scholar] [CrossRef]
- Tuytelaars, T.; van Gool, L. Wide baseline stereo matching based on local, affinely invariant regions. In Proceedings of the British Machine Conference, Bristol, UK, 11–14 September 2000; pp. 38.1–38.14. [Google Scholar]
- Cech, J.; Matas, J.; Perdoch, M. Efficient sequential correspondence selection by cosegmentation. IEEE Trans. Pattern Anal. Mach. Intell. 2010, 32, 1568–1581. [Google Scholar] [CrossRef] [PubMed] [Green Version]
- Zhu, H.; Jiao, L.; Ma, W.; Liu, F.; Zhao, W. A novel neural network for remote sensing image matching. IEEE Trans. Neural Netw. Learn. Syst. 2019, 30, 2853–2865. [Google Scholar] [CrossRef] [PubMed]
- Li, W.; Zhu, X.; Gong, S. Harmonious attention network for person re-identification. In Proceedings of the IEEE Conference on Computer Vision and Pattern Recognition (CVPR), Salt Lake City, UT, USA, 18–23 June 2018; pp. 2285–2294. [Google Scholar]
- Sarlin, P.-E.; DeTone, D.; Malisiewicz, T.; Rabinovich, A. Superglue: Learning feature matching with graph neural networks. In Proceedings of the IEEE/CVF Conference on Computer Vision and Pattern Recognition, Seattle, WA, USA, 13–19 June 2020; pp. 4938–4947. [Google Scholar]
- Vaswani, A.; Shazeer, N.; Parmar, N.; Uszkoreit, J.; Jones, L.; Gomez, A.N.; Kaiser, Ł.; Polosukhin, I. Attention is all you need. In Proceedings of the 31st International Conference on Neural Information Processing Systems, Long Beach, CA, USA, 4–9 December 2017; pp. 6000–6010. [Google Scholar]
- CVPR. CVPR 2020 Workshop on Image Matching: Local Features and Beyond. 10 February 2020. Available online: https://www.cs.ubc.ca/research/image-matching-challenge/2020/ (accessed on 9 November 2020).
- Howard, A.G.; Zhu, M.; Chen, B.; Kalenichenko, D.; Wang, W.; Weyand, T.; Andreetto, M.; Adam, H. Mobilenets: Efficient convolutional neural networks for mobile vision applications. arXiv 2017, arXiv:1704.04861. [Google Scholar]
- Zhou, Y.; Chen, S.; Wang, Y.; Huan, W. Review of research on lightweight convolutional neural networks. In Proceedings of the 2020 IEEE 5th Information Technology and Mechatronics Engineering Conference (ITOEC), Chongqing, China, 12–14 June 2020. [Google Scholar]
- Bouguettaya, A.; Kechida, A.; Taberkit, A.M. A survey on lightweight CNN-based object detection algorithms for platforms with limited computational resources. Int. J. Inform. Appl. Math. 2019, 2, 28–44. [Google Scholar]
- Nguyen, H.H.; Ho, B.H.; Lai, H.P.; Tran, H.T.; Le, H.T.; Banuls, A.-L.; Prudhomme, J. A Lightweight Keypoint Matching Framework for Morphometric Landmark Detection. Ecol. Inform. 2022, 70, 101694. [Google Scholar] [CrossRef]
- Mur-Artal, R.; Tardós, J.D. Orb-slam2: An open-source slam system for monocular, stereo, and rgb-d cameras. IEEE Trans. Robot. 2017, 33, 1255–1262. [Google Scholar] [CrossRef] [Green Version]
- Danielsson, P.-E. Euclidean distance mapping. Comput. Graph. Image Process. 1980, 14, 227–248. [Google Scholar] [CrossRef] [Green Version]
- Winograd, S. A new algorithm for inner product. IEEE Trans. Comput. 1968, 100, 693–694. [Google Scholar] [CrossRef]
- Rublee, E.; Rabaud, V.; Konolige, K.; Bradski, G. ORB: An efficient alternative to SIFT or SURF. In Proceedings of the 2011 International Conference on Computer Vision, Barcelona, Spain, 6–13 November 2011; pp. 2564–2571. [Google Scholar]
- Mishchuk, A.; Mishkin, D.; Radenovic, F.; Matas, J. Working hard to know your neighbor’s margins: Local descriptor learning loss. arXiv 2017, arXiv:1705.10872. [Google Scholar]
- Shen, X.; Wang, C.; Li, X.; Yu, Z.; Li, J.; Wen, C.; Cheng, M.; He, Z. Rf-net: An end-to-end image matching network based on receptive field. In Proceedings of the IEEE/CVF Conference on Computer Vision and Pattern Recognition, Long Beach, CA, USA, 15–20 June 2019; pp. 8132–8140. [Google Scholar]
- Christiansen, P.H.; Kragh, M.F.; Brodskiy, Y.; Karstoft, H. Unsuperpoint: End-to-end unsupervised interest point detector and descriptor. arXiv 2019, arXiv:1907.04011. [Google Scholar]
- Ono, Y.; Trulls, E.; Fua, P.; Yi, K.M. LF-Net: Learning local features from images. In Proceedings of the 32nd International Conference on Neural Information Processing Systems, Montréal, QC, Canada, 3–8 December 2018; pp. 6237–6247. [Google Scholar]
- DeTone, D.; Malisiewicz, T.; Rabinovich, A. Superpoint: Self-supervised interest point detection and description. In Proceedings of the IEEE Conference on Computer Vision and Pattern Recognition Workshops, Salt Lake City, UT, USA, 18–22 June 2018; pp. 224–236. [Google Scholar]
- Dusmanu, M.; Rocco, I.; Pajdla, T.; Pollefeys, M.; Sivic, J.; Torii, A.; Sattler, T. D2-Net: A Trainable CNN for Joint Detection and Description of Local Features. In Proceedings of the CVPR 2019-IEEE Conference on Computer Vision and Pattern Recognition, Long Beach, CA, USA, 15–20 June 2019. [Google Scholar]
- Revaud, J.; Weinzaepfel, P.; de Souza, C.; Pion, N.; Csurka, G.; Cabon, Y.; Humenberger, M. R2D2: Repeatable and reliable detector and descriptor. arXiv 2019, arXiv:1906.06195. [Google Scholar]
- Luo, Z.; Shen, T.; Zhou, L.; Zhang, J.; Yao, Y.; Li, S.; Fang, T.; Quan, L. Contextdesc: Local descriptor augmentation with cross-modality context. In Proceedings of the IEEE/CVF Conference on Computer Vision and Pattern Recognition, Long Beach, CA, USA, 15–20 June 2019; pp. 2527–2536. [Google Scholar]
- Ebel, P.; Mishchuk, A.; Yi, K.M.; Fua, P.; Trulls, E. Beyond cartesian representations for local descriptors. In Proceedings of the IEEE/CVF International Conference on Computer Vision, Seoul, Korea, 27 October–2 November 2019; pp. 253–262. [Google Scholar]
- Qi, C.R.; Su, H.; Mo, K.; Guibas, L.J. Pointnet: Deep learning on point sets for 3d classification and segmentation. In Proceedings of the IEEE Conference on Computer Vision and Pattern Recognition, Honolulu, HI, USA, 21–26 July 2017; pp. 652–660. [Google Scholar]
- Yi, K.M.; Trulls, E.; Ono, Y.; Lepetit, V.; Salzmann, M.; Fua, P. Learning to find good correspondences. In Proceedings of the IEEE Conference on Computer Vision and Pattern Recognition, Salt Lake City, UT, USA, 18–23 June 2018; pp. 2666–2674. [Google Scholar]
- Zhang, J.; Sun, D.; Luo, Z.; Yao, A.; Zhou, L.; Shen, T.; Chen, Y.; Quan, L.; Liao, H. Learning two-view correspondences and geometry using order-aware network. In Proceedings of the IEEE/CVF International Conference on Computer Vision, Seoul, Korea, 27 October–2 November 2019; pp. 5845–5854. [Google Scholar]
- Dai, A.; Chang, A.X.; Savva, M.; Halber, M.; Funkhouser, T.; Nießner, M. ScanNet: Richly-Annotated 3D Reconstructions of Indoor Scenes. In Proceedings of the IEEE Conference on Computer Vision and Pattern Recognition (CVPR), Honolulu, HI, USA, 21–26 July 2017; pp. 2432–2443. [Google Scholar]
- Thomee, B.; Shamma, D.A.; Friedland, G.; Elizalde, B.; Nj, K.; Poland, D.; Borth, D.; Li, L.-J. YFCC100M: The new data in multimedia research. Commun. ACM 2016, 59, 64–73. [Google Scholar] [CrossRef]
- Geiger, A.; Lenz, P.; Stiller, C.; Urtasun, R. Vision meets robotics: The kitti dataset. Int. J. Robot. Res. 2013, 32, 1231–1237. [Google Scholar] [CrossRef] [Green Version]
- Shi, Y.; Cai, J.; Shavit, Y.; Mu, T.; Feng, W.; Zhang, K. ClusterGNN: Cluster-based Coarse-to-Fine Graph Neural Network for Efficient Feature Matching. In Proceedings of the IEEE/CVF Conference on Computer Vision and Pattern Recognition, New Orleans, LA, USA, 21–24 June 2022. [Google Scholar]
- RockChip. RK3399Pro. December 2018. Available online: https://rockchip.fr/RK3399Pro%20datasheet%20V1.1.pdf (accessed on 23 March 2022).


| Method | Parameters |
|---|---|
| SuperGlue | 12.1 M |
| AdaSG (E-mode) | 0 |
| AdaSG (D-mode) | 12.1 M |
| Matcher | AUC (%) | P (%) | MS (%) | Average Runtime (s) | ||
|---|---|---|---|---|---|---|
| @5° | @10° | @20° | ||||
| OANet | 0.15 | 0.71 | 2.35 | 96.28 | 44.56 | 0.016 |
| PointCN | 0.28 | 0.64 | 2.18 | 97.38 | 41.67 | 0.006 |
| SuperGlue | 0.37 | 1.36 | 4.82 | 96.62 | 76.30 | 0.043 |
| AdaSG | 0.38 | 1.38 | 4.79 | 96.48 | 75.59 | 0.001 |
| Matcher | AUC (%) | P (%) | MS (%) | Average Runtime (s) | ||
|---|---|---|---|---|---|---|
| @5° | @10° | @20° | ||||
| OANet | 23.92 | 41.47 | 58.65 | 84.24 | 15.58 | 0.021 |
| PointCN | 22.04 | 38.54 | 55.67 | 73.13 | 17.06 | 0.004 |
| SuperGlue | 37.94 | 58.3 | 74.59 | 97.74 | 23.00 | 0.092 |
| ClusterGNN | 35.31 | 56.13 | 73.56 | N/A | N/A | N/A |
| AdaSG | 37.90 | 58.23 | 74.52 | 97.64 | 22.91 | 0.088 |
| Matcher | AUC (%) | P (%) | MS (%) | Average Runtime (s) | ||
|---|---|---|---|---|---|---|
| @5° | @10° | @20° | ||||
| OANet | 49.83 | 68.32 | 80.32 | 99.30 | 45.88 | 0.010 |
| PointCN | 38.58 | 68.32 | 80.32 | 99.70 | 38.59 | 0.003 |
| SuperGlue | 61.75 | 78.60 | 88.20 | 99.79 | 69.09 | 0.041 |
| AdaSG | 61.83 | 78.56 | 88.12 | 99.75 | 69.05 | 0.007 |
Publisher’s Note: MDPI stays neutral with regard to jurisdictional claims in published maps and institutional affiliations. |
© 2022 by the authors. Licensee MDPI, Basel, Switzerland. This article is an open access article distributed under the terms and conditions of the Creative Commons Attribution (CC BY) license (https://creativecommons.org/licenses/by/4.0/).
Share and Cite
Liu, Y.; Huang, K.; Li, J.; Li, X.; Zeng, Z.; Chang, L.; Zhou, J. AdaSG: A Lightweight Feature Point Matching Method Using Adaptive Descriptor with GNN for VSLAM. Sensors 2022, 22, 5992. https://doi.org/10.3390/s22165992
Liu Y, Huang K, Li J, Li X, Zeng Z, Chang L, Zhou J. AdaSG: A Lightweight Feature Point Matching Method Using Adaptive Descriptor with GNN for VSLAM. Sensors. 2022; 22(16):5992. https://doi.org/10.3390/s22165992
Chicago/Turabian StyleLiu, Ye, Kun Huang, Jingyuan Li, Xiangting Li, Zeng Zeng, Liang Chang, and Jun Zhou. 2022. "AdaSG: A Lightweight Feature Point Matching Method Using Adaptive Descriptor with GNN for VSLAM" Sensors 22, no. 16: 5992. https://doi.org/10.3390/s22165992
APA StyleLiu, Y., Huang, K., Li, J., Li, X., Zeng, Z., Chang, L., & Zhou, J. (2022). AdaSG: A Lightweight Feature Point Matching Method Using Adaptive Descriptor with GNN for VSLAM. Sensors, 22(16), 5992. https://doi.org/10.3390/s22165992