Skip Content
You are currently on the new version of our website. Access the old version .
SensorsSensors
  • Article
  • Open Access

21 July 2022

Digital Twin-Based Integrated Monitoring System: Korean Application Cases

,
,
and
1
R&D Research Center, IGI Korea, Seoul 08376, Korea
2
IT Converged Process R&D Group, Korea Institute of Industrial Technology, Ansan-si 15588, Korea
3
Department of Mechanical System Design Engineering, Seoul National University of Science and Technology, Seoul 01811, Korea
*
Author to whom correspondence should be addressed.
This article belongs to the Section Sensors and Robotics

Abstract

A digital twin is a virtual model of a process, product, or service, which is one of the key technologies in the fourth industry. The pairing of the virtual and physical world allows analysis of data and monitoring of systems to head off problems before they occur. This paper presents a digital twin architecture and a system based on an interoperable data model. It explains how to build a digital twin for the integrated control monitoring using edge devices, data analytics, and realistic 3D visualization. The system allows continuous collaboration between field engineers for data gathering, designers for modeling 3D models, and layout engineers for layout changing by generating 3D digital twin models automatically. The system helps stakeholders focus on their respective roles to build digital twins. Examples applied to the Korean automotive parts makers are also introduced in this paper. The system can be easily used by small and medium-sized enterprises (SMEs) as well as large companies. Beyond simply watching the production site with CCTV, the production site can be intuitively managed based on the digital twin.

1. Introduction

With the advent of the fourth industrial revolution, smart factories are built based on cutting-edge information and communication technologies (ICT) such as cloud technology, data analytics using artificial intelligence (AI), internet of things (IoT), and additive manufacturing [1]. Cyber-physical systems (CPS), the core element of a smart factory, is based on end-to-end integration using ICT from procurement, production, marketing, distribution logistics, to services [2,3]. Digital twin is a technology that can predict results by simulating situations with computers. [4]. When digital twins are applied to manufacturing companies, it is reported that process operation costs are reduced by 10–15% and machine maintenance costs are reduced by 15–20% [5]. In addition, it is predicted that digital twins will be applied at a rate of 50% or more when projects are undertaken by large companies in 2021 [5].
It is practically impossible to build an existing factory into an ideal digital twin within a short period of time. It is necessary to build a digital twin according to the real situation step by step. In order to build a digital twin, it is necessary to establish an IT infrastructure that enables real-time data collection in the manufacturing environment. Three-dimensional digital models identical to the field are developed. This digital model and field data are connected so that the current status is monitored in real time. Analytical technologies such as AI and simulation are applied to predict the future. The analyzed results are reviewed by various stakeholders. Decision making is applied in the field. While large corporations announce many best practices for digital twins, small and medium sized enterprises (SMEs) have technical, budget, and human resource hurdles. SMEs are also required to develop a methodology and system to build a digital twin.
This paper explains a digital twin architecture, a developed system based on an interoperable data model, and case studies of building an integrated monitoring system based on digital twins using edge devices, data analysis, and realistic 3D visualization. The structure of this paper is as follows. Section 2 examines preliminary studies on digital twins and the technical requirements required to build digital twins SMEs. Section 3 describes a digital twin architecture, data model, and developed system functions. Section 4 introduces the implementation cases of a Korean auto parts company, and Section 5 discusses the conclusions and future research.

3. Digital Twin-Based Integrated Monitoring System

As mentioned above, the digital twin is built and utilized in: (1) digital model building, (2) real-time field data connection, (3) monitoring and analysis, (4) stakeholder decision making, and (5) field application procedure. Most SMEs have domain knowledge, but they are weak in the IT technologies area related to the 4th industry [1]. In this study, in order to increase the understanding of digital twin building of SMEs, the tasks and technologies of each layer are separately explained based on a digital twin architecture. In addition, by developing a digital twin solution for SMEs, the technology and tasks of each layer were integrated.

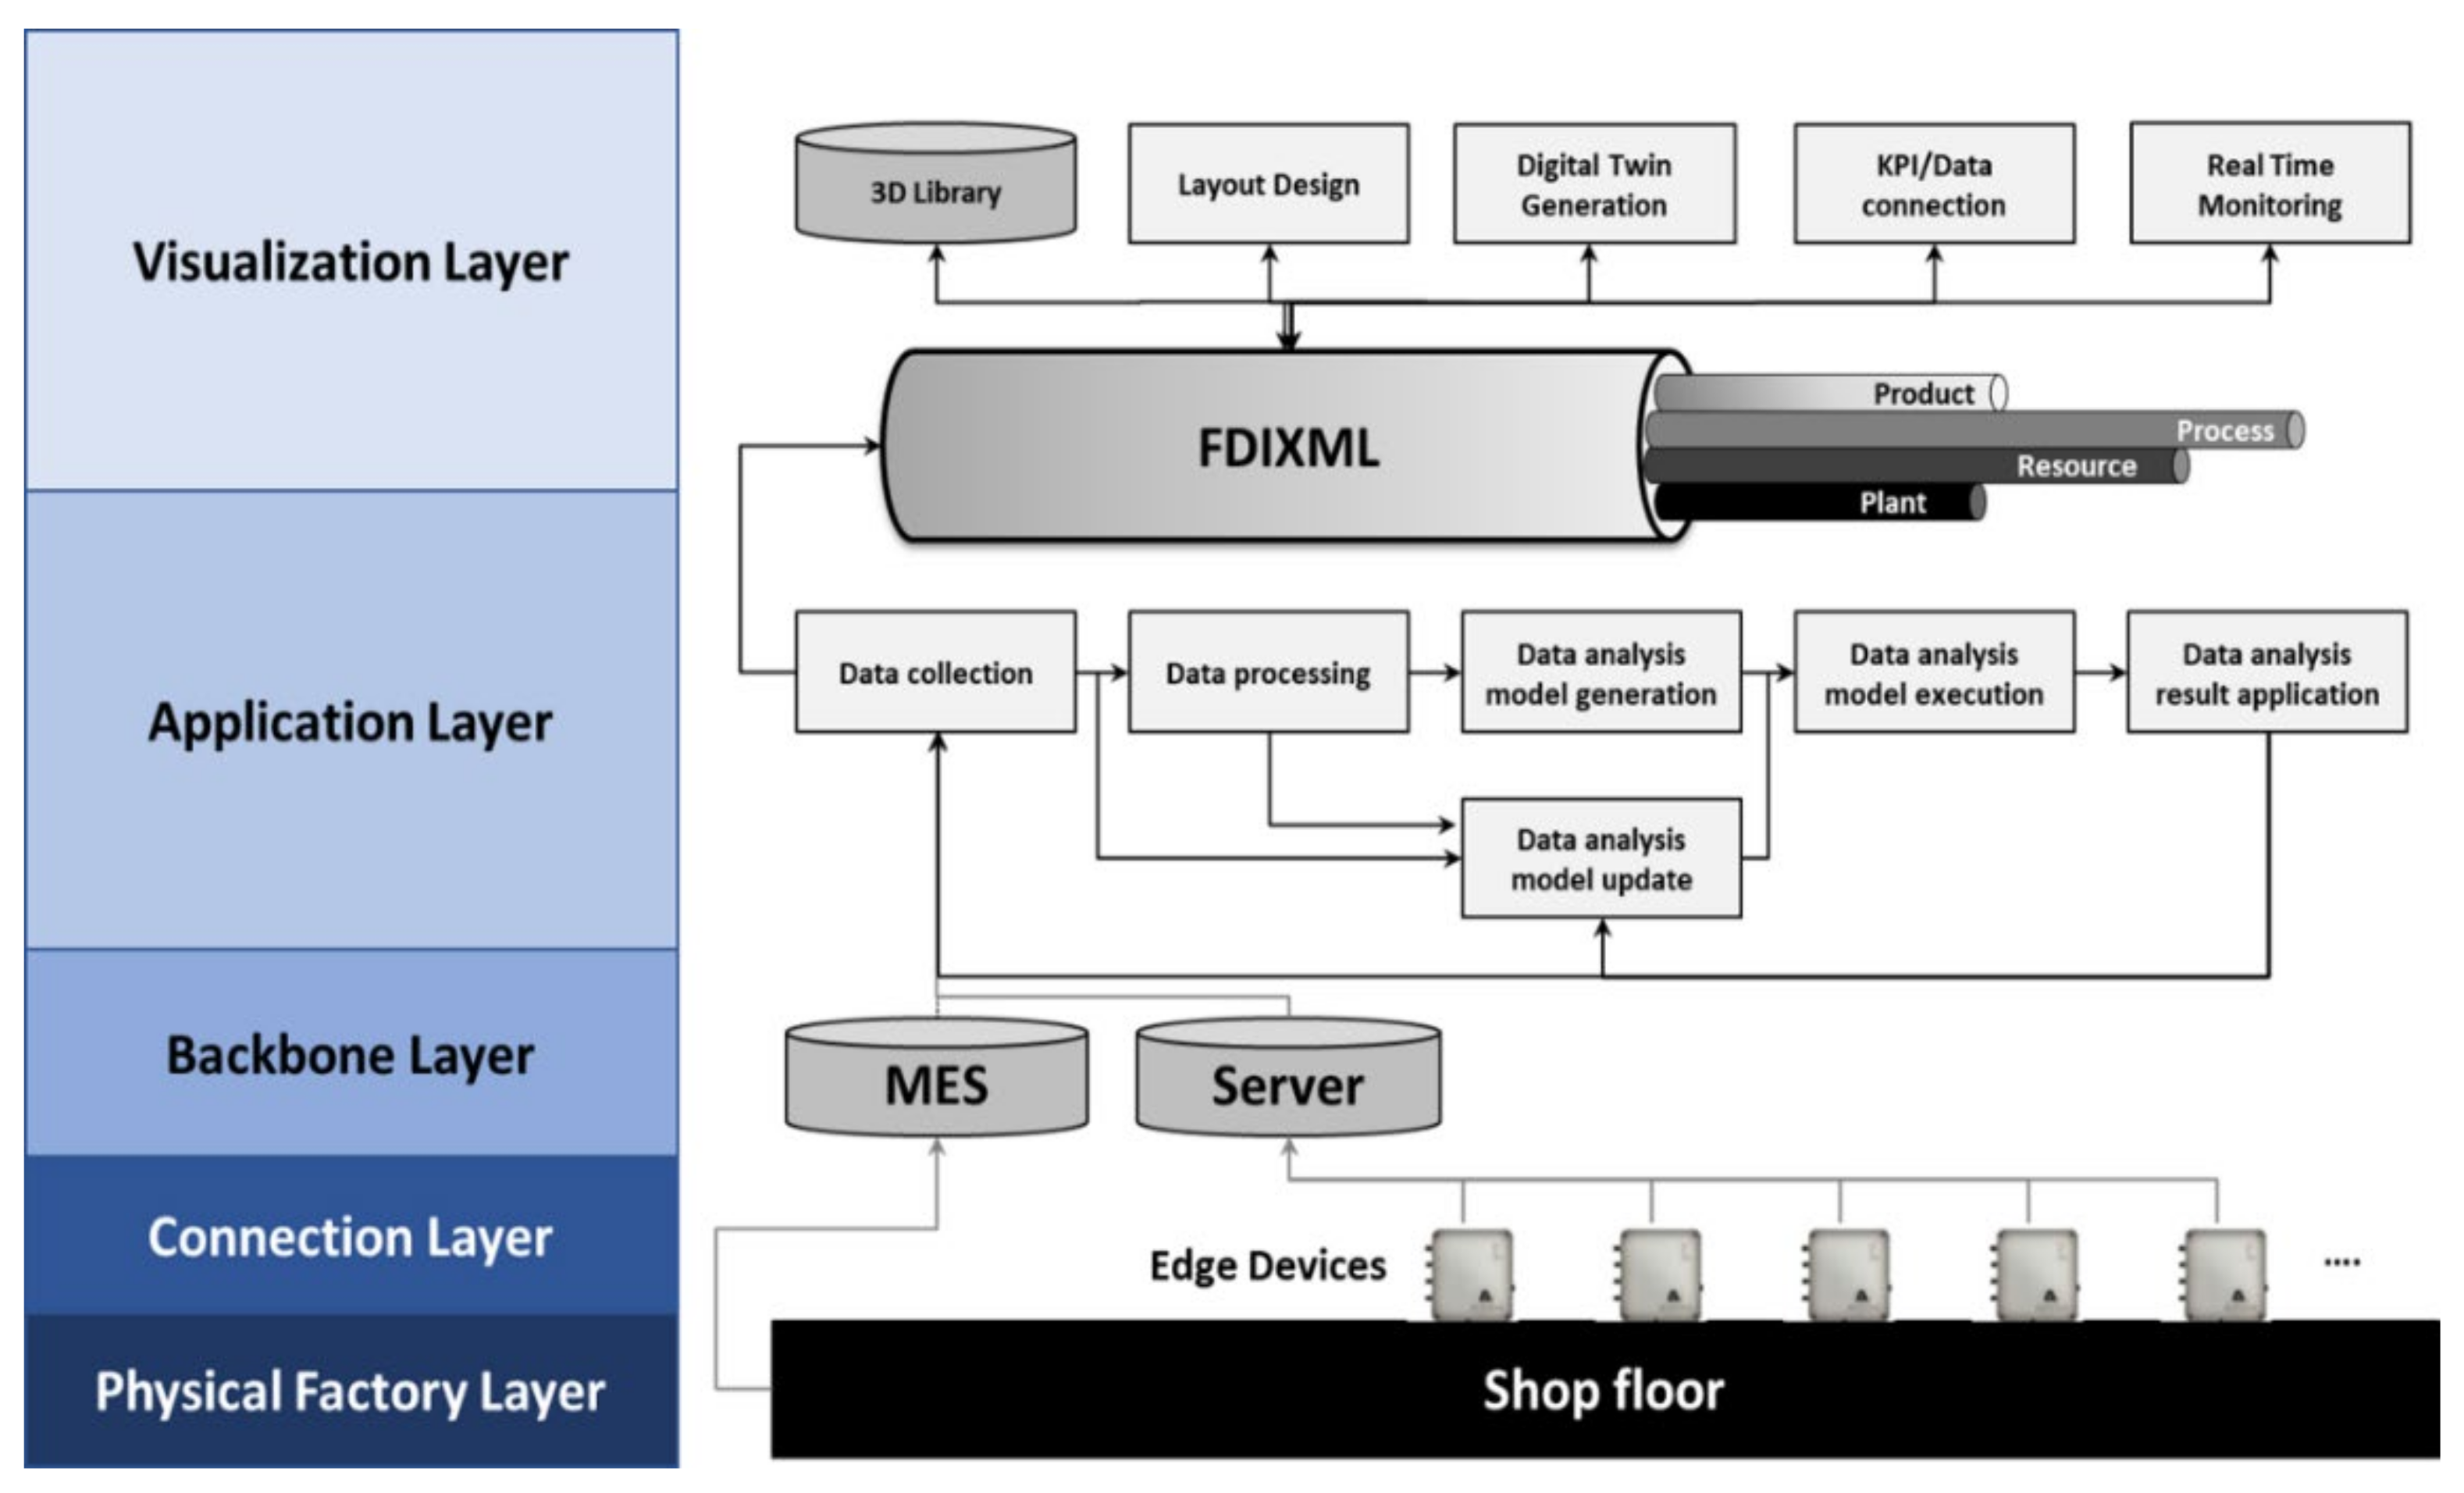
3.1. System Architecture
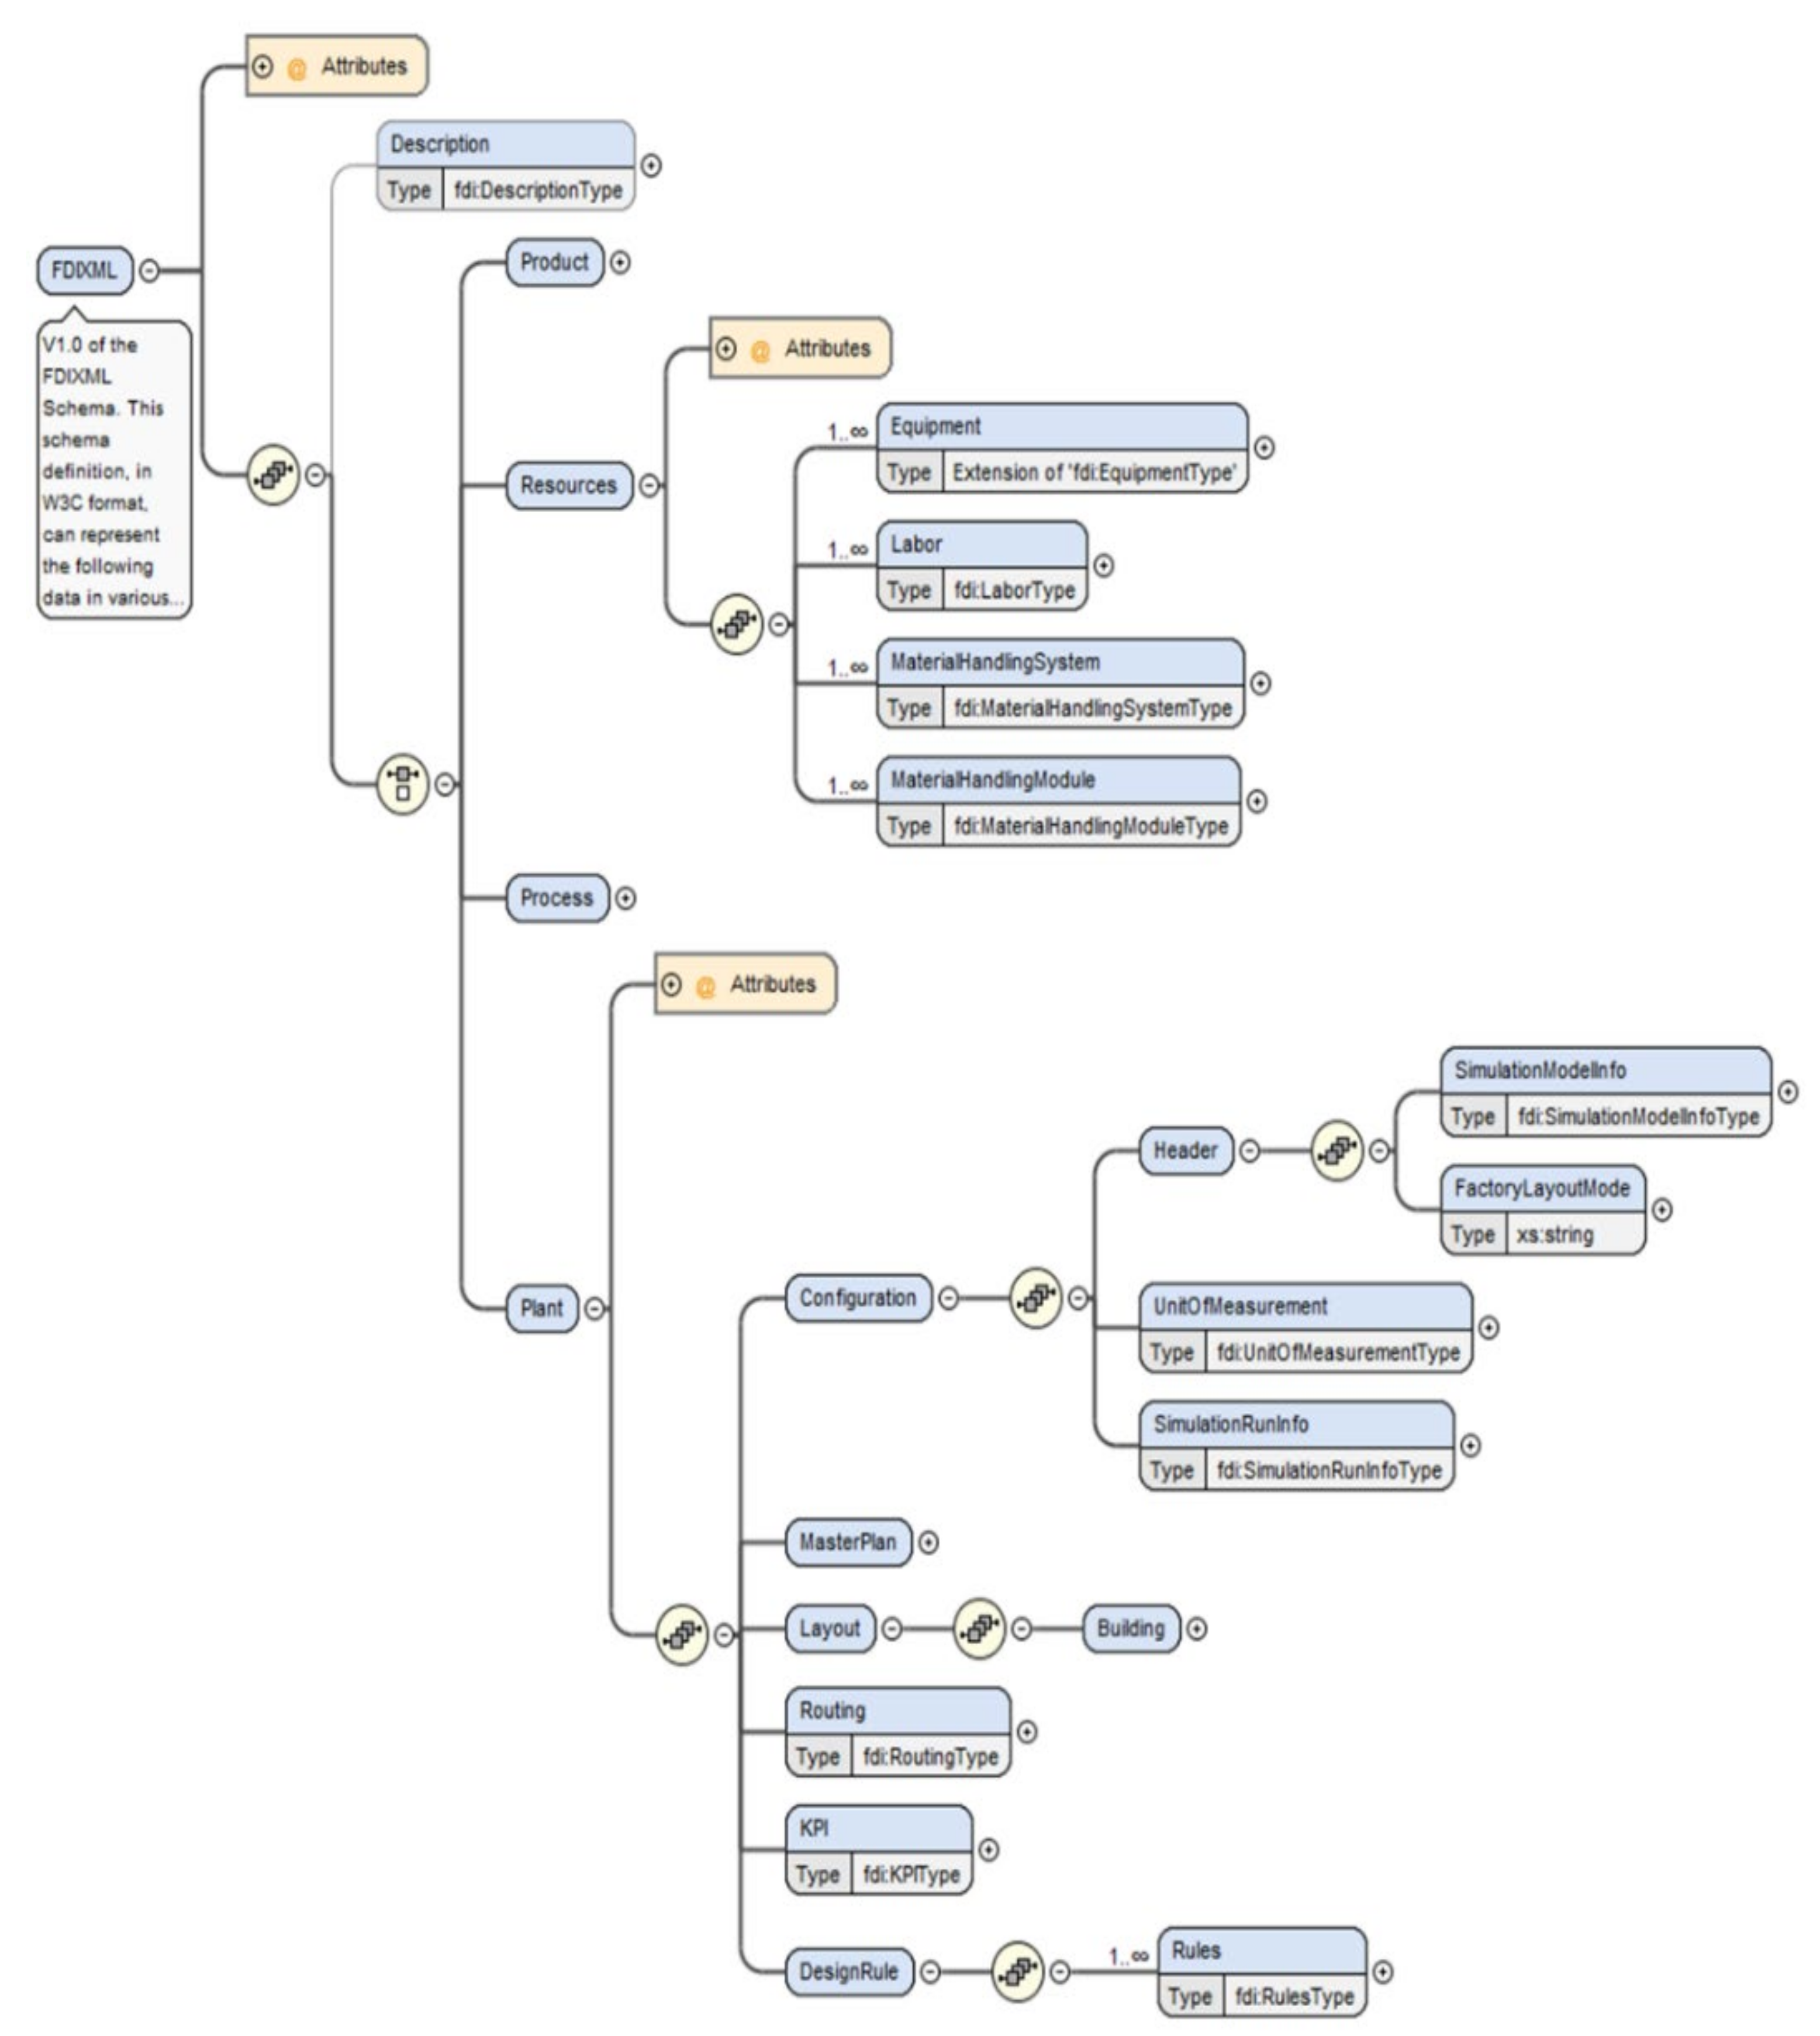
As shown in Figure 1, the system is composed of five layers. The physical factory layer is a physical area that consists of machines, material handling systems, and labors including sensors and actuators. The connector layer is an area where edge devices are distributed, and data are collected from the physical factory layer. This layer also includes data collection based on standards such as OPC-UA and MTConnect. The backbone layer is where the MES or IoT platform is located and is responsible for storing and managing big data. The application layer is a part that performs analysis based on big data where analysis applications such as machine learning, deep learning, and simulation are located. The visualization layer includes all data connections with the MES or IoT platform, authoring tools for factory modeling, web/mobile visualization, and VR/AR functions, and an integrated data model for this is located in this layer. The physical factory layer, the connection layer, and the backbone layer are areas where physical elements and systems are set up to make help from experts inevitable. However, the application and visualization layer should be built easily and conveniently so that even users of SMEs can use it. For this, the system must be developed easily and user-friendly based on an integrated data model.
Figure 1. Overall architecture.

3.2. Data Model

As mentioned earlier, the integrated monitoring system must simultaneously support various environments such as cloud, web, and mobile, acquired data from heterogeneous legacy systems from time to time, and support interfaces with various software such as analysis tools. International standards exist for each domain area [32] (e.g., MES, PLM, VR, etc.), but they are not commonly used in the real field except STEP. For flexible integration, it is necessary to develop a data model to build digital twins connecting heterogeneous systems. The data model introduced in this paper was defined based on the FDI reference model developed by the NIST to improve the smart factory design. The FDI reference model is based on the business process related to the factory/manufacturing line/process/machine of a global manufacturing company and is composed of 4 activities and 28 tasks as shown in Figure 2 and is modelled as IDEF0 [33].
Figure 2. Factory design and improvement (FDI) reference activity model.
By analyzing the input and output of these activities and tasks, and XML data schema was designed as shown in Figure 3 [34]. Table 1 summarizes the physical elements constituting the factory such as machines, material handling systems, and labors, and logical elements such as process areas, routing, and rules. Each element has its own data type.
Figure 3. FDI data model schema.
Table 1. Element of FDI data model.
As shown in Figure 3, this schema is a final form in which P3R (Product, Process, Resource, and Plant) data are logically organized based on plant information. Processes are arranged on the layout of the factory, and machines, labors, material handling systems, and material handling modules are configured within or between processes. Through the routing of each process, the final product is produced.

3.3. System Functions

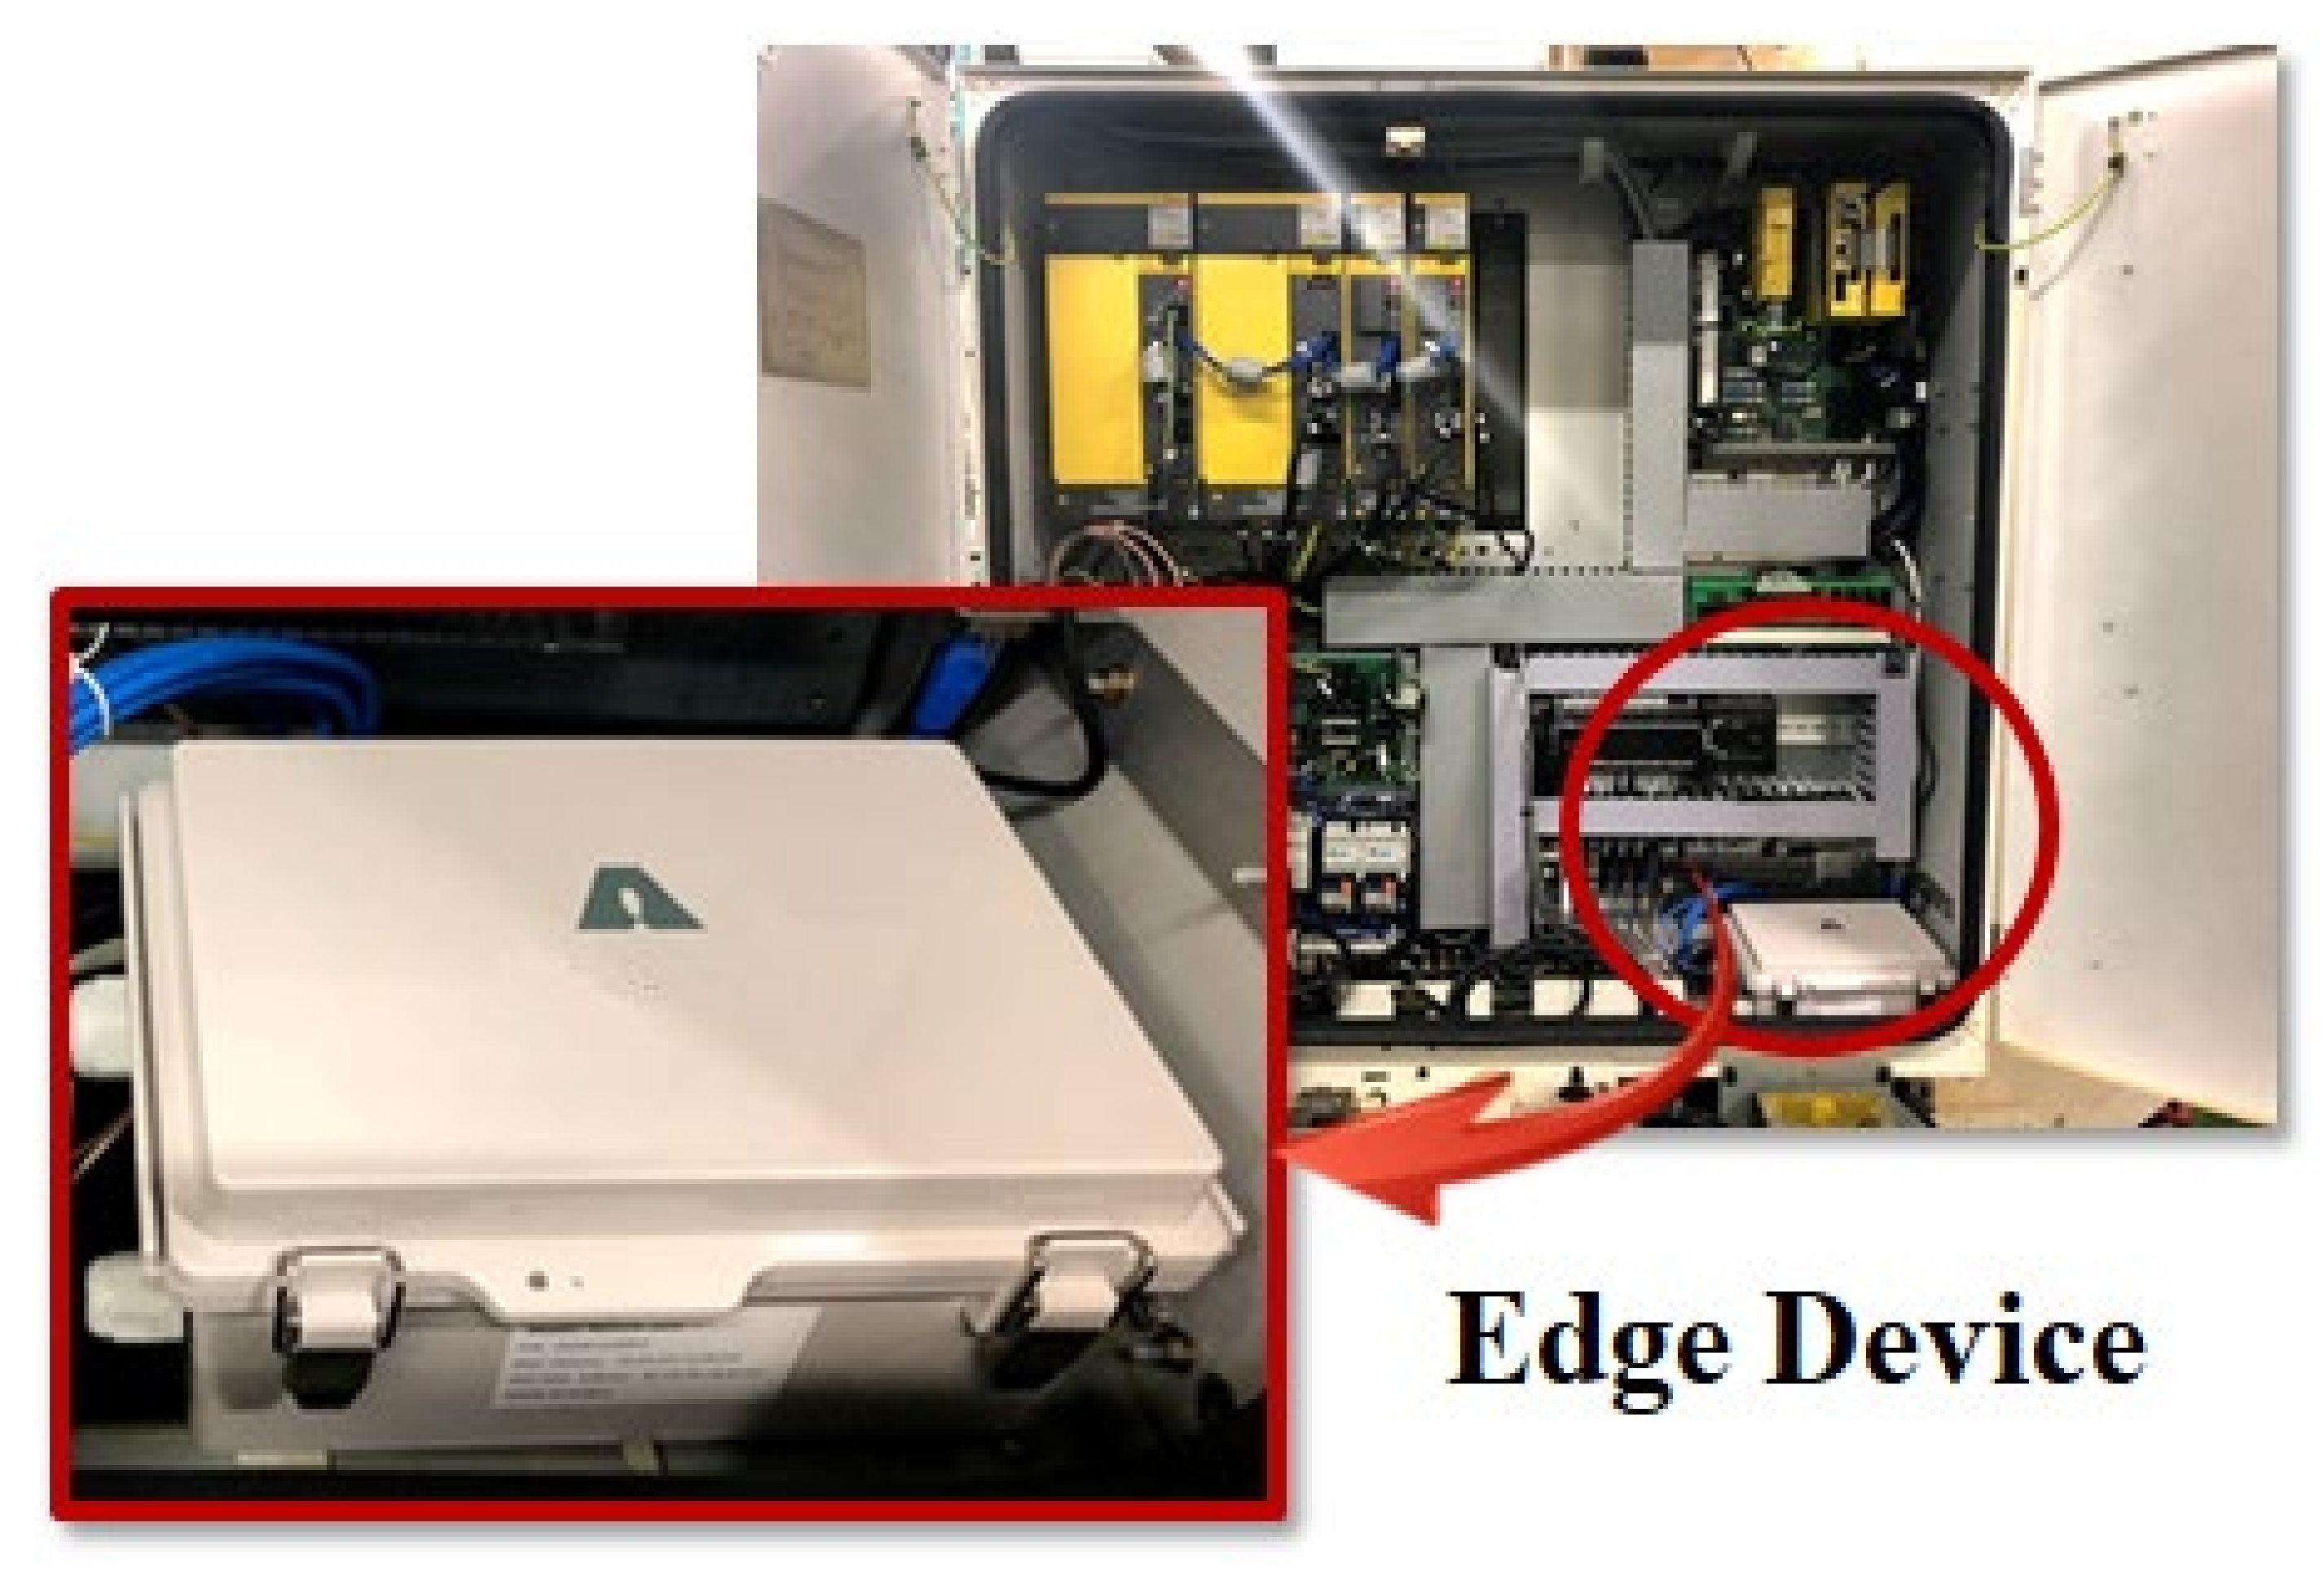
3.3.1. Connection and Backbone Layer

The manufacturing company controls the work site based on the MES system. According to MESA [35], MES consists of 11 functions: Resource Allocation Status, Operation/Detail Scheduling, Dispatching Production Units, Document Control, Data Collection/Acquisition, Labor Management, Quality Management, Process Control, Maintenance Management, Product Tracking and Genealogy, and Performance Analysis. These functions are applied in combination according to the size and environment of the enterprise. Despite the establishment of the MES, issues related to data collection and processing at the manufacturing site often arise. Recently, edge devices are being used for passive data collection and efficient processing of large data transmission. By establishing a wireless network-based data transmission environment, it is possible to automatically collect real-time data such as cycle time, production quantity, temperature, humidity, and vibration of the factory. Data collected from edge devices is stored and managed on its own server.

3.3.2. Application Layer

A data analysis module is equipped in the application layer. A typical data analysis process consists of data collection, data preprocessing, data analysis model creation, data analysis model execution, and data analysis model update. In this study, as shown in the architecture of Figure 1, a closed-loop data analysis process flow was made possible [36]. When a data analysis model is created through data collection, the data analysis model can be executed in the data preprocessing stage. The performance of the data analysis model may be degraded by including time series trends or by aspects of the manufacturing system environment such as the life expectance of the machine. Standards for systematic measurement already have been set, enabling continuous data analysis model updates.
By monitoring the execution results of the data analysis model and the realized output, the field error rate of the data analysis model can be calculated. When it is determined to update the data analysis model, the training data set for generating the data analysis model is reconstructed with recent or changed data, and the model is updated. As the updated data analysis model does not guarantee better performance than the original model, comparison between the newly updated data analysis model and the original model should be conducted first. This comparison determines whether to adopt the updated model or keep the original. When the model is updated, data suitable for the updated model are collected, and the new model is executed. The generated data analysis model supports predictive model mark-up language (PMML), an XML-based predictive model exchange format.

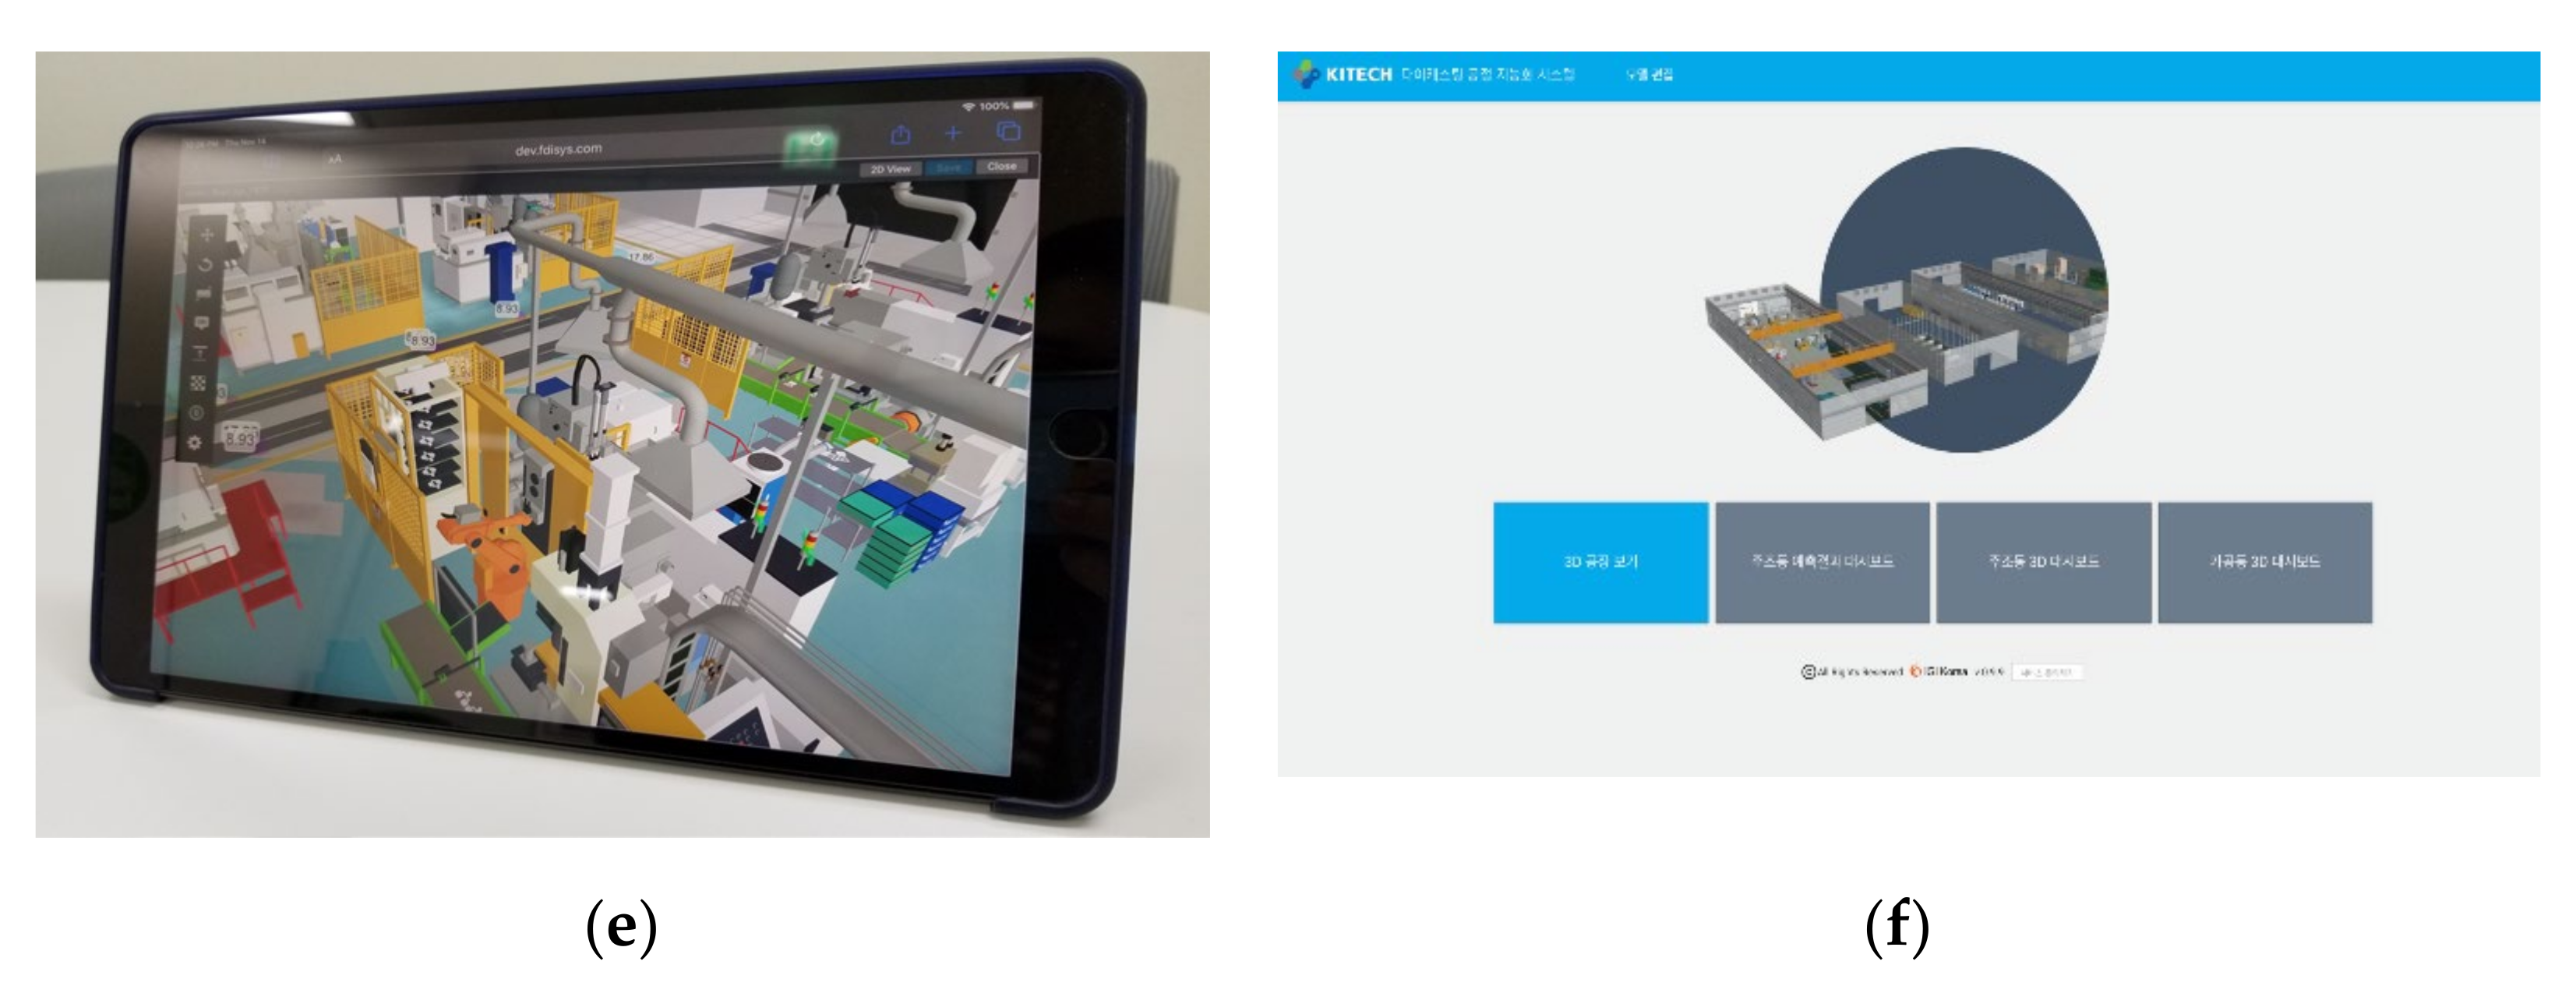
3.3.3. Visualization Layer

A user-friendly visualization system for the digital twin has been developed based on the FDIXML data model. Previously, tasks such as creating a 3D factory based on a 2D layout, establishing an interface between the 3D factory and edge devices/MES, and continuously reflecting the changing factory situation to the digital twin are extremely difficult and expensive. We built a 3D library of resources such as machines, material handling systems, and labors in the factory allowing any user, for easy and quick deployment of the libraries, to automatically create a digital twin. The information that needs to be connected to the actual factory can be intuitively defined by the user on the digital twin, and RESTful API can be automatically generated.
As shown in Figure 4b, the user can arrange the factory layout as if playing a game in the process layout authoring tool by using the machines and material handling systems library in the factory shown in Figure 4b. Based on the deployed layout, a 3D virtual factory model is automatically generated, and the realistic 3D factory visualized on the web can be checked through the visualization function as shown in Figure 4c. As pictured in Figure 4d, the factory can be evaluated using VR devices such as Oculus, and the factory can also be evaluated via mobile as shown in Figure 4e. When sensor data and KPIs that need to be connected to the physical factory are defined in the form of types and items, RESTful APIs are automatically created for shop floor connection through MES or IoT platforms. Connected real-time data and KPIs can be checked in real time through the digital twin. Figure 4f shows the screen of the integrated monitoring system implemented.
Figure 4. System Functions: (a) Resource Library, (b) Factory Layout Design Tool, (c) Web-based 3D Visualization, (d) Design Review using VR, (e) Mobile Visualization, (f) Dashboard Screen.
When the worksite layout is changed, the user of the manufacturing company can easily change the layout of the virtual factory using the developed authoring tool. Even anyone who can only draw shapes in PowerPoint can change the factory layout. After that, the 3D model is automatically created and the linked KPIs are updated. If the KPIs or data need to be changed, the user can conveniently create/change/delete RESTful APIs. The biggest advantage of this system is that not only experts but also novices can easily use it. Only when new machines or material handling systems are introduced, is it required to build a library with the help of experts on a one-off basis. If SMEs can perform 3D modelling through training and education, they can also build the library on their own.

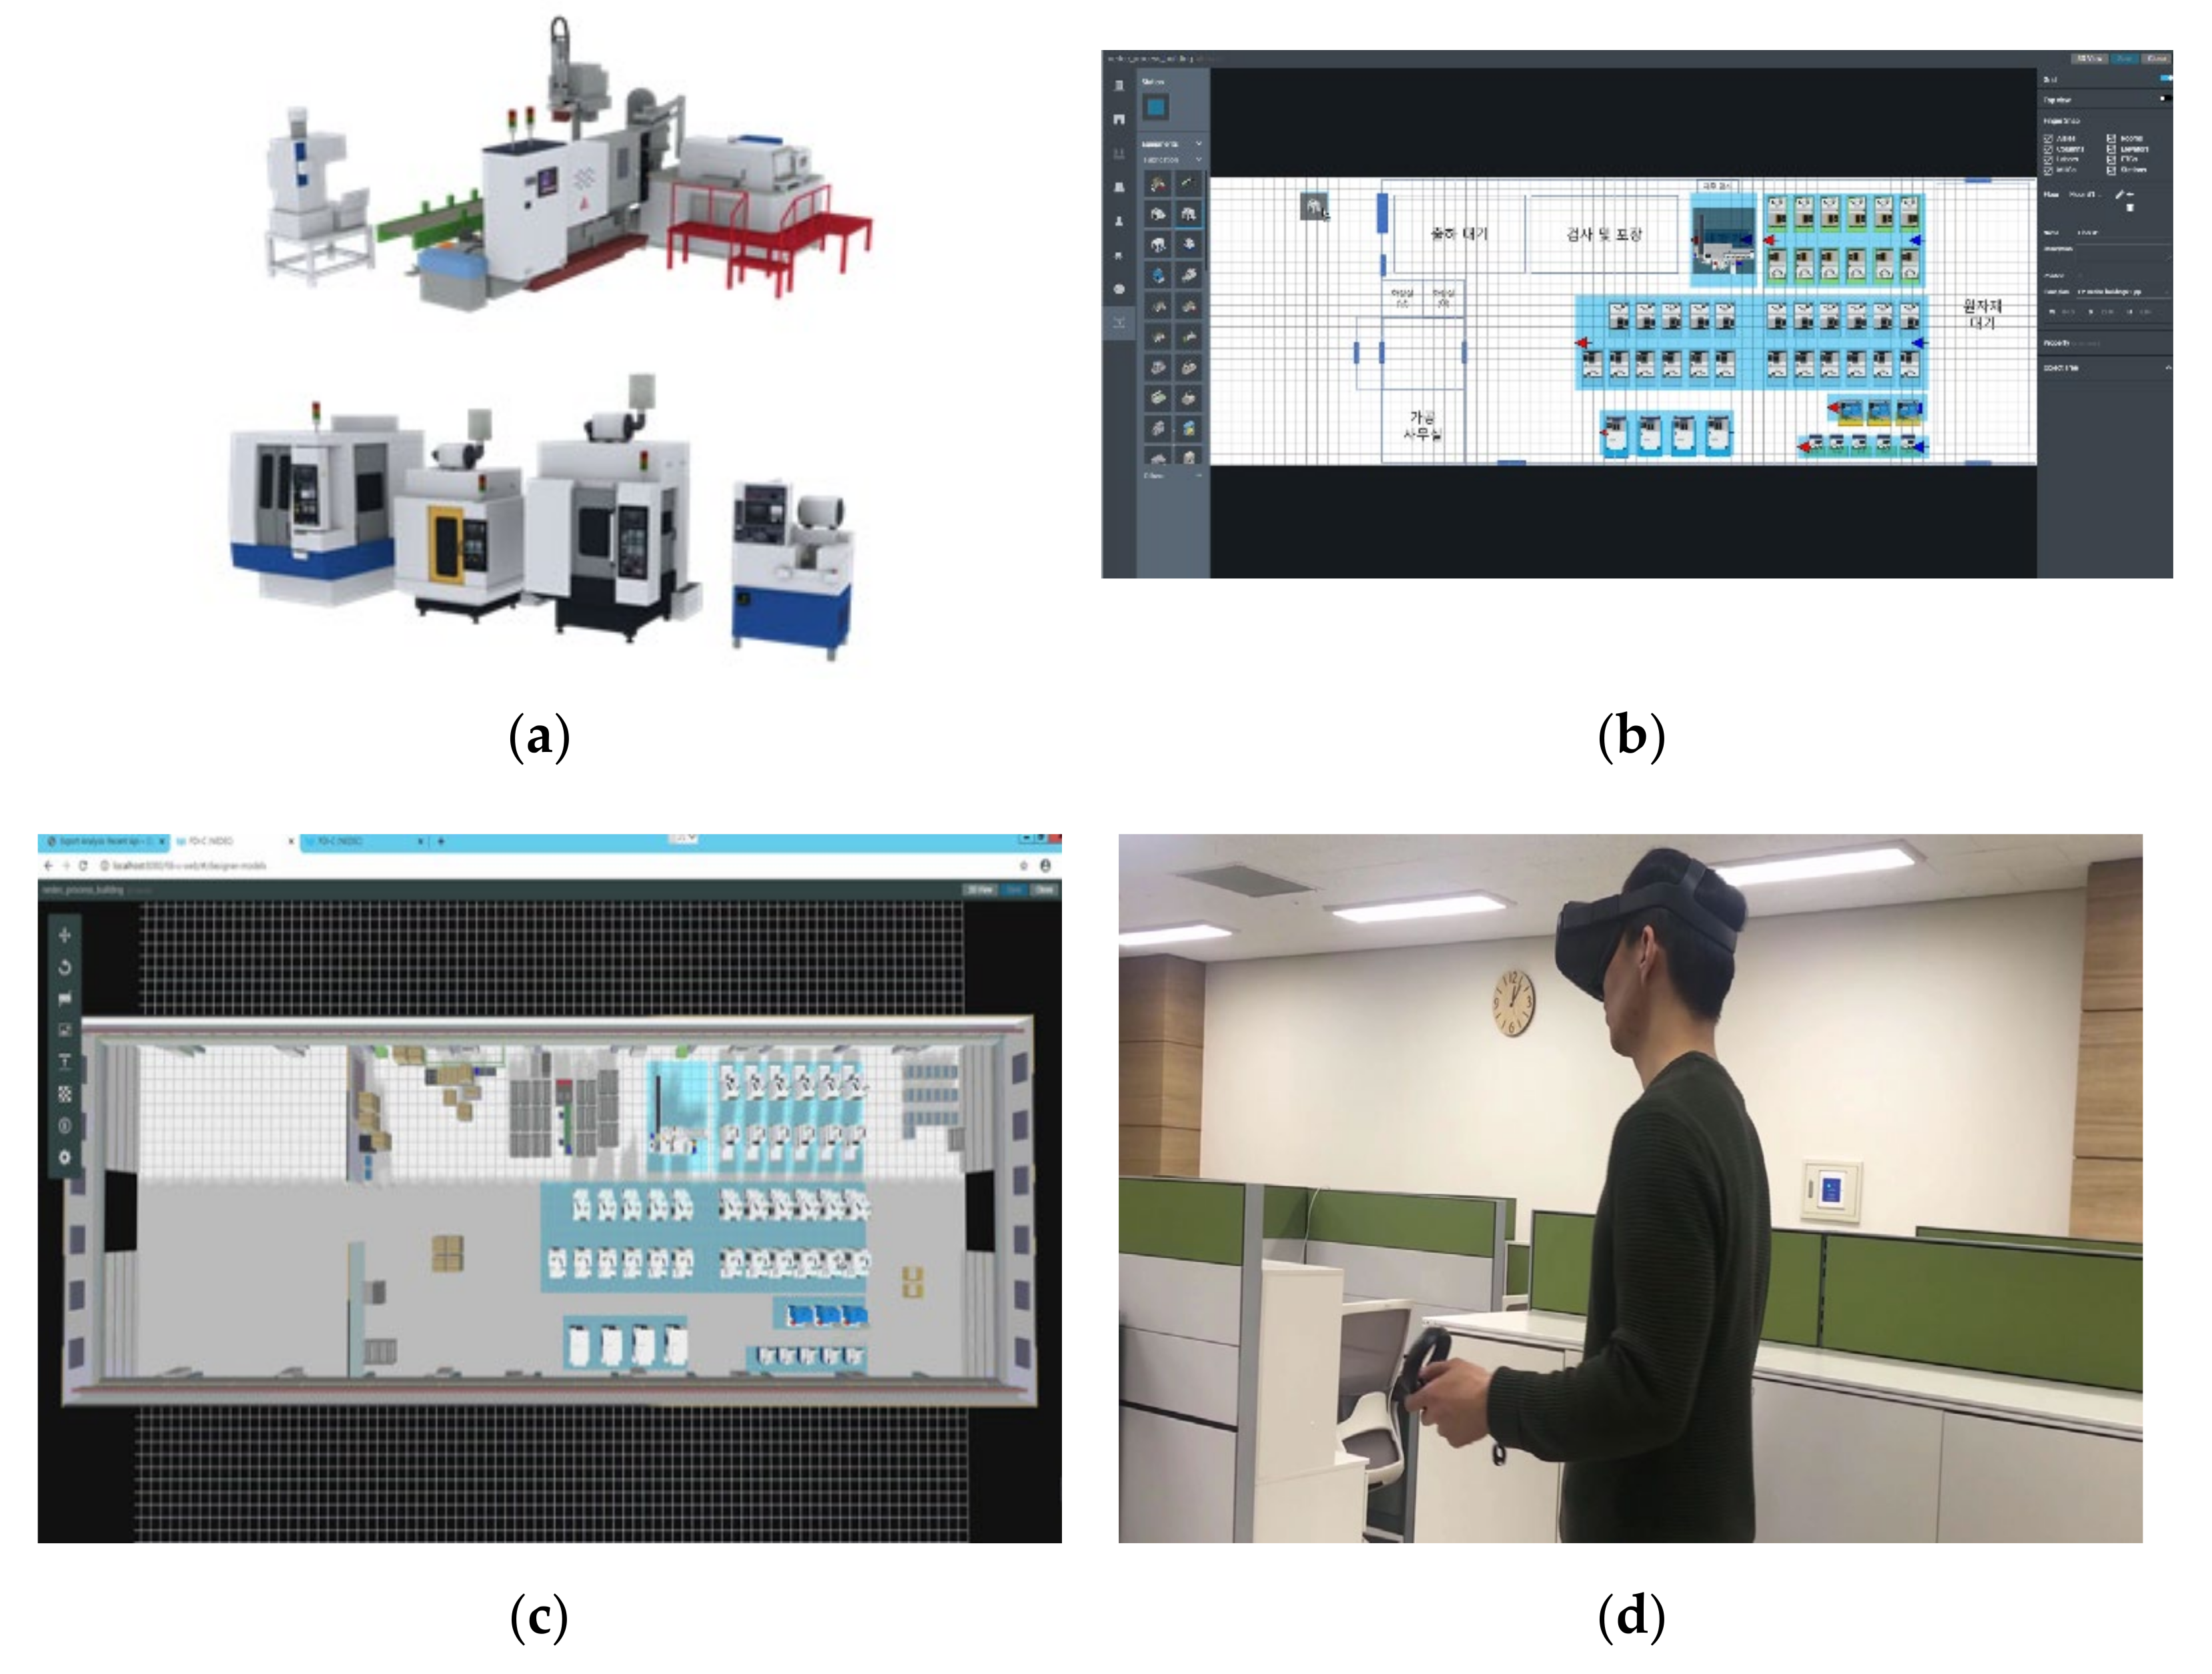
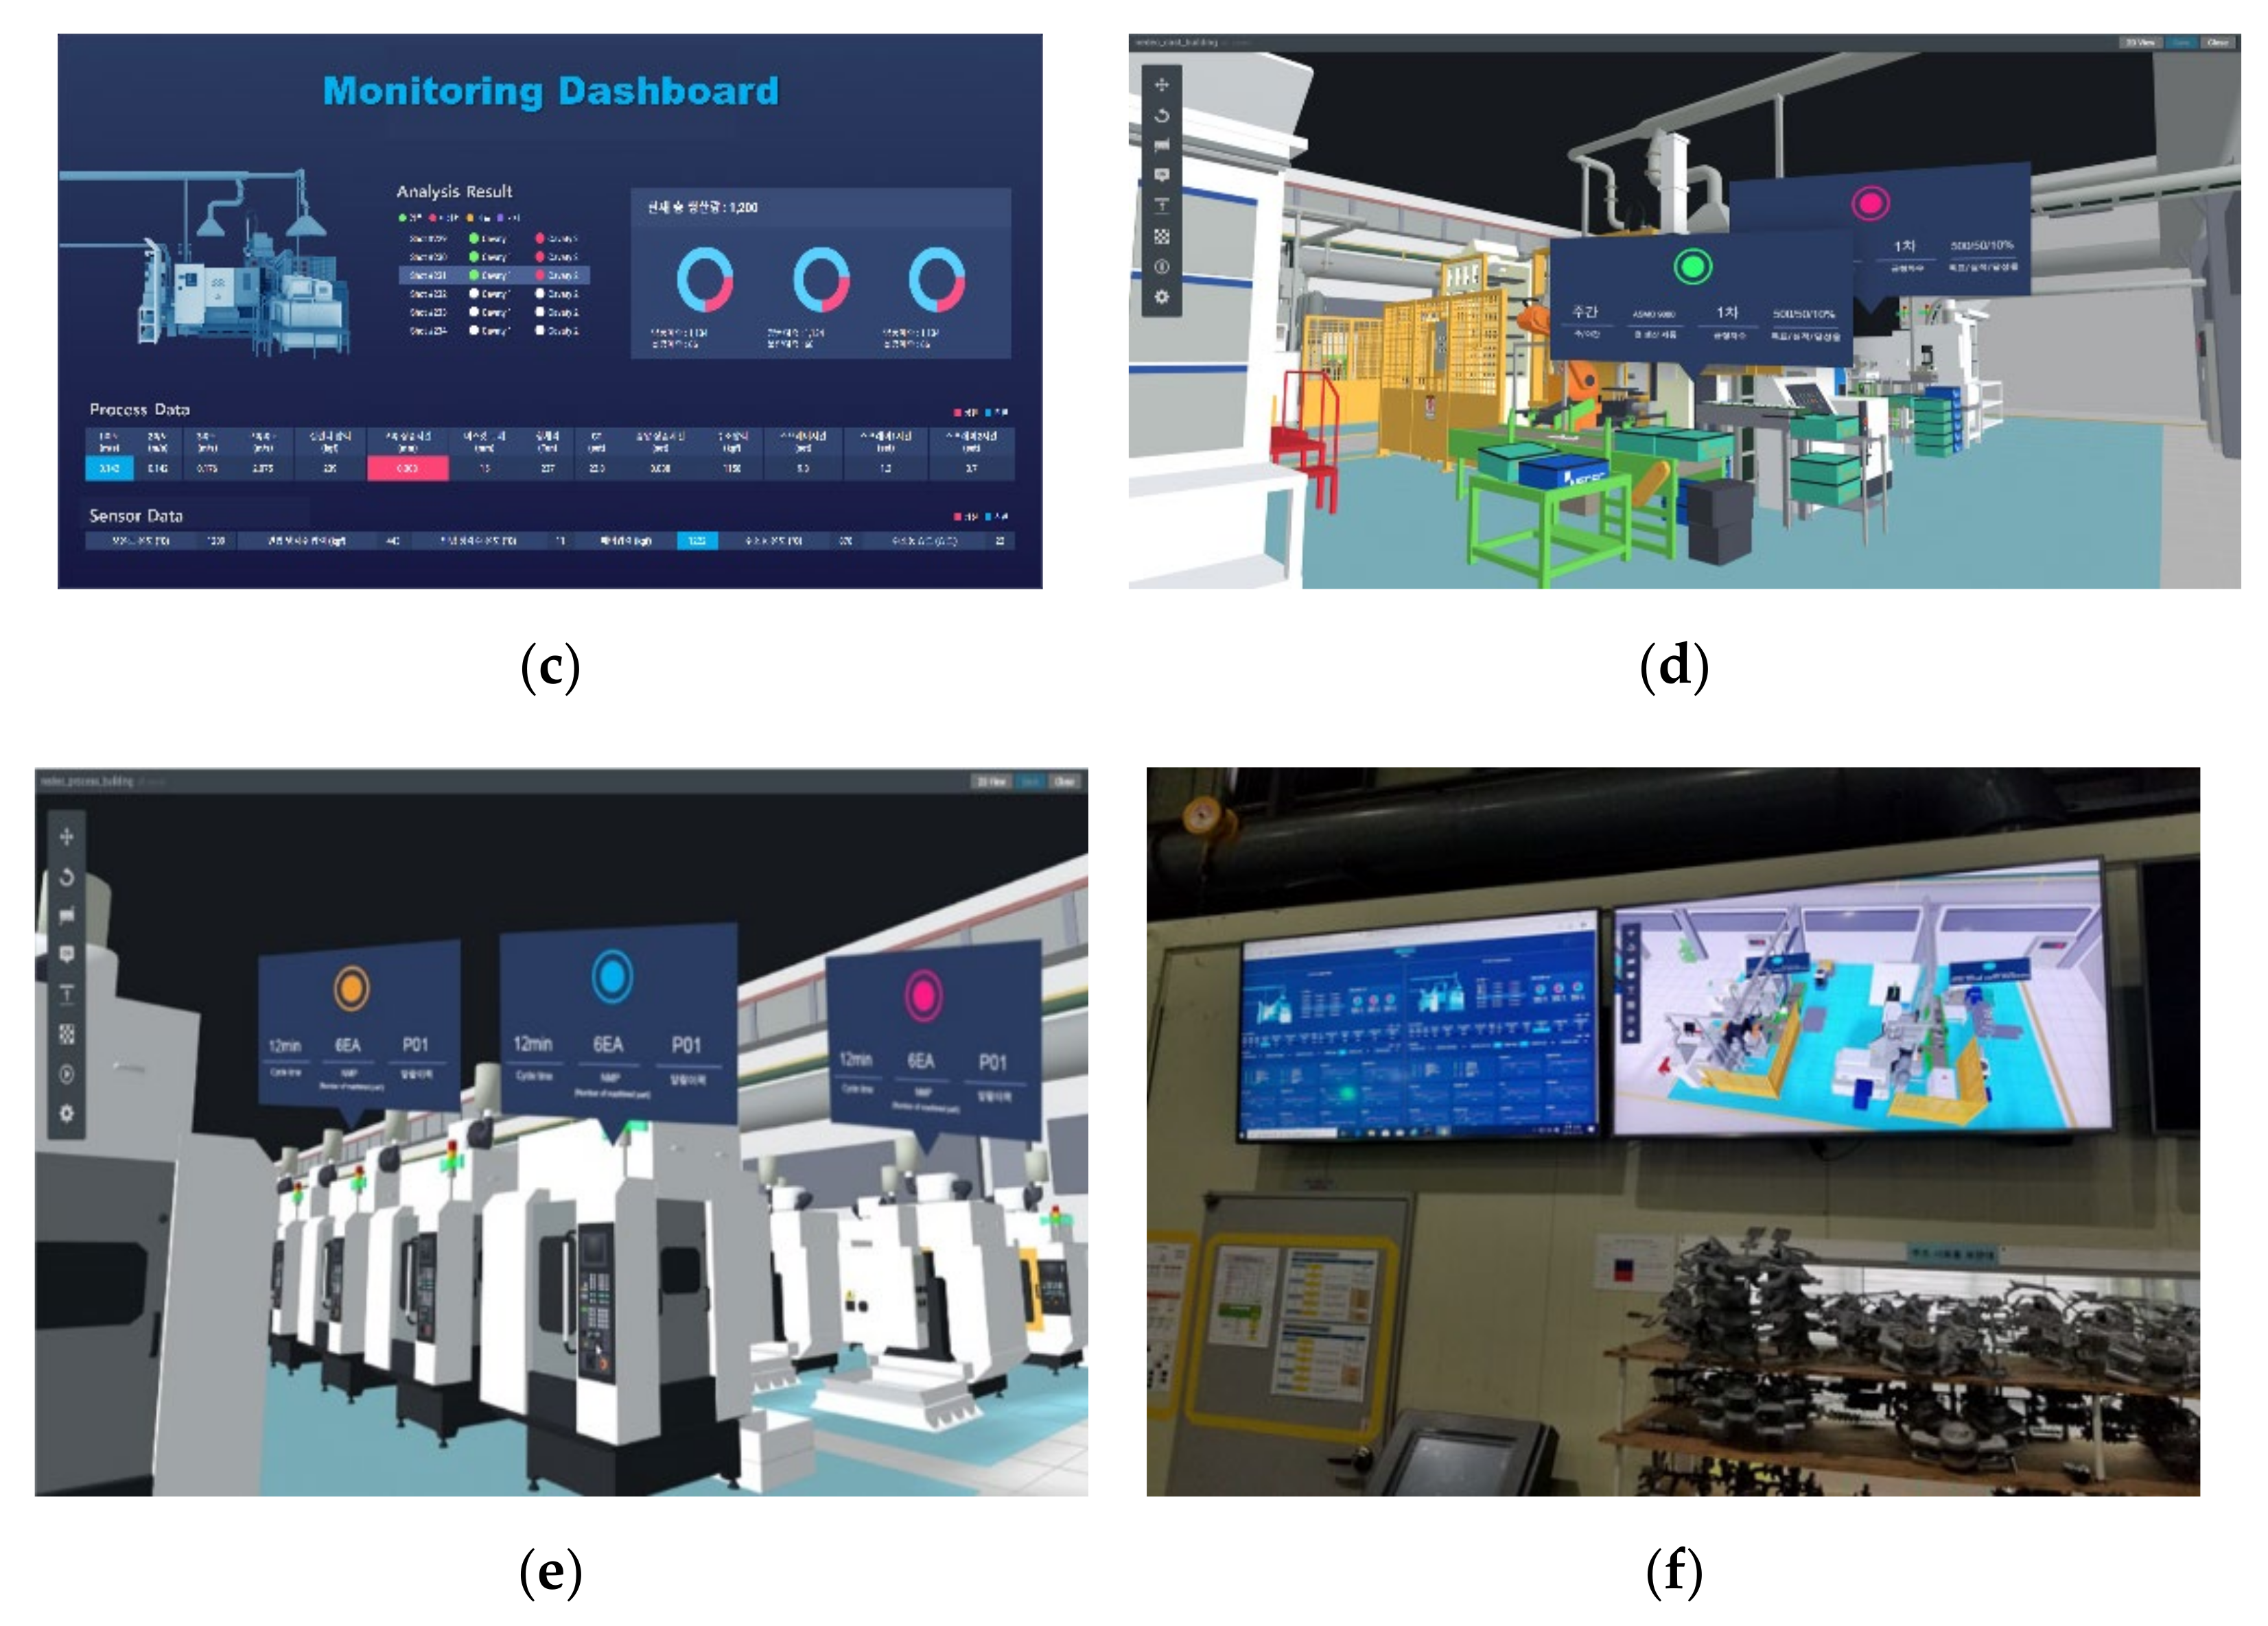
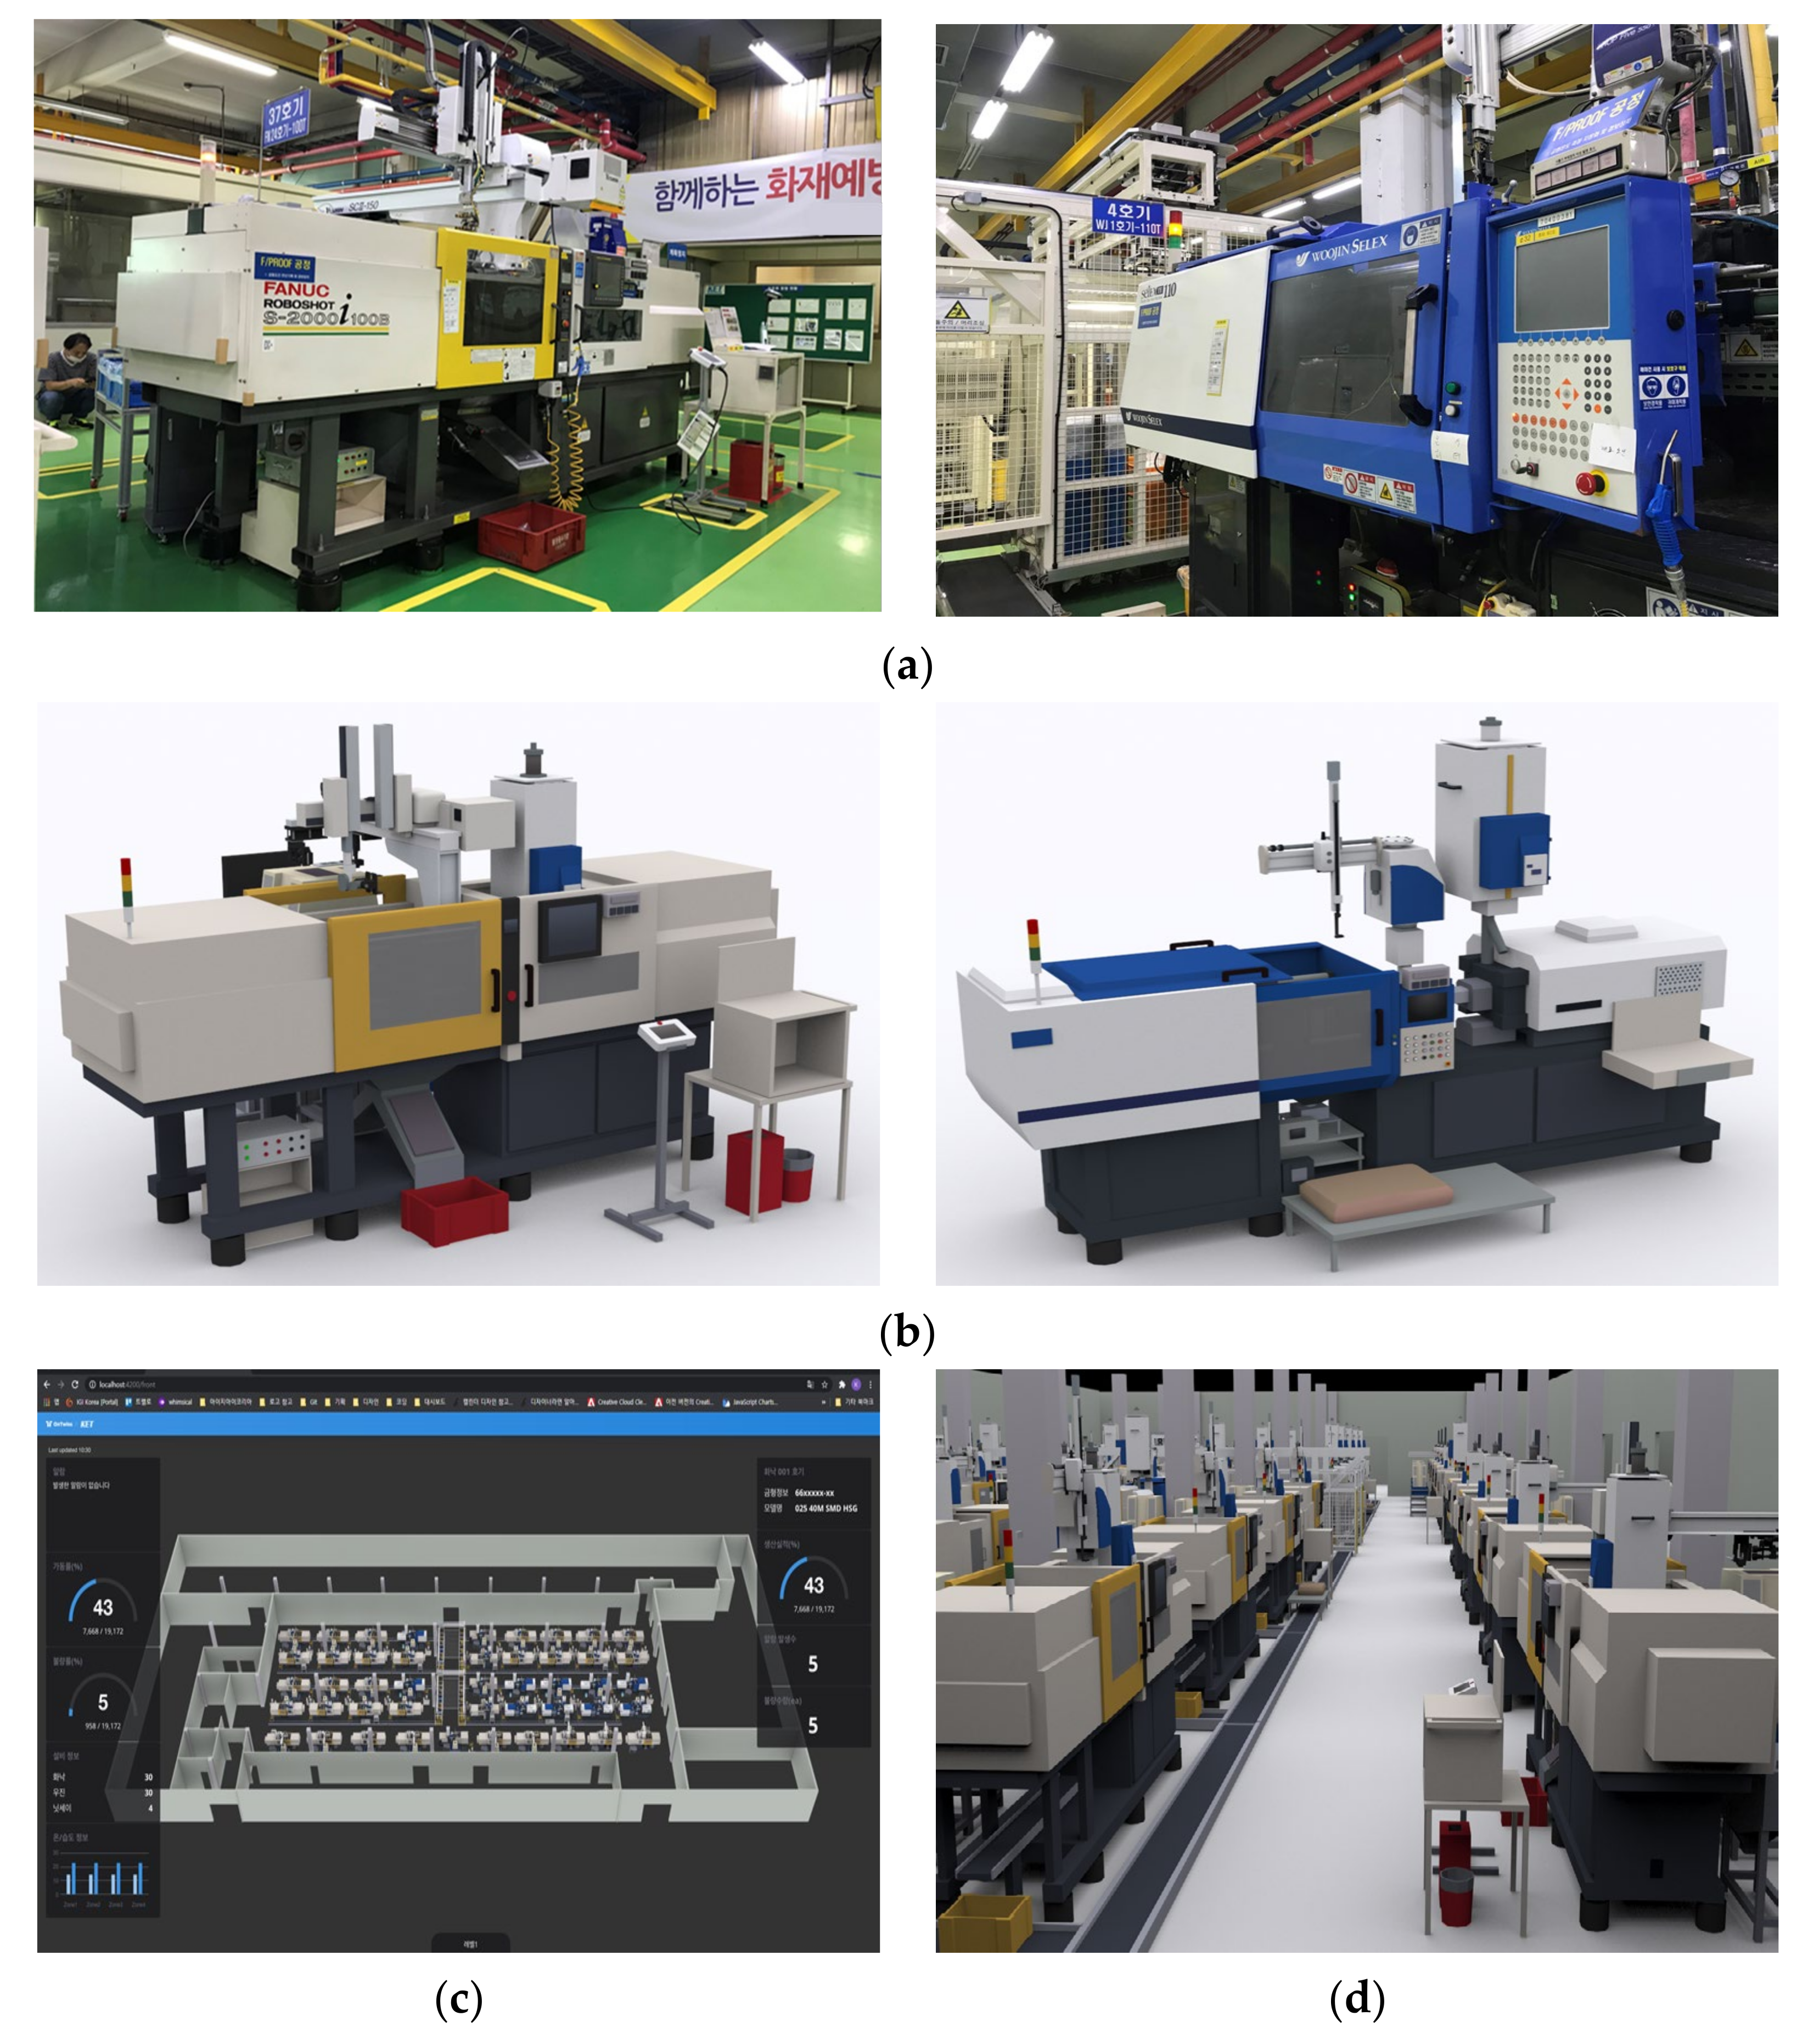
4. Korean Application Cases

The company “N” is a “metal platform” based provider of metal parts including die-casting, precision machining, surface treatment and assembly. It is a global manufacturing company that has the headquarters in South Korea and operated 12 subsidiaries and factories in Korea and abroad.
Figure 5 shows the machines of the company’s manufacturing site and the implemented digital twin-based integrated monitoring system. Figure 5a is the die-casting machines of the target factory, and (b) is the CNC machines. Figure 6 shows the edge device installed in the site. Data and KPIs are being collected from DB of legacy system including real-time data collected from edge devices and MES used by the company. Operation status, production products, purpose, performance, achievement rate, cycle time, alarm history, real-time sensing data such as temperature, pressure, humidity, and failure prediction results are collected from die-casting and CNC machines, and it is being visualized along with a realistic 3D digital twin model.
Figure 5. Application Case of the company “N”: (a) Die-Casting Machines, (b) CNC Machines, (c) 2D Chart Dashboard, (d) 3D Dashboard of Die-Casting Machines, (e) 3D Dashboard of CNC Machines, (f) Screenshot of Shop floor.
Figure 6. Installed edge devices.
Figure 5c is a 2D chart-based dashboard showing the KPIs and data collected in the casting machine. Production data, product name, mold number, speed, high speed, cylinder pressure, high speed rise time, casting pressure, spray time, etc., are visualized in real time. In connection with the data analysis module, abnormal situations are automatically detected. Figure 5d shows the appearance of the digital twins of the casting machines. When it is in normal operation, the machine is moving and working, but when it is not in operation, the machine also stops working and the user can intuitively check the status through an alarm. Figure 5e is the digital twins of the CNC machines. The operation status of the machine can be intuitively identified, and an alarm is generated when an abnormal activity occurs in the machine. Figure 5f is the appearance of the monitoring dashboard installed at the worksite. This allows site workers to intuitively learn and grasp the current machines and factory conditions.
The company “K” supplies modules for eco-friendly and intelligent automobiles, and connectors for digital home appliances and IT devices. It is a global manufacturing company that has their headquarters in South Korea and operates 13 factories in Asia, Europe, and America. The company “K” also used the edge device as shown in Figure 6 and built a digital twin-based control and monitoring system in the same way as company “N”. Figure 7a shows the target injection molding machines. Figure 7b shows the 3D modelled machines, and Figure 7c shows the entire digital twin of the shopfloor. On the left and right sides, information on temperature and humidity of the factory, operation status, machines, and molds are provided in the form of charts.
Figure 7. Application Case of the company “K”: (a) Injection Molding Machines, (b) 3D model of Injection Molding Machines, (c) Integrated Dashboard of Shopfloor, (d) Work-through mode.
Earlier, it was mentioned that manufacturing companies must meet three criteria to introduce a digital twin-based monitoring system using realistic 3D models. The first was that users of manufacturing companies should be able to reflect frequently changing manufacturing environments in the digital twin. Engineers of applied companies are easily handling layout change tasks using the layout design tool used in this study. Users in manufacturing companies have learned how to use the system through training within an hour, and they are quickly and easily creating digital twins in the desired form.
The second criterion was that 3D should be conveniently or automatically generated, and 3D visualization should support all cloud, web, and mobile. The target factories of the applied companies consist of a casting factory, an inspection factory, a CNC machining factory, injection molding factory, and a warehouse. Three-dimensional factories are automatically created according to the layout changed in the authoring tool. The developed monitoring system visualizes the digital twin of the entire factory on mobile, web, and cloud, and operates well without any performance problems. In addition, the comparison of 3D files is summarized in Table 2. It was confirmed that the file size of the 3D library was reduced to within 10% of the original CAD. This is a comparison for one machine, and more diverse cases are needed for an objective comparison.
Table 2. Comparison of file format.
Third, it is necessary to be connected to the site in real time to visualize data and KPIs along with 3D models and provide user-friendly functions. Figure 5 shows the real-time visualization of the 3D models and KPIs. There is an autorotation function within the digital twin, which provides automatic rotation of the entire factory to the user. It supports a function that allows users to display screens when they set points that they want to check specifically (e.g., specific machine or material handling system). It is also possible to measure distance of objects in the digital twin, and various convenient functions such as the walkthrough are provided. The data collected in real time are connected to the analysis module to provide abnormal situation detection and alarm generation functions.
Previously, in order to check the operation status and KPIs of the factory at the production site, it was necessary to look at the machines directly on the shop floor and then go to the office to check the factory KPIs and the status of each machine through MES. However, through the establishment of a digital twin monitoring system, the situation of the site can be immediately checked anytime, anywhere. There was feedback from customers that the speed of handling work and decision-making time increased by more than 30% compared to the previous one.

5. Conclusions

In this study, in order to increase the understanding of digital twin building of SMEs, the tasks and technologies for each layer were separately explained based on a single digital twin architecture. In addition, by developing a digital twin solution for SMEs, the technology and tasks of each layer were integrated. The creation of digital twin models, which SMEs struggle most with, has been automated through system development. A 3D digital twin can be created automatically after reflecting the frequently changing worksite conditions by the manufacturing company users themselves. By connecting to the site in real time based on the edge devices, it is possible to intuitively check the current factory status with KPIs of a realistic 3D-based digital twin through cloud, web, and mobile. Various user-friendly functions such as automatic camera rotation and movement, measurement, walk-through, and VR functions are provided.
Beyond simply viewing the production site with CCTV, it has become possible to monitor and manage production sites based on digital twins. The factory can be intuitively inspected anytime, anywhere, and the data analysis function has been established, enabling it to identify problems and make quick decisions. The big advantage of digital twins is that users can interact according to circumstances based on realistic 3D. The user can select the machines or material handling systems in which the problem has occurred through the interaction to determine the cause of the malfunction in detail, select and execute the necessary analysis algorithm, and even control. Currently, manufacturing companies want minimal human intervention to prevent accidents that may occur due to automatic control.
The digital twin-based integrated monitoring system can be connected to various MES and IoT platforms based on the RESTful API and can be integrated with heterogeneous analysis systems. Currently, monitoring systems are being built in connection with various legacy environments in various manufacturing industries. Currently, the asset administration shell (AAS) [37] is being applied to the digital twin systems by integrating with the interoperable data model. AAS is the implementation of the digital twin for Industry 4.0 and can support interoperability between systems based on digital twins [38]. Therefore, we intend to implement it to support interoperability between various systems by connecting elements of the proposed FDI data model and properties of the AAS meta model. There is a plan to perform a quantitative evaluation of the system based on the accumulated application cases in the future.

Author Contributions

S.C. and J.W. equally contributed to the manuscript. S.C. and J.W. developed the research content based on the digital twin development and drafted the manuscript. J.K. applied the digital twin to two Korean manufacturing companies and analyzed the application result. Then J.K. reflected the industry feedback to the manuscript. J.Y.L. directed the research process and supervised the overall work. All authors have read and agreed to the published version of the manuscript.

Funding

This study was financially supported by Seoul National University of Science and Technology.

Institutional Review Board Statement

Not applicable.

Data Availability Statement

Not applicable.

Conflicts of Interest

The authors declare no conflict of interest.

References

  1. Kang, H.S.; Lee, J.Y.; Choi, S.; Kim, H.; Park, J.H.; Son, J.Y.; Noh, S.D. Smart manufacturing: Past research, present findings, and future directions. Int. J. Precis. Eng. Manuf.-Green Technol. 2016, 3, 111–128. [Google Scholar] [CrossRef]
  2. Choi, S.; Kang, G.; Jun, C.; Lee, J.Y.; Han, S. Cyber-physical systems: A case study of development for manufacturing industry. Int. J. Comput. Appl. Technol. 2017, 55, 289–297. [Google Scholar] [CrossRef]
  3. Moiceanu, G.; Paraschiv, G. Digital Twin and Smart Manufacturing in Industries: A Bibliometric Analysis with a Focus on Industry 4.0. Sensors 2022, 22, 1388. [Google Scholar] [CrossRef] [PubMed]
  4. Tao, F.; Zhang, H.; Liu, A.; Nee, A.Y. Digital twin in industry: State-of-the-art. IEEE Trans. Ind. Inform. 2018, 15, 2405–2415. [Google Scholar] [CrossRef]
  5. Choi, S.; Woo, J.; Kim, J.; Choi, W.; Kim, J.; Lee, J.Y. A Survey and Analysis of Research on Digital Twin in Korea. Korean J. Comput. Des. Eng. 2021, 26, 59–69. [Google Scholar] [CrossRef]
  6. Lee, J.; Bagheri, B.; Kao, H.A. A cyber-physical systems architecture for industry 4.0-based manufacturing systems. Manuf. Lett. 2015, 3, 18–23. [Google Scholar] [CrossRef]
  7. Alam, K.M.; El Saddik, A. C2PS: A digital twin architecture reference model for the cloud-based cyber-physical systems. IEEE Access 2017, 5, 2050–2062. [Google Scholar] [CrossRef]
  8. Redelinghuys, A.; Basson, A.; Kruger, K. A six-layer digital twin architecture for a manufacturing cell. In International Workshop on Service Orientation in Holonic and Multi-Agent Manufacturing; Springer: Bergamo, Italy, 2018; pp. 412–423. [Google Scholar]
  9. Zheng, Y.; Yang, S.; Cheng, H. An application framework of digital twin and its case study. J. Ambient Intell. Humaniz. Comput. 2019, 10, 1141–1153. [Google Scholar] [CrossRef]
  10. Zhou, G.; Zhang, C.; Li, Z.; Ding, K.; Wang, C. Knowledge-driven digital twin manufacturing cell towards intelligent manufacturing. Int. J. Prod. Res. 2020, 58, 1034–1051. [Google Scholar] [CrossRef]
  11. Choi, S.; Kang, G. Towards development of cyber-physical systems based on integration of heterogeneous technologies. Int. J. Comput. Appl. Technol. 2018, 58, 129–136. [Google Scholar] [CrossRef]
  12. Liu, C.; Vengayil, H.; Lu, Y.; Xu, X. A cyber-physical machine tools platform using OPC UA and MTConnect. J. Manuf. Syst. 2019, 51, 61–74. [Google Scholar] [CrossRef]
  13. Almada-Lobo, F. The Industry 4.0 revolution and the future of Manufacturing Execution Systems (MES). J. Innov. Manag. 2015, 3, 16–21. [Google Scholar] [CrossRef]
  14. Zhao, R.; Yan, R.; Chen, Z.; Mao, K.; Wang, P.; Gao, R.X. Deep learning and its applications to machine health monitoring. Mech. Syst. Signal Processing 2019, 115, 213–237. [Google Scholar] [CrossRef]
  15. Bottani, E.; Cammardella, A.; Murino, T.; Vespoli, S. From the Cyber-Physical System to the Digital Twin: The Process Development for Behaviour Modelling of a Cyber Guided Vehicle in M2M Logic; XXII Summer School Francesco Turco Industrial Systems Engineering: Palermo, Italy, 2017; pp. 1–7. [Google Scholar]
  16. Gyulai, D.; Pfeiffer, A.; Kádár, B.; Monostori, L. Simulation-based Production Planning and Execution Control for Reconfigurable Assembly Cells. Procedia CIRP 2016, 57, 445–450. [Google Scholar] [CrossRef]
  17. Zhang, M.; Tao, F.; Nee, A.Y. Digital Twin Enhanced Dynamic Job-Shop Scheduling. J. Manuf. Syst. 2021, 58, 146–156. [Google Scholar] [CrossRef]
  18. Samir, K.; Khabbazi, M.R.; Maffei, A.; Onori, M.A. Key performance indicators in cyber-physical production systems. Procedia CIRP 2018, 72, 498–502. [Google Scholar] [CrossRef]
  19. Zhou, F.; Lin, X.; Liu, C.; Zhao, Y.; Xu, P.; Ren, L.; Xue, T.; Ren, L. A survey of visualization for smart manufacturing. J. Vis. 2019, 22, 419–435. [Google Scholar] [CrossRef]
  20. Kokkas, A.; Vosniakos, G.-C. An Augmented Reality approach to factory layout design embedding operation simulation. Int. J. Interact. Des. Manuf. (IJIDeM) 2019, 13, 1061–1071. [Google Scholar] [CrossRef]
  21. Nee, A.Y.; Ong, S.K. Virtual and augmented reality applications in manufacturing. IFAC Proc. Vol. 2013, 46, 15–26. [Google Scholar] [CrossRef] [Green Version]
  22. Fuertes, P.C.; Alzamora, F.M.; Carot, M.H.; Alonso Campos, J.C. Building and exploiting a Digital Twin for the management of drinking water distribution networks. Urban Water J. 2020, 17, 704–713. [Google Scholar] [CrossRef]
  23. Bonilla, C.A.; Zanfei, A.; Brentan, B.; Montalvo, I.; Izquierdo, J. A digital twin of a water distribution system by using graph convolutional networks for pump speed-based state estimation. Water 2022, 14, 514. [Google Scholar] [CrossRef]
  24. Ramos, H.M.; Morani, M.C.; Carravetta, A.; Fecarrotta, O.; Adeyeye, K.; López-Jiménez, P.A.; Pérez-Sánchez, M. New Challenges towards Smart Systems’ Efficiency by Digital Twin in Water Distribution Networks. Water 2022, 14, 1304. [Google Scholar] [CrossRef]
  25. Alves, R.G.; Souza, G.; Maia, R.F.; Tran, A.L.H.; Kamienski, C.; Soininen, J.P.; Lima, F. A digital twin for smart farming. In Proceedings of the 2019 IEEE Global Humanitarian Technology Conference (GHTC), Santa Clara, CA, USA, 17 October 2019; pp. 1–4. [Google Scholar]
  26. Angin, P.; Anisi, M.H.; Göksel, F.; Gürsoy, C.; Büyükgülcü, A. AgriLoRa: A digital twin framework for smart agriculture. J. Wirel. Mob. Netw. Ubiquitous Comput. Dependable Appl. 2020, 11, 77–96. [Google Scholar]
  27. Bado, M.F.; Tonelli, D.; Poli, F.; Zonta, D.; Casas, J.R. Digital Twin for Civil Engineering Systems: An Exploratory Review for Distributed Sensing Updating. Sensors 2022, 22, 3168. [Google Scholar] [CrossRef]
  28. Junquera, A.M.V.; González, J.G.; Balsera, J.M.V.; Montequín, V.R. A Wire Rod Rolling Mill Digital Twin for the Simulation of the Rolls Replacement Process. Proceedings 2020, 63, 13. [Google Scholar]
  29. Tancredi, G.P.; Vignali, G.; Bottani, E. Integration of Digital Twin, Machine-Learning and Industry 4.0 Tools for Anomaly Detection: An Application to a Food Plant. Sensors 2022, 22, 4143. [Google Scholar] [CrossRef]
  30. Gallala, A.; Kumar, A.A.; Hichri, B.; Plapper, P. Digital Twin for Human—Robot Interactions by Means of Industry 4.0 Enabling Technologies. Sensors 2022, 22, 4950. [Google Scholar] [CrossRef]
  31. Laaki, H.; Miche, Y.; Tammi, K. Prototyping a digital twin for real time remote control over mobile networks: Application of remote surgery. IEEE Access 2019, 7, 20325–20336. [Google Scholar] [CrossRef]
  32. Choi, S.; Jung, K.; Kulvatunyou, B.; Morris, K.C. An analysis of technologies and standards for designing smart manufacturing systems. J. Res. Natl. Inst. Stand. Technol. 2016, 121, 422. [Google Scholar] [CrossRef] [PubMed]
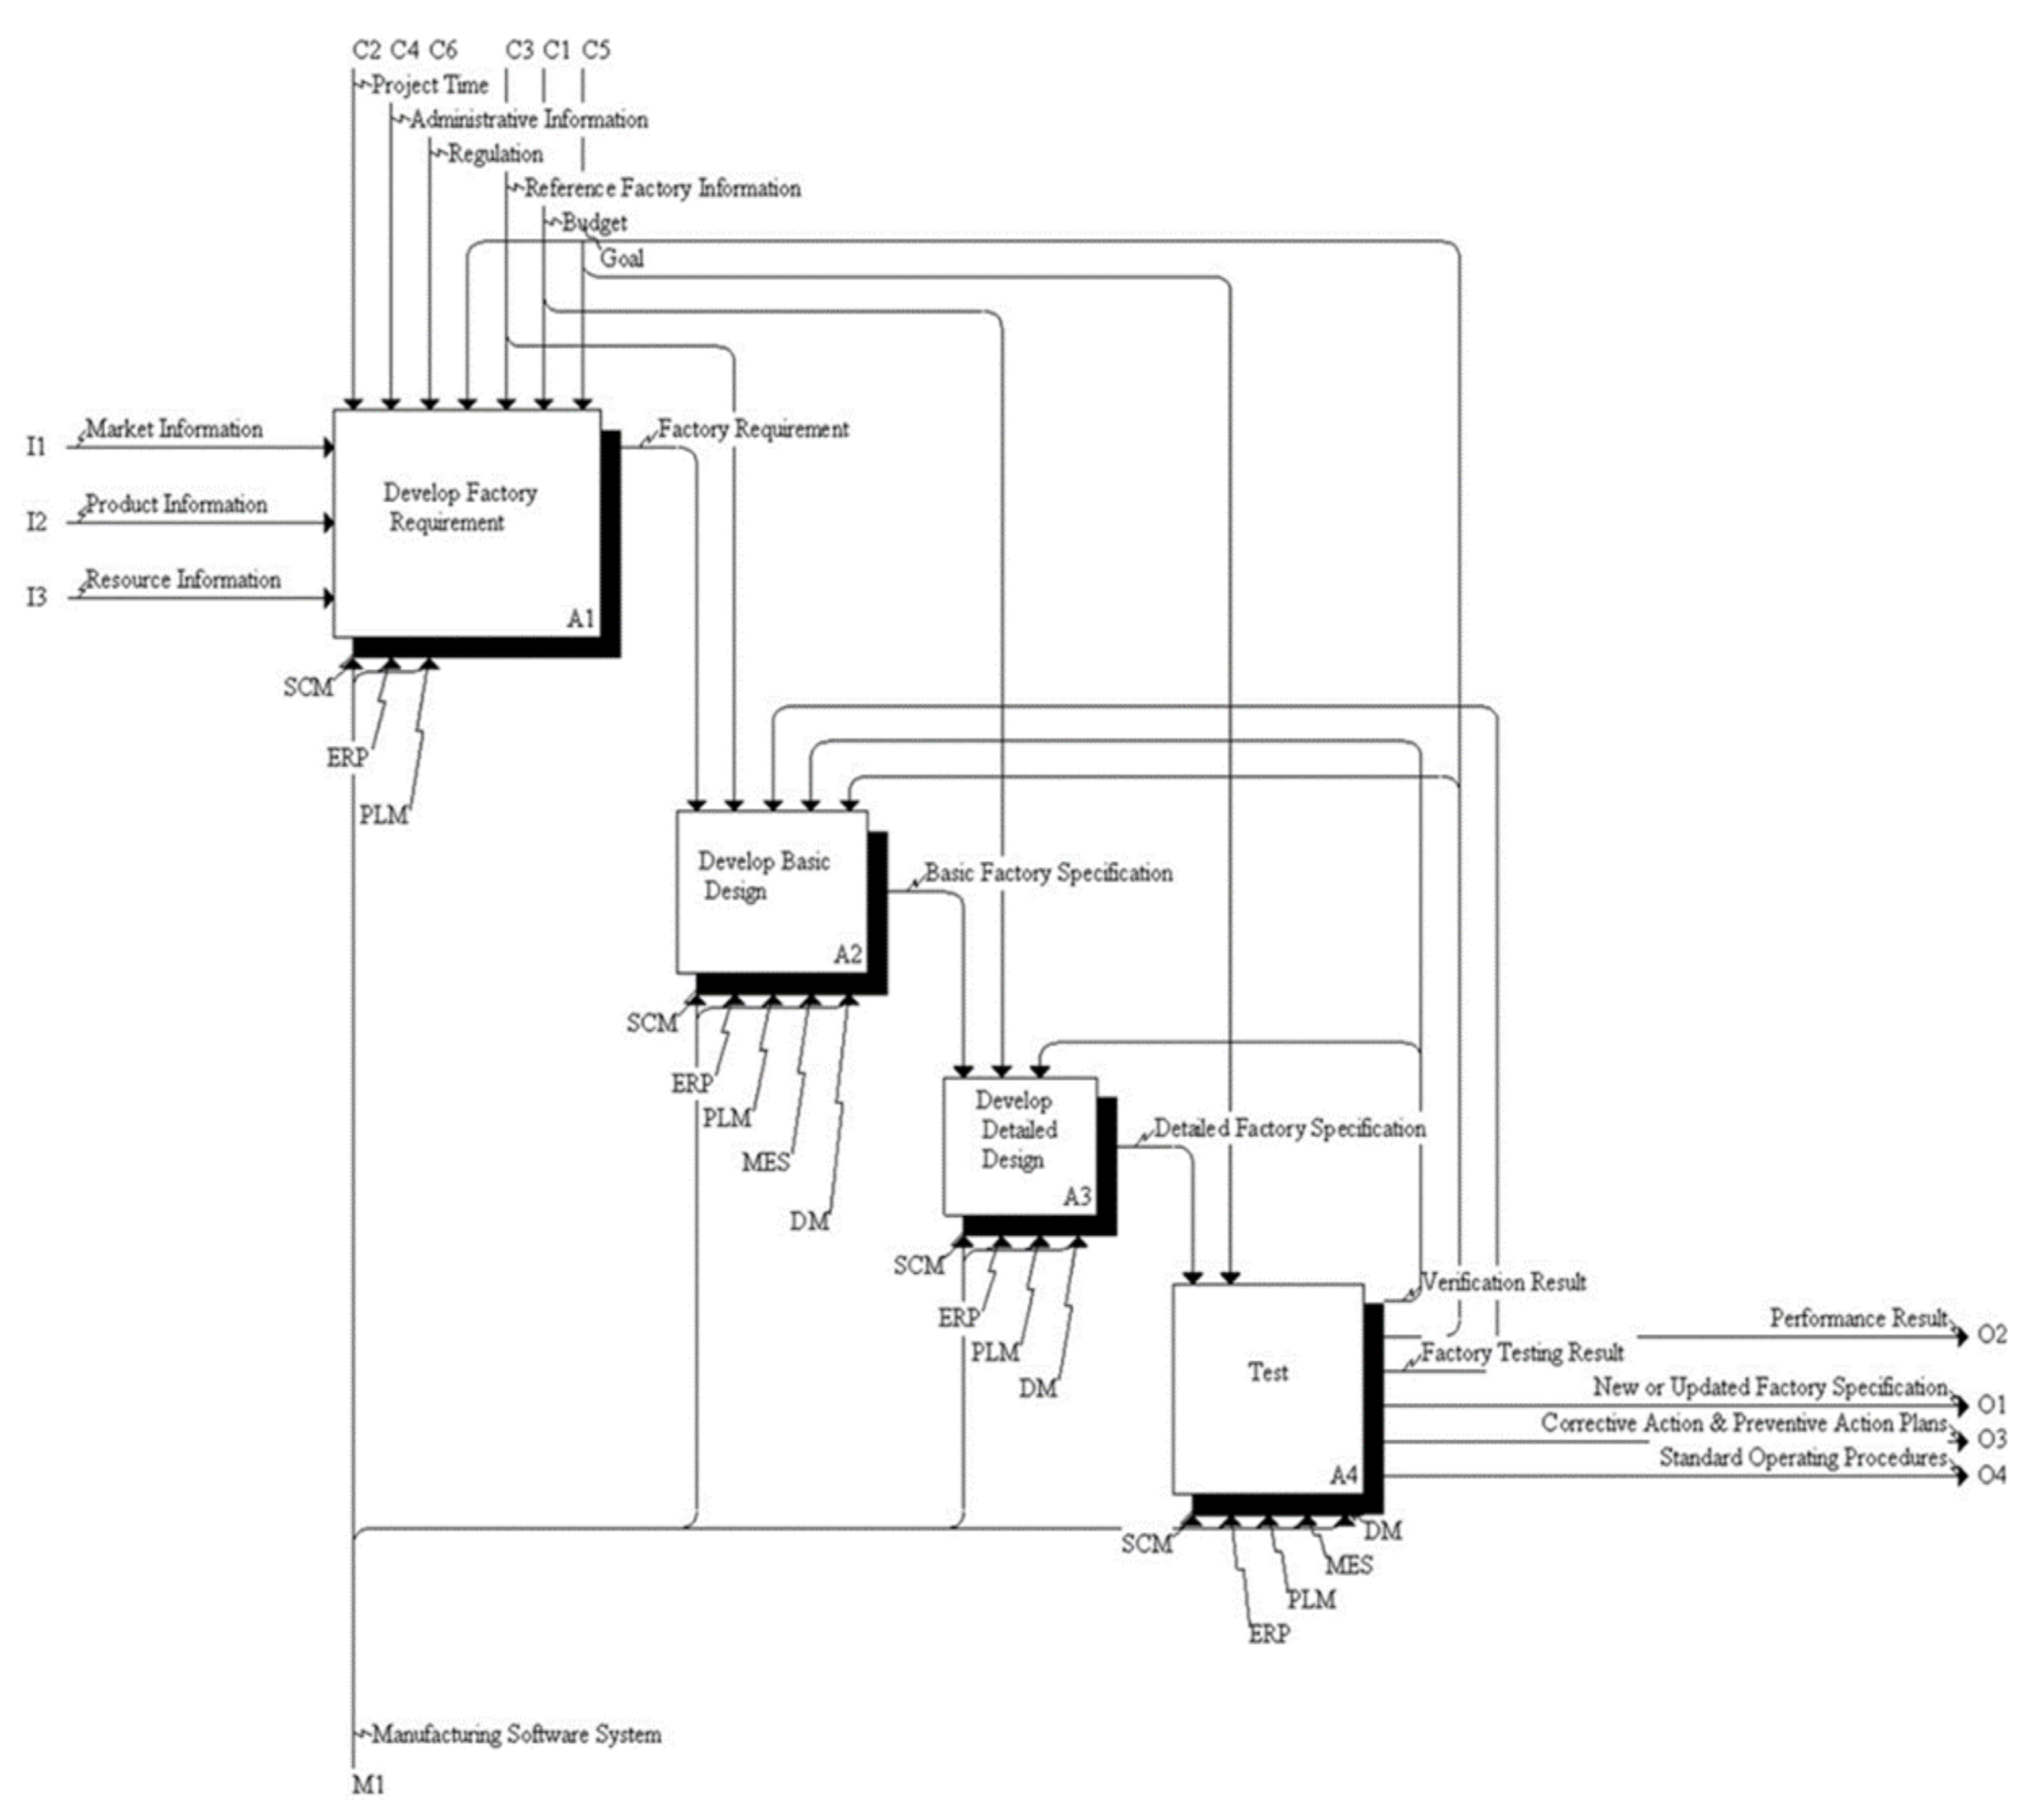
  33. Jung, K.; Choi, S.; Kulvatunyou, B.; Cho, H.; Morris, K.C. A reference activity model for smart factory de-sign and improvement. Prod. Plan. Control. 2017, 28, 108–122. [Google Scholar] [CrossRef]
  34. Park, Y.; Woo, J.; Choi, S. A cloud-based digital twin manufacturing system based on an interoperable data schema for smart manufacturing. Int. J. Comput. Integr. Manuf. 2020, 33, 1259–1276. [Google Scholar] [CrossRef]
  35. Qiu, R.G.; Zhou, M. Mighty MESs; state-of-the-art and future manufacturing execution systems. IEEE Robot. Autom. Mag. 2004, 11, 19–25. [Google Scholar] [CrossRef]
  36. Kim, J.; Lee, J.Y. Server-Edge dualized closed-loop data analytics system for cyber-physical system application. Robot. Comput. -Integr. Manuf. 2021, 67, 102040. [Google Scholar] [CrossRef]
  37. Cavalieri, S.; Salafia, M.G. Asset administration shell for PLC representation based on IEC 61131–3. IEEE Access 2020, 8, 142606–142621. [Google Scholar] [CrossRef]
  38. Ye, X.; Jiang, J.; Lee, C.; Kim, N.; Yu, M.; Hong, S.H. Toward the Plug-and-Produce Capability for Industry 4.0: An Asset Administration Shell Approach. IEEE Ind. Electron. Mag. 2020, 14, 146–157. [Google Scholar] [CrossRef]
Publisher’s Note: MDPI stays neutral with regard to jurisdictional claims in published maps and institutional affiliations.

Article Metrics

Citations

Article Access Statistics

Multiple requests from the same IP address are counted as one view.