
Research on Mask-Wearing Detection Algorithm Based on Improved YOLOv5


Abstract
:
1. Introduction
2. Related Work
3. The Model Structure of the YOLOv5 Network
3.1. Input
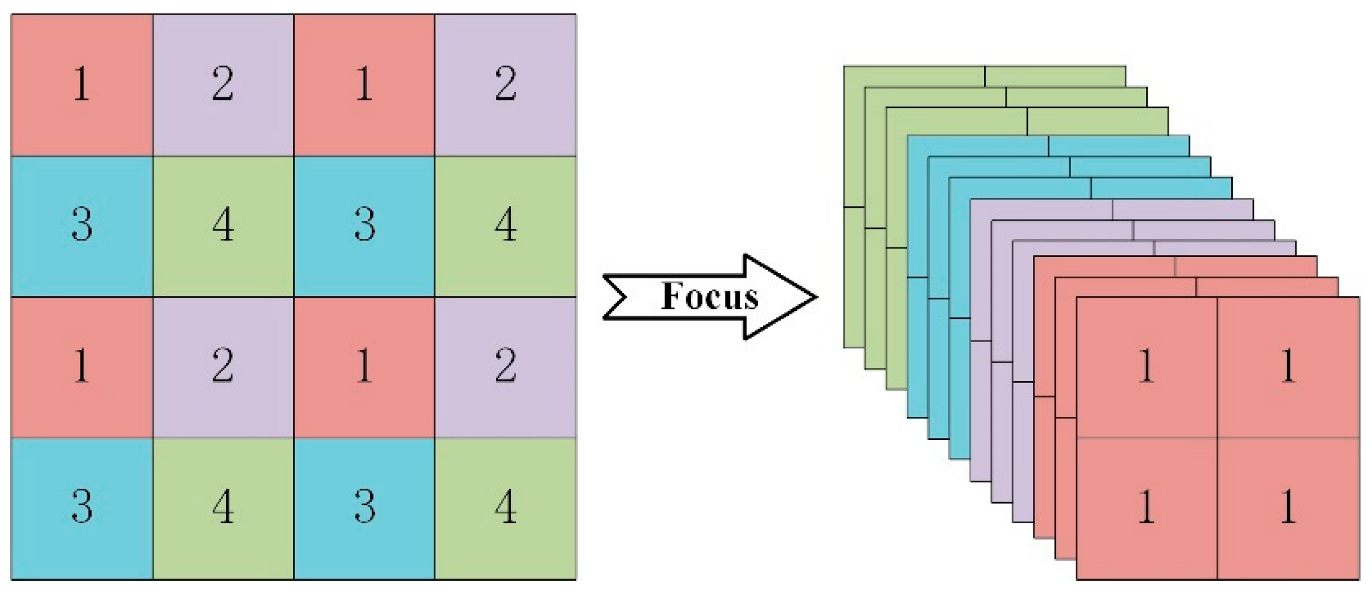
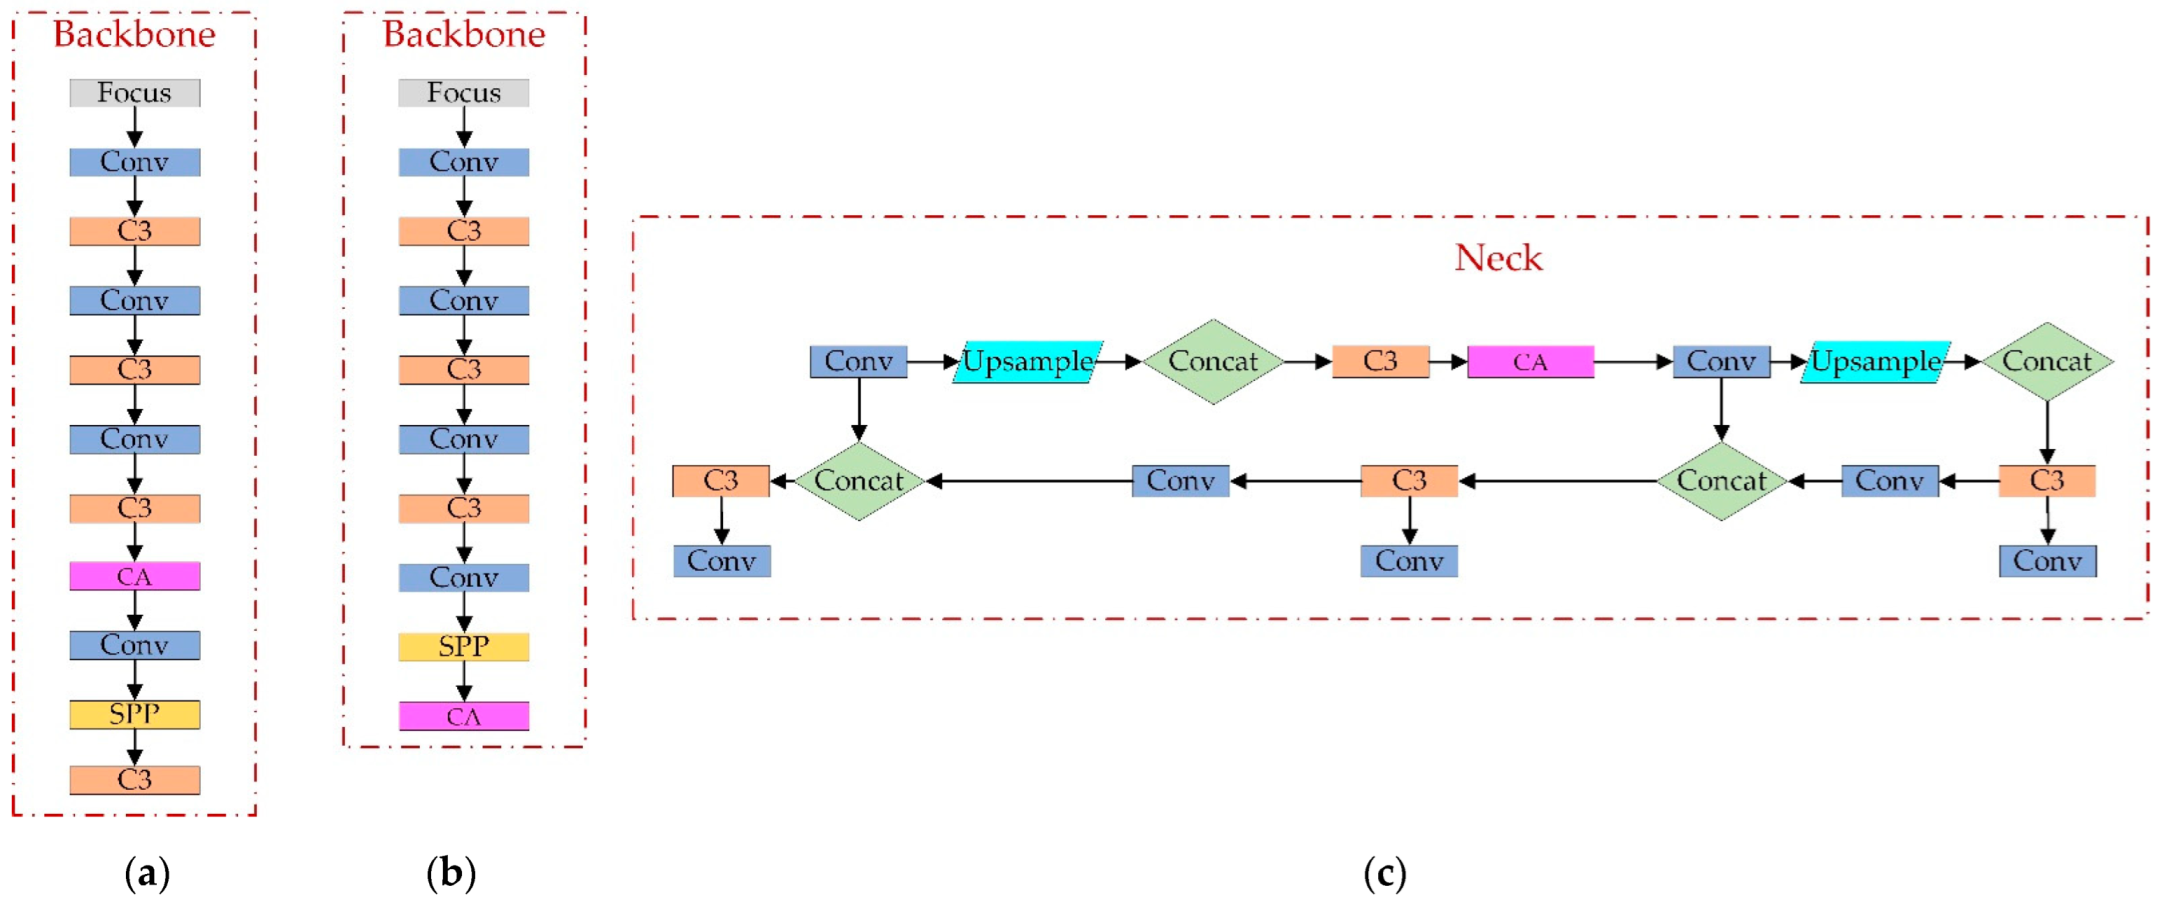
3.2. Backbone
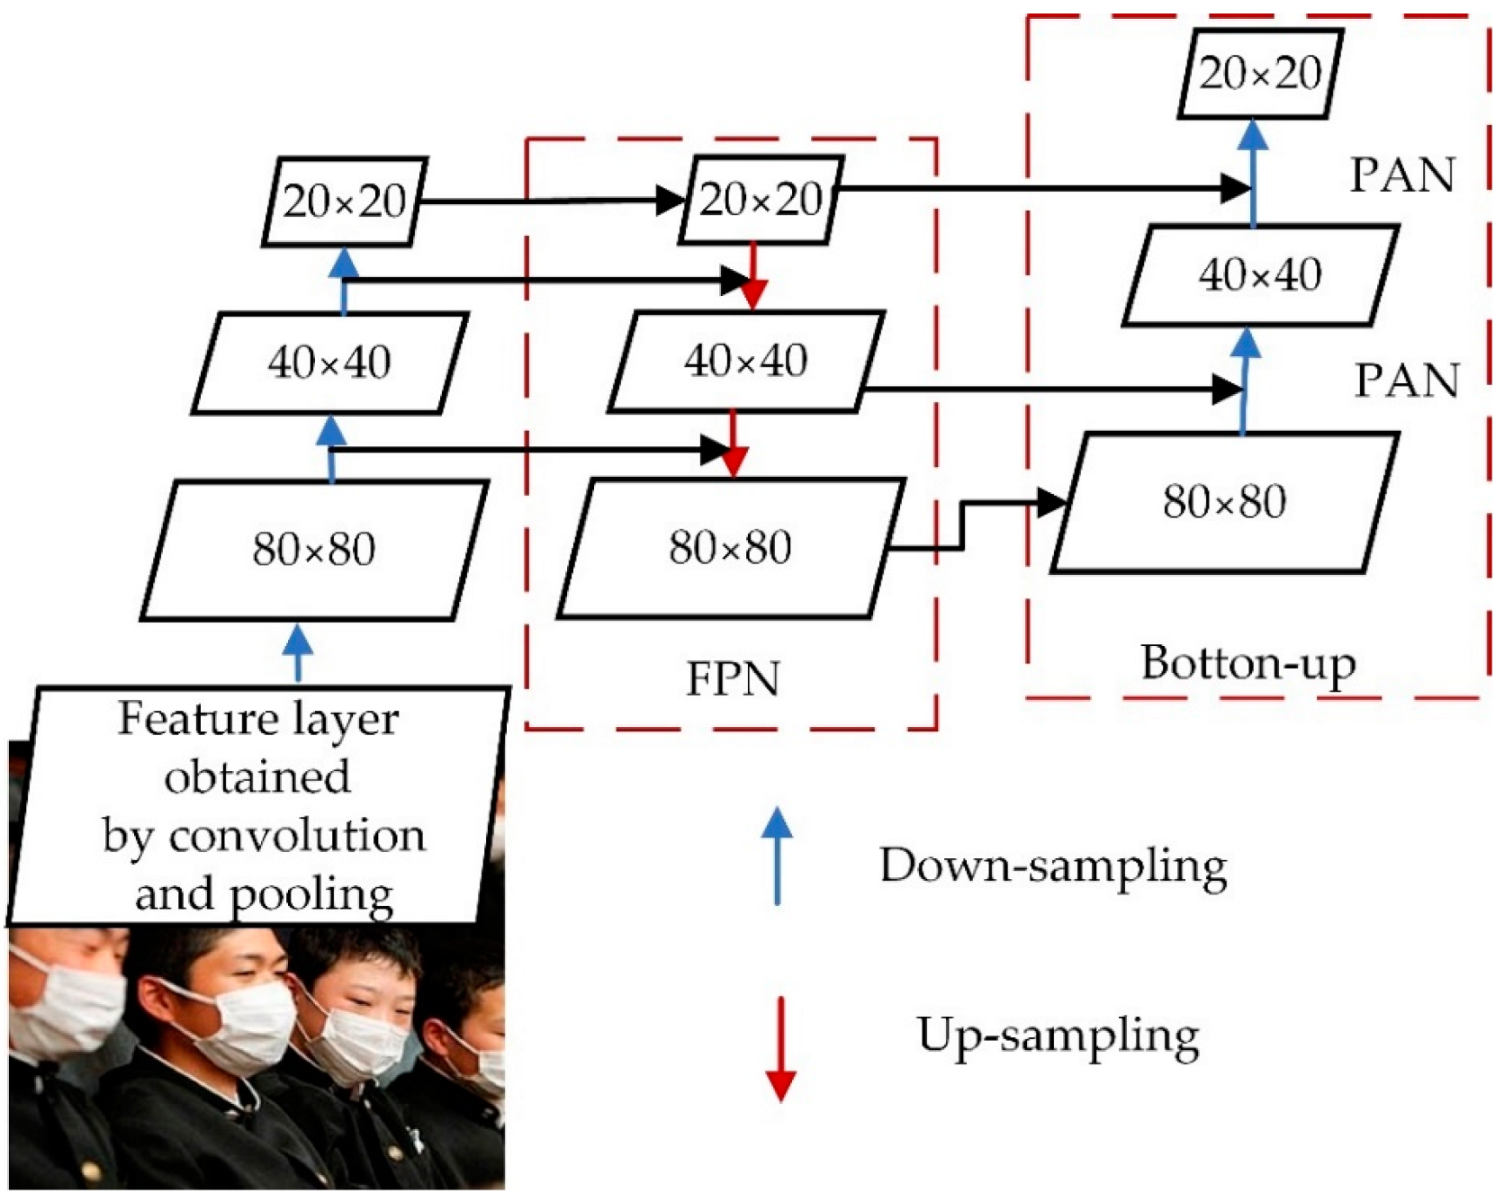
3.3. Neck
3.4. Head
4. Improved YOLOv5 Network Model
4.1. Improved Attention Mechanism
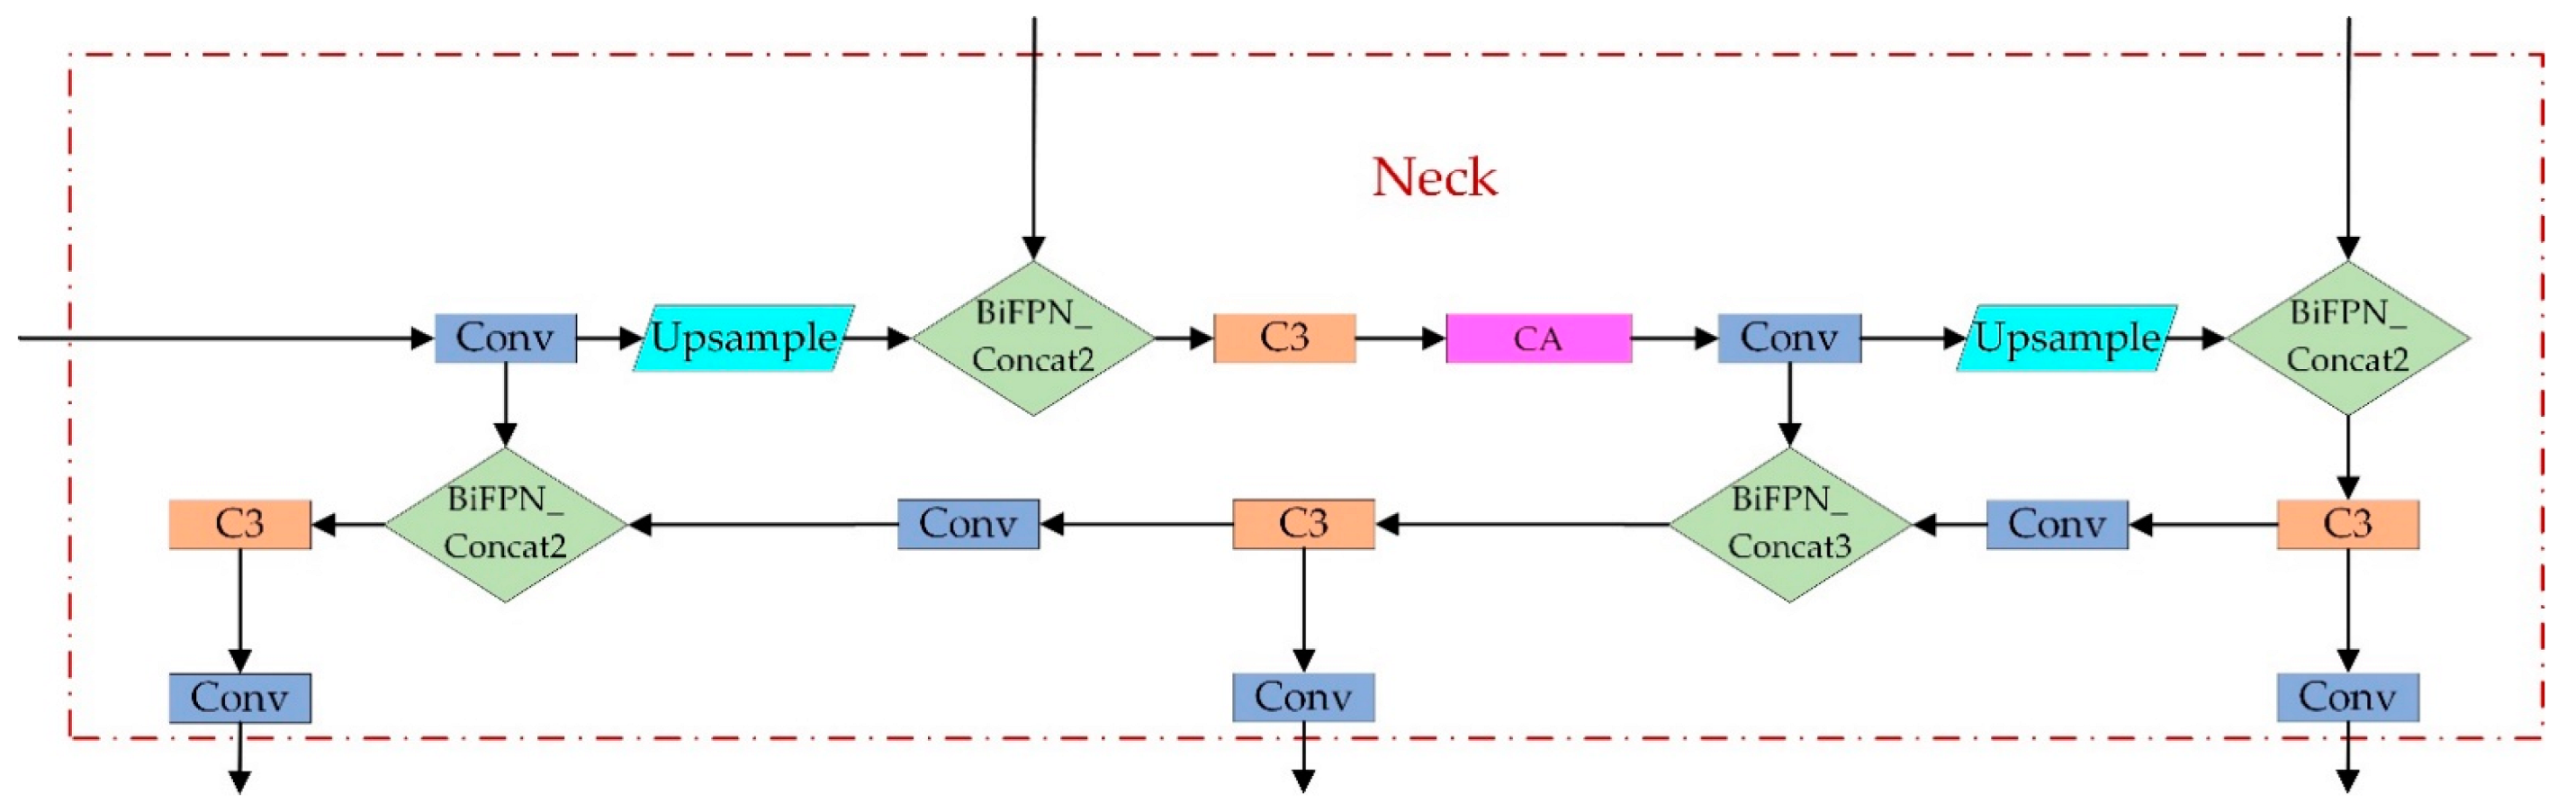
4.2. Improvement of Feature Pyramid Structure
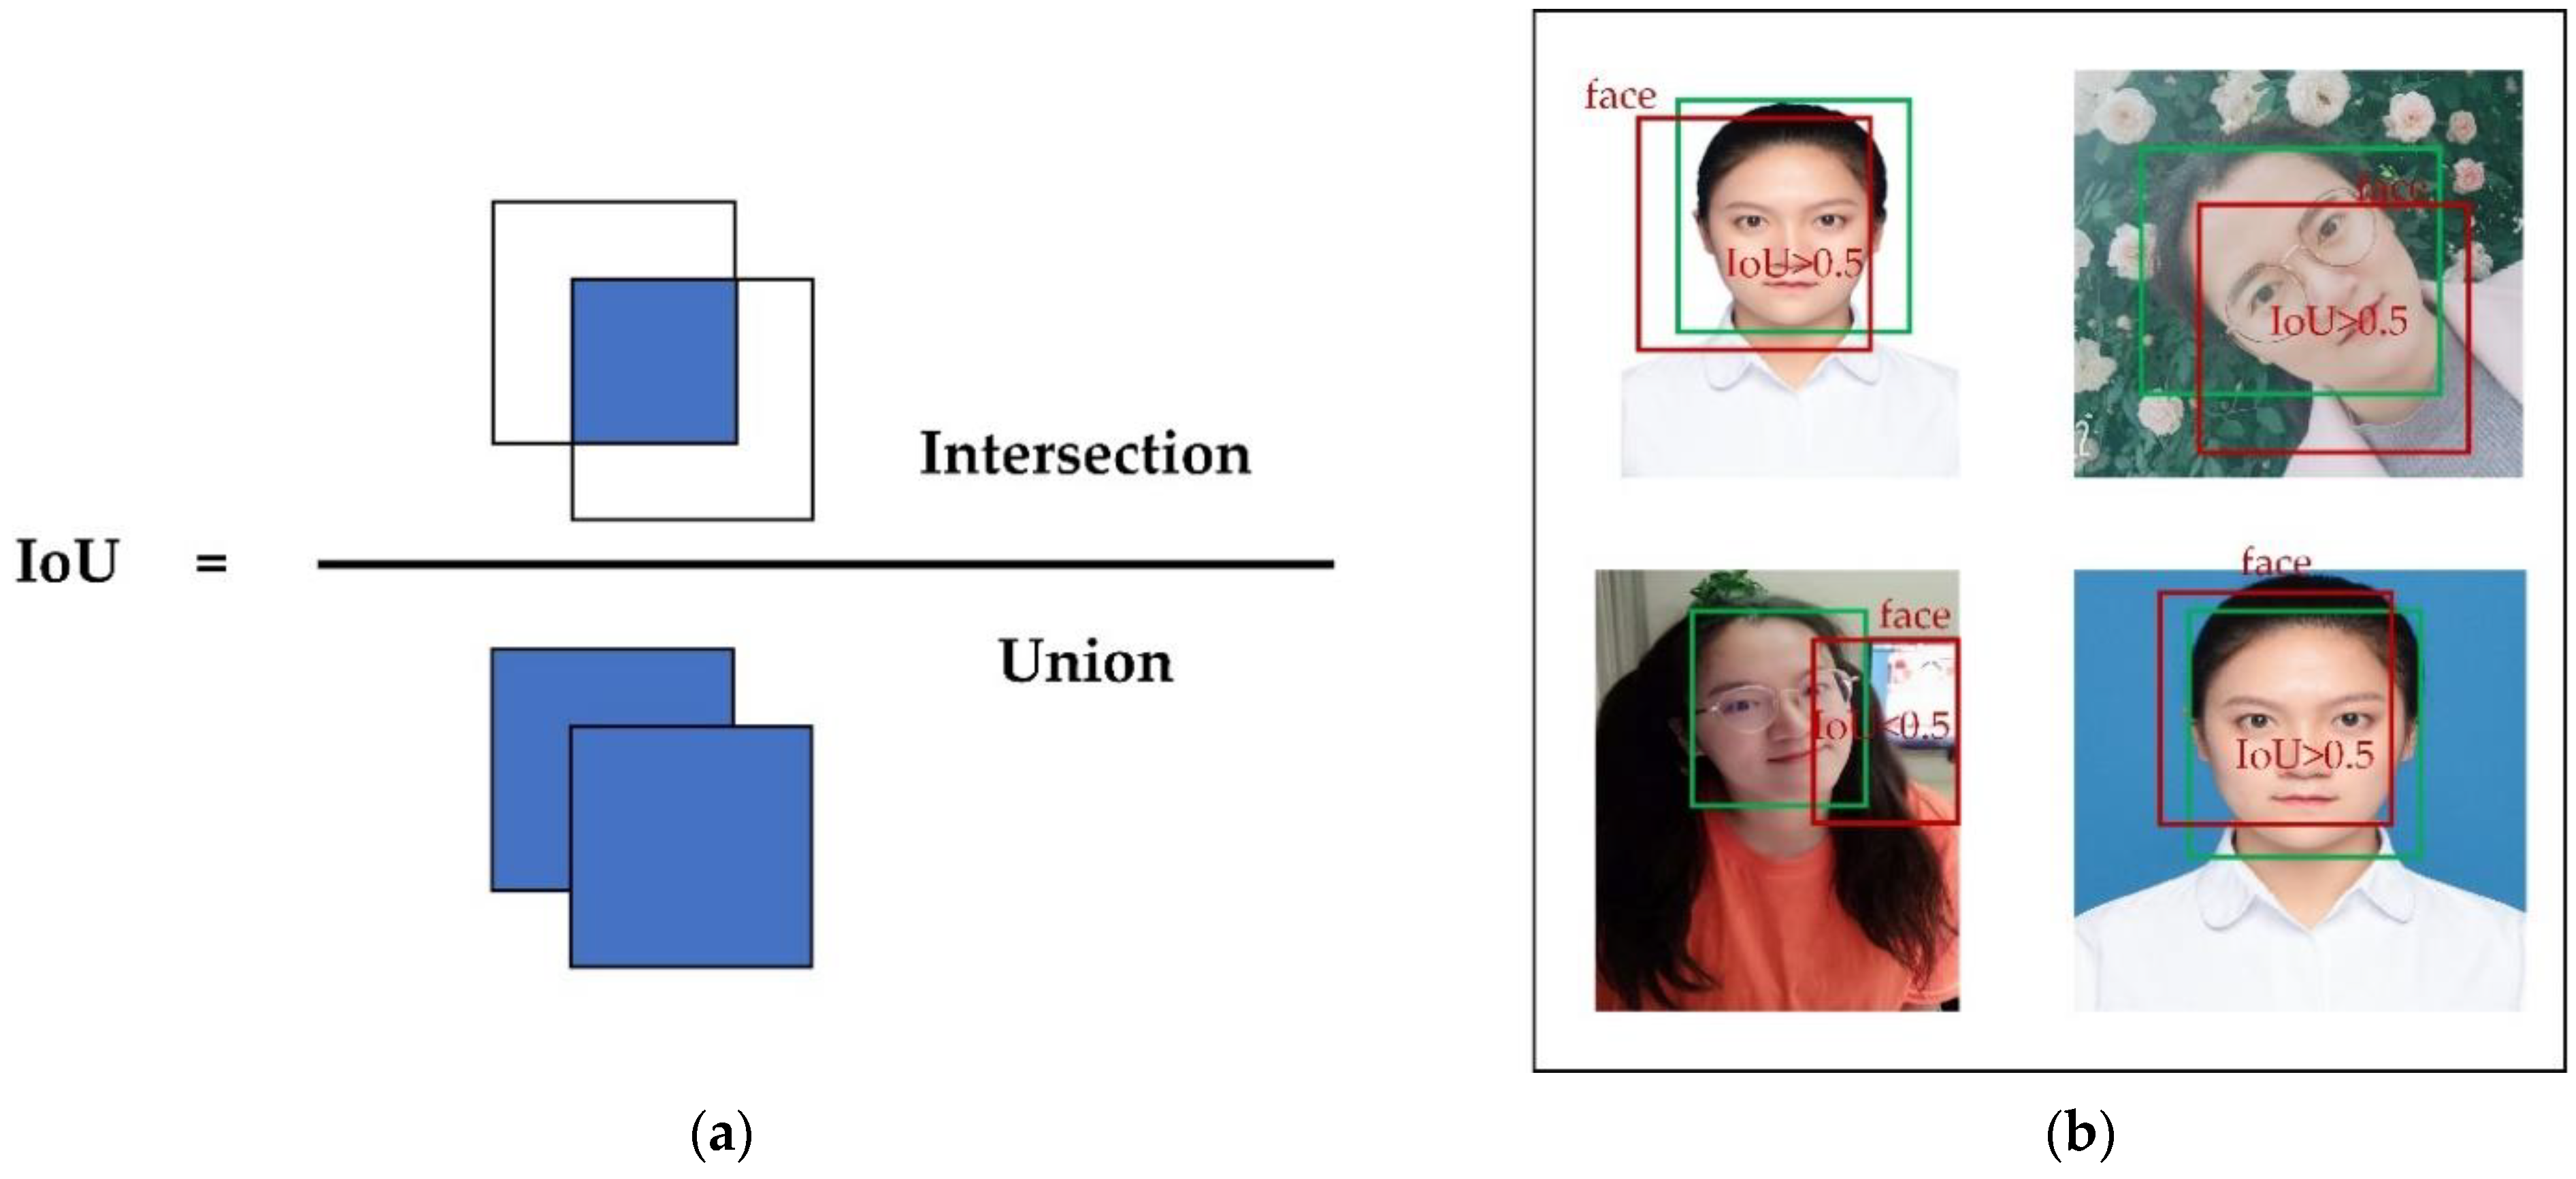
4.3. Improvement in Non-Maximum Suppression
4.4. YOLOv5-CBD Network Structure
5. Experiments and Results
5.1. Dataset
5.2. Evaluation Metrics
5.3. Training
5.3.1. Experimental Environment and Parameter Setting
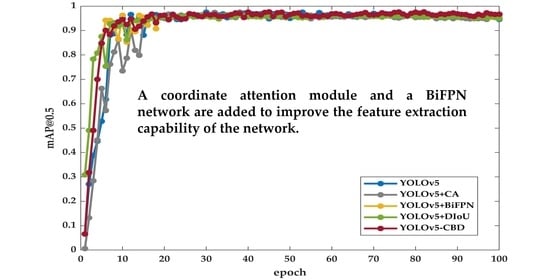
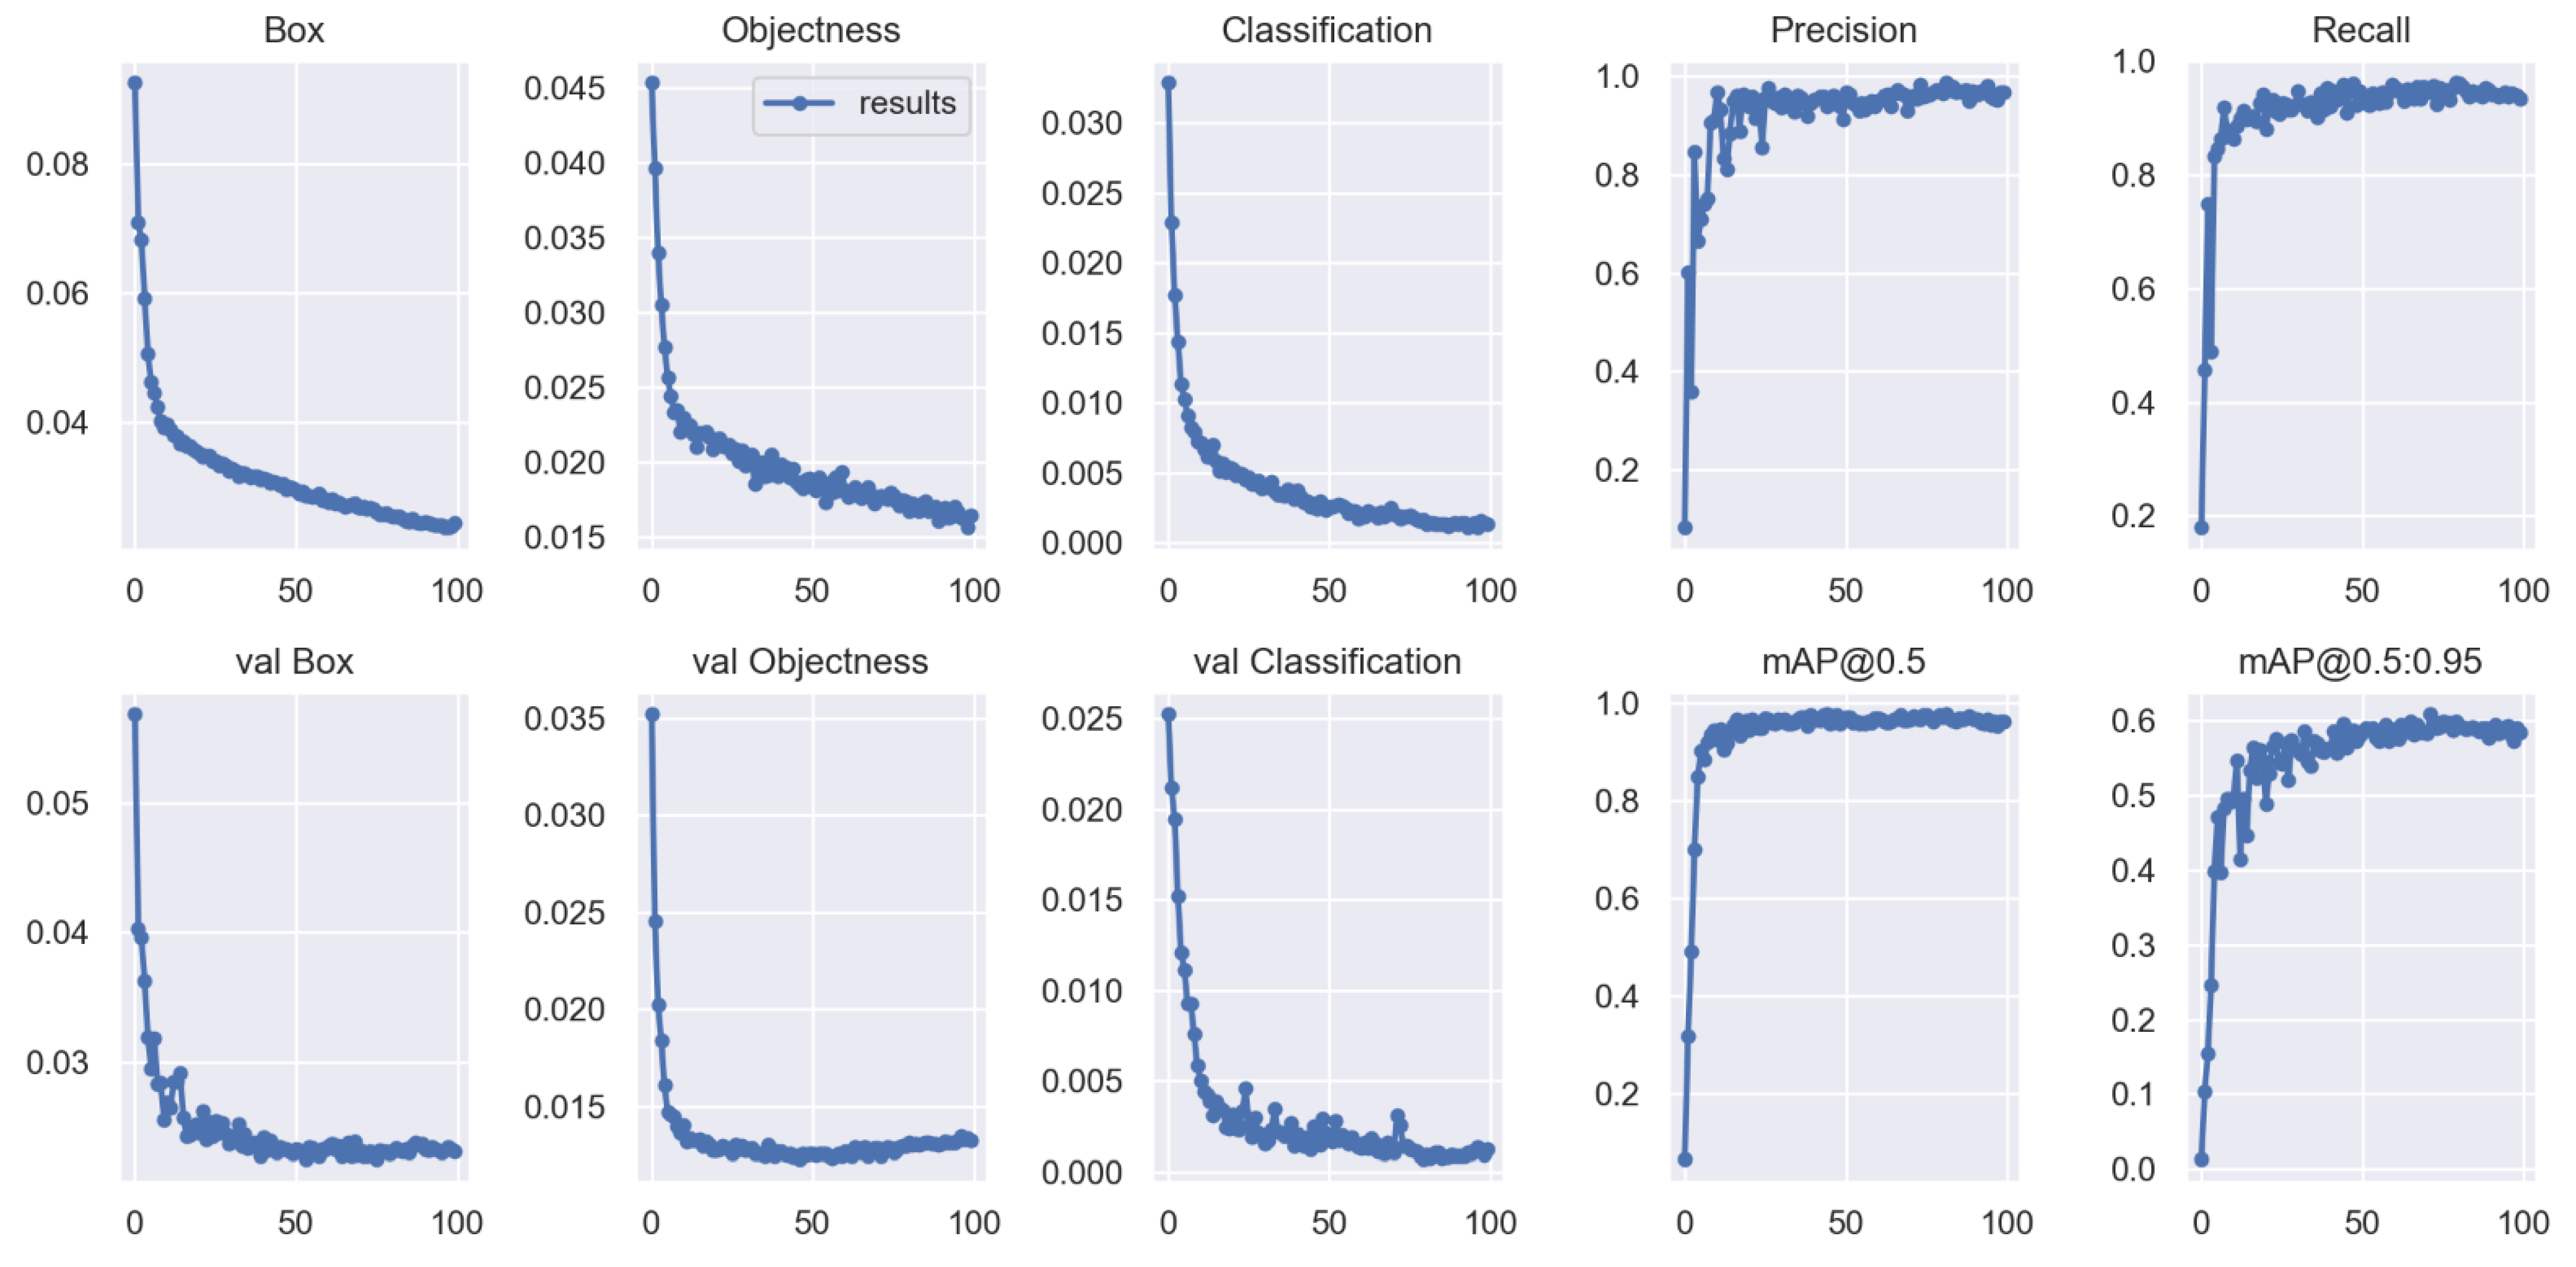
5.3.2. Training Result
5.4. Analysis of Experimental Results
5.4.1. Comparison Experiment
5.4.2. Ablation Experiment
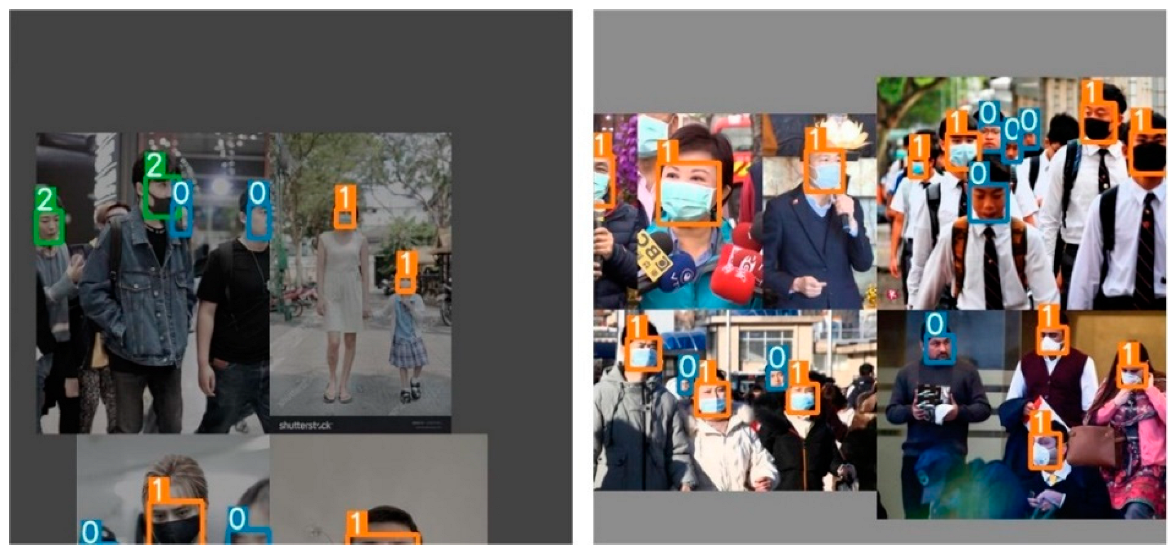
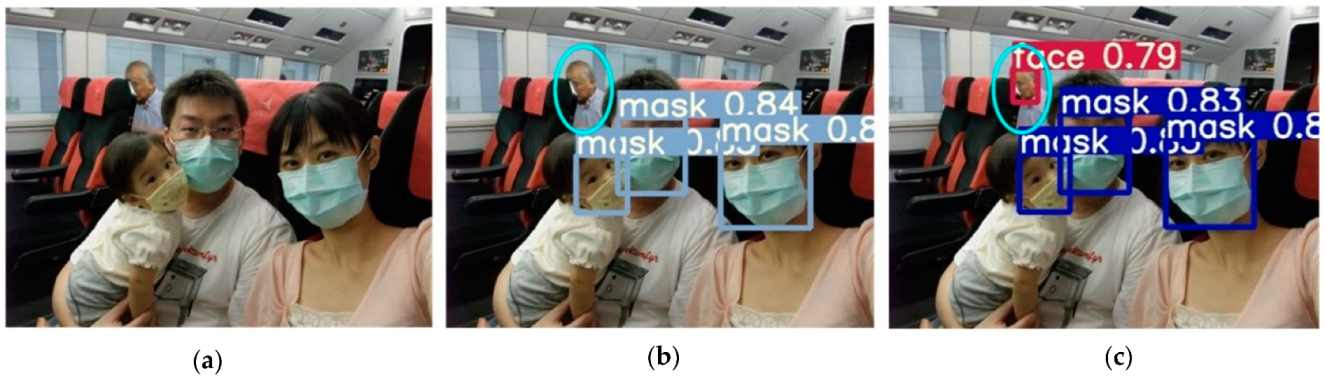
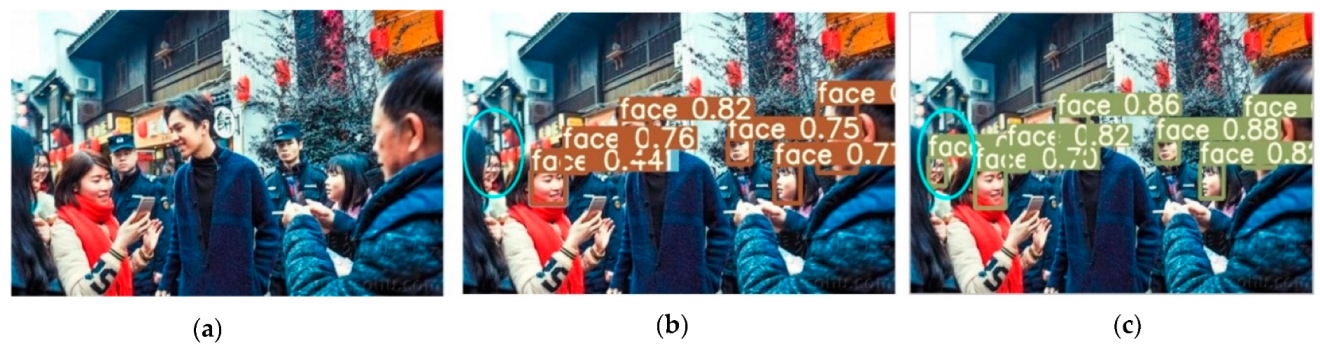
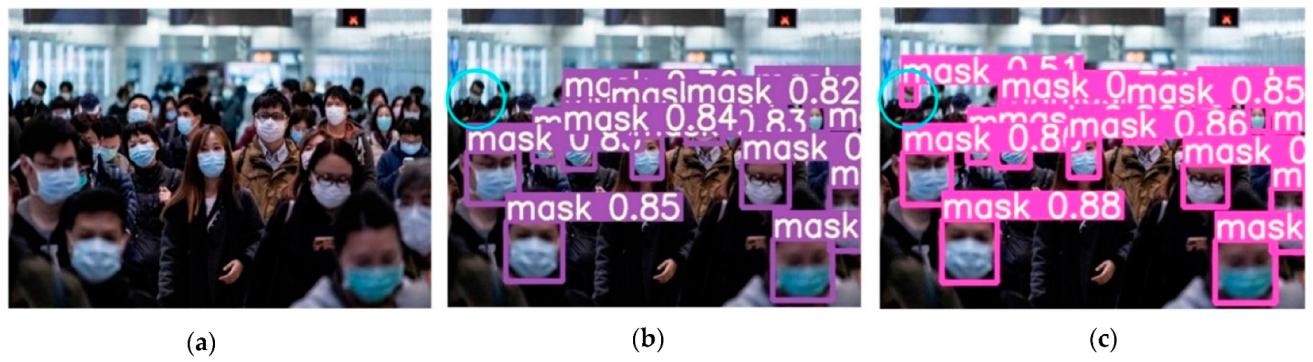
5.5. Analysis of Detection Results
6. Conclusions
Author Contributions
Funding
Institutional Review Board Statement
Informed Consent Statement
Data Availability Statement
Acknowledgments
Conflicts of Interest
References
- Xie, L.; Ahmad, T.; Jin, L.; Liu, Y.; Zhang, S. A new CNN-based method for multi-directional car license plate detection. IEEE Trans. Intell. Transp. Syst. 2018, 19, 507–517. [Google Scholar] [CrossRef]
- Li, H.; Wang, P.; Shen, C. Toward end-to-end car license plate detection and recognition with deep neural networks. IEEE Trans. Intell. Transp. Syst. 2018, 20, 1126–1136. [Google Scholar] [CrossRef]
- Zhang, J.; Zou, X.; Kuang, L.-D.; Wang, J.; Simon, S.R.; Yu, X. CCTSDB 2021: A More Comprehensive Traffic Sign Detection Benchmark. Hum.-Cent. Comput. Inf. Sci. 2022, 12, 23. [Google Scholar] [CrossRef]
- Qin, B.; Li, D. Identifying facemask-wearing condition using image super-resolution with classification network to prevent COVID-19. Sensors 2020, 20, 5236. [Google Scholar] [CrossRef] [PubMed]
- Kortli, Y.; Jridi, M.; Al Falou, A.; Atri, M. Face recognition systems: A survey. Sensors 2020, 20, 342. [Google Scholar] [CrossRef] [PubMed] [Green Version]
- Wu, M.; Awasthi, N.; Rad, N.M.; Pluim, J.P.; Lopata, R.G. Advanced Ultrasound and Photoacoustic Imaging in Cardiology. Sensors 2021, 21, 7947. [Google Scholar] [CrossRef] [PubMed]
- Hossain, S.; Lee, D.-j. Deep learning-based real-time multiple-object detection and tracking from aerial imagery via a flying robot with GPU-based embedded devices. Sensors 2019, 19, 3371. [Google Scholar] [CrossRef] [PubMed] [Green Version]
- Xia, R.; Chen, Y.; Ren, B. Improved anti-occlusion object tracking algorithm using Unscented Rauch-Tung-Striebel smoother and kernel correlation filter. J. King Saud Univ.-Comput. Inf. Sci. 2022, in press. [Google Scholar] [CrossRef]
- Girshick, R.; Donahue, J.; Darrell, T.; Malik, J. Rich feature hierarchies for accurate object detection and semantic segmentation. In Proceedings of the IEEE Conference on Computer Vision and Pattern Recognition, Columbus, OH, USA, 23–28 June 2014; pp. 580–587. [Google Scholar] [CrossRef] [Green Version]
- He, K.; Zhang, X.; Ren, S.; Sun, J. Spatial pyramid pooling in deep convolutional networks for visual recognition. IEEE Trans. Pattern Anal. Mach. Intell. 2015, 37, 1904–1916. [Google Scholar] [CrossRef] [PubMed] [Green Version]
- Girshick, R. Fast r-cnn. In Proceedings of the IEEE International Conference on Computer Vision, Santiago, Chile, 7–13 December 2015; pp. 1440–1448. [Google Scholar] [CrossRef]
- Ren, S.; He, K.; Girshick, R.; Sun, J. Faster r-cnn: Towards real-time object detection with region proposal networks. IEEE Trans. Pattern Anal. Mach. Intell. 2017, 39, 1137–1149. [Google Scholar] [CrossRef] [PubMed] [Green Version]
- He, K.; Gkioxari, G.; Dollár, P.; Girshick, R. Mask r-cnn. In Proceedings of the IEEE International Conference on Computer Vision, Venice, Italy, 22–29 October 2017; pp. 2961–2969. [Google Scholar] [CrossRef]
- Lin, T.-Y.; Dollár, P.; Girshick, R.; He, K.; Hariharan, B.; Belongie, S. Feature pyramid networks for object detection. In Proceedings of the IEEE Conference on Computer Vision and Pattern Recognition, Honolulu, HI, USA, 21–26 July 2017; pp. 2117–2125. [Google Scholar] [CrossRef] [Green Version]
- Redmon, J.; Divvala, S.; Girshick, R.; Farhadi, A. You only look once: Unified, real-time object detection. In Proceedings of the IEEE Conference on Computer Vision and Pattern Recognition, Las Vegas, NV, USA, 27–30 June 2016; pp. 779–788. [Google Scholar] [CrossRef] [Green Version]
- Redmon, J.; Farhadi, A. YOLO9000: Better, faster, stronger. In Proceedings of the IEEE Conference on Computer Vision and Pattern Recognition, Honolulu, HI, USA, 21–26 July 2017; pp. 7263–7271. [Google Scholar] [CrossRef] [Green Version]
- Redmon, J.; Farhadi, A. Yolov3: An incremental improvement. arXiv 2018, arXiv:1804.02767. [Google Scholar] [CrossRef]
- Bochkovskiy, A.; Wang, C.-Y.; Liao, H.-Y.M. Yolov4: Optimal speed and accuracy of object detection. arXiv 2020, arXiv:2004.10934. [Google Scholar] [CrossRef]
- Liu, W.; Anguelov, D.; Erhan, D.; Szegedy, C.; Reed, S.; Fu, C.-Y.; Berg, A.C. Ssd: Single shot multibox detector. In Proceedings of the European Conference on Computer Vision, Amsterdam, The Netherlands, 8–16 October 2016; pp. 21–37. [Google Scholar] [CrossRef]
- Fu, C.-Y.; Liu, W.; Ranga, A.; Tyagi, A.; Berg, A.C. Dssd: Deconvolutional single shot detector. arXiv 2017, arXiv:1701.06659. [Google Scholar] [CrossRef]
- Lin, T.-Y.; Goyal, P.; Girshick, R.; He, K.; Dollár, P. Focal loss for dense object detection. In Proceedings of the IEEE International Conference on Computer Vision, Venice, Italy, 22–29 October 2017; pp. 2980–2988. [Google Scholar] [CrossRef] [Green Version]
- Tan, M.; Pang, R.; Le, Q.V. Efficientdet: Scalable and efficient object detection. In Proceedings of the IEEE/CVF Conference on Computer Vision and Pattern Recognition, Seattle, WA, USA, 13–19 June 2020; pp. 10781–10790. [Google Scholar] [CrossRef]
- Yihao, W.; Hongwei, D.; Bo, L. Mask wearing detection algorithm based on improved YOLOv3 in complex scenes. Comput. Eng. 2020, 46, 12–22. [Google Scholar] [CrossRef]
- Lei, G.; Qiulong, W.; Wei, X. Detection of Mask Wearing in Dim Light Based on Attention Mechanism. J. Univ. Electron. Sci. Technol. China 2022, 51, 7. [Google Scholar] [CrossRef]
- Wu, P.; Li, H.; Zeng, N.; Li, F. FMD-Yolo: An efficient face mask detection method for COVID-19 prevention and control in public. Image Vis. Comput. 2022, 117, 104341. [Google Scholar] [CrossRef] [PubMed]
- Loey, M.; Manogaran, G.; Taha, M.H.N.; Khalifa, N.E.M. Fighting against COVID-19: A novel deep learning model based on YOLO-v2 with ResNet-50 for medical face mask detection. Sustain. Cities 2021, 65, 102600. [Google Scholar] [CrossRef] [PubMed]
- Li, C.; Wang, R.; Li, J.; Fei, L. Face Detection Based on YOLOv3. In Recent Trends in Intelligent Computing, Communication and Devices; Springer: Singapore, 2020; pp. 277–284. [Google Scholar] [CrossRef]
- Nieto-Rodriguez, A.; Mucientes, M.; Brea, V.M. System for Medical Mask Detection in the Operating Room Through Facial Attributes. In Proceedings of the Iberian Conference on Pattern Recognition and Image Analysis, Santiago de Compostela, Spain, 17–19 June 2015; pp. 138–145. [Google Scholar] [CrossRef]
- Hou, Q.; Zhou, D.; Feng, J. Coordinate attention for efficient mobile network design. In Proceedings of the IEEE/CVF Conference on Computer Vision and Pattern Recognition, Nashville, TN, USA, 20–25 June 2021; pp. 13713–13722. [Google Scholar] [CrossRef]
- Zheng, Z.; Wang, P.; Liu, W.; Li, J.; Ye, R.; Ren, D. Distance-IoU loss: Faster and better learning for bounding box regression. In Proceedings of the AAAI Conference on Artificial Intelligence, New York, NY, USA, 7–12 February 2020; pp. 12993–13000. [Google Scholar] [CrossRef]
- Liu, S.; Qi, L.; Qin, H.; Shi, J.; Jia, J. Path aggregation network for instance segmentation. In Proceedings of the IEEE Conference on Computer Vision and Pattern Recognition, Salt Lake City, UT, USA, 18–23 June 2018; pp. 8759–8768. [Google Scholar] [CrossRef] [Green Version]
- Wang, Z.; Wang, G.; Huang, B.; Xiong, Z.; Hong, Q.; Wu, H.; Yi, P.; Jiang, K.; Wang, N.; Pei, Y. Masked Face Recognition Dataset and Application. Computer Vision and Pattern Recognition. arXiv 2020, arXiv:2003.09093. [Google Scholar] [CrossRef]
- Howard, A.; Sandler, M.; Chu, G.; Chen, L.-C.; Chen, B.; Tan, M.; Wang, W.; Zhu, Y.; Pang, R.; Vasudevan, V. Searching for Mobilenetv3. In Proceedings of the IEEE/CVF International Conference on Computer Vision, Seoul, Korea, 27 October–2 November 2019; pp. 1314–1324. [Google Scholar] [CrossRef]


| NO | Location of CA | Precision | Recall | mAP%@0.5 |
|---|---|---|---|---|
| 0 | Not added | 94.7% | 91.4% | 94.6% |
| 1 | Backbone (a) | 94.4% | 90.6% | 93.9% |
| 2 | Backbone (b) | 94.6% | 91.4% | 94.5% |
| 3 | Neck (c) | 95.8% | 92.8% | 95.2% |
| Dataset | Face | Mask | Mask Incorrectly |
|---|---|---|---|
| Training Set Objects | 1464 | 2841 | 353 |
| Validation Set Objects | 329 | 591 | 152 |
| Total | 1793 | 3432 | 505 |
| Hardware and Software Platforms | |
|---|---|
| The operating system | windows10 |
| CPU | Intel(R) Xeon(R) CPU E5-2699 v4 |
| GPU | NVIDIA Quadro M5000 |
| Development platform | PyTorch1.11.0 |
| Development of language | Python3.8 |
| Model | Precision | Recall | mAP@0.5 | One Image Test Time/s | FPS |
|---|---|---|---|---|---|
| Fast R-CNN | 84.1% | 81.6% | 82.9% | 0.244 | 4.1 |
| SSD | 80.1% | 77.3% | 78.3% | 0.12 | 8.3 |
| YOLOv3 | 93.1% | 86.4% | 91.2% | 0.075 | 13.3 |
| YOLOv4 | 93.6% | 90.3% | 92.1% | 0.052 | 19.2 |
| YOLOv5s | 94.7% | 91.4% | 94.6% | 0.032 | 31.3 |
| YOLOv5-CDB | 96.3% | 95.2% | 96.7% | 0.034 | 29 |
| NO | Model | Precision | Recall | mAP@0.5 | Inference Time/s | FPS |
|---|---|---|---|---|---|---|
| 1 | YOLOv5s | 94.7% | 91.4% | 94.6% | 0.032 | 31.3 |
| 2 | YOLOv5 + CA | 95.8% | 92.8% | 95.2% | 0.033 | 30.1 |
| 3 | YOLOv5 + BiFPN | 96.5% | 93.3% | 96.1% | 0.033 | 30.1 |
| 4 | YOLOv5 + DIOU-NMS | 96.3% | 92.8% | 95% | 0.030 | 33 |
| 5 | YOLOv5-CBD | 96.3% | 95.2% | 96.7% | 0.034 | 29 |
Publisher’s Note: MDPI stays neutral with regard to jurisdictional claims in published maps and institutional affiliations. |
© 2022 by the authors. Licensee MDPI, Basel, Switzerland. This article is an open access article distributed under the terms and conditions of the Creative Commons Attribution (CC BY) license (https://creativecommons.org/licenses/by/4.0/).
Share and Cite
Guo, S.; Li, L.; Guo, T.; Cao, Y.; Li, Y. Research on Mask-Wearing Detection Algorithm Based on Improved YOLOv5. Sensors 2022, 22, 4933. https://doi.org/10.3390/s22134933
Guo S, Li L, Guo T, Cao Y, Li Y. Research on Mask-Wearing Detection Algorithm Based on Improved YOLOv5. Sensors. 2022; 22(13):4933. https://doi.org/10.3390/s22134933
Chicago/Turabian StyleGuo, Shuyi, Lulu Li, Tianyou Guo, Yunyu Cao, and Yinlei Li. 2022. "Research on Mask-Wearing Detection Algorithm Based on Improved YOLOv5" Sensors 22, no. 13: 4933. https://doi.org/10.3390/s22134933
APA StyleGuo, S., Li, L., Guo, T., Cao, Y., & Li, Y. (2022). Research on Mask-Wearing Detection Algorithm Based on Improved YOLOv5. Sensors, 22(13), 4933. https://doi.org/10.3390/s22134933