
Implementing a Hand Gesture Recognition System Based on Range-Doppler Map


Abstract
:1. Introduction
- An image-based radar data collection software;
- A trigger algorithm for data collection;
- A gesture recognition model architecture.
2. Background and Related Work
2.1. Vision-Based Hand Gesture Recognition
2.2. Radar System
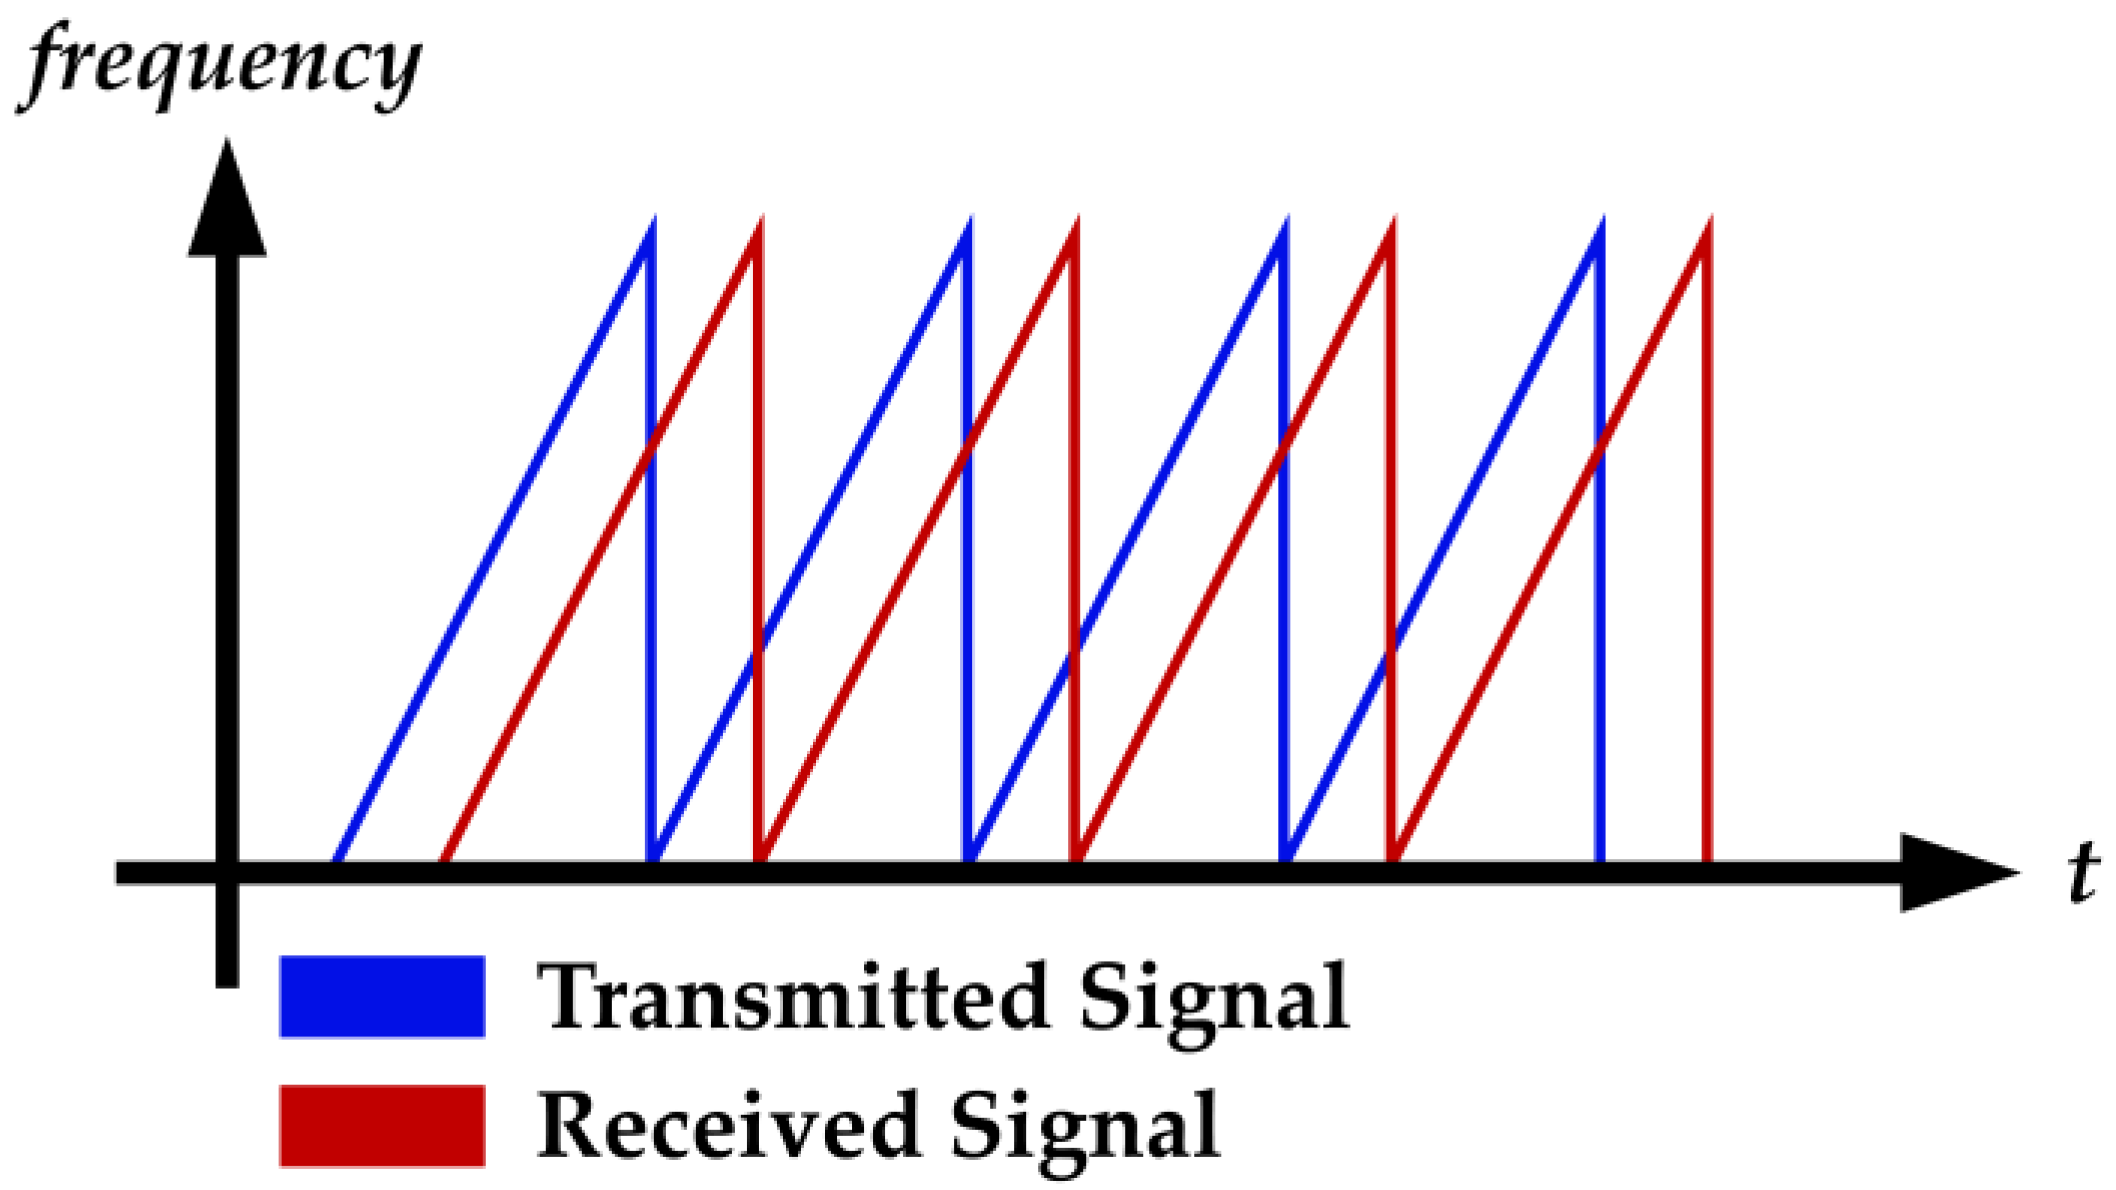
2.2.1. FMCW Radar
2.2.2. Hand Gesture Recognition with Radar System
3. Proposed Method
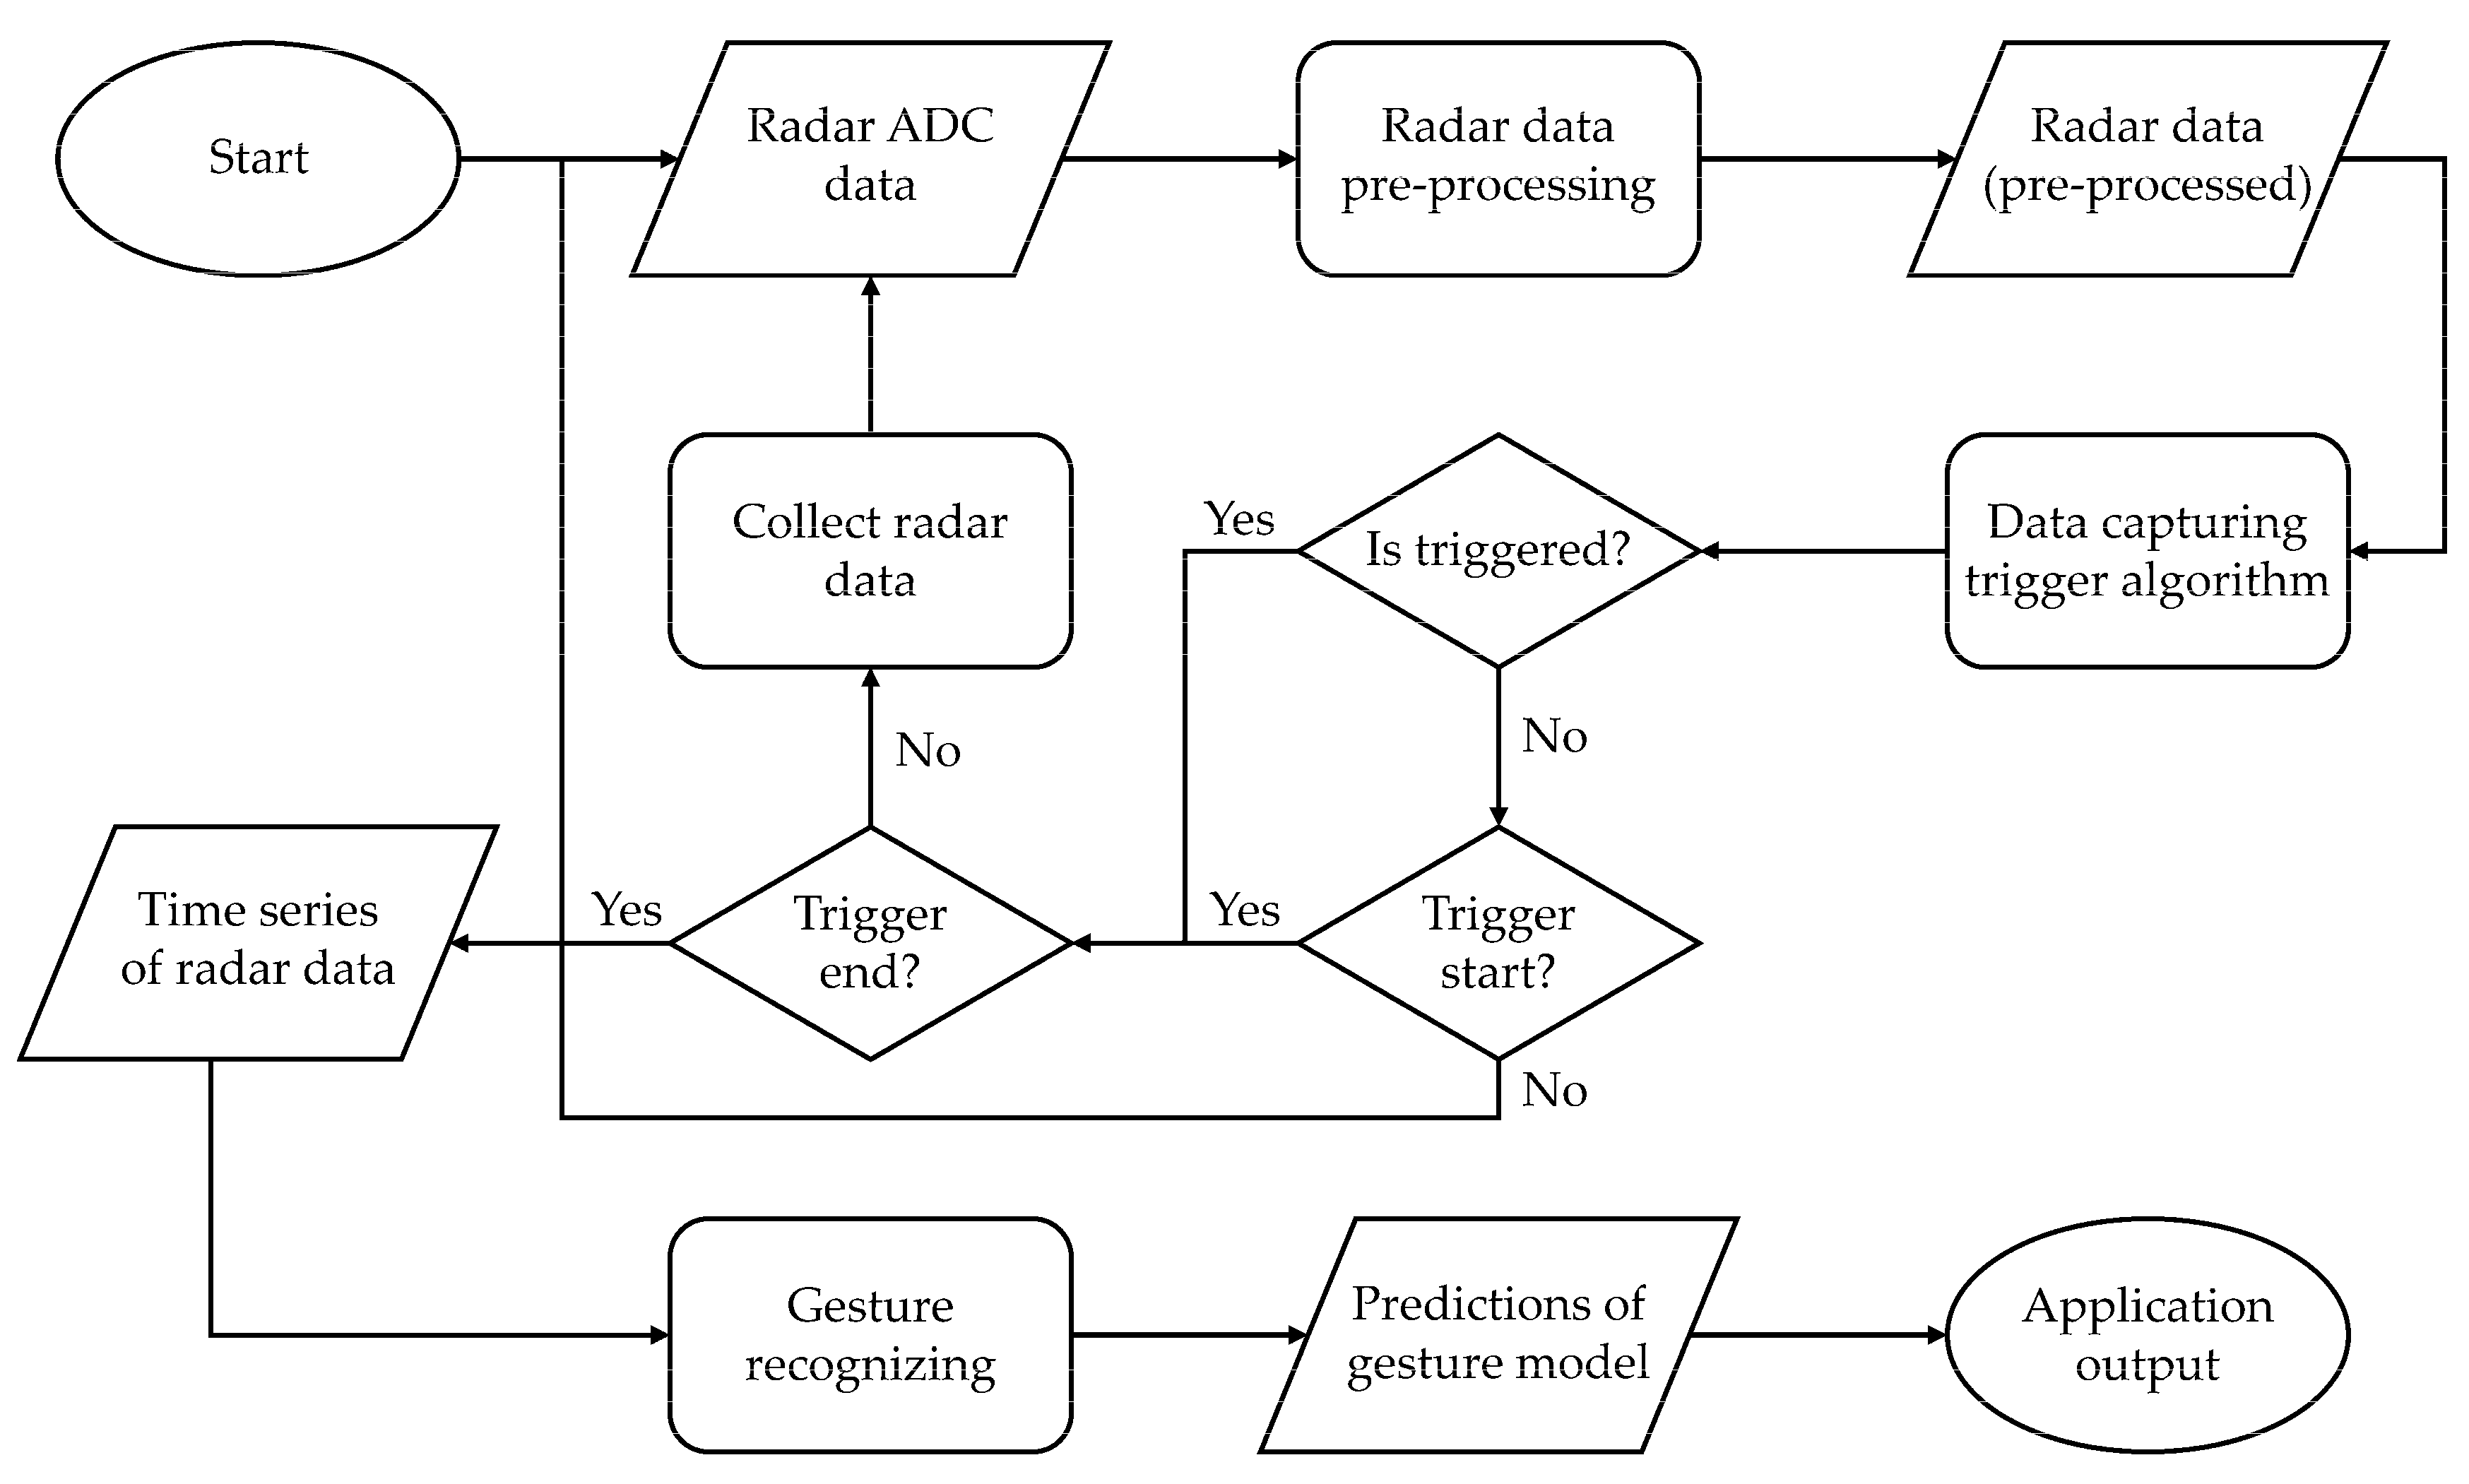
3.1. System Description
- Preprocessing radar data;
- Data capturing;
- Classification.
3.2. Preprocessing Radar Data
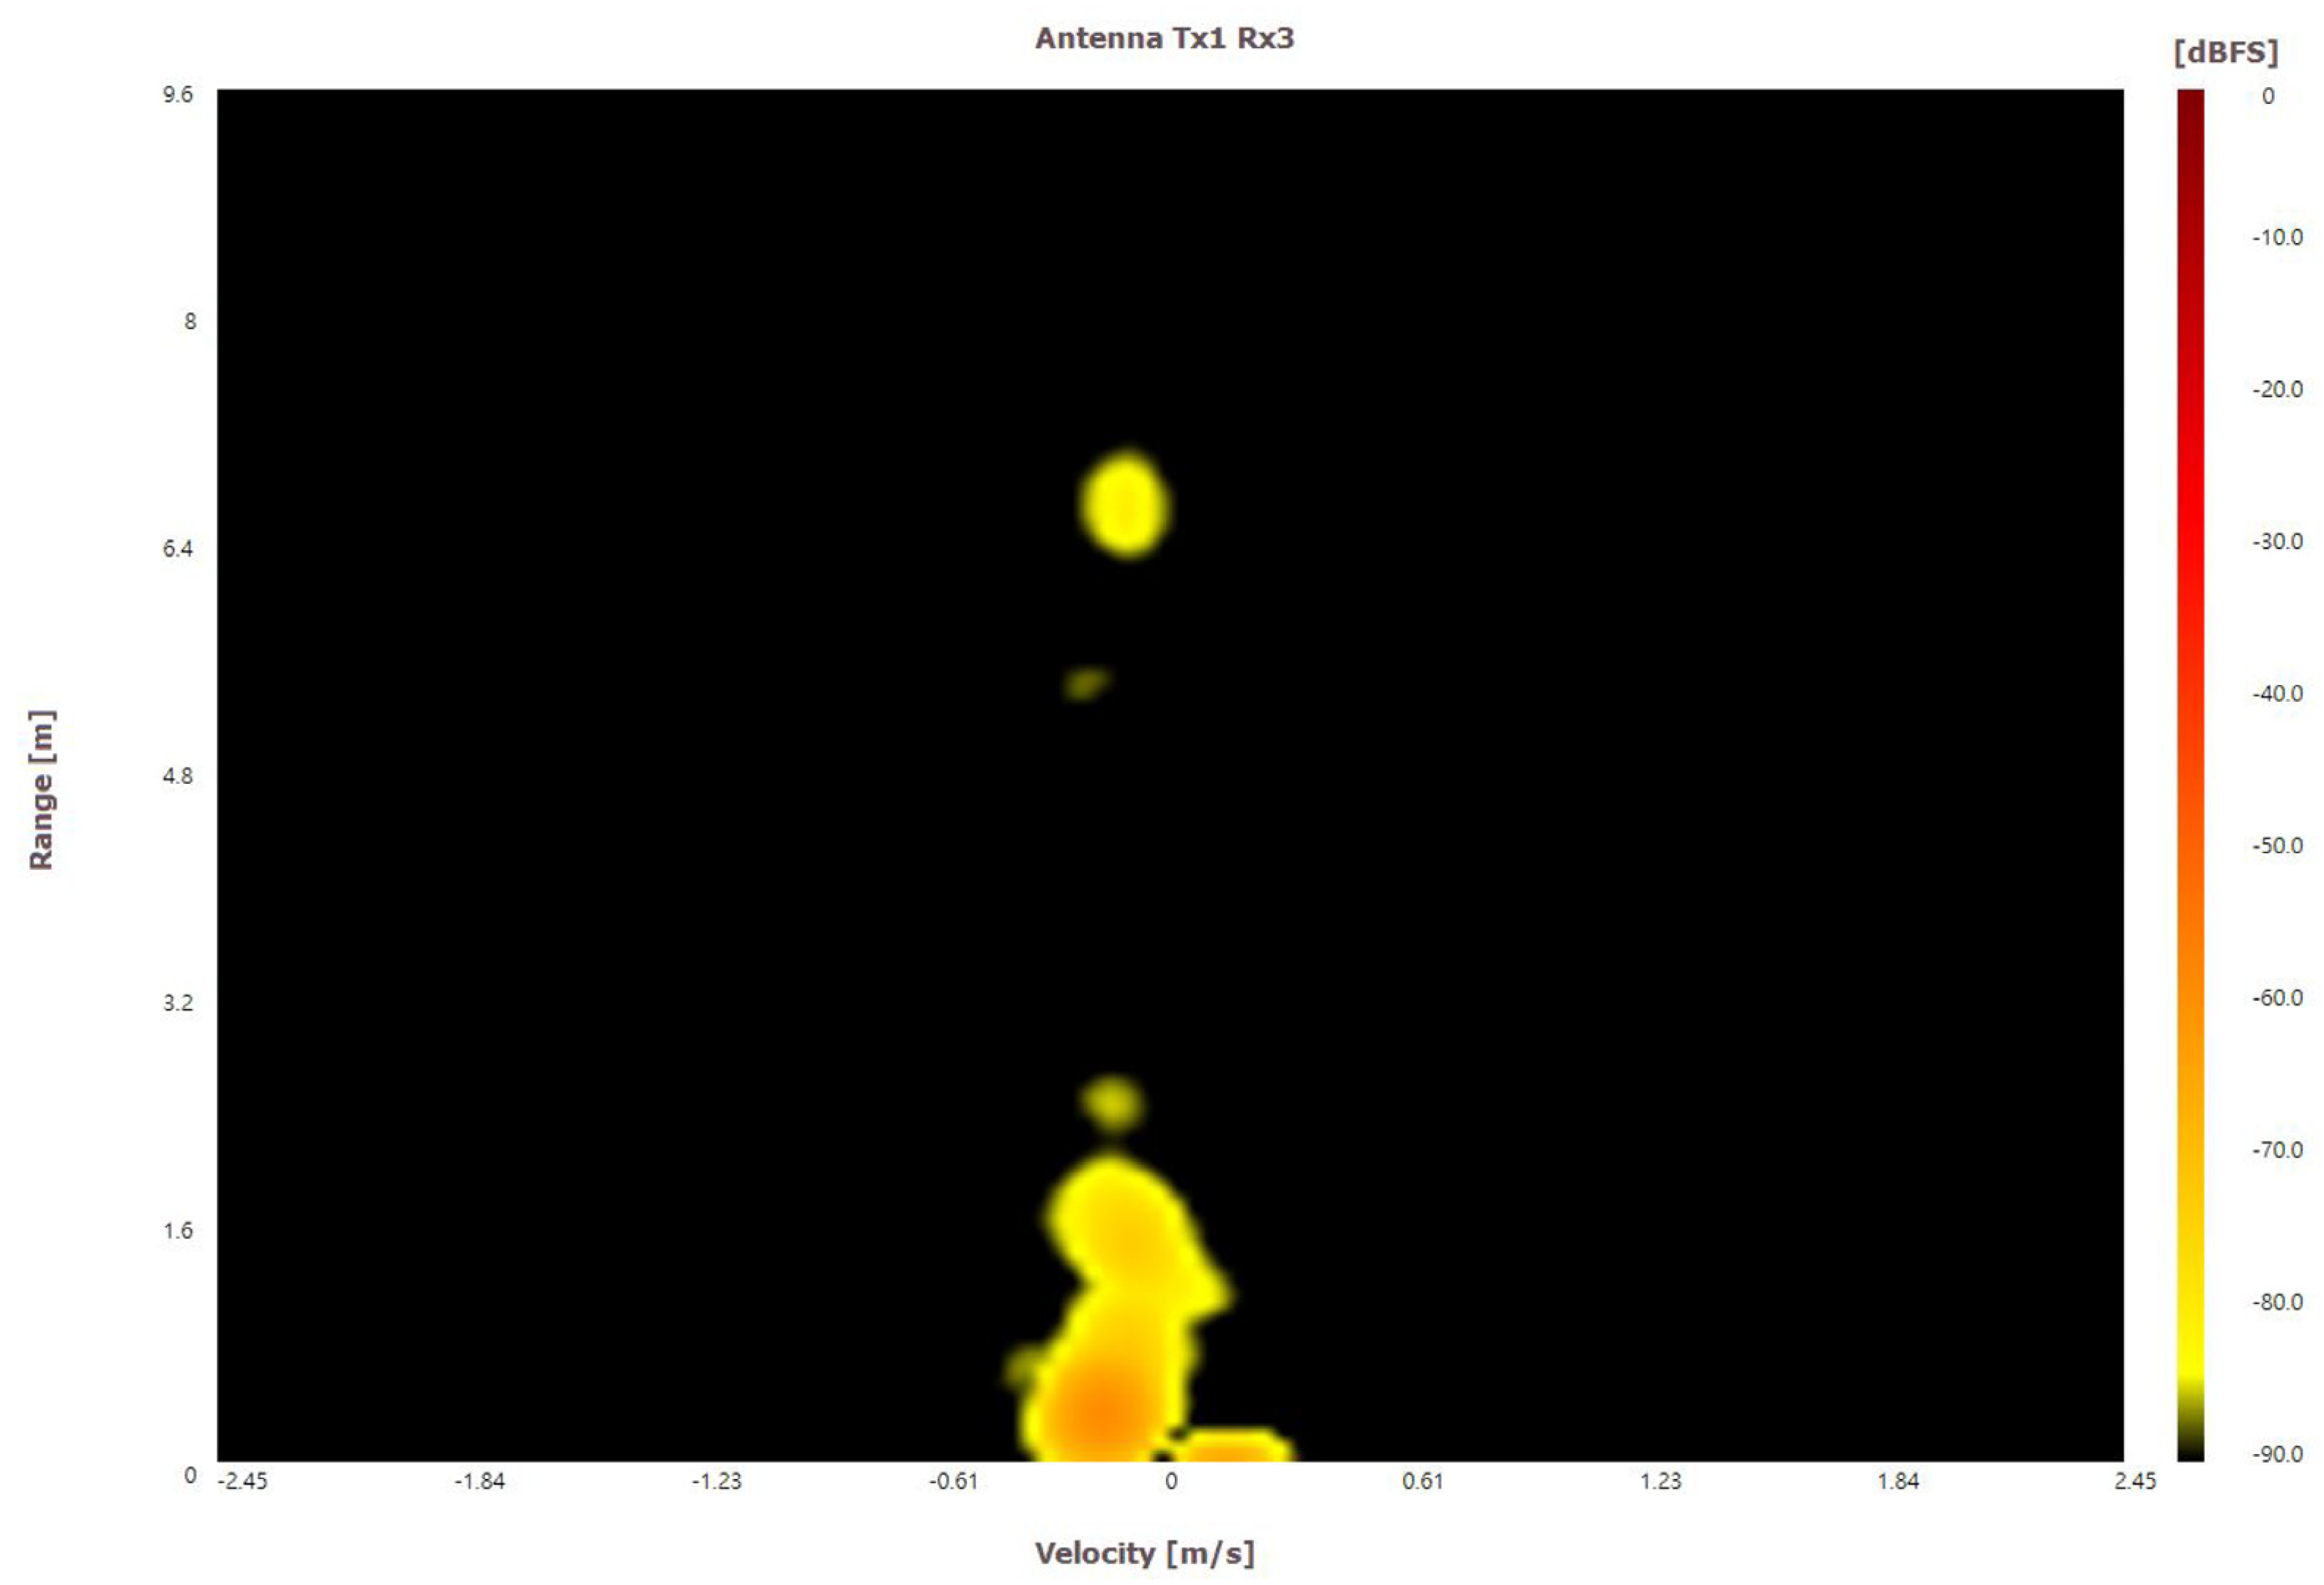
3.2.1. Processing Range–Doppler Maps
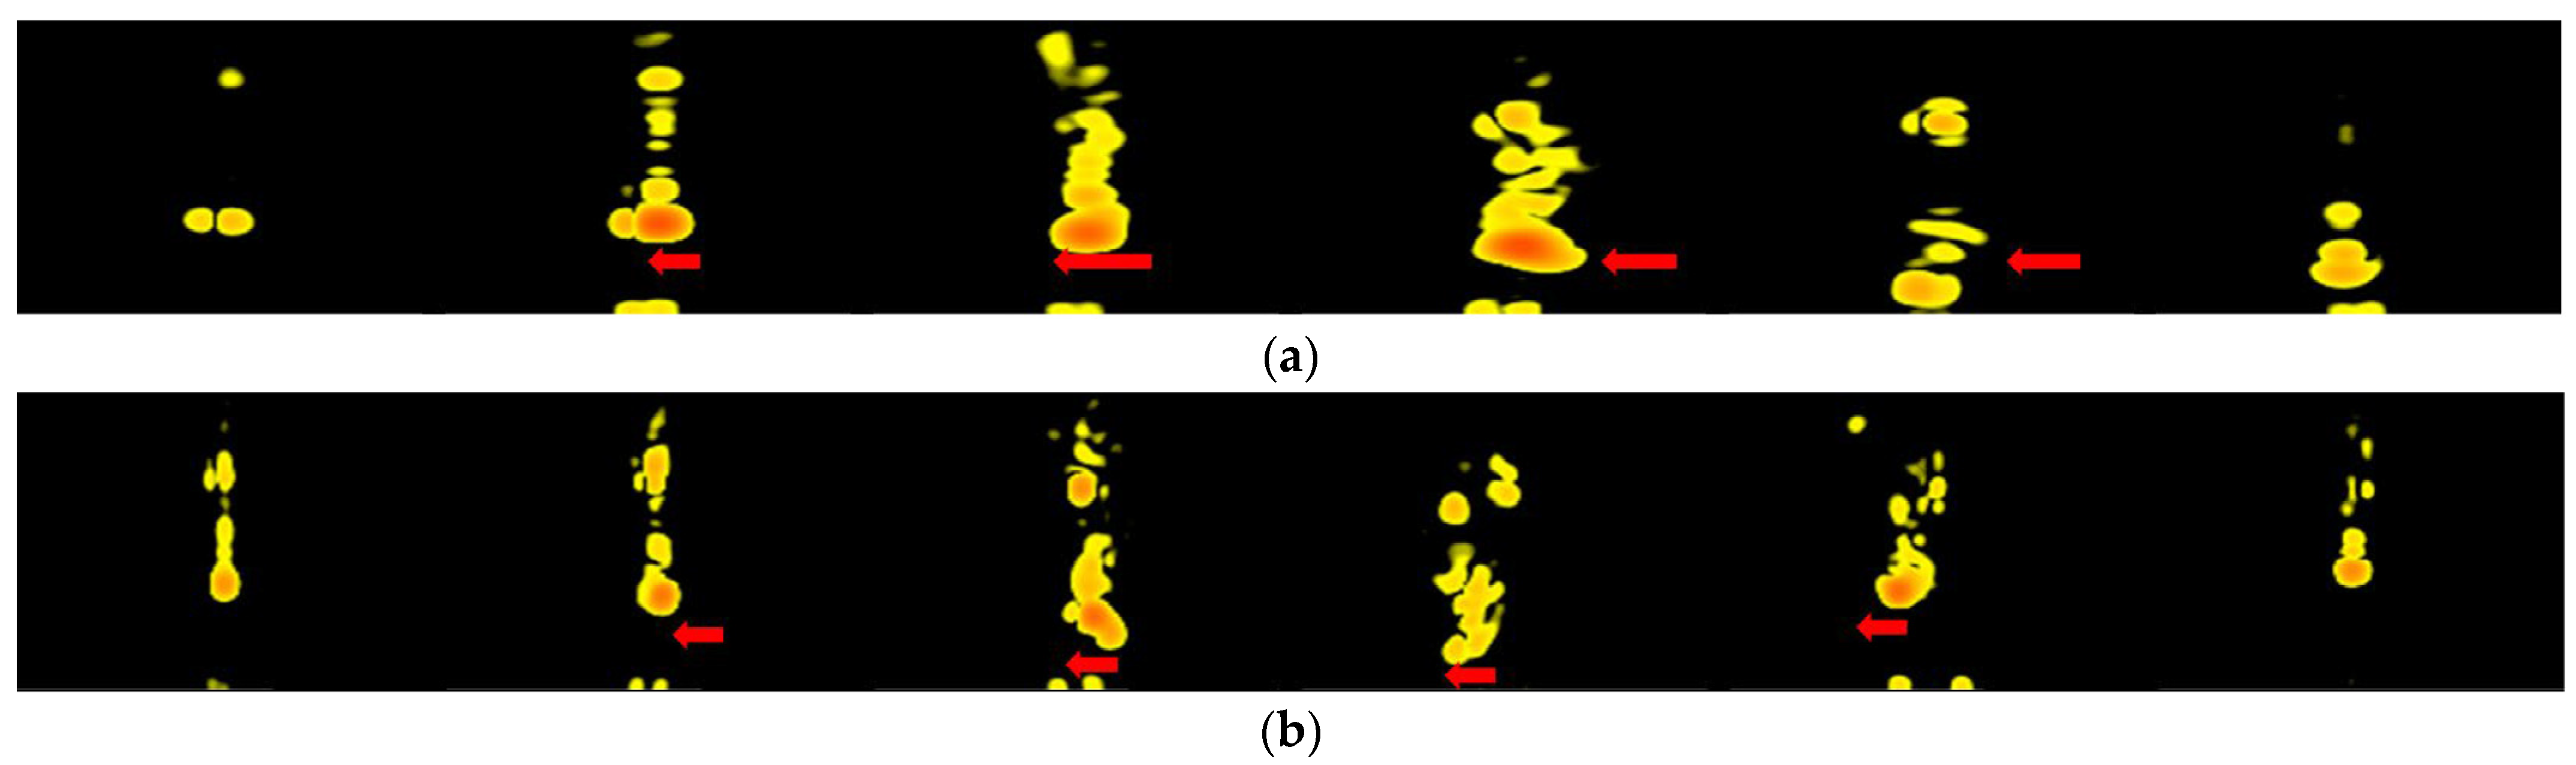
3.2.2. The Problems of Using Range–Doppler Map
The Position of Radar Sensor
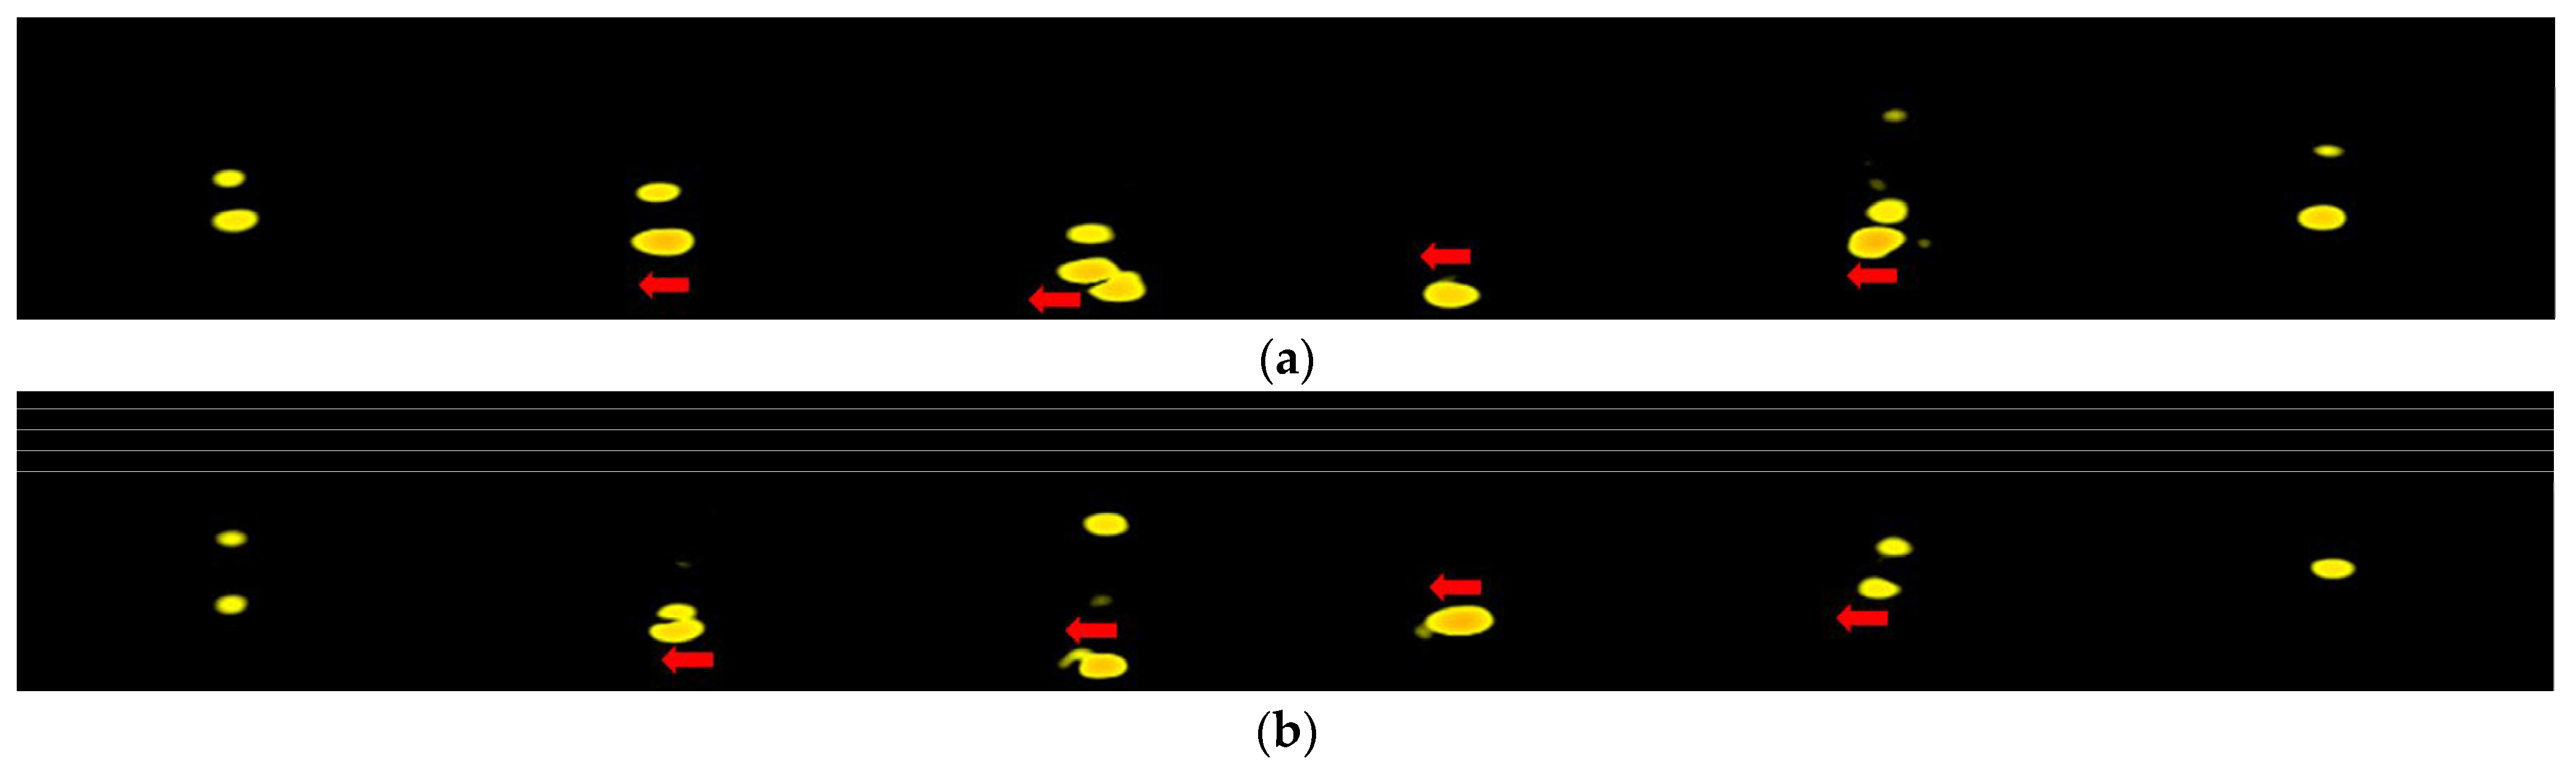
No Direction in Range–Doppler Map
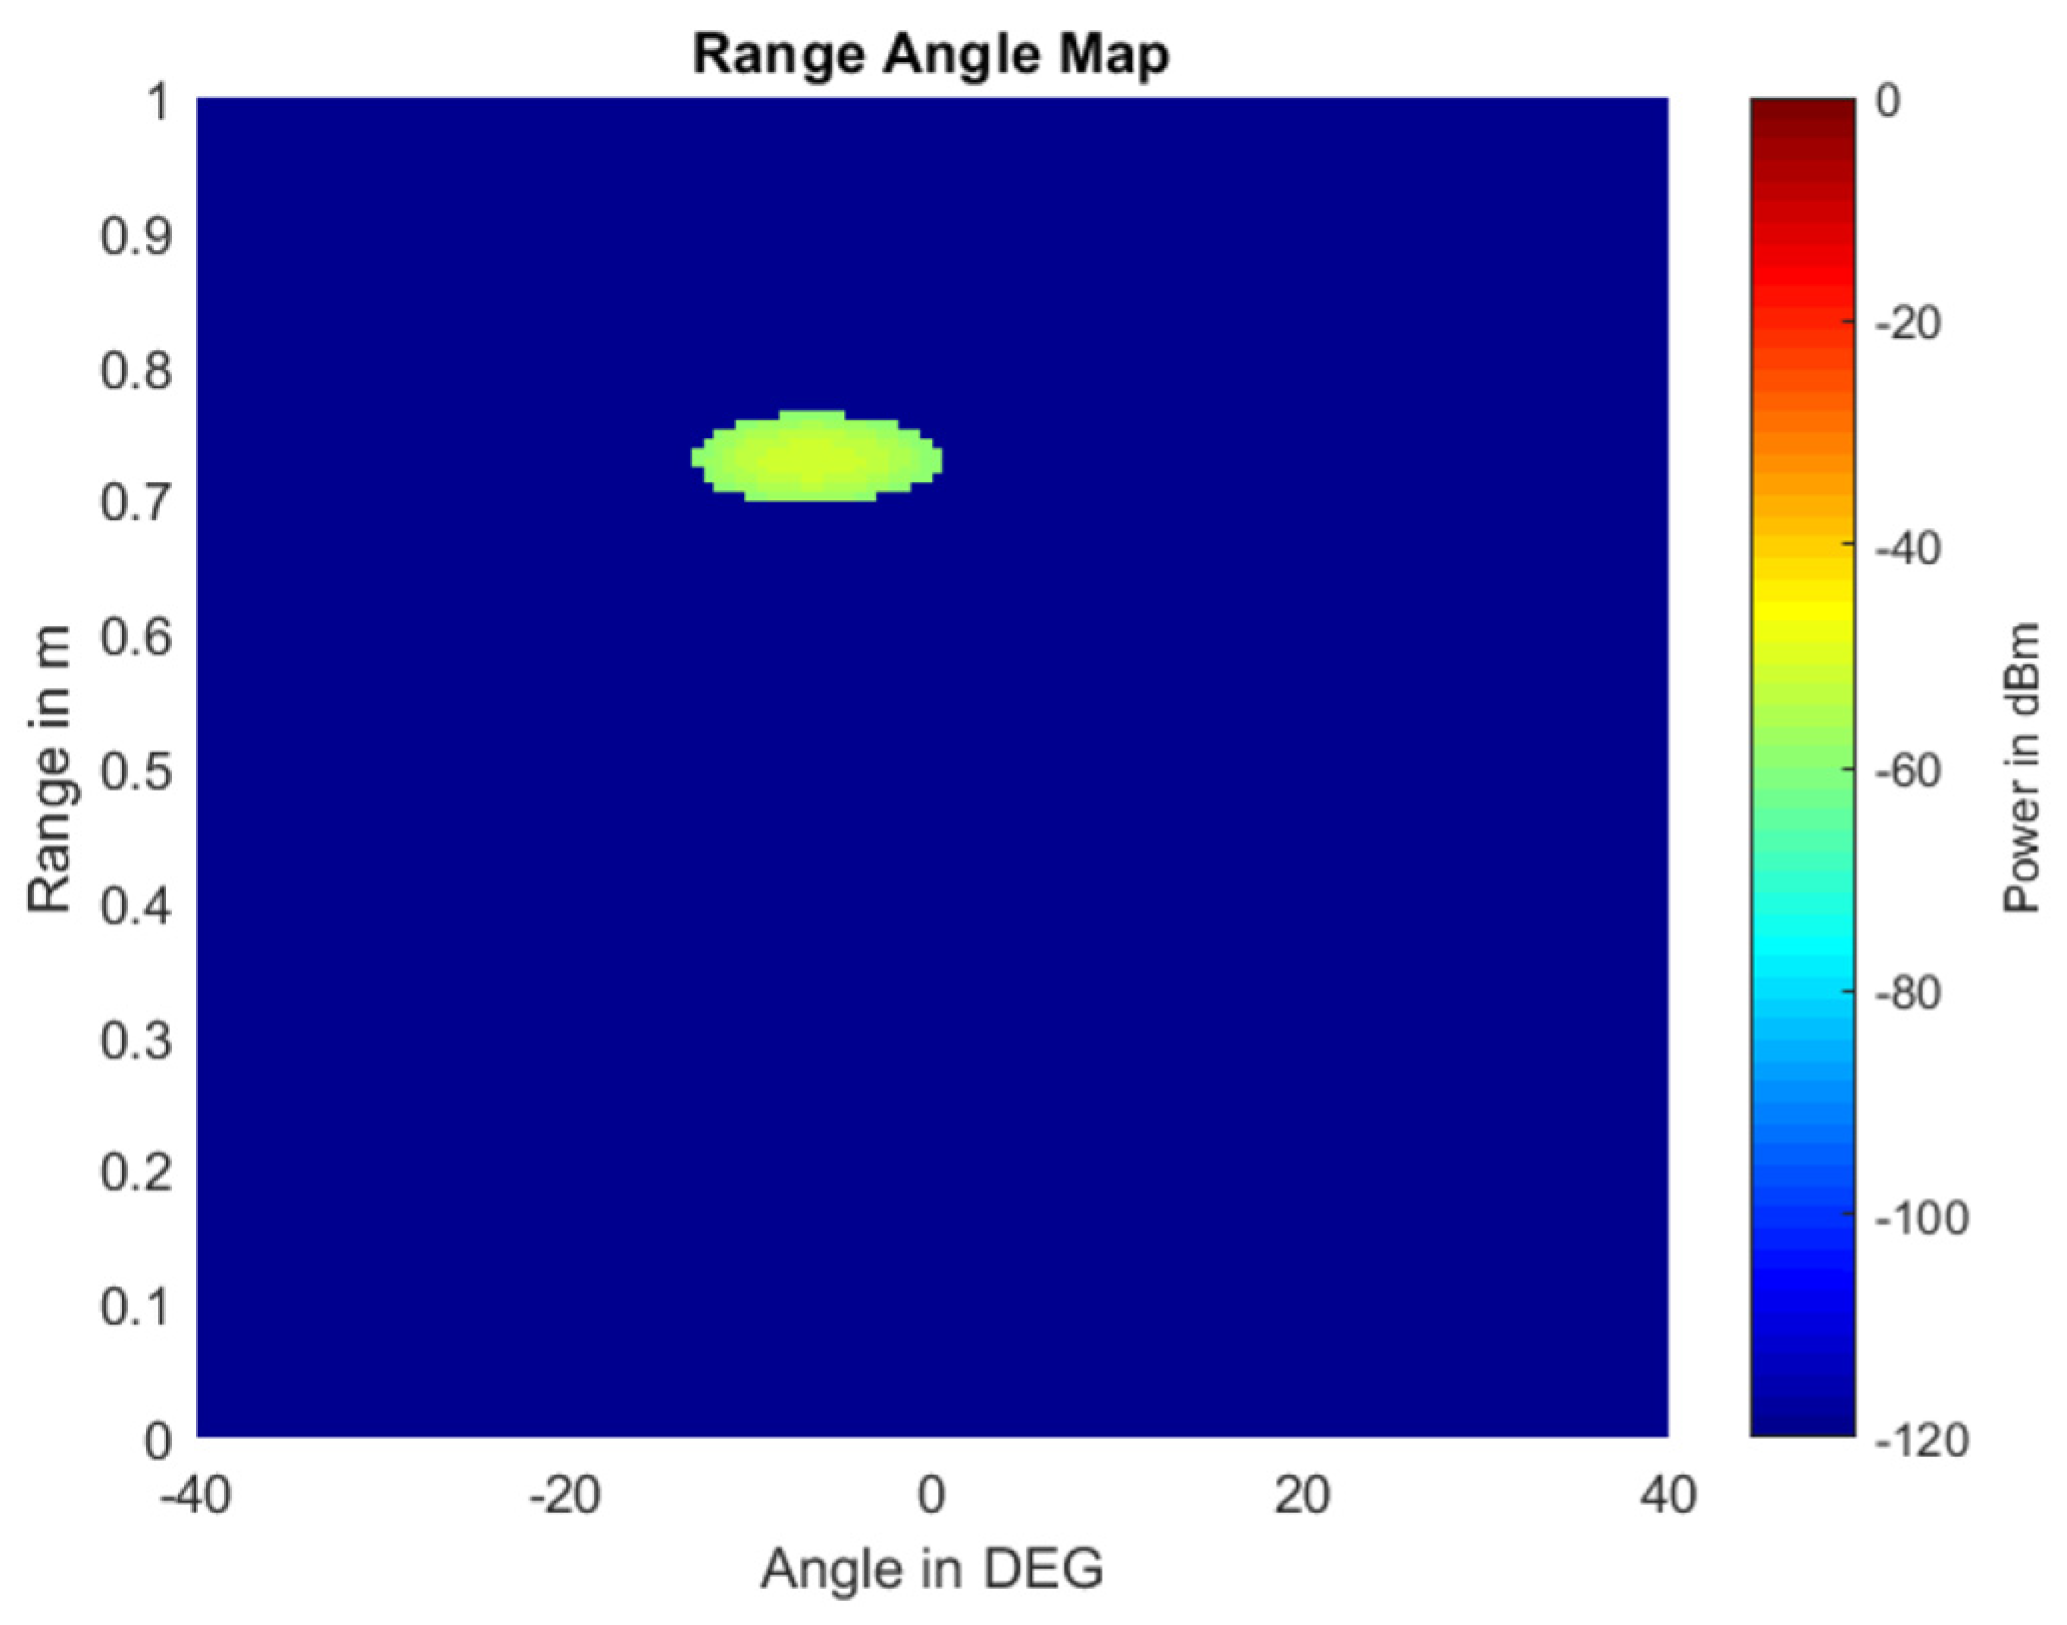
3.2.3. Using Range–Angle Map
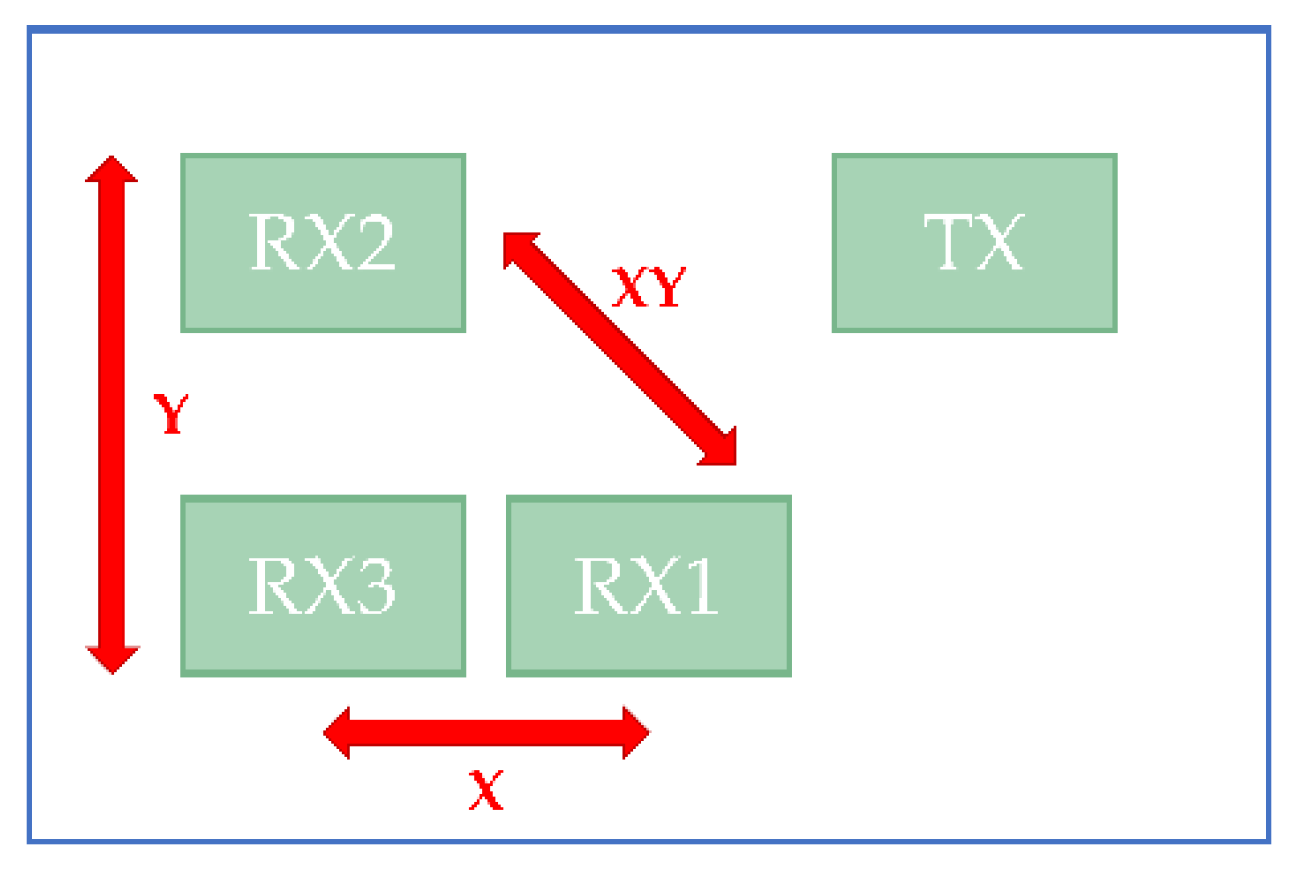
Setup Radar Antennas
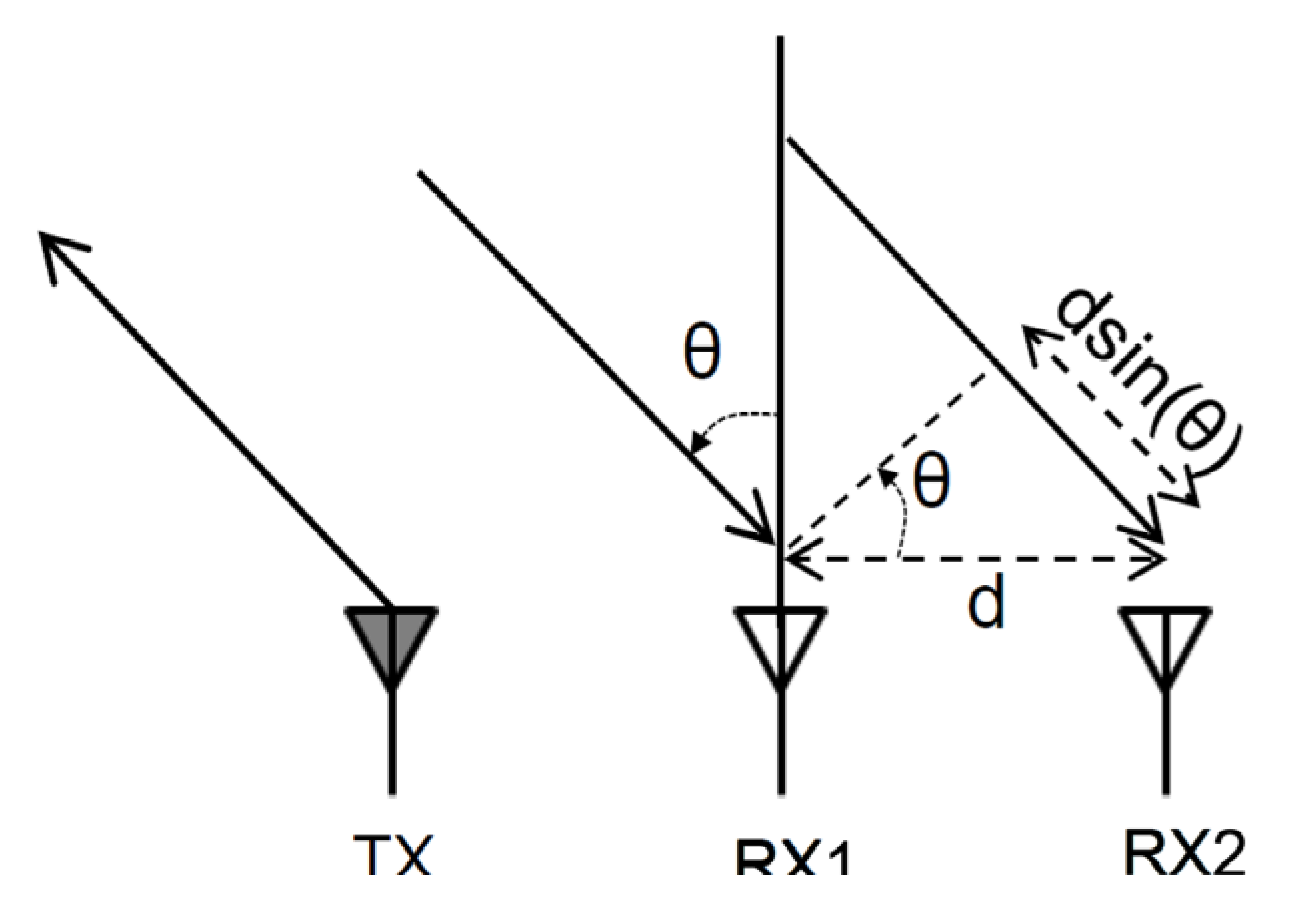
Calculate Angle of Arrival
3.2.4. Calculate Range–Angle Feature
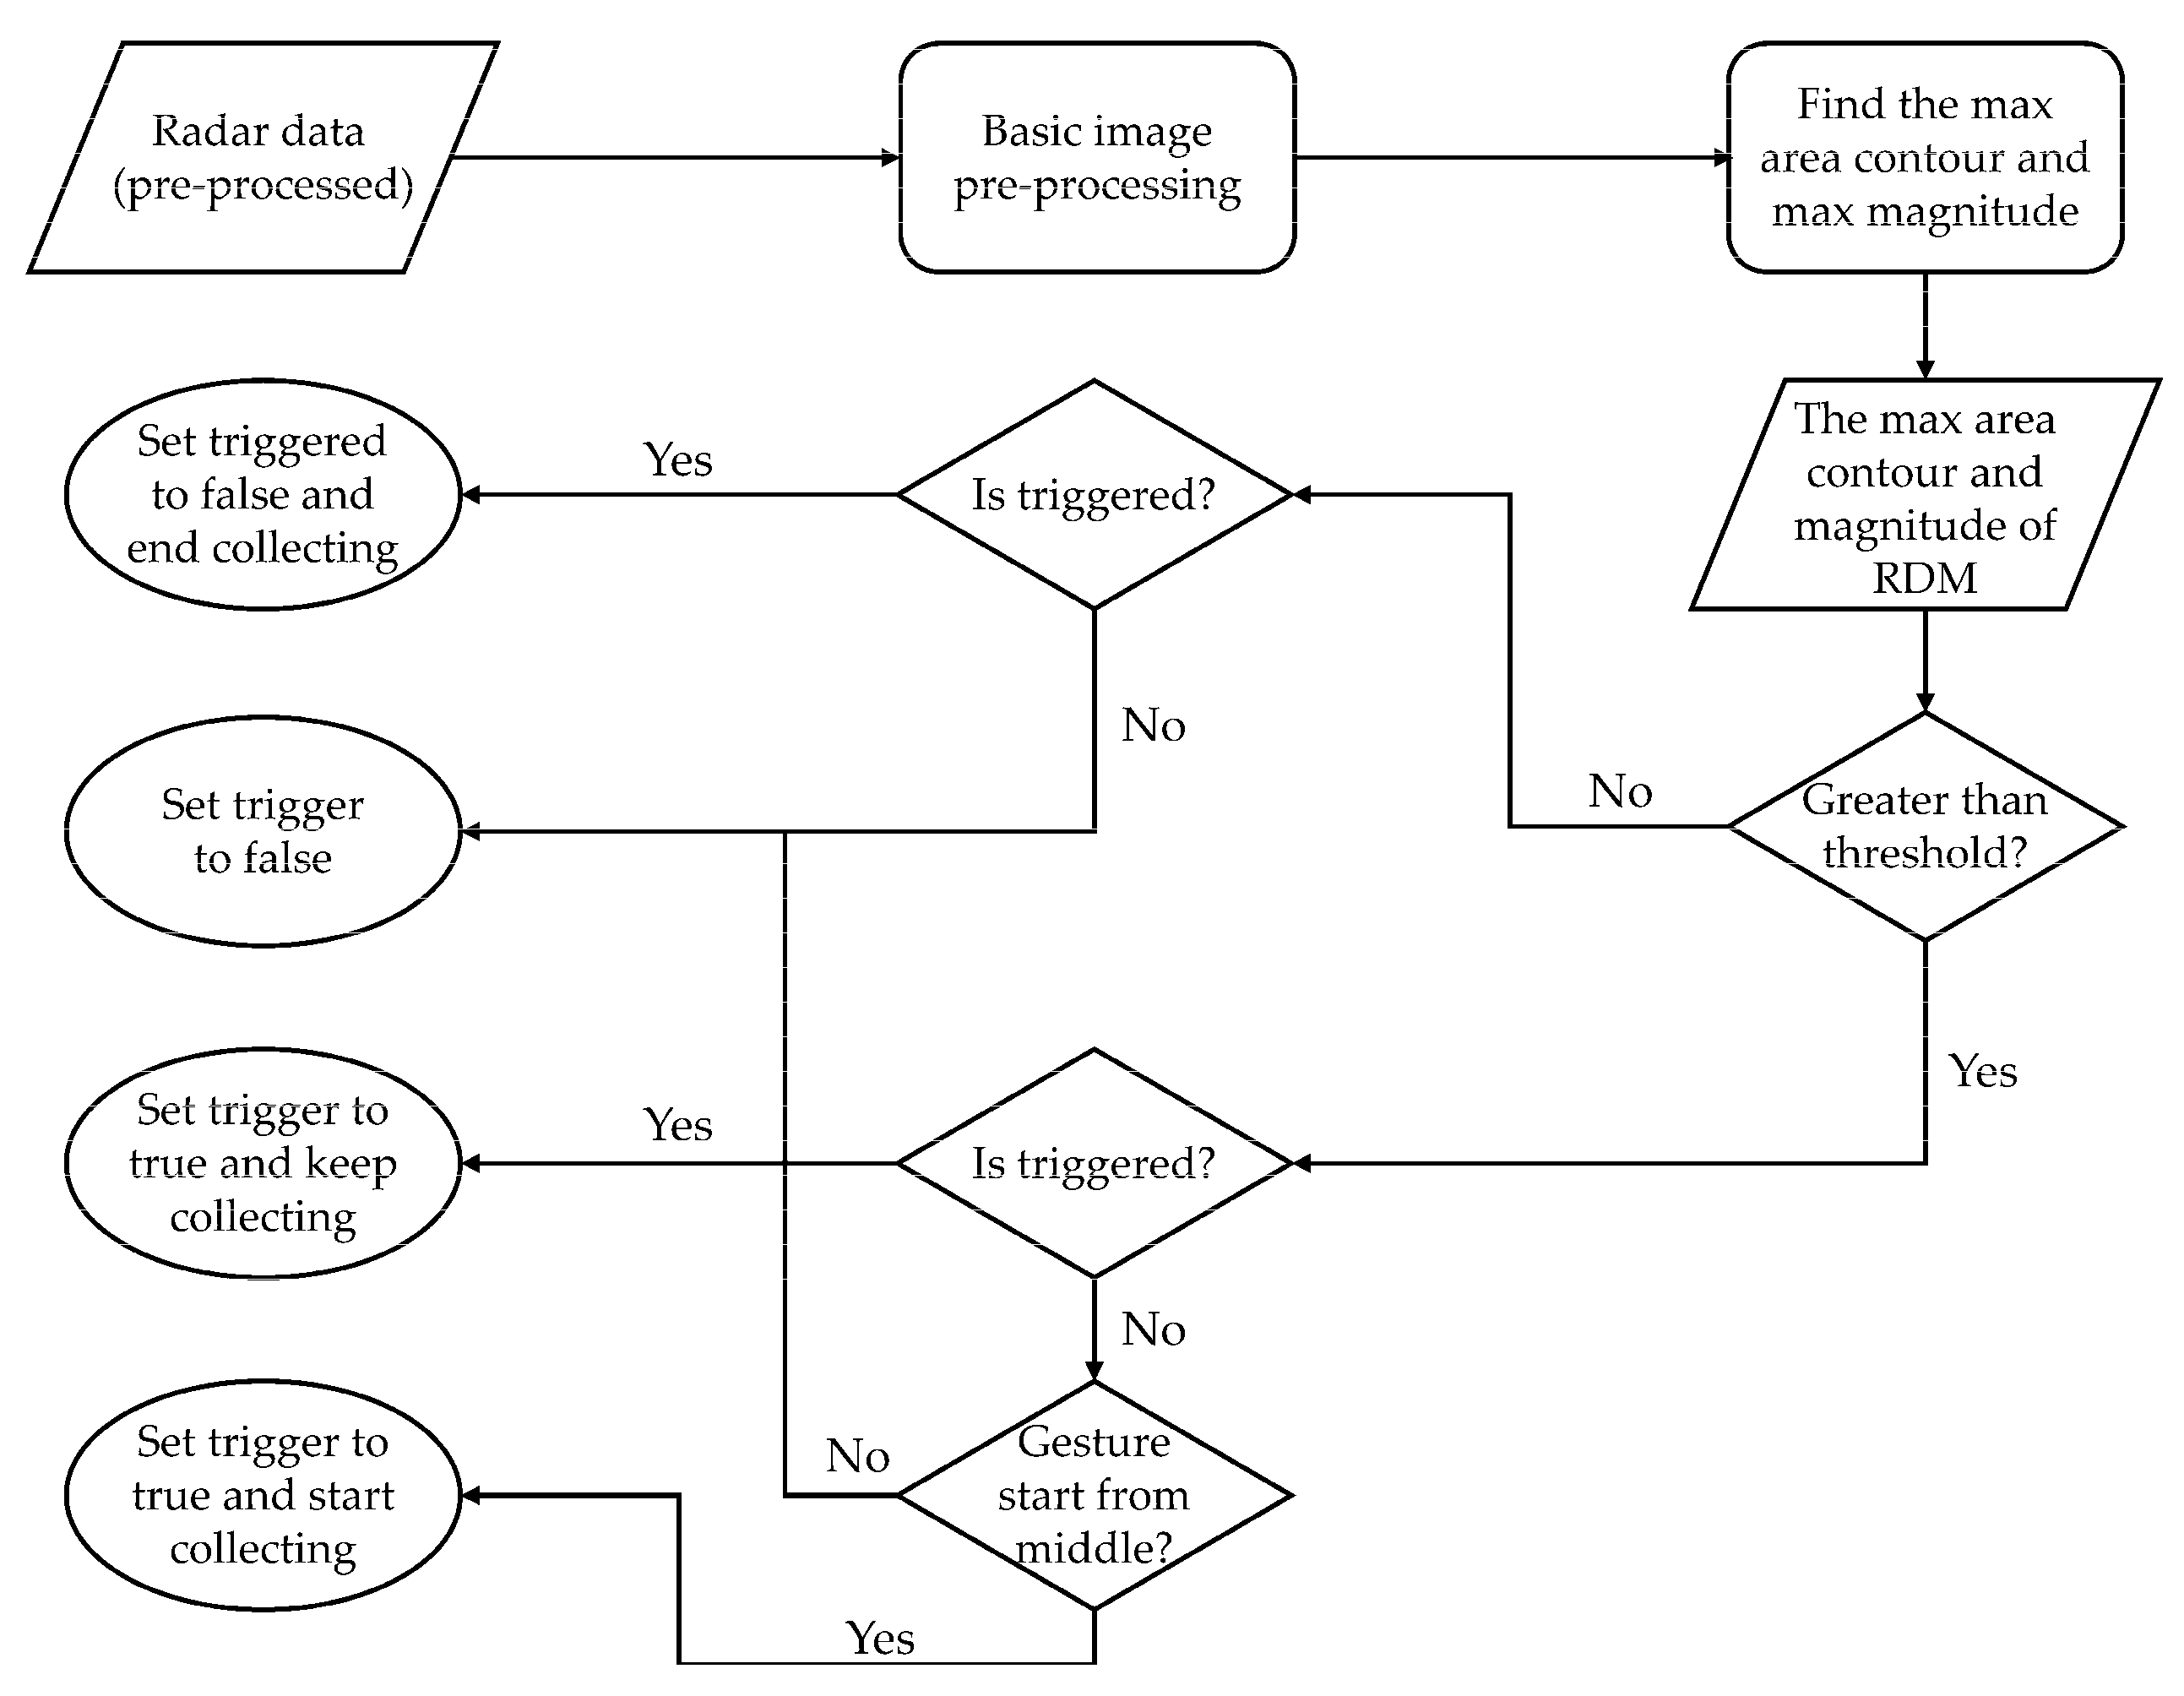
3.3. Data Capturing
- Binarize the RDM with a threshold;
- Find contours in the binarized image;
- Get the max area contour.
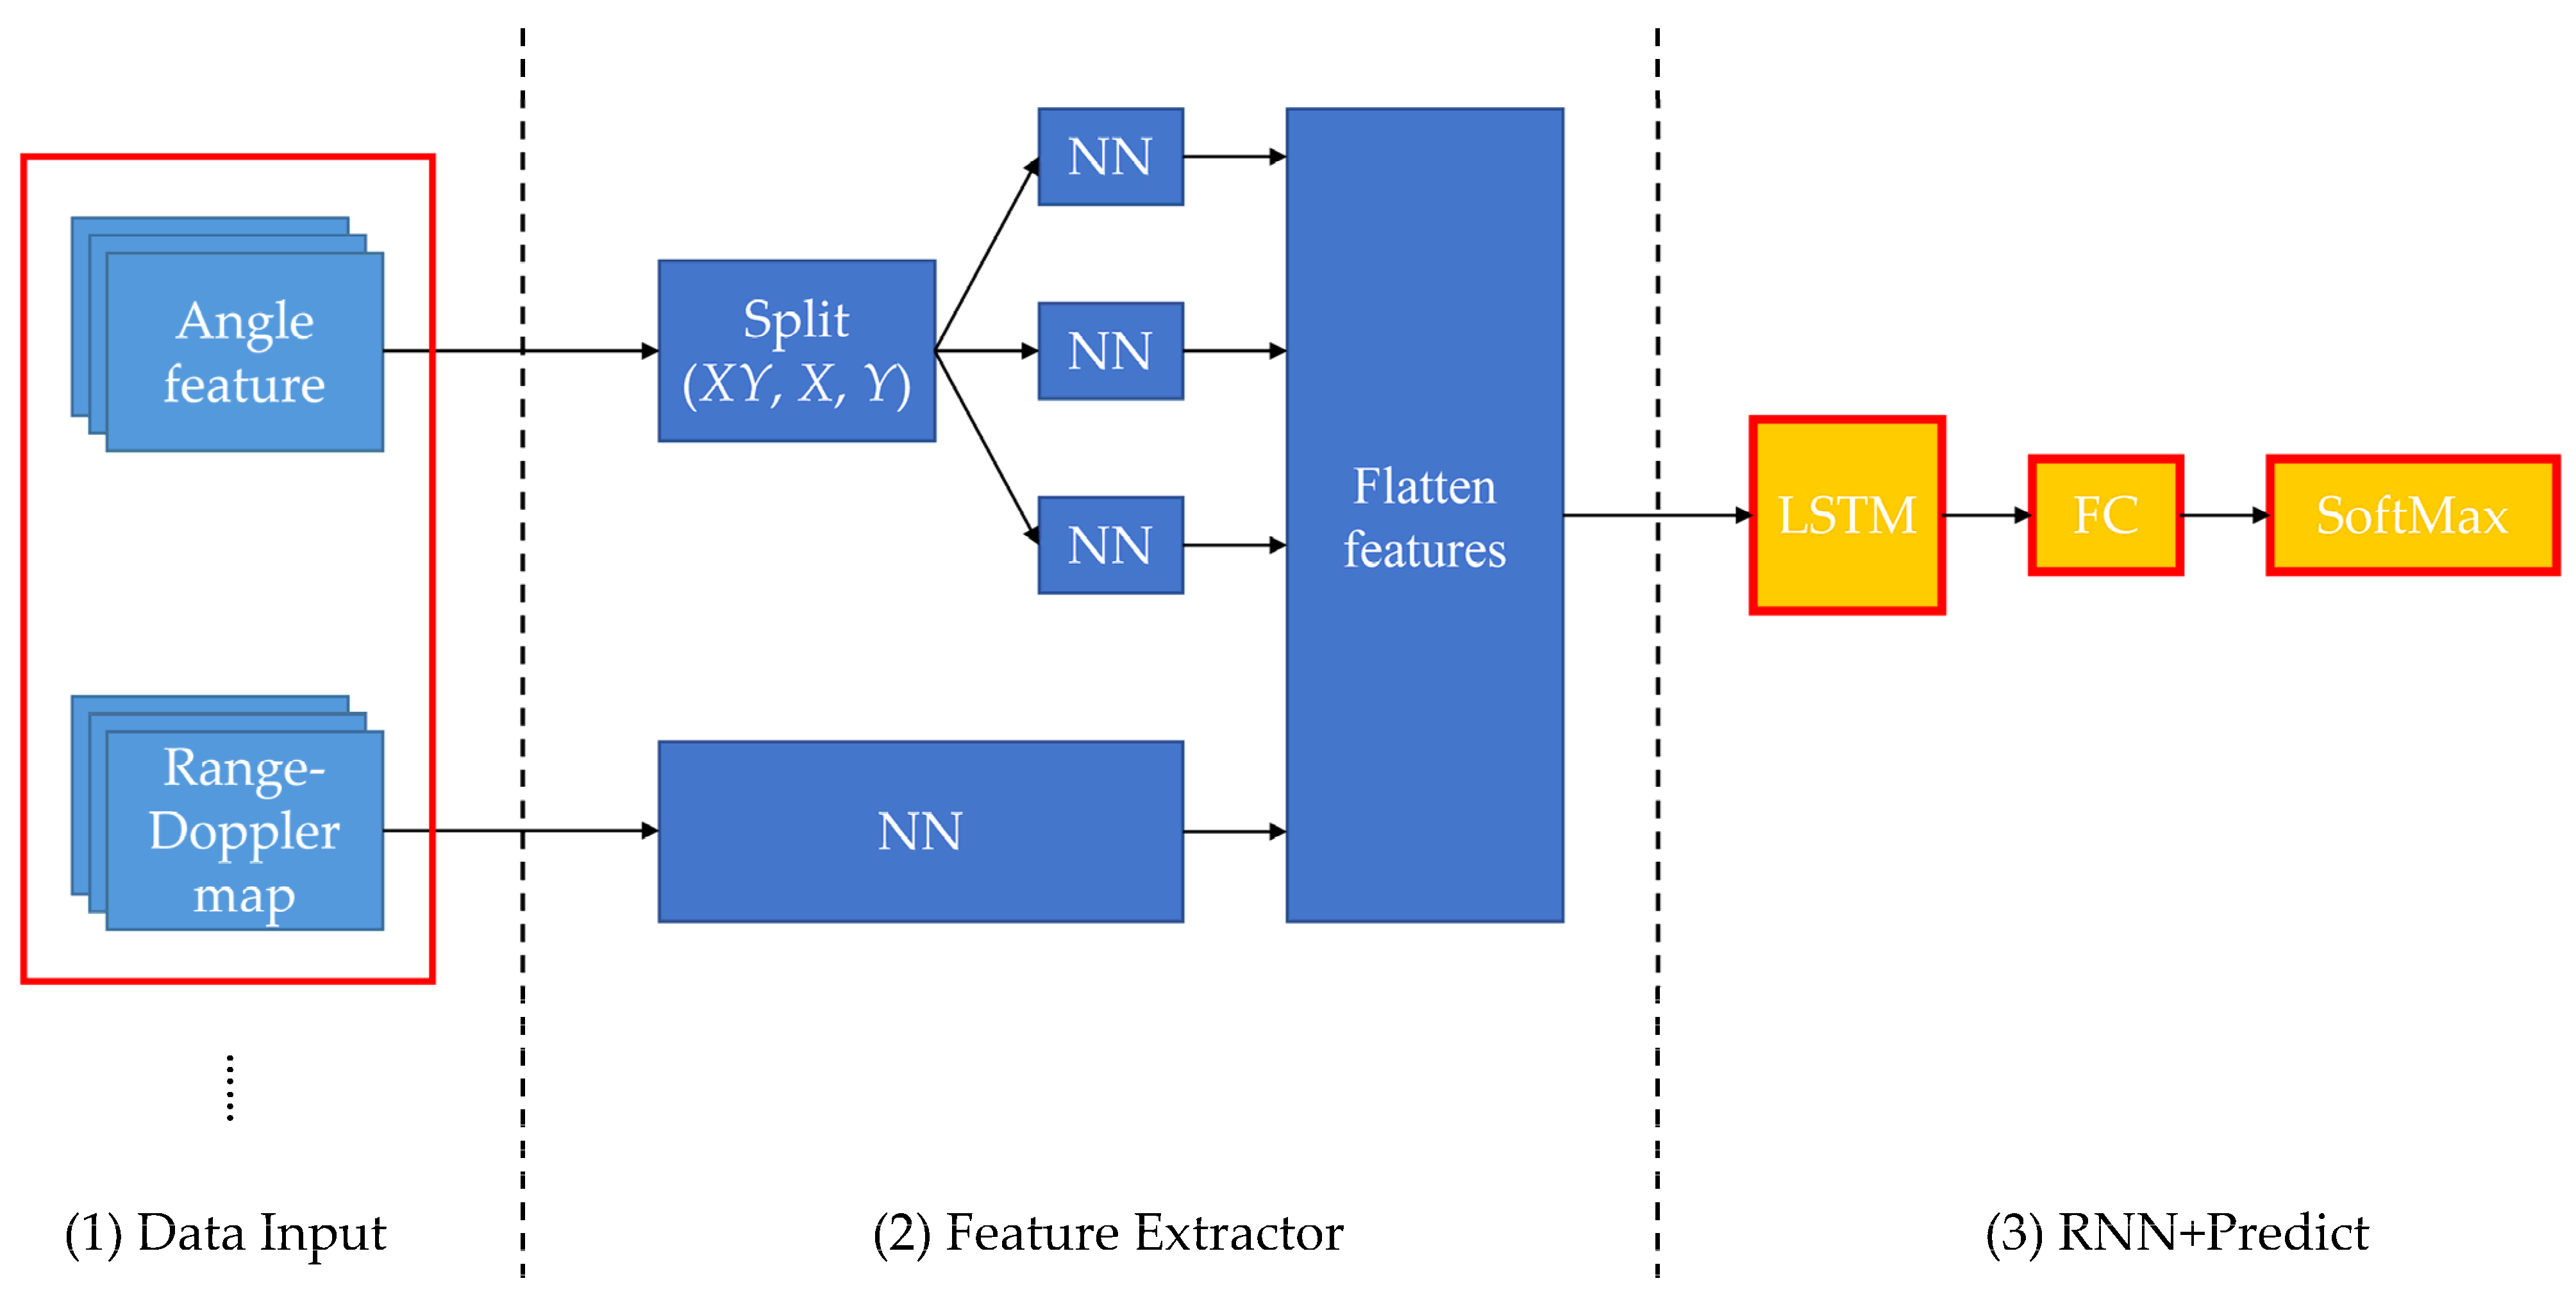
3.4. Gesture Recognition Model
3.4.1. Feature Extractor
3.4.2. RNN Model
4. Experiments
4.1. Data Collection
4.1.1. Collecting and Labeling Data with an Image-Based Algorithm
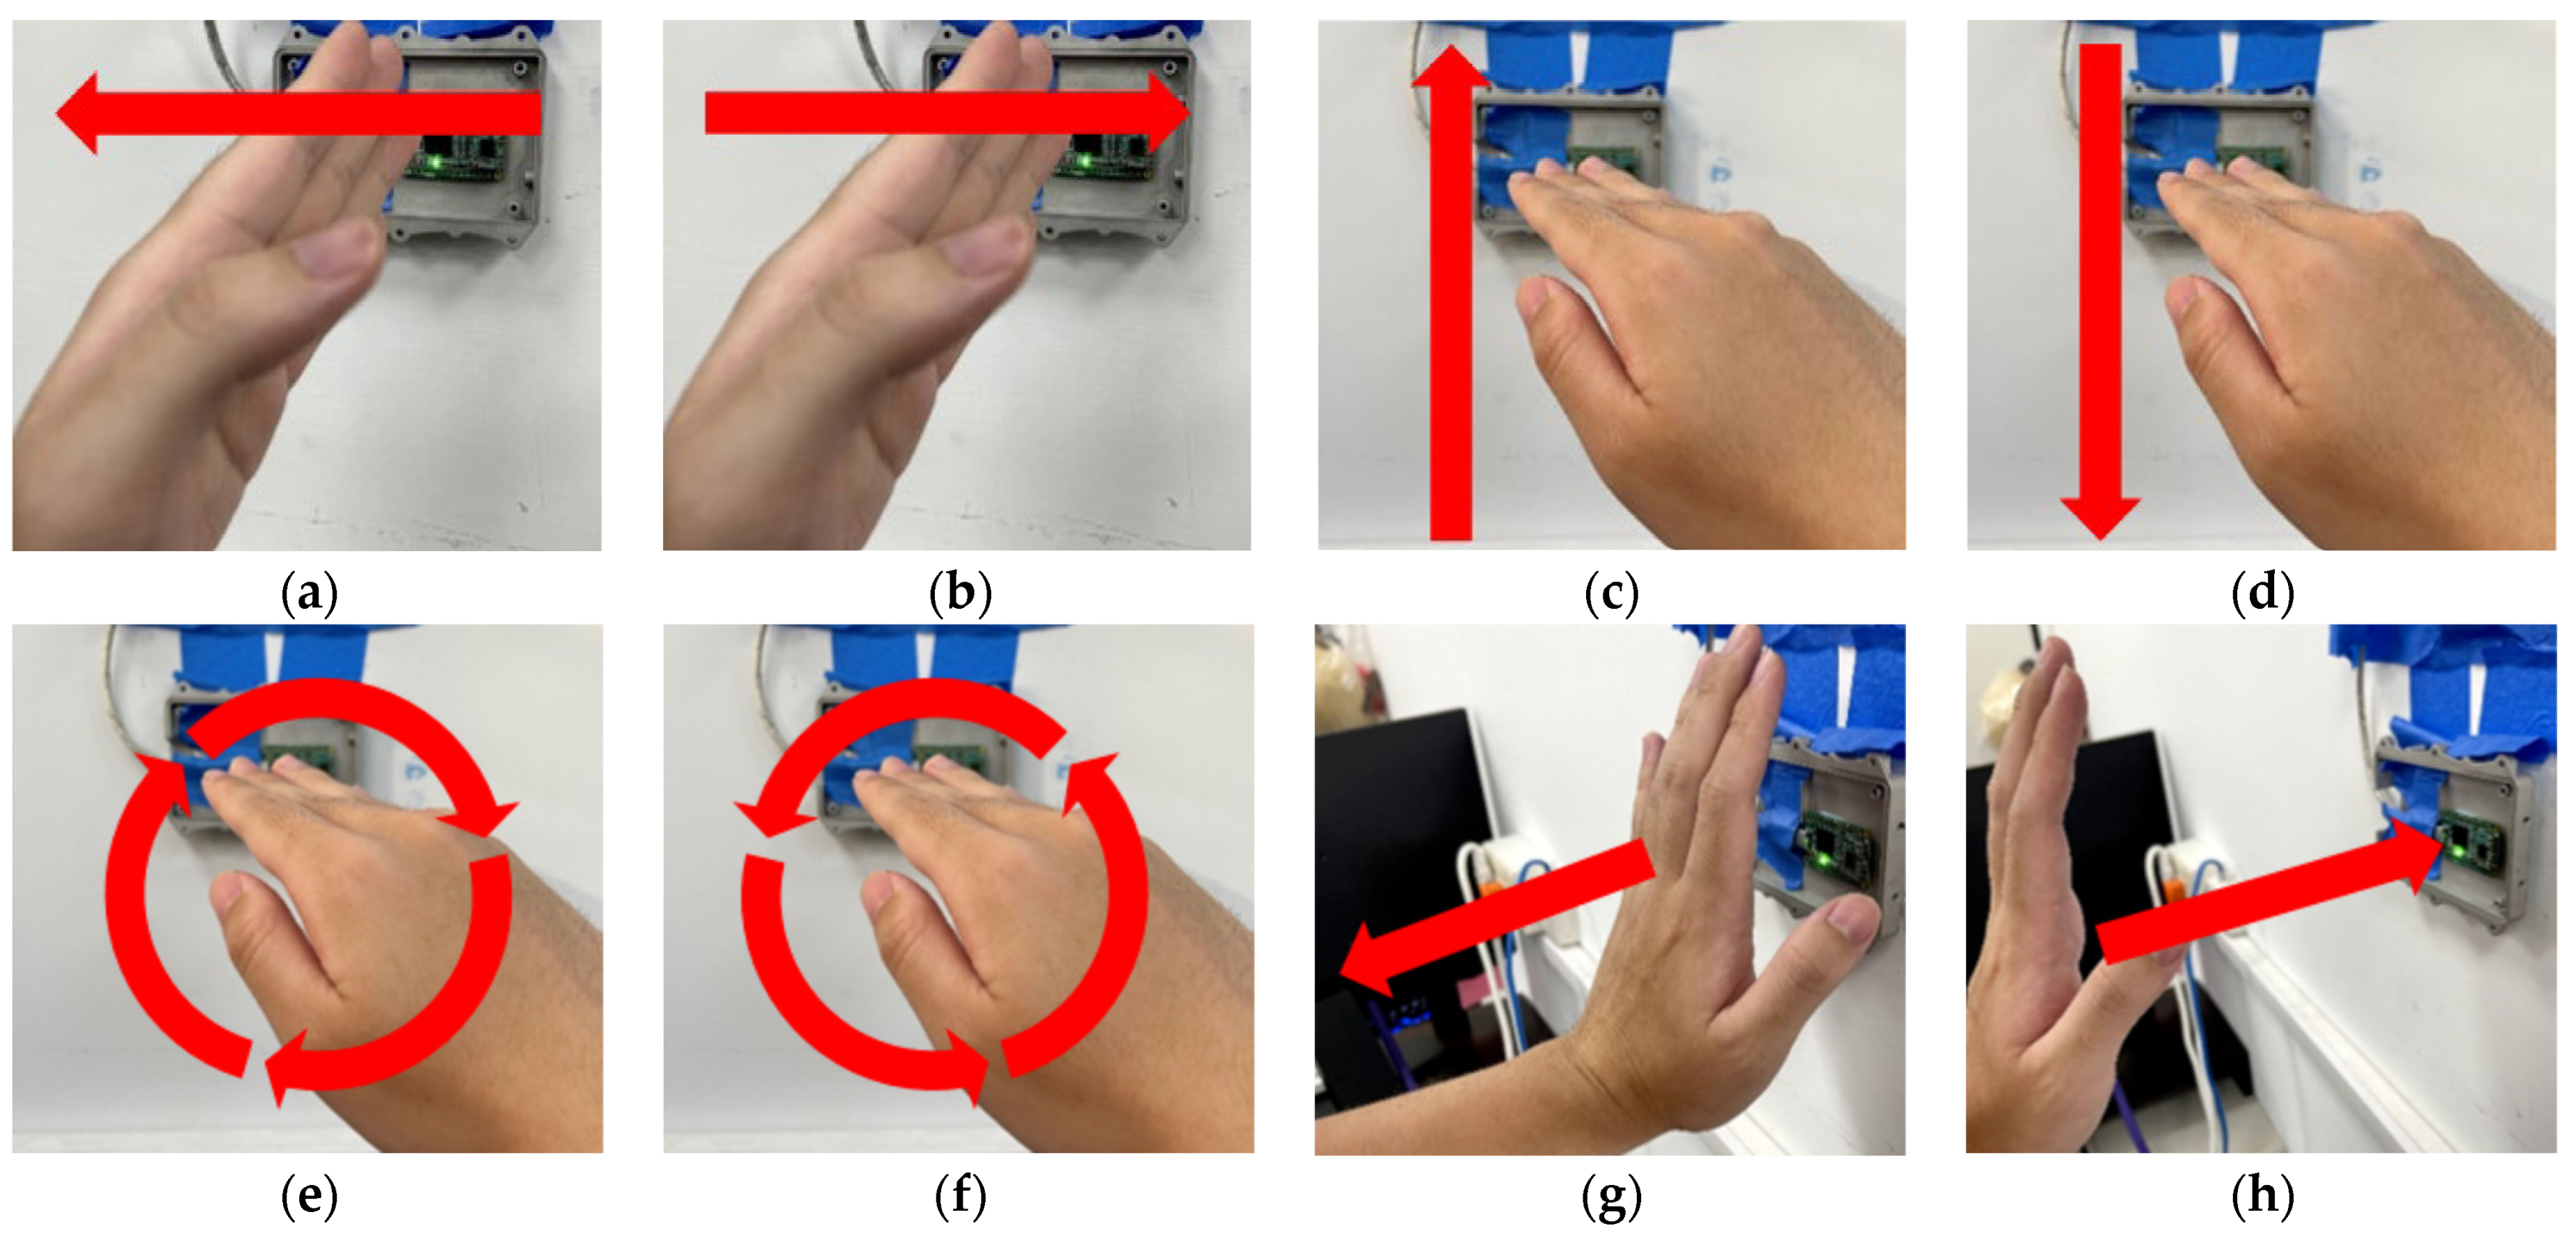
4.1.2. Hand Gesture Dataset
4.2. Evaluation Metrics
4.2.1. Confusion Matrix
4.2.2. Accuracy
4.2.3. Recall and Precision
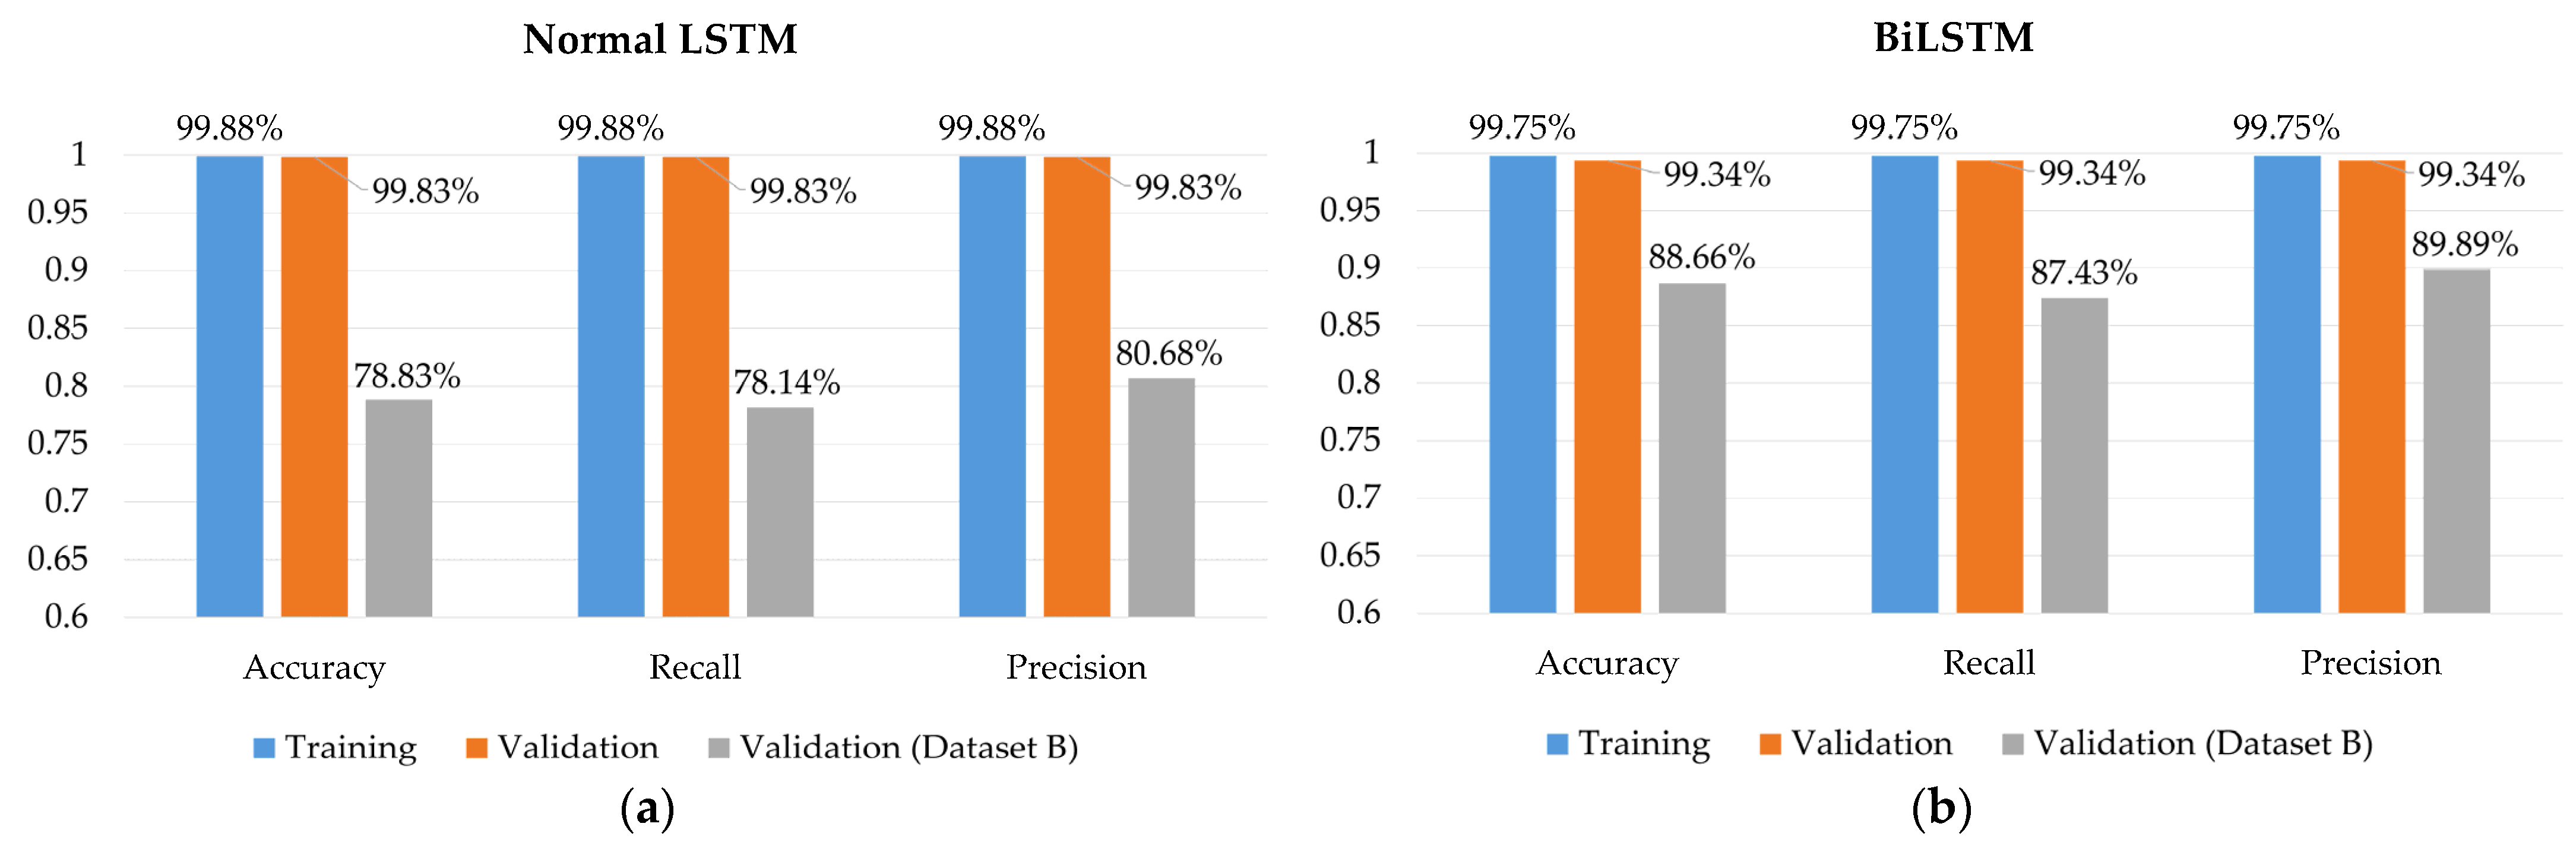
4.3. Normal and Bidirectional LSTM Layer
4.4. The Strategy of Data Collecting
5. Conclusions
Author Contributions
Funding
Acknowledgments
Conflicts of Interest
References
- Rautaray, S.S.; Agrawal, A. Vision based hand gesture recognition for human computer interaction: A survey. Artif. Intell. Rev. 2015, 43, 1–54. [Google Scholar] [CrossRef]
- Butler, A.; Izadi, S.; Hodges, S. SideSight: Multi-“touch” interaction around small devices. In Proceedings of the 21st Annual ACM Symposium on User Interface Software and Technology, Monterey, CA, USA, 9–22 October 2008; pp. 201–204. [Google Scholar]
- Pisharady, P.K.; Saerbeck, M. Recent methods and databases in vision-based hand gesture recognition: A review. Comput. Vis. Image Underst. 2015, 141, 152–165. [Google Scholar] [CrossRef]
- Ohn-Bar, E.; Trivedi, M.M. Hand gesture recognition in real time for automotive interfaces: A multimodal vision-based approach and evaluations. IEEE Trans. Intell. Transp. Syst. 2014, 15, 2368–2377. [Google Scholar] [CrossRef] [Green Version]
- Simion, G.; Caleanu, C.-D. A ToF 3D database for hand gesture recognition. In Proceedings of the 2012 10th International Symposium on Electronics and Telecommunications, Timisoara, Romania, 15–16 November 2012; pp. 363–366. [Google Scholar]
- Van den Bergh, M.; Van Gool, L. Combining RGB and ToF cameras for real-time 3D hand gesture interaction. In Proceedings of the 2011 IEEE Workshop on Applications of Computer Vision (WACV), Kona, HI, USA, 5–7 January 2011; pp. 66–72. [Google Scholar]
- Kollorz, E.; Penne, J.; Hornegger, J.; Barke, A. Gesture recognition with a time-of-flight camera. Int. J. Intell. Syst. Technol. Appl. 2008, 5, 334–343. [Google Scholar] [CrossRef] [Green Version]
- Xia, Z.; Xu, F. Time-space dimension reduction of millimeter-wave radar point-clouds for smart-home hand-gesture recognition. IEEE Sens. J. 2022, 22, 4425–4437. [Google Scholar] [CrossRef]
- Megalingam, R.K.; Rangan, V.; Krishnan, S.; Alinkeezhil, A.B.E. IR sensor-based gesture control wheelchair for stroke and SCI patients. IEEE Sens. J. 2016, 16, 6755–6765. [Google Scholar] [CrossRef]
- Cheng, H.-T.; Chen, A.M.; Razdan, A.; Buller, E. Contactless gesture recognition system using proximity sensors. In Proceedings of the 2011 IEEE International Conference on Consumer Electronics (ICCE), Las Vegas, NV, USA, 9–12 January 2011; pp. 149–150. [Google Scholar]
- Kim, S.Y.; Han, H.G.; Kim, J.W.; Lee, S.; Kim, T.W. A hand gesture recognition sensor using reflected impulses. IEEE Sens. J. 2017, 17, 2975–2976. [Google Scholar] [CrossRef]
- McIntosh, J.; Marzo, A.; Fraser, M.; Phillips, C. Echoflex: Hand gesture recognition using ultrasound imaging. In Proceedings of the 2017 CHI Conference on Human Factors in Computing Systems, Denver, CO, USA, 6–11 May 2017; pp. 1923–1934. [Google Scholar]
- Lien, J.; Gillian, N.; Karagozler, M.E.; Amihood, P.; Schwesig, C.; Olson, E.; Raja, H.; Poupyrev, I. Soli: Ubiquitous gesture sensing with millimeter wave radar. ACM Trans. Graph. TOG 2016, 35, 1–19. [Google Scholar] [CrossRef] [Green Version]
- Wang, S.; Song, J.; Lien, J.; Poupyrev, I.; Hilliges, O. Interacting with soli: Exploring fine-grained dynamic gesture recognition in the radio-frequency spectrum. In Proceedings of the 29th Annual Symposium on User Interface Software and Technology, Tokyo, Japan, 16–19 October 2016; pp. 851–860. [Google Scholar]
- Magrofuoco, N.; Pérez-Medina, J.; Roselli, P.; Vanderdonckt, J.; Villarreal, S. Eliciting contact-based and contactless gestures with radar-based sensors. IEEE Access 2019, 7, 176982–176997. [Google Scholar] [CrossRef]
- Kim, Y.; Toomajian, B. Hand gesture recognition using micro-Doppler signatures with convolutional neural network. IEEE Access 2016, 4, 7125–7130. [Google Scholar] [CrossRef]
- Zheng, L.; Bai, J.; Zhu, X.; Huang, L.; Shan, C.; Wu, Q.; Zhang, L. Dynamic hand gesture recognition in in-vehicle environment based on FMCW radar and transformer. Sensors 2021, 21, 6368. [Google Scholar] [CrossRef] [PubMed]
- Zhang, Z.; Tian, Z.; Zhang, Y.; Zhou, M.; Wang, B. u-DeepHand: FMCW radar-based unsupervised hand gesture feature learning using deep convolutional auto-encoder network. IEEE Sens. J. 2019, 19, 6811–6821. [Google Scholar] [CrossRef]
- Pramudita, A.A.; Lukas; Edwar. Contactless hand gesture sensor based on array of CW radar for human to machine interface. IEEE Sens. J. 2021, 21, 15196–15208. [Google Scholar] [CrossRef]
- Senigagliesi, L.; Ciattaglia, G.; Gambi, E. Contactless walking recognition based on mmWave radar. In Proceedings of the 2020 IEEE Symposium on Computers and Communications (ISCC), Rennes, France, 7–10 July 2020; pp. 1–4. [Google Scholar]
- Yu, M.; Kim, N.; Jung, Y.; Lee, S. A frame detection method for real-time hand gesture recognition systems using CW-radar. Sensors 2020, 20, 2321. [Google Scholar] [CrossRef] [PubMed] [Green Version]
- Wu, Q.; Zhao, D. Dynamic hand gesture recognition using FMCW radar sensor for driving assistance. In Proceedings of the 2018 10th International Conference on Wireless Communications and Signal Processing (WCSP), Hangzhou, China, 18–20 October 2018; pp. 1–6. [Google Scholar]
- Suh, J.S.; Ryu, S.; Han, B.; Choi, J.; Kim, J.-H.; Hong, S. 24 GHz FMCW radar system for real-time hand gesture recognition using LSTM. In Proceedings of the 2018 Asia-Pacific Microwave Conference (APMC), Kyoto, Japan, 6–9 November 2018; pp. 860–862. [Google Scholar]
- Stankovic, L.; Thayaparan, T.; Dakovic, M.; Popovic-Bugarin, V. Micro-Doppler removal in the radar imaging analysis. IEEE Trans. Aerosp. Electron. Syst. 2013, 49, 1234–1250. [Google Scholar] [CrossRef]
- Choi, J.-W.; Ryu, S.-J.; Kim, J.-H. Short-range radar based real-time hand gesture recognition using LSTM encoder. IEEE Access 2019, 7, 33610–33618. [Google Scholar] [CrossRef]
- Skaria, S.; Al-Hourani, A.; Lech, M.; Evans, R.J. Hand-gesture recognition using two-antenna Doppler radar with deep convolutional neural networks. IEEE Sens. J. 2019, 19, 3041–3048. [Google Scholar] [CrossRef]
- Chen, X.; Li, Y.; Hu, R.; Zhang, X.; Chen, X. Hand gesture recognition based on surface electromyography using convolutional neural network with transfer learning method. IEEE J. Biomed. Health Inform. 2020, 25, 1292–1304. [Google Scholar] [CrossRef] [PubMed]


| Dataset | Users | Horizontal Swipe | Vertical Swipe | Rotating | Near/Away | Total Records |
|---|---|---|---|---|---|---|
| Dataset A | 2 | Swipe left: 289 | Swipe up: 306 | Clockwise: 272 | Near: 120 | 2012 |
| Swipe right: 300 | Swipe down: 300 | Counter-clockwise: 309 | Away: 116 | |||
| Dataset B | 3 | Swipe left: 82 | Swipe up: 82 | Clockwise: 139 | Near: 59 | 732 |
| Swipe right: 85 | Swipe down: 82 | Counter-clockwise: 144 | Away: 59 |
| Predicted Class | |||
|---|---|---|---|
| Positive | Negative | ||
| Actual class | Positive | TP | FN |
| Negative | FP | TN | |
| Model Structure | Parameters of Feature Extractor | Parameters of LSTM Layer | Total Parameters |
|---|---|---|---|
| Normal LSTM | 5164 | 8256 | 13,556 |
| BiLSTM | 5164 | 16,512 | 21,940 |
| Parameter | Values of the Parameter |
|---|---|
| Batch size | 32 |
| Number of hidden units of LSTM | 16 |
| Number of hidden units of NN | 8, 16, 32 |
| Pool size of Max pooling | (2, 2) |
| Number of iterations (epochs) | 150 |
| Steps per epoch | 49 |
| Validation steps | 49 |
| Optimizer | Adam |
| Learning rate | 0.001 |
Publisher’s Note: MDPI stays neutral with regard to jurisdictional claims in published maps and institutional affiliations. |
© 2022 by the authors. Licensee MDPI, Basel, Switzerland. This article is an open access article distributed under the terms and conditions of the Creative Commons Attribution (CC BY) license (https://creativecommons.org/licenses/by/4.0/).
Share and Cite
Jhaung, Y.-C.; Lin, Y.-M.; Zha, C.; Leu, J.-S.; Köppen, M. Implementing a Hand Gesture Recognition System Based on Range-Doppler Map. Sensors 2022, 22, 4260. https://doi.org/10.3390/s22114260
Jhaung Y-C, Lin Y-M, Zha C, Leu J-S, Köppen M. Implementing a Hand Gesture Recognition System Based on Range-Doppler Map. Sensors. 2022; 22(11):4260. https://doi.org/10.3390/s22114260
Chicago/Turabian StyleJhaung, Yu-Chiao, Yu-Ming Lin, Chiao Zha, Jenq-Shiou Leu, and Mario Köppen. 2022. "Implementing a Hand Gesture Recognition System Based on Range-Doppler Map" Sensors 22, no. 11: 4260. https://doi.org/10.3390/s22114260
APA StyleJhaung, Y.-C., Lin, Y.-M., Zha, C., Leu, J.-S., & Köppen, M. (2022). Implementing a Hand Gesture Recognition System Based on Range-Doppler Map. Sensors, 22(11), 4260. https://doi.org/10.3390/s22114260