
Measuring Indoor Occupancy through Environmental Sensors: A Systematic Review on Sensor Deployment


Abstract
1. Introduction
2. Materials and Methods
2.1. Research Questions
- Identify the environmental variables used.
- Obtain the number of sensors installed.
- Obtain the details of the sensor deployment.
- Obtain the algorithms and models used to calculate, predict, or estimate occupancy.
- RQ1: How many sensors per square meter are necessary to install within a room in order to estimate occupancy levels in real time using only environmental sensors (air temperature, barometric pressure, relative humidity)?
- RQ2: Is it essential to add another environmental variable or non-intrusive sensor to improve the classification?
- RQ3: How should the sensors be distributed within the indoor place?
- RQ4: Can data fusion improve the performance of predictors?
- RQ5: Is it possible to use unlabeled data to estimate occupancy levels?
2.2. Search Process
2.3. Inclusion and Exclusion Criteria
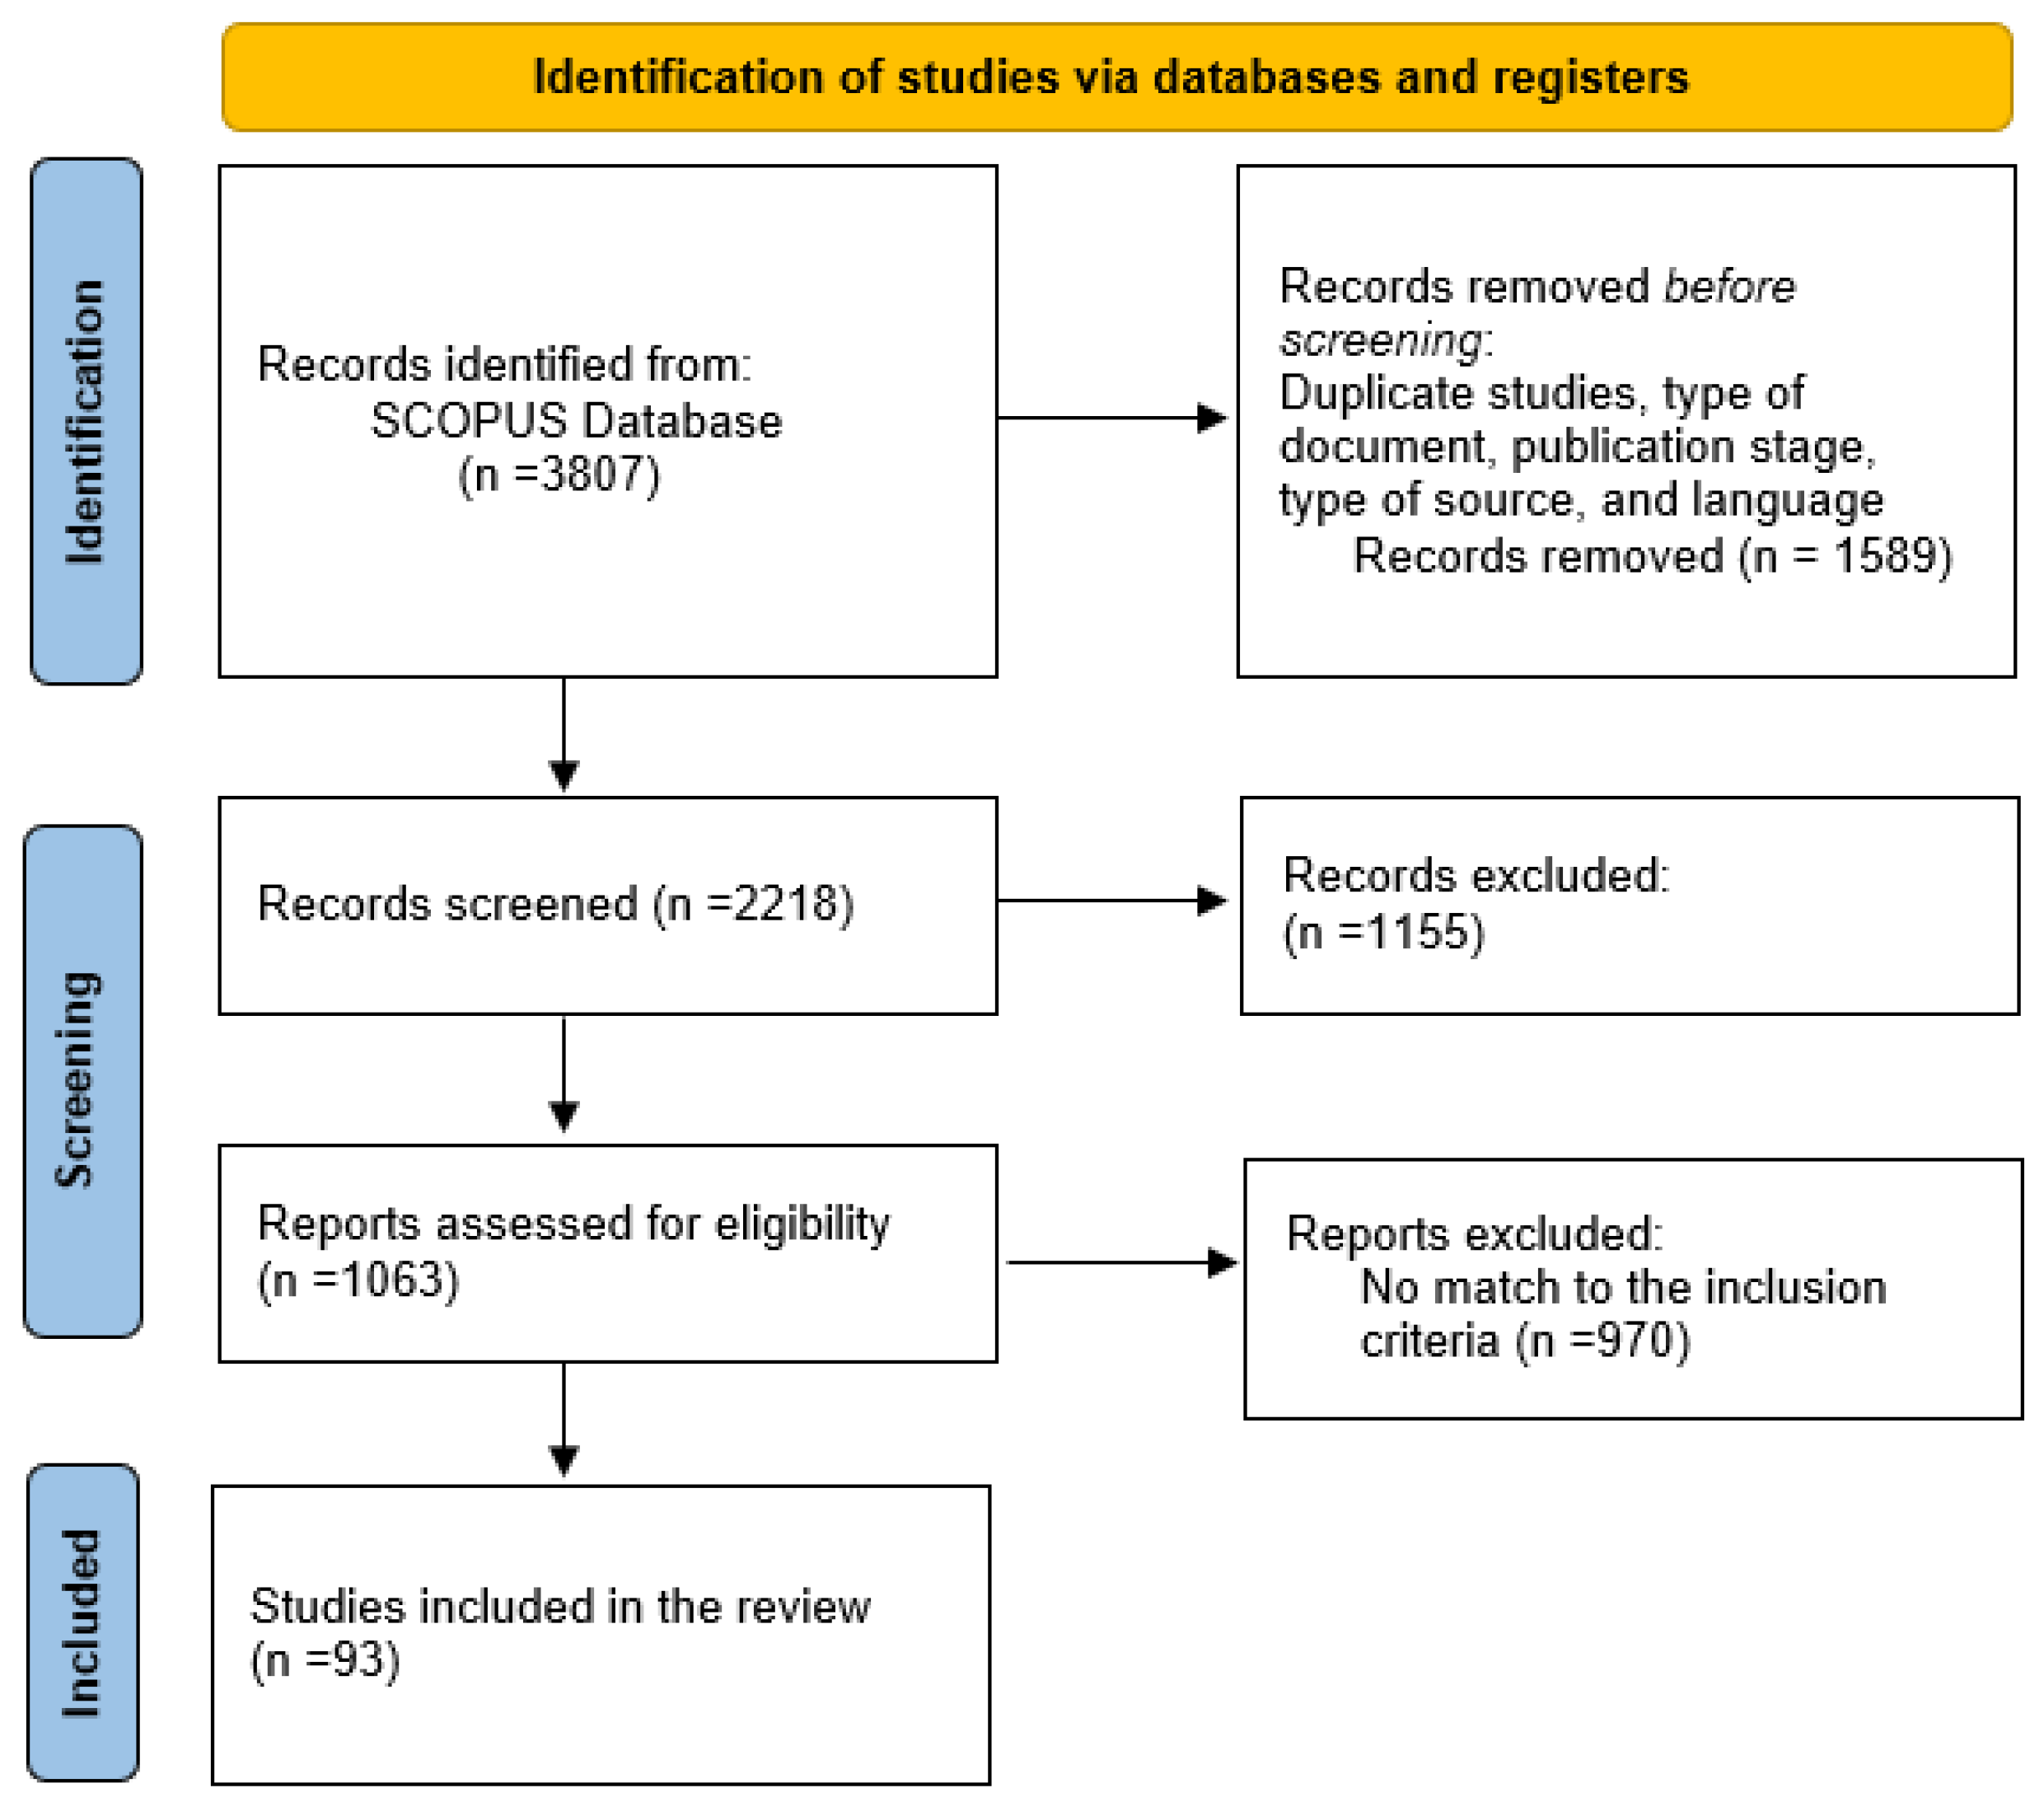
2.4. Study Selection
2.5. Data Extraction and Synthesis
- Title and abstract of the literature;
- Author(s);
- Database type (available or private);
- Publication year;
- Type of sensor;
- Quantity of sensors;
- Type of place;
- Place dimensions;
- Description of the sensor deployment process;
- Test time;
- University–Country;
- Machine Learning algorithms;
- Data fusion methods;
- Results.
2.6. Risk of Bias
3. Results
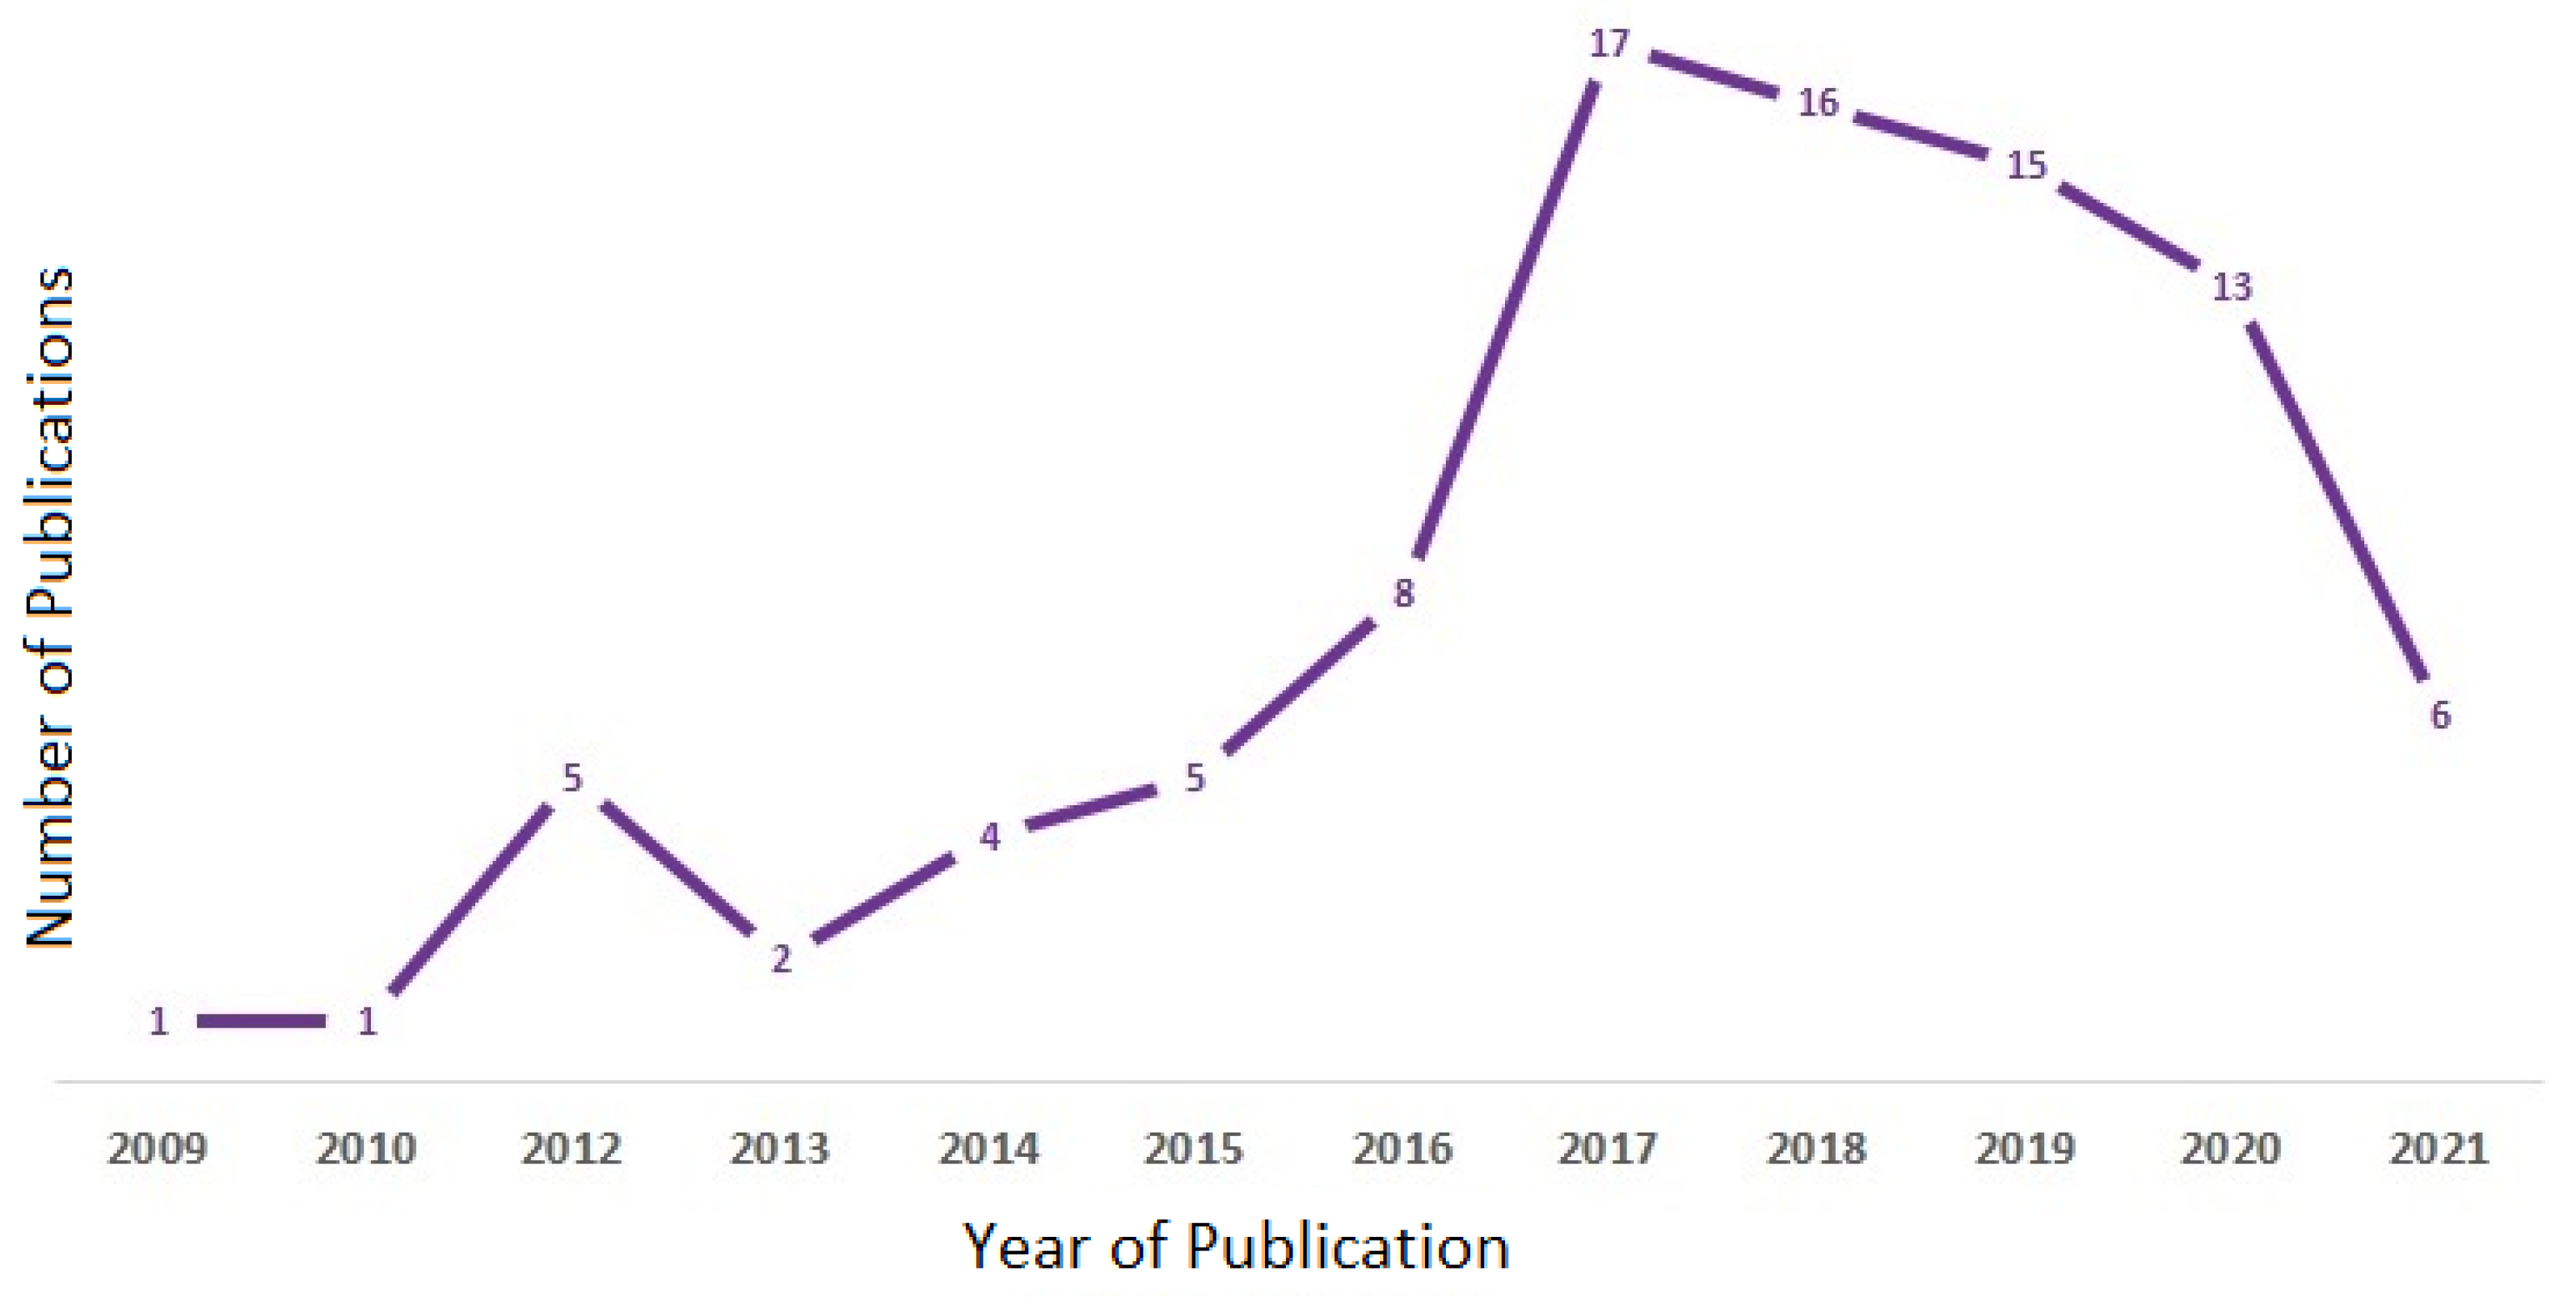
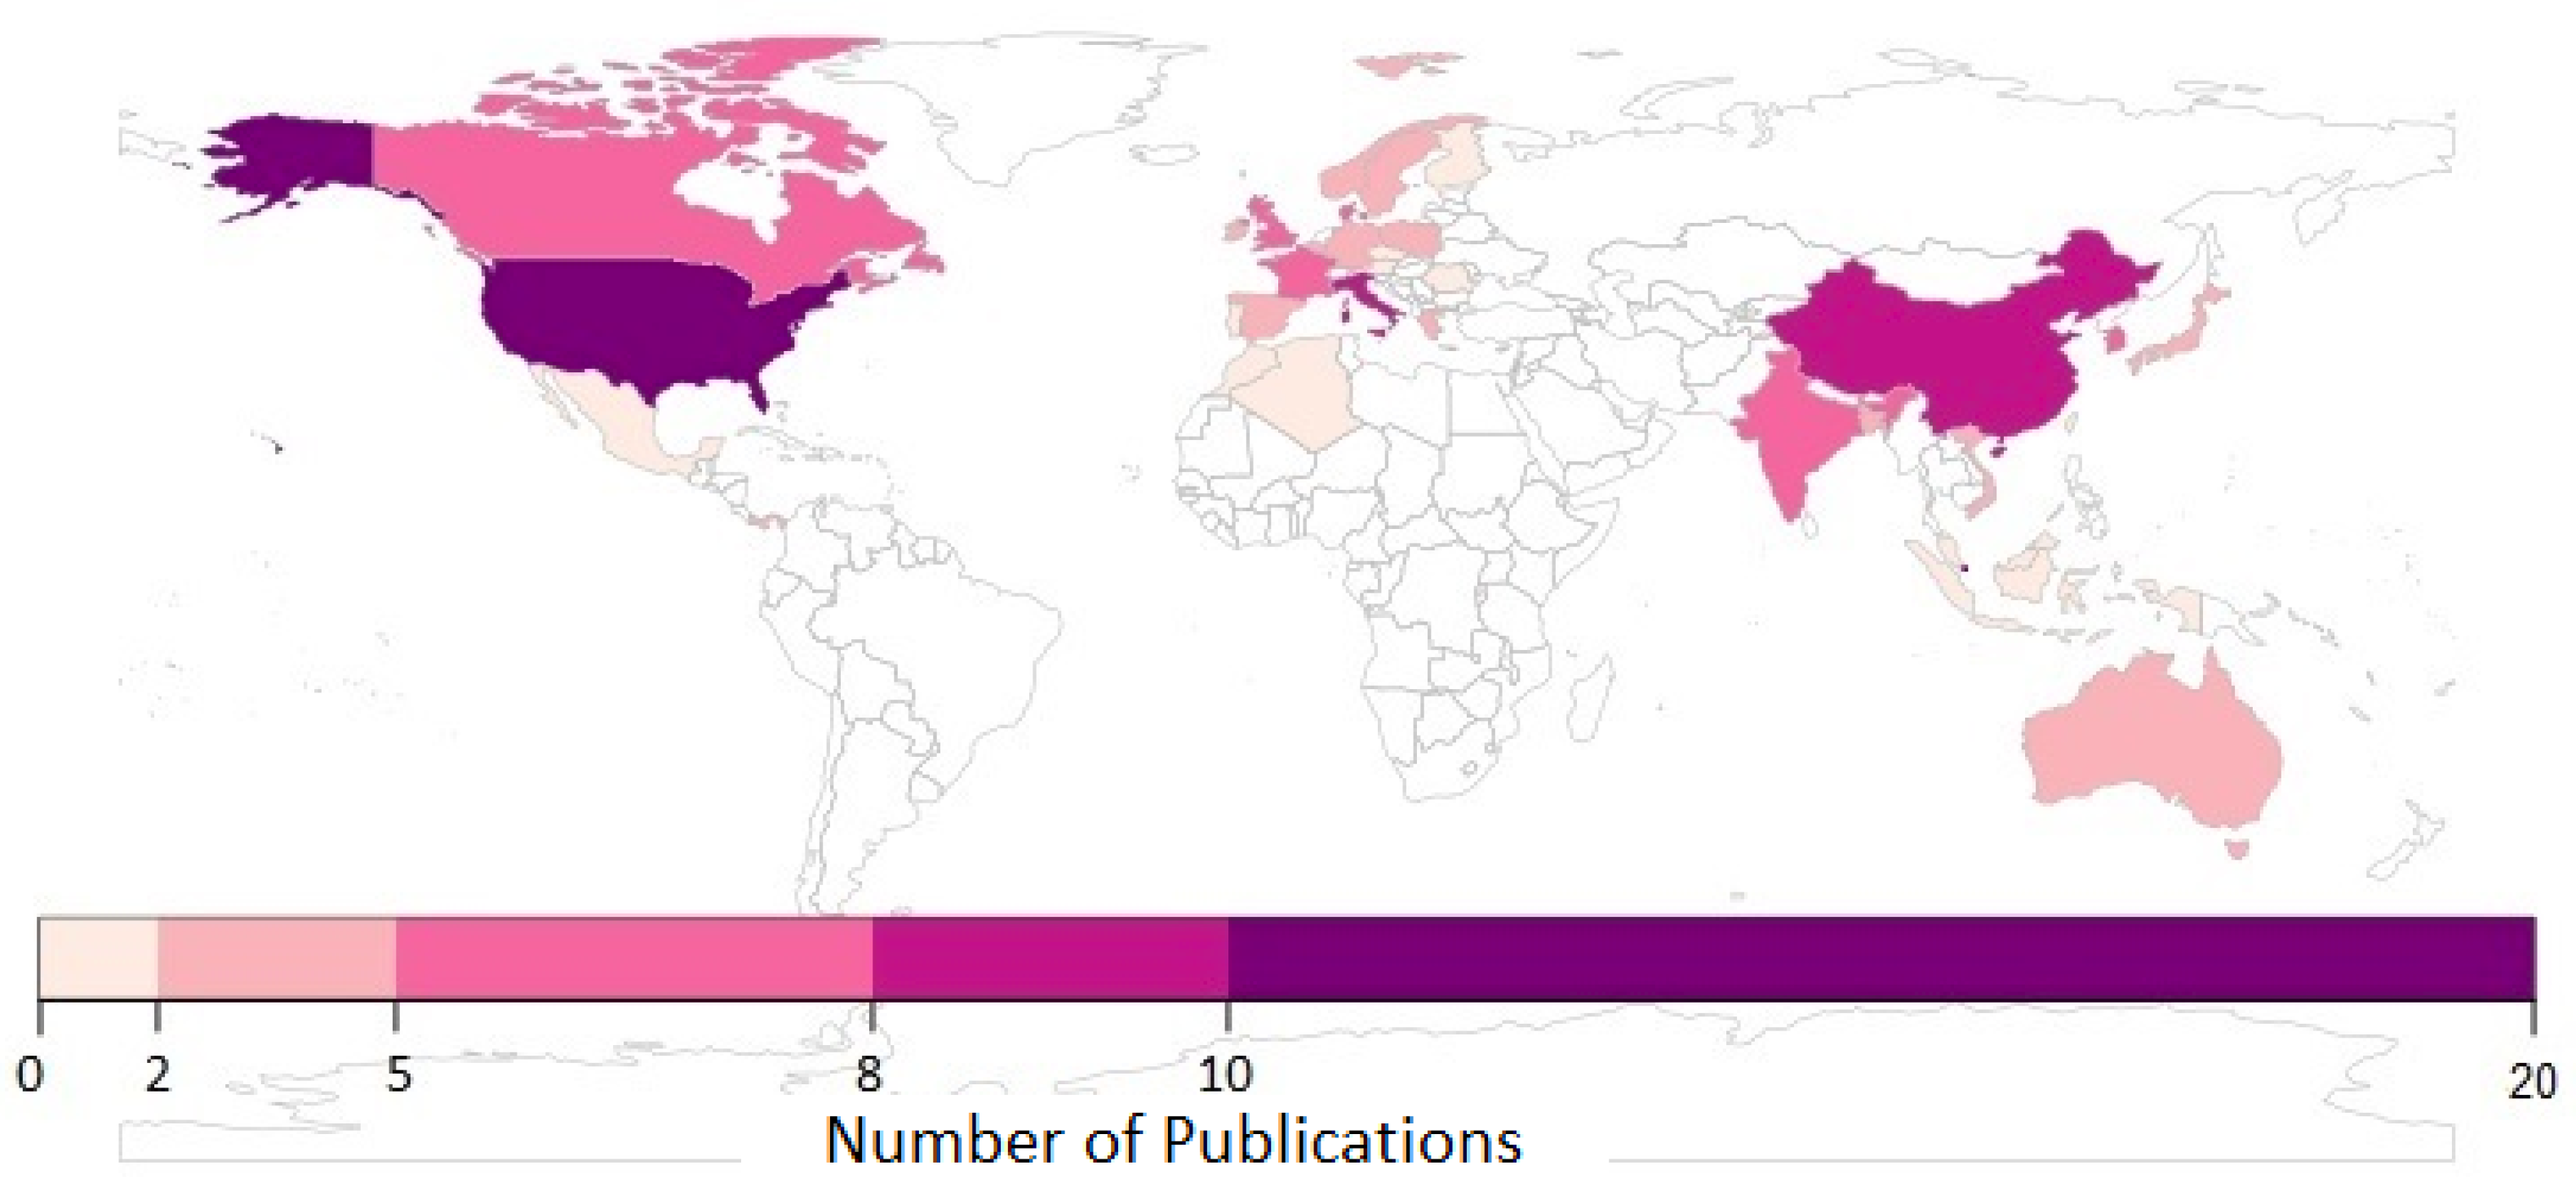
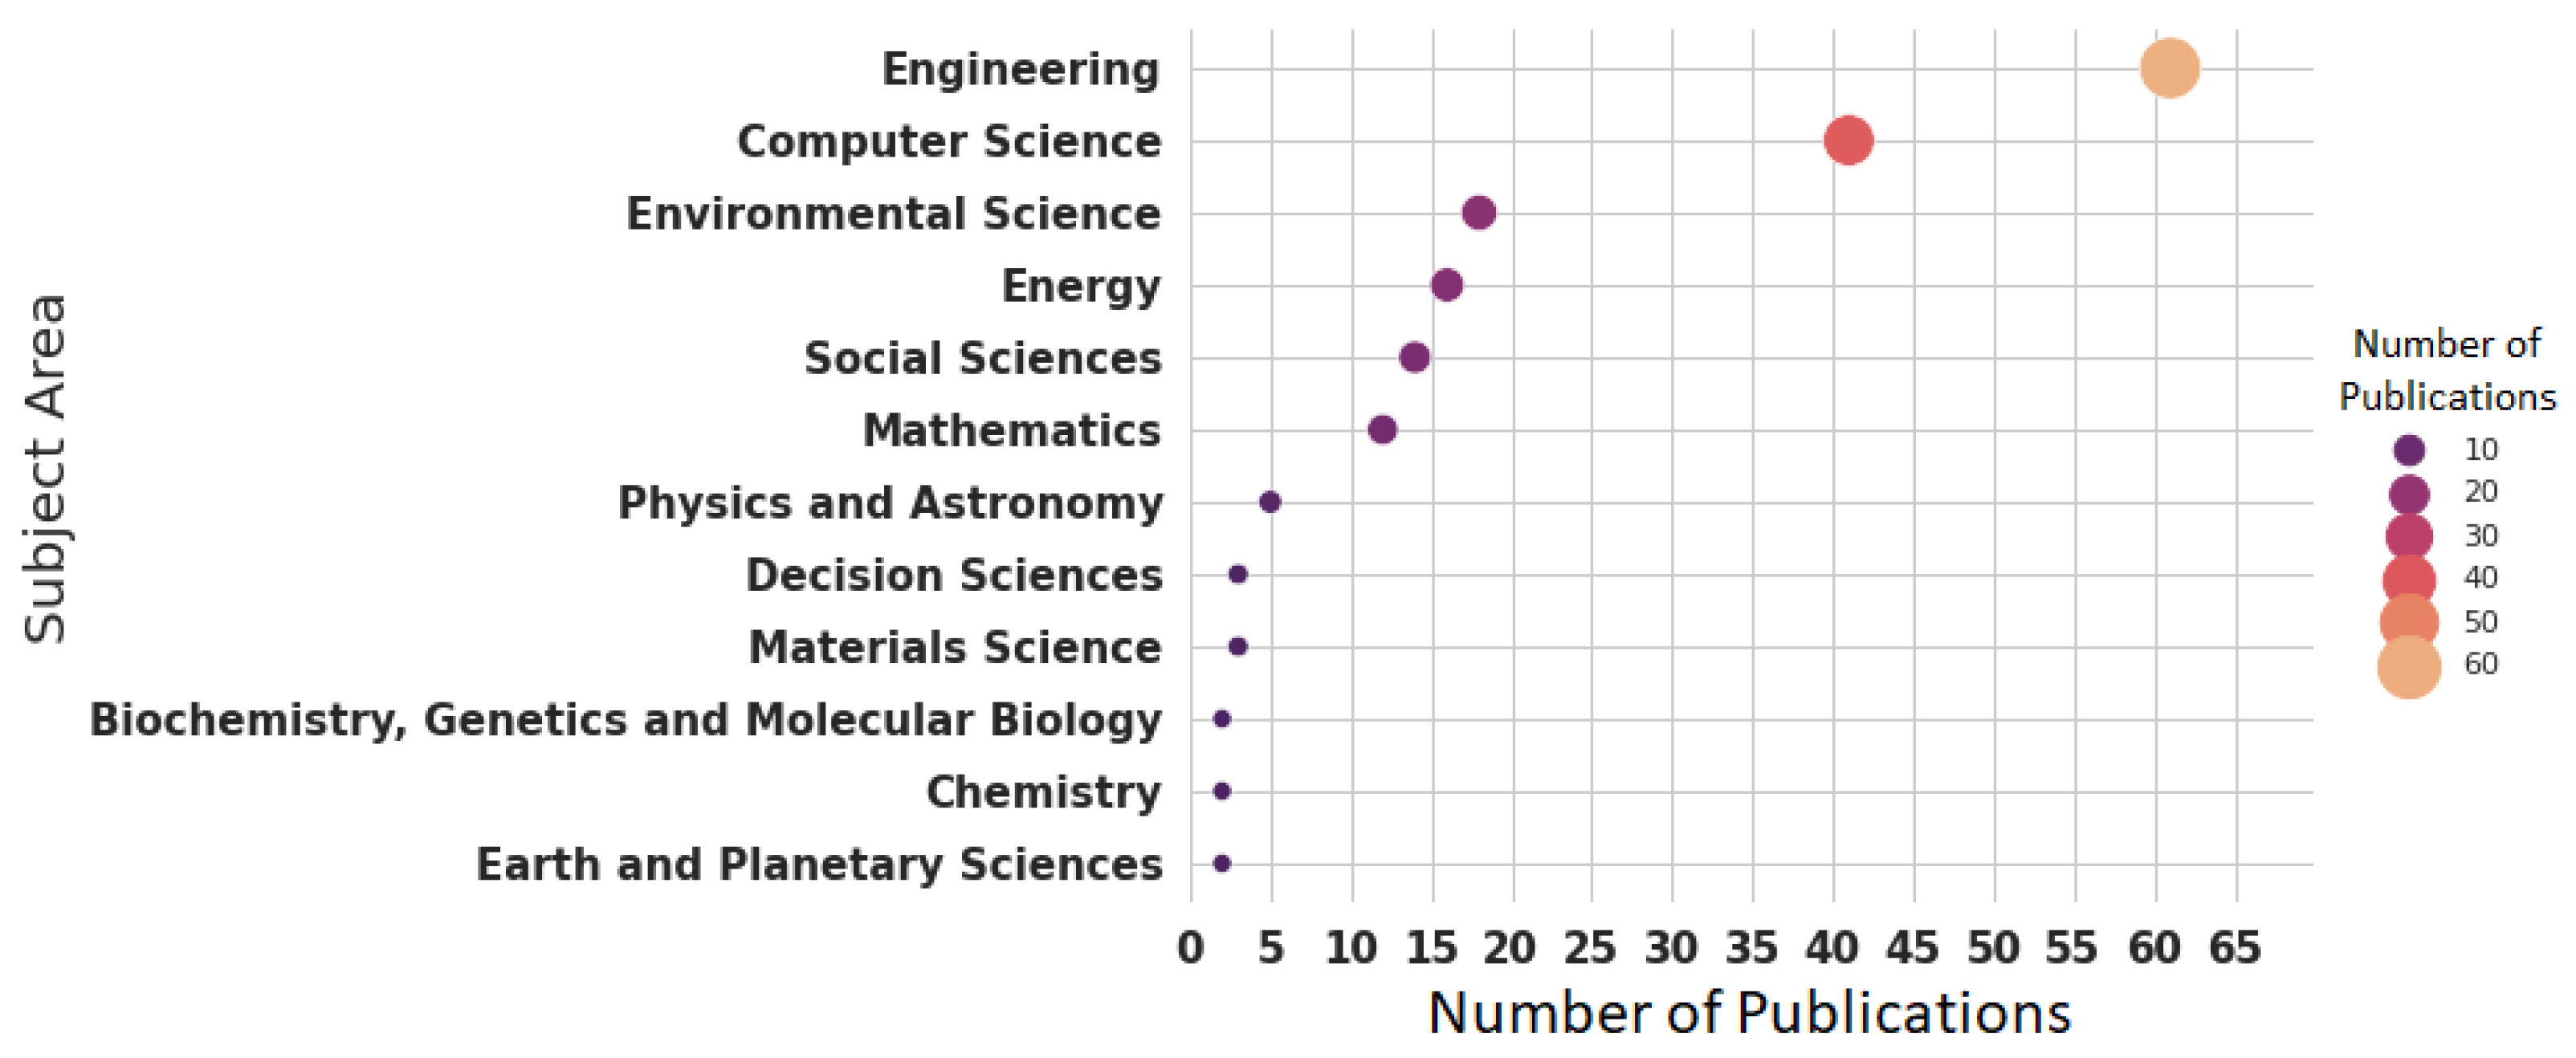
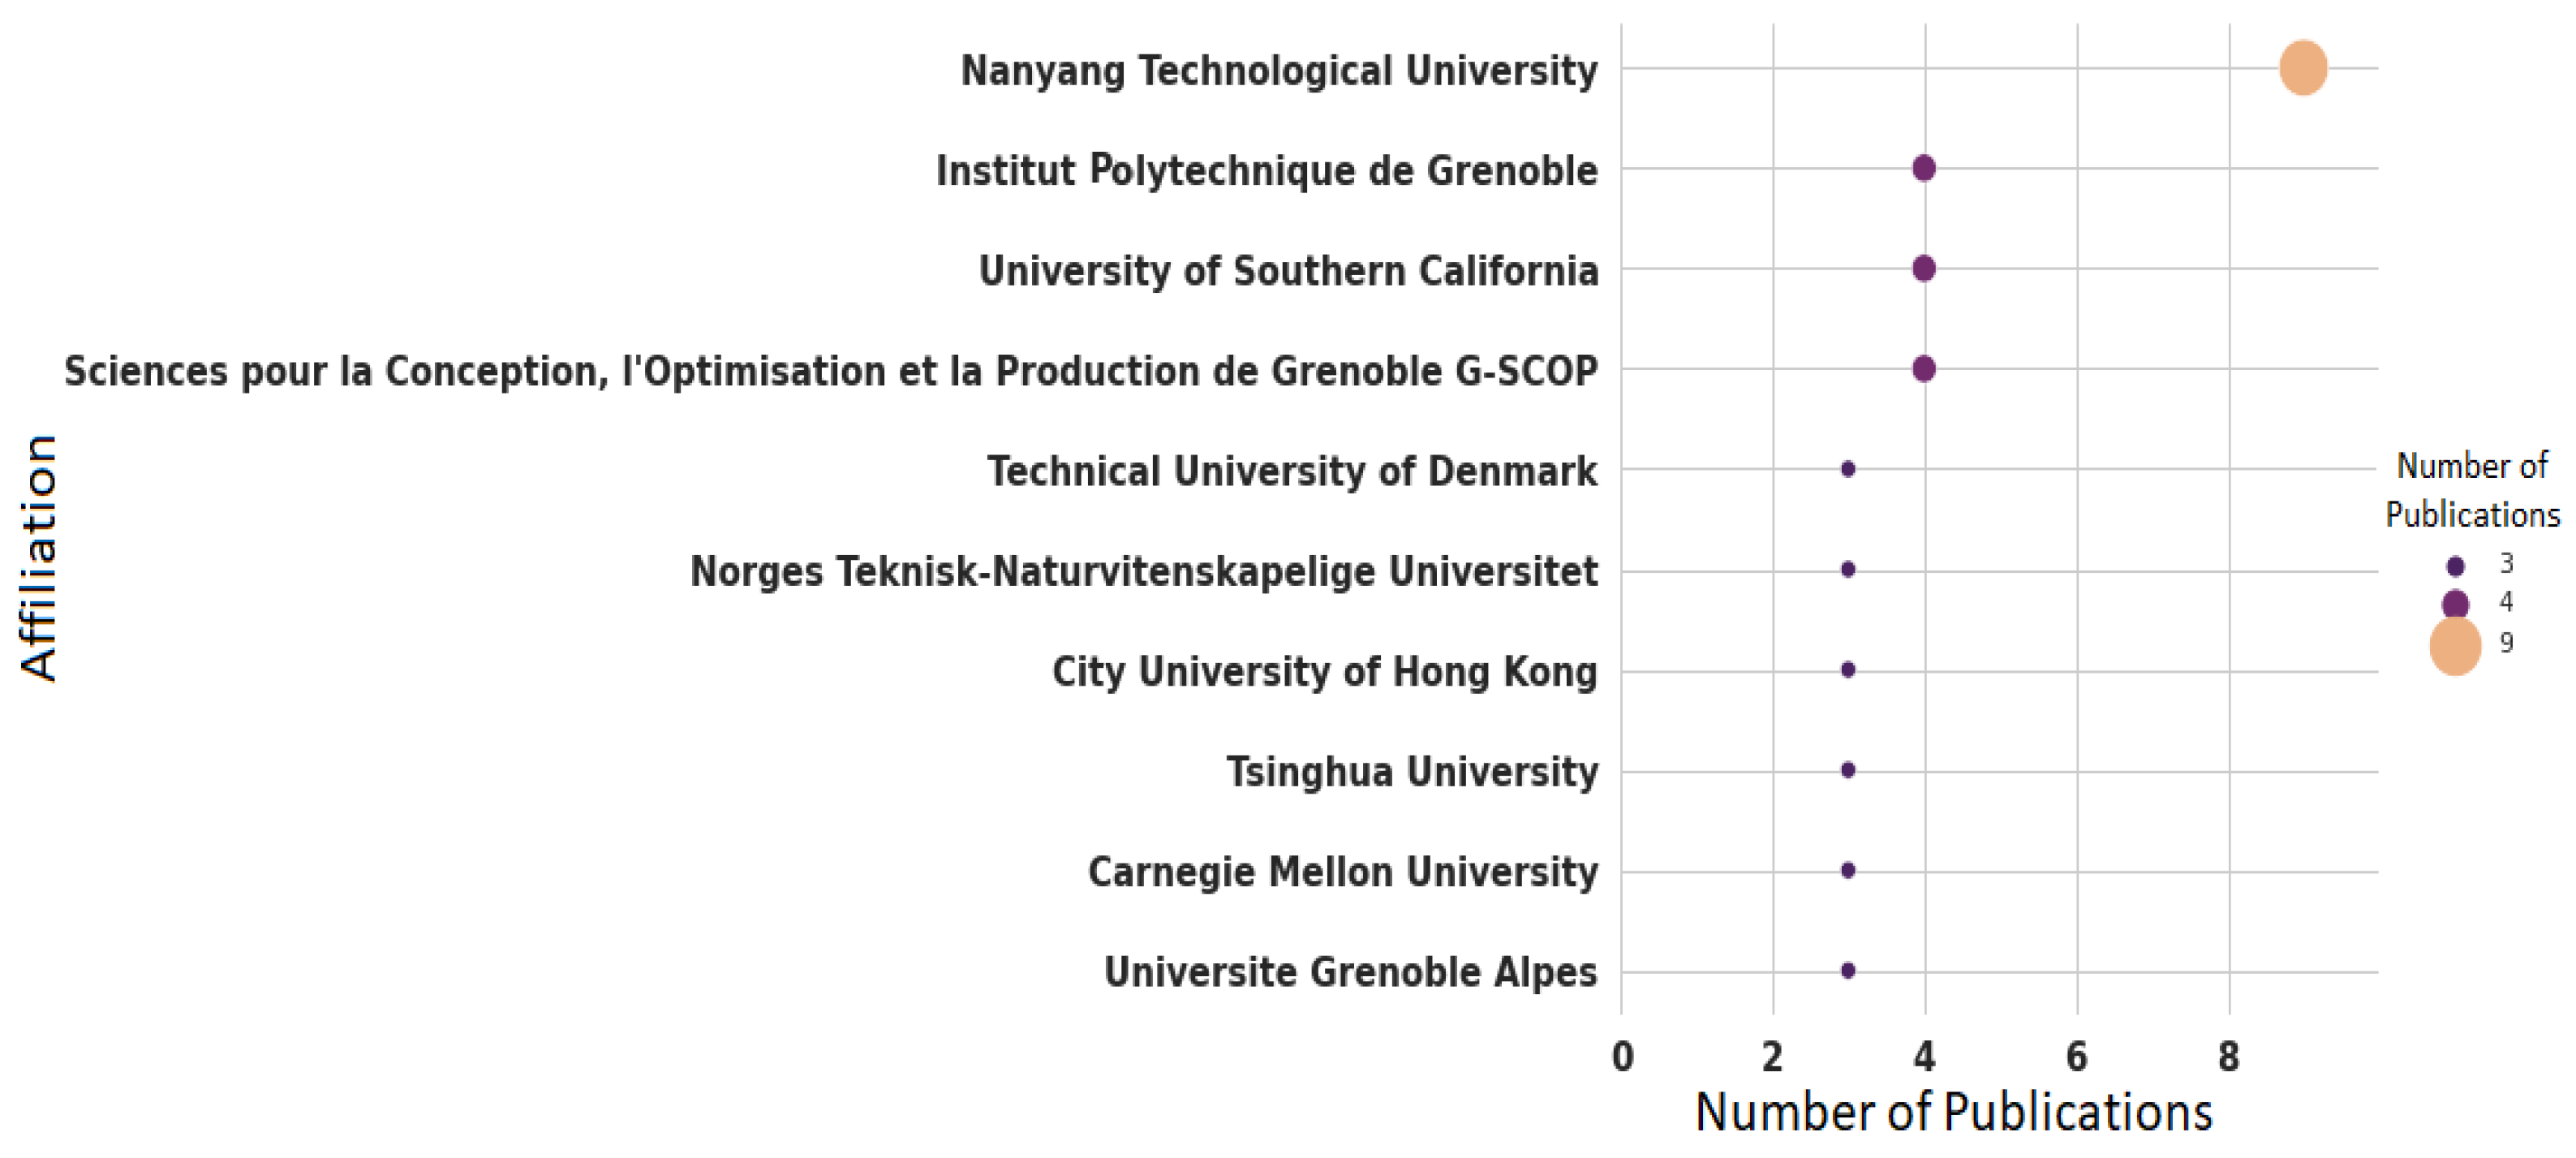
3.1. Study Characteristics
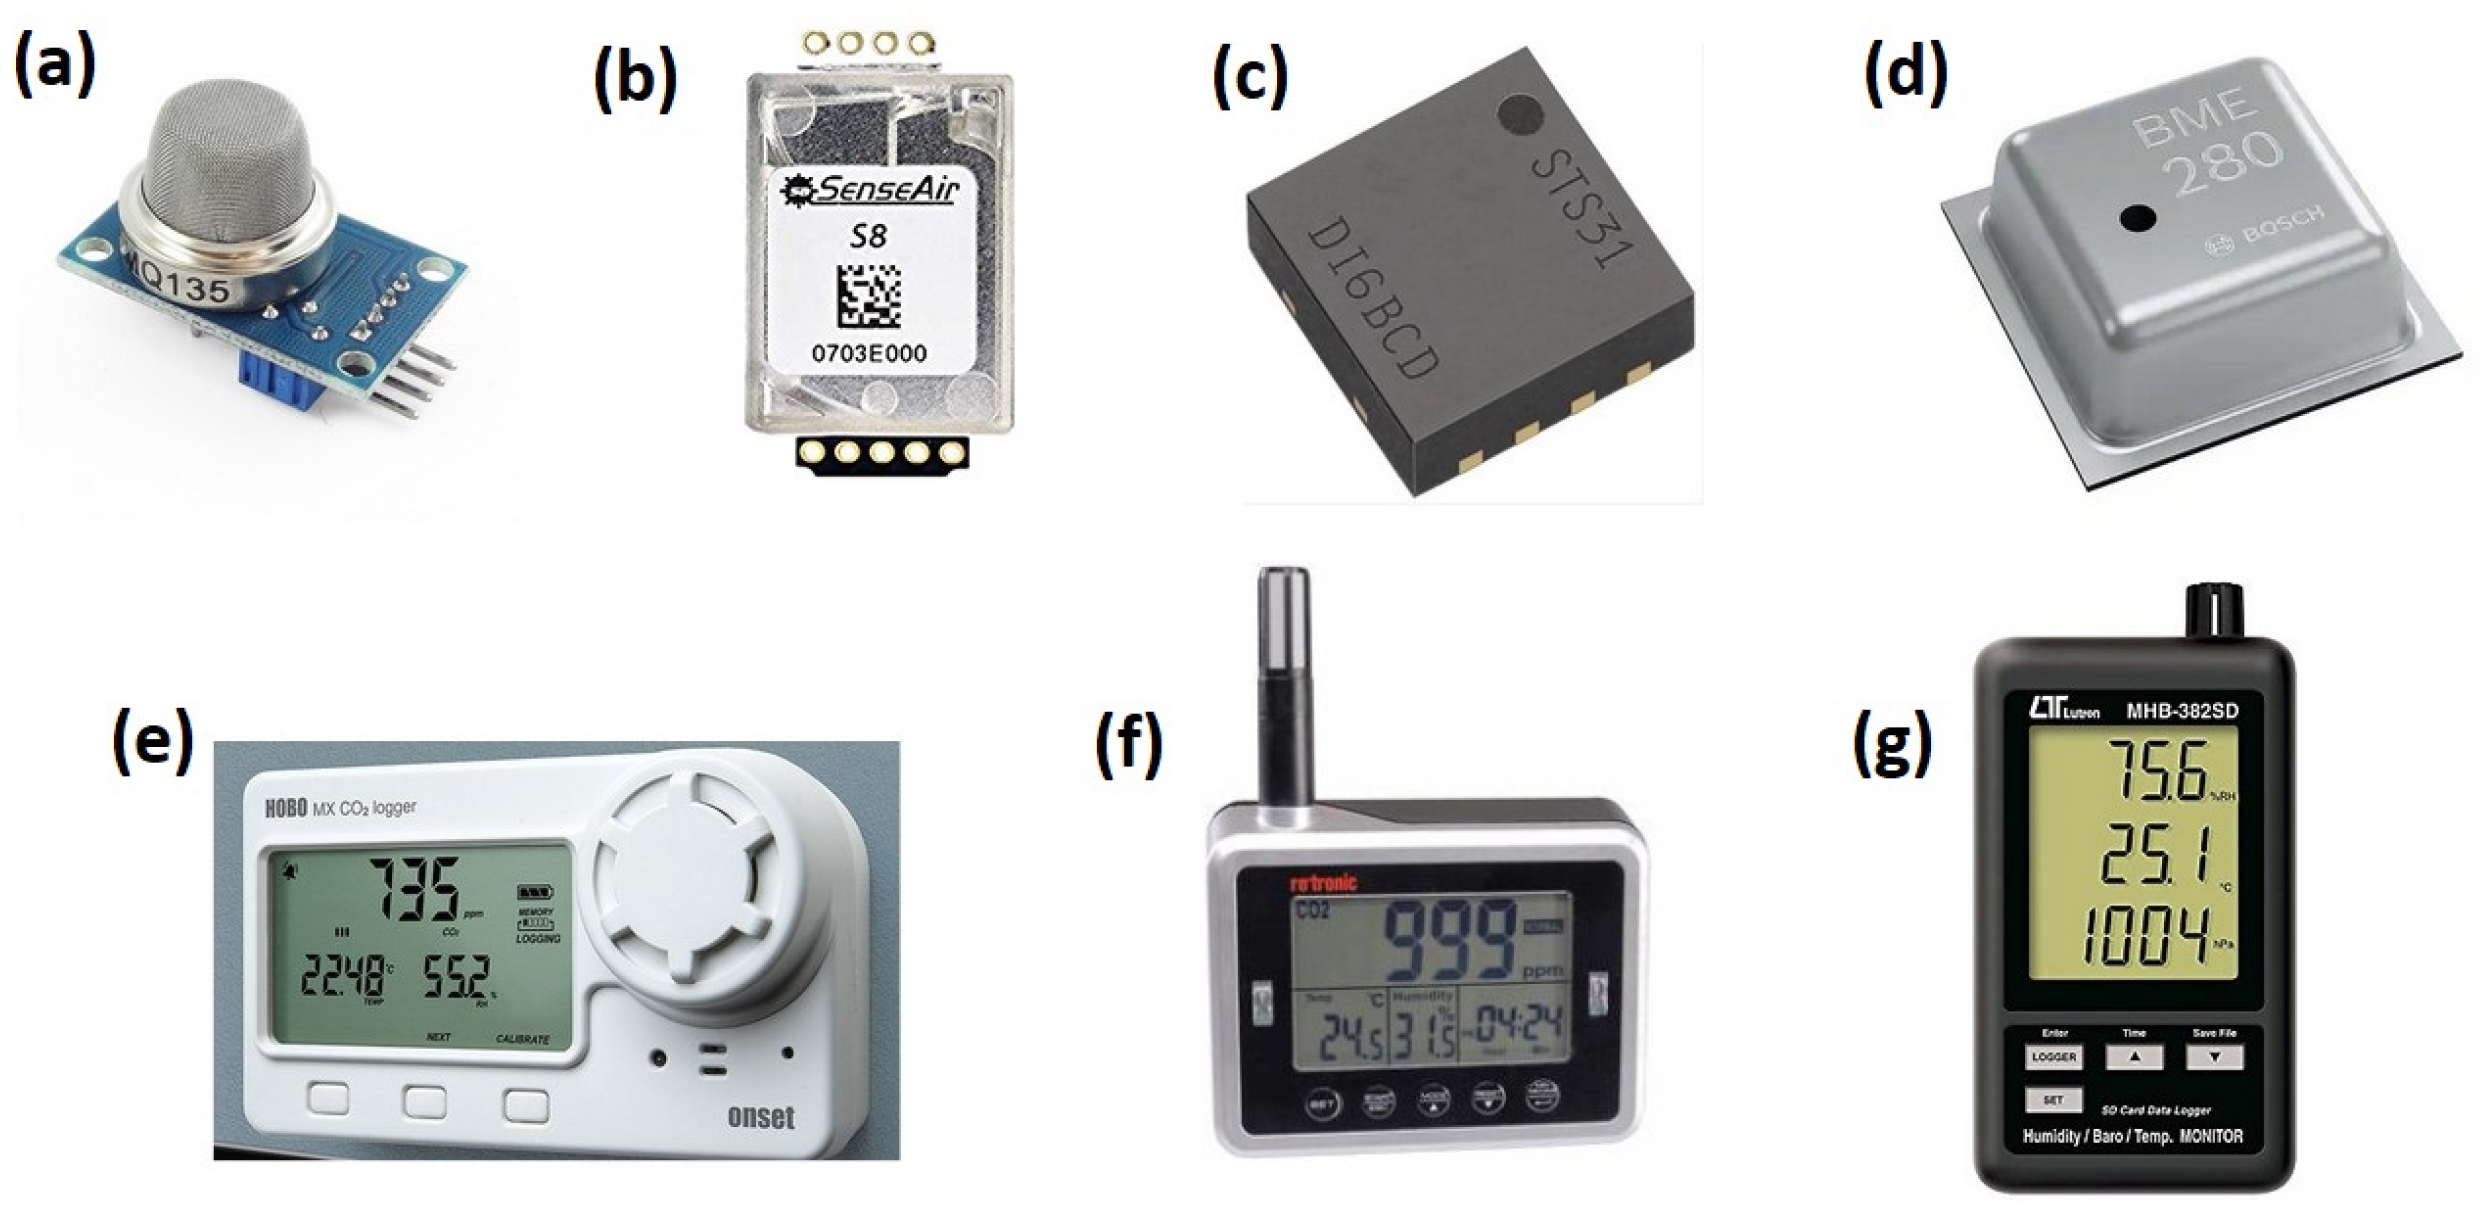
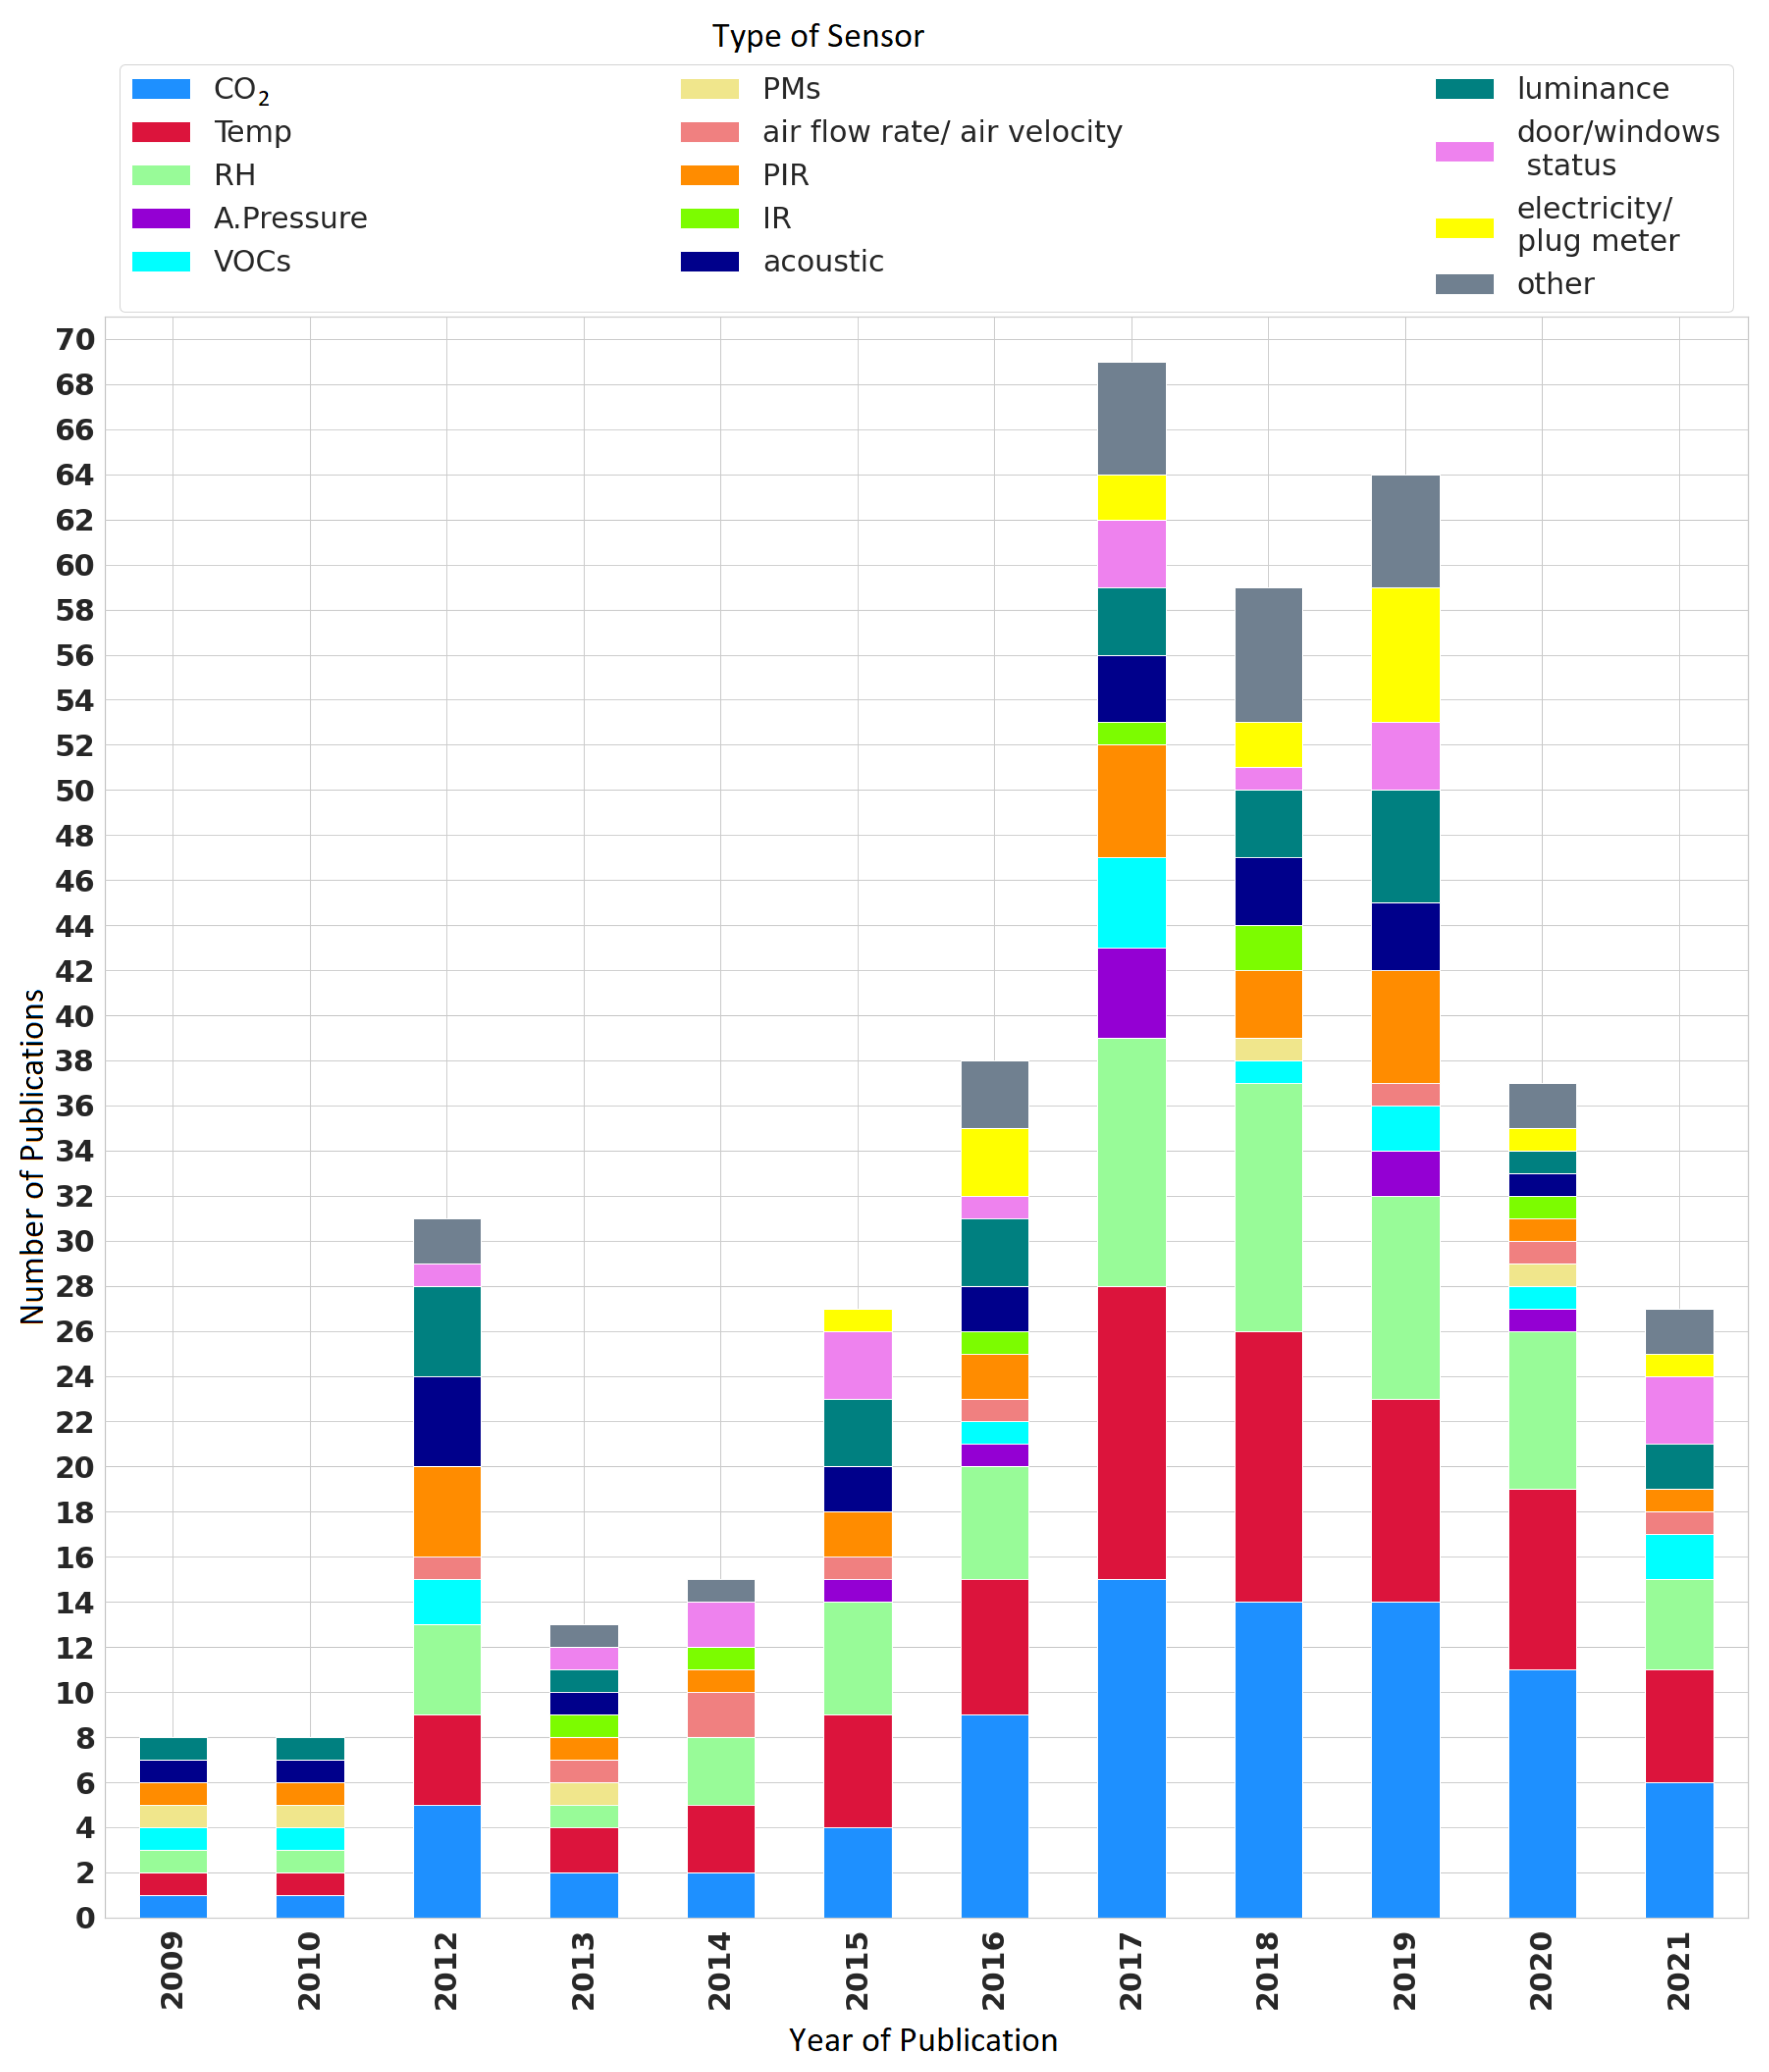
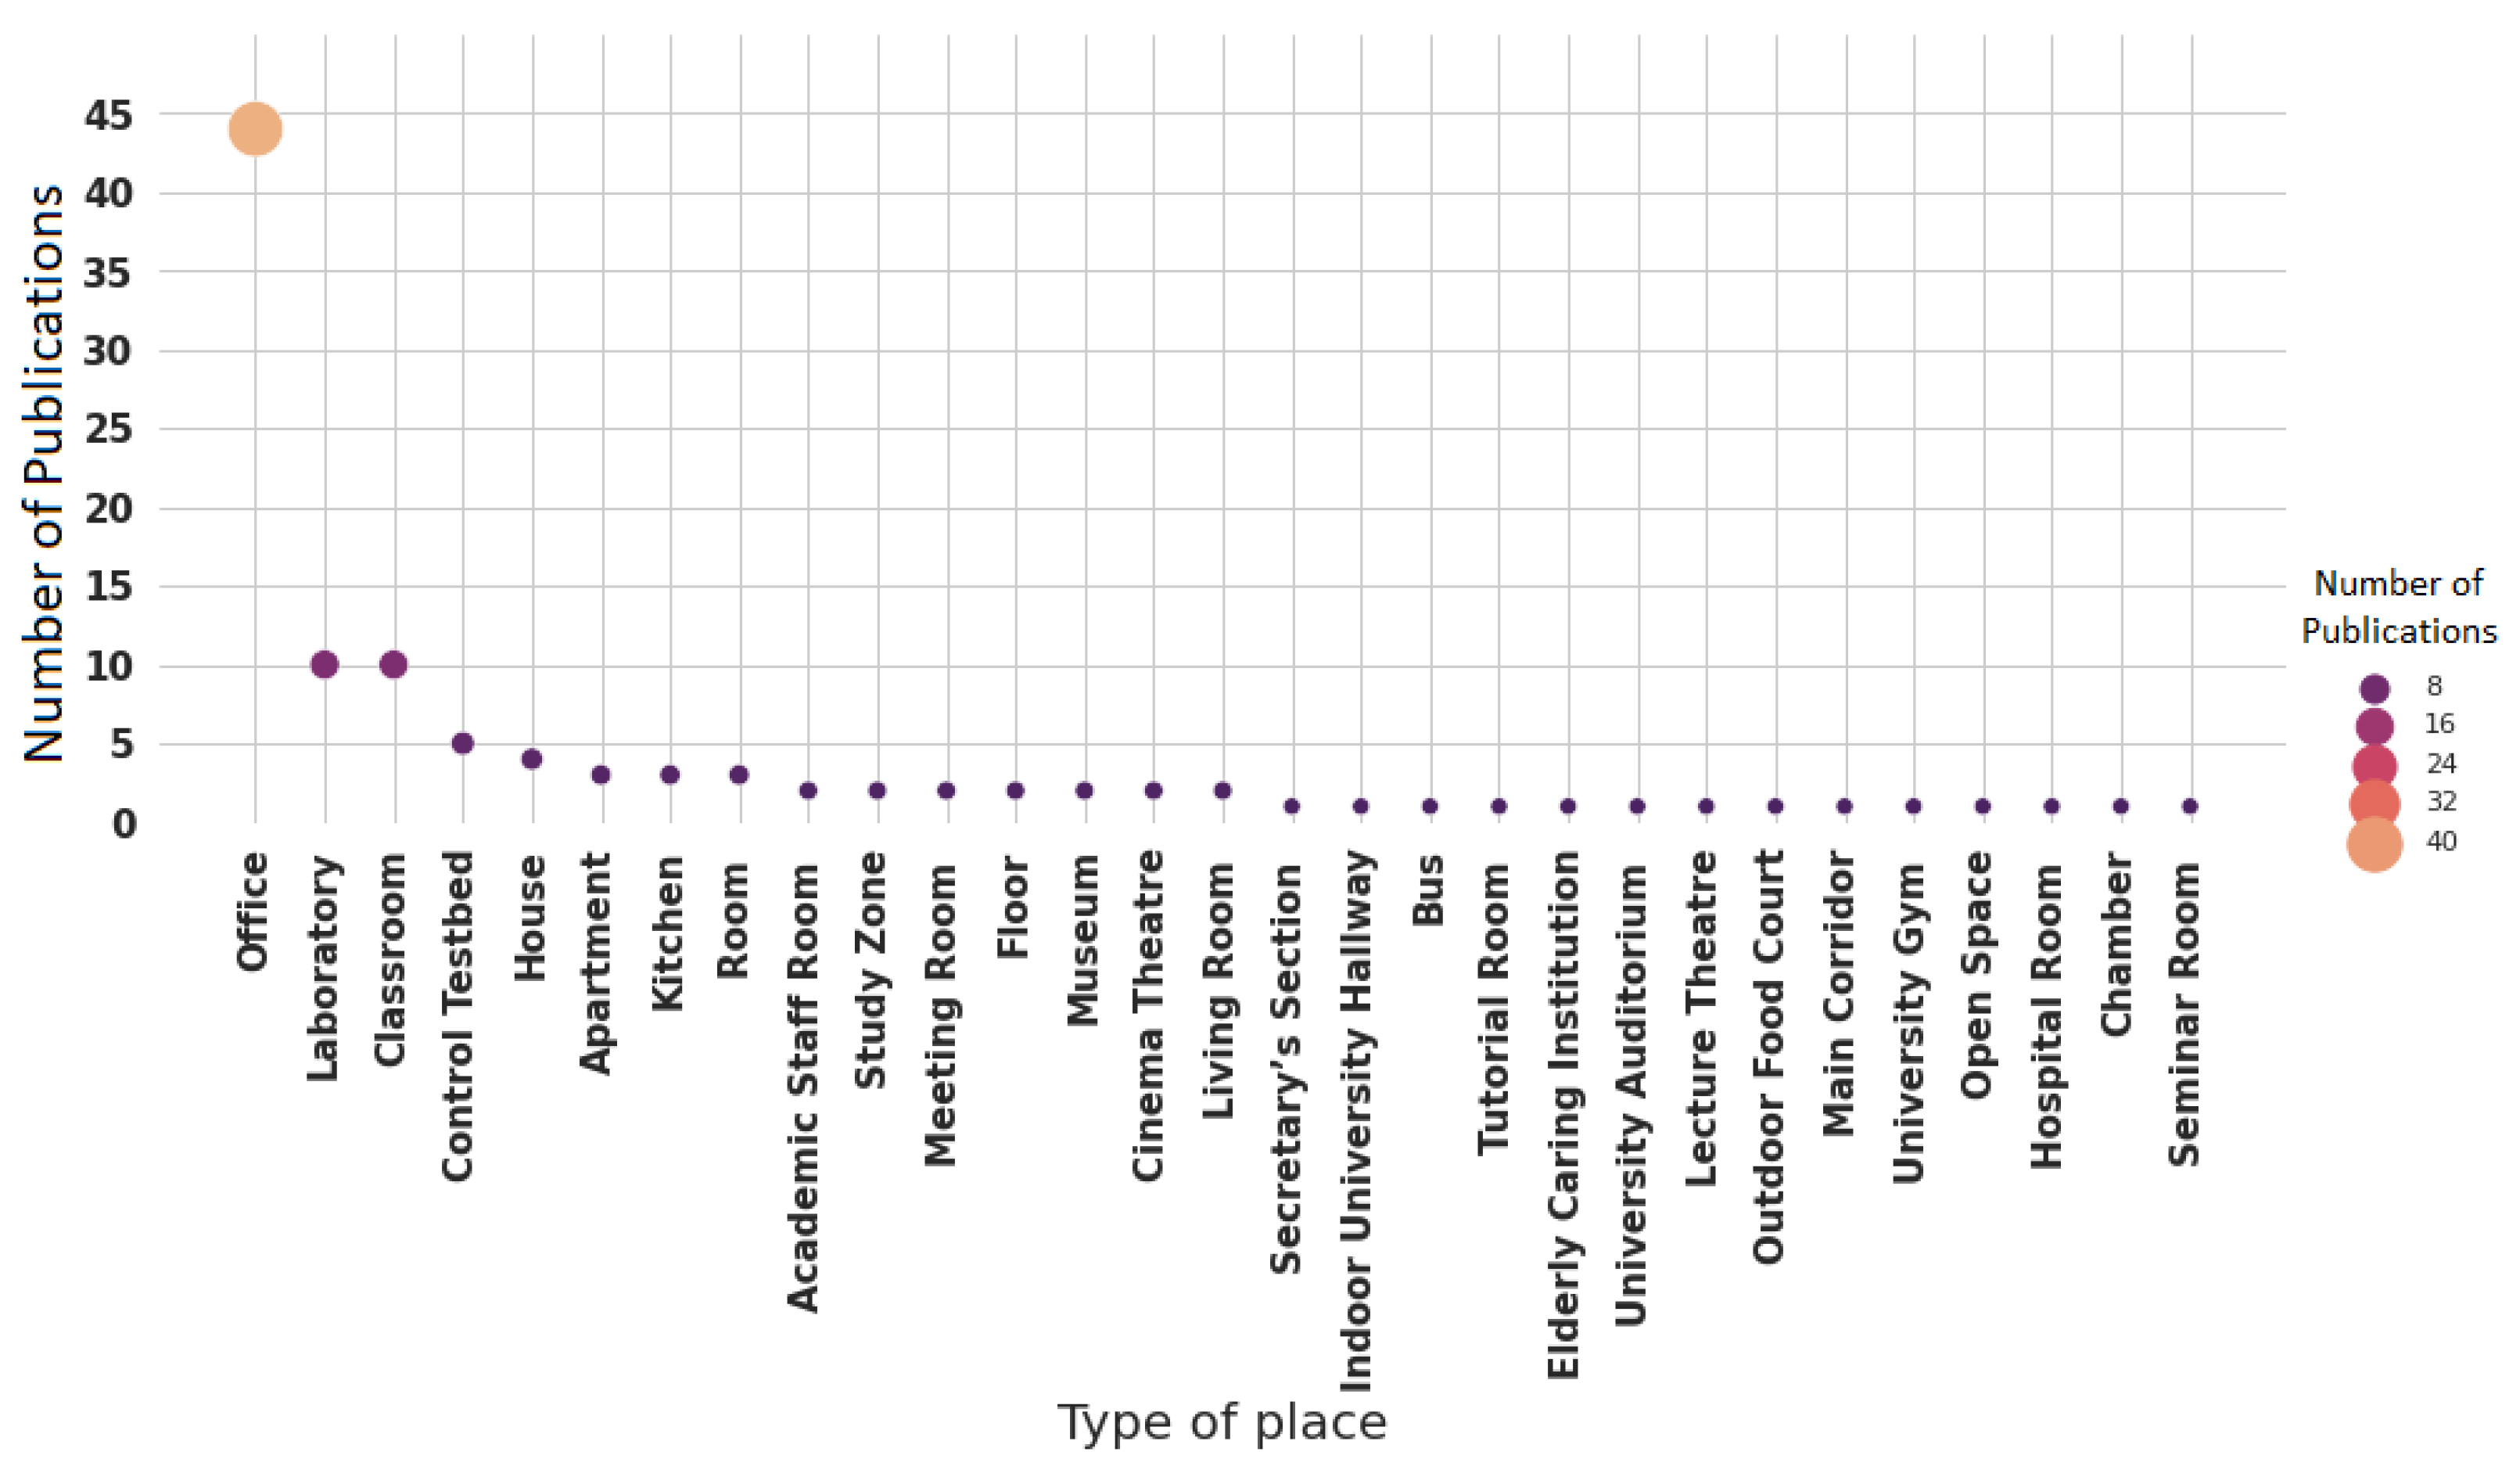
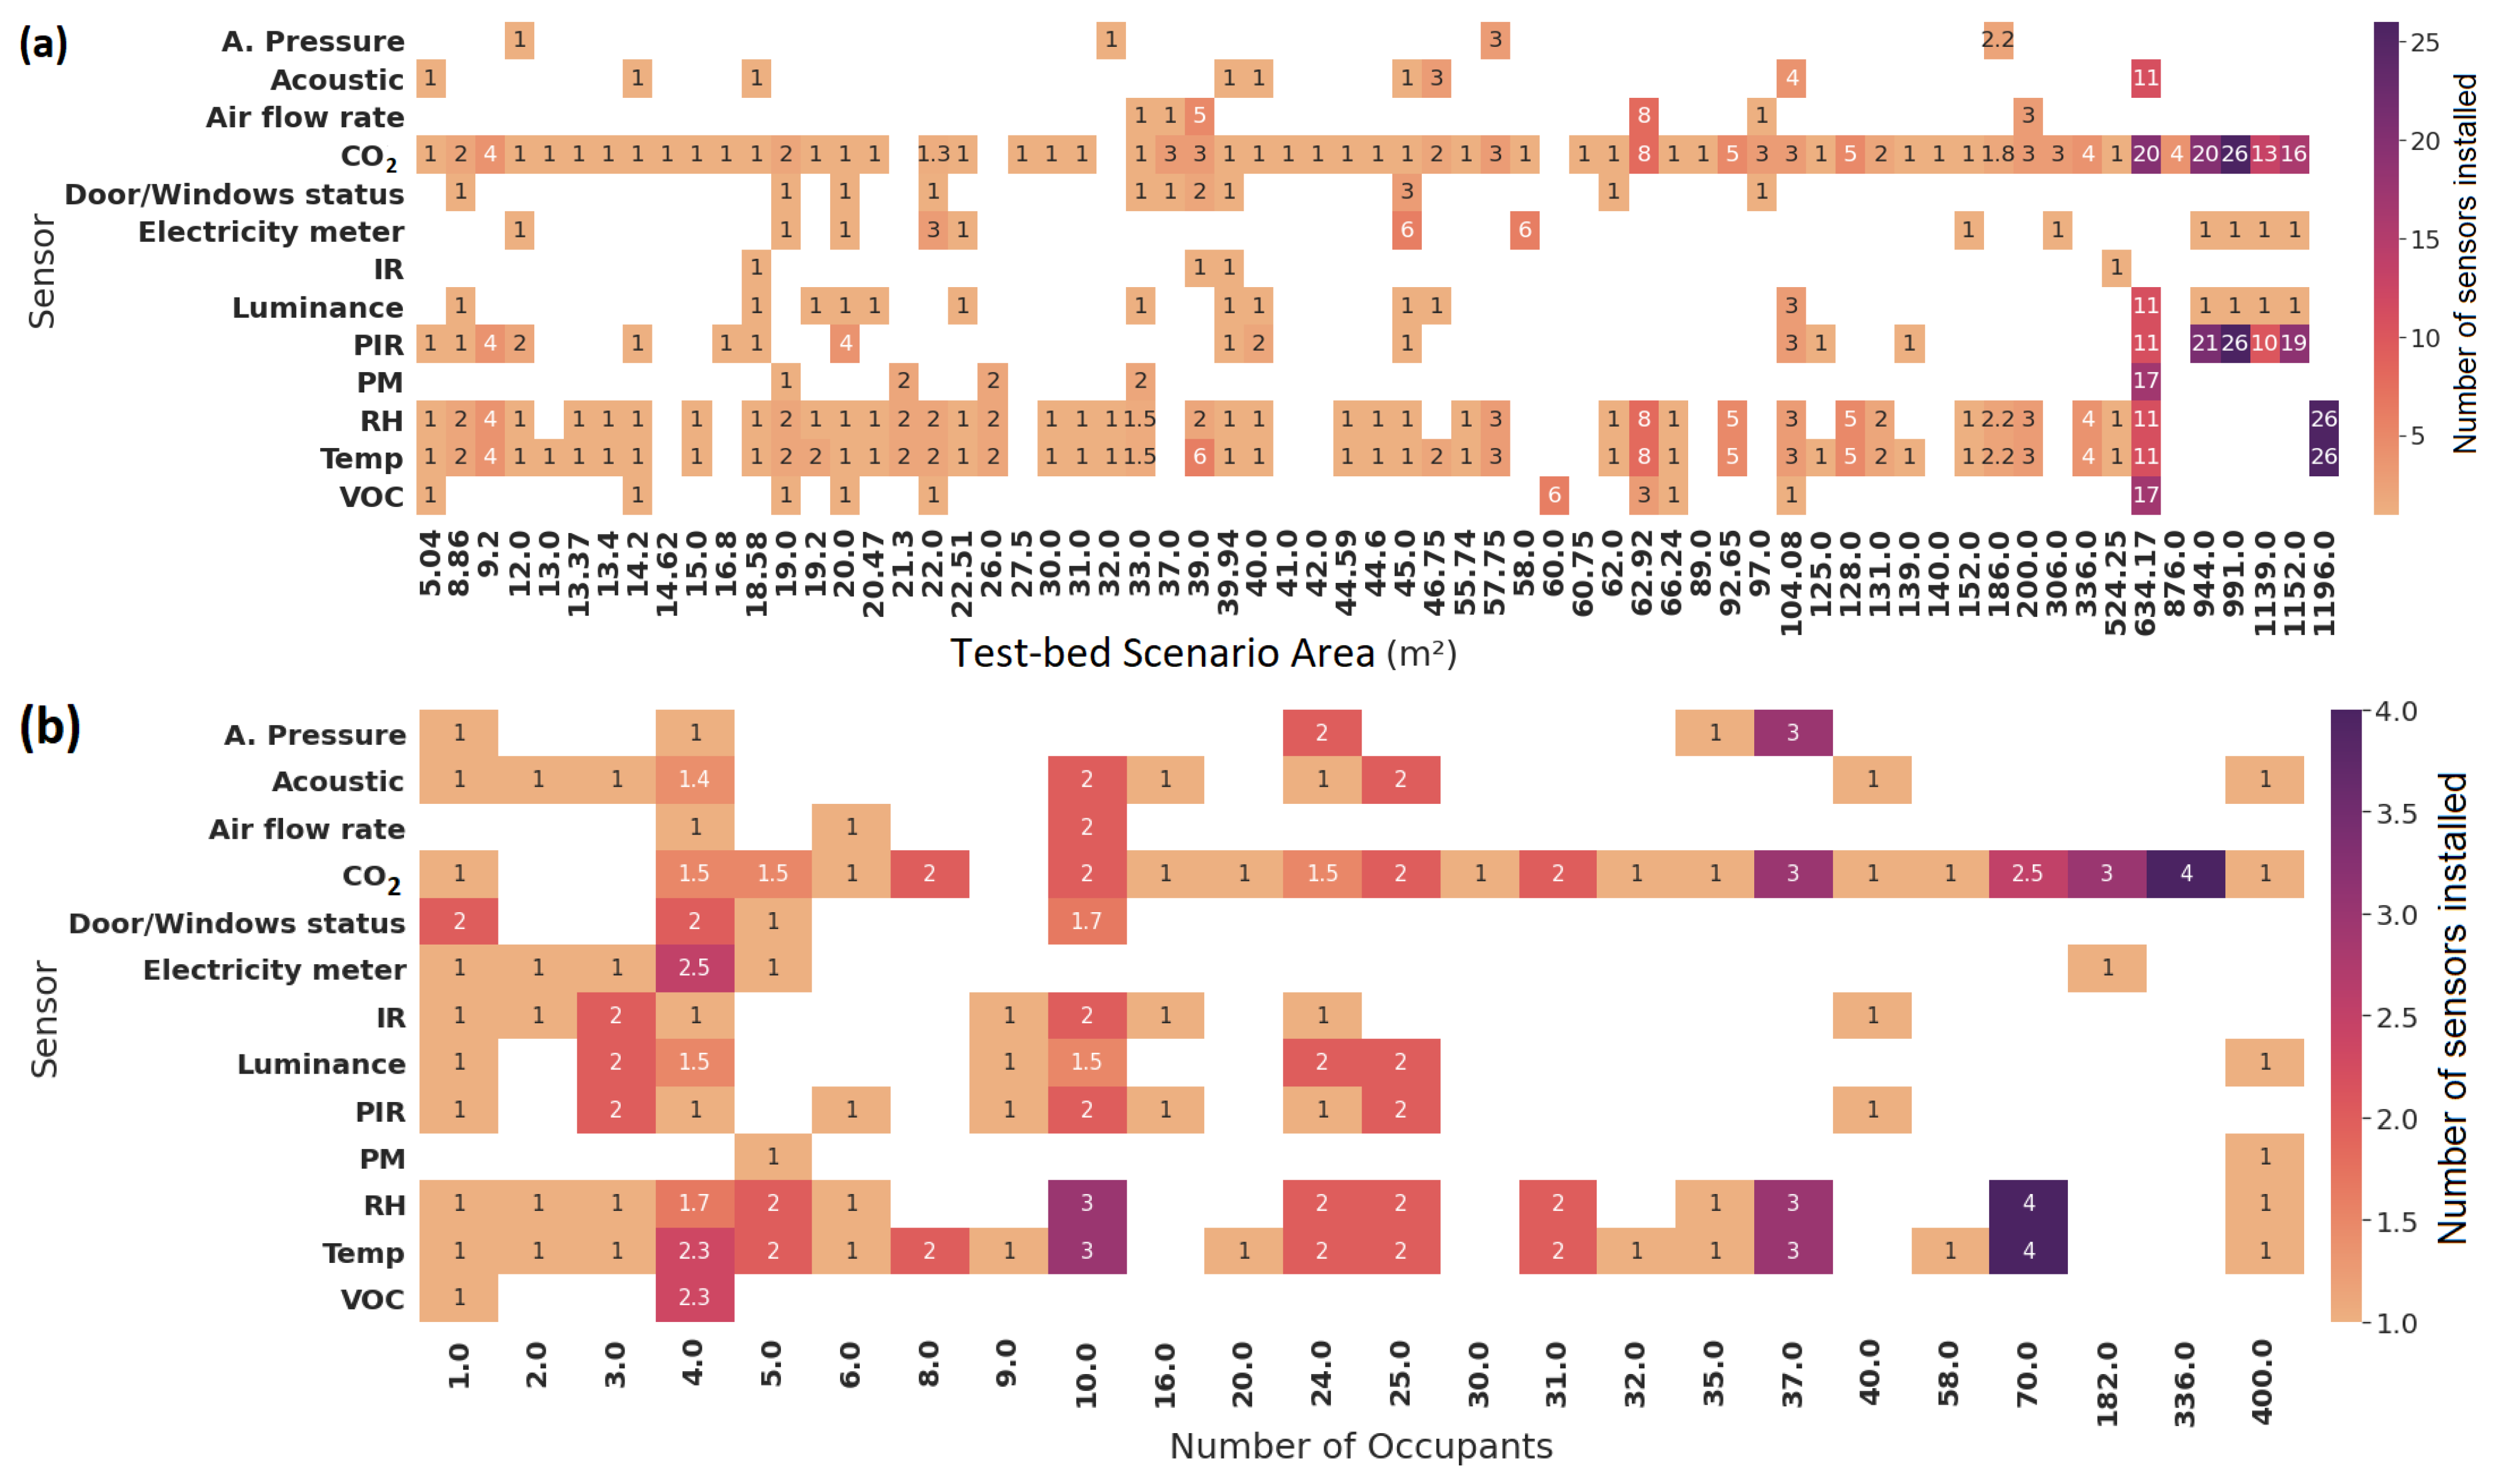
3.2. Type of Sensor and Indoor Place Characteristics
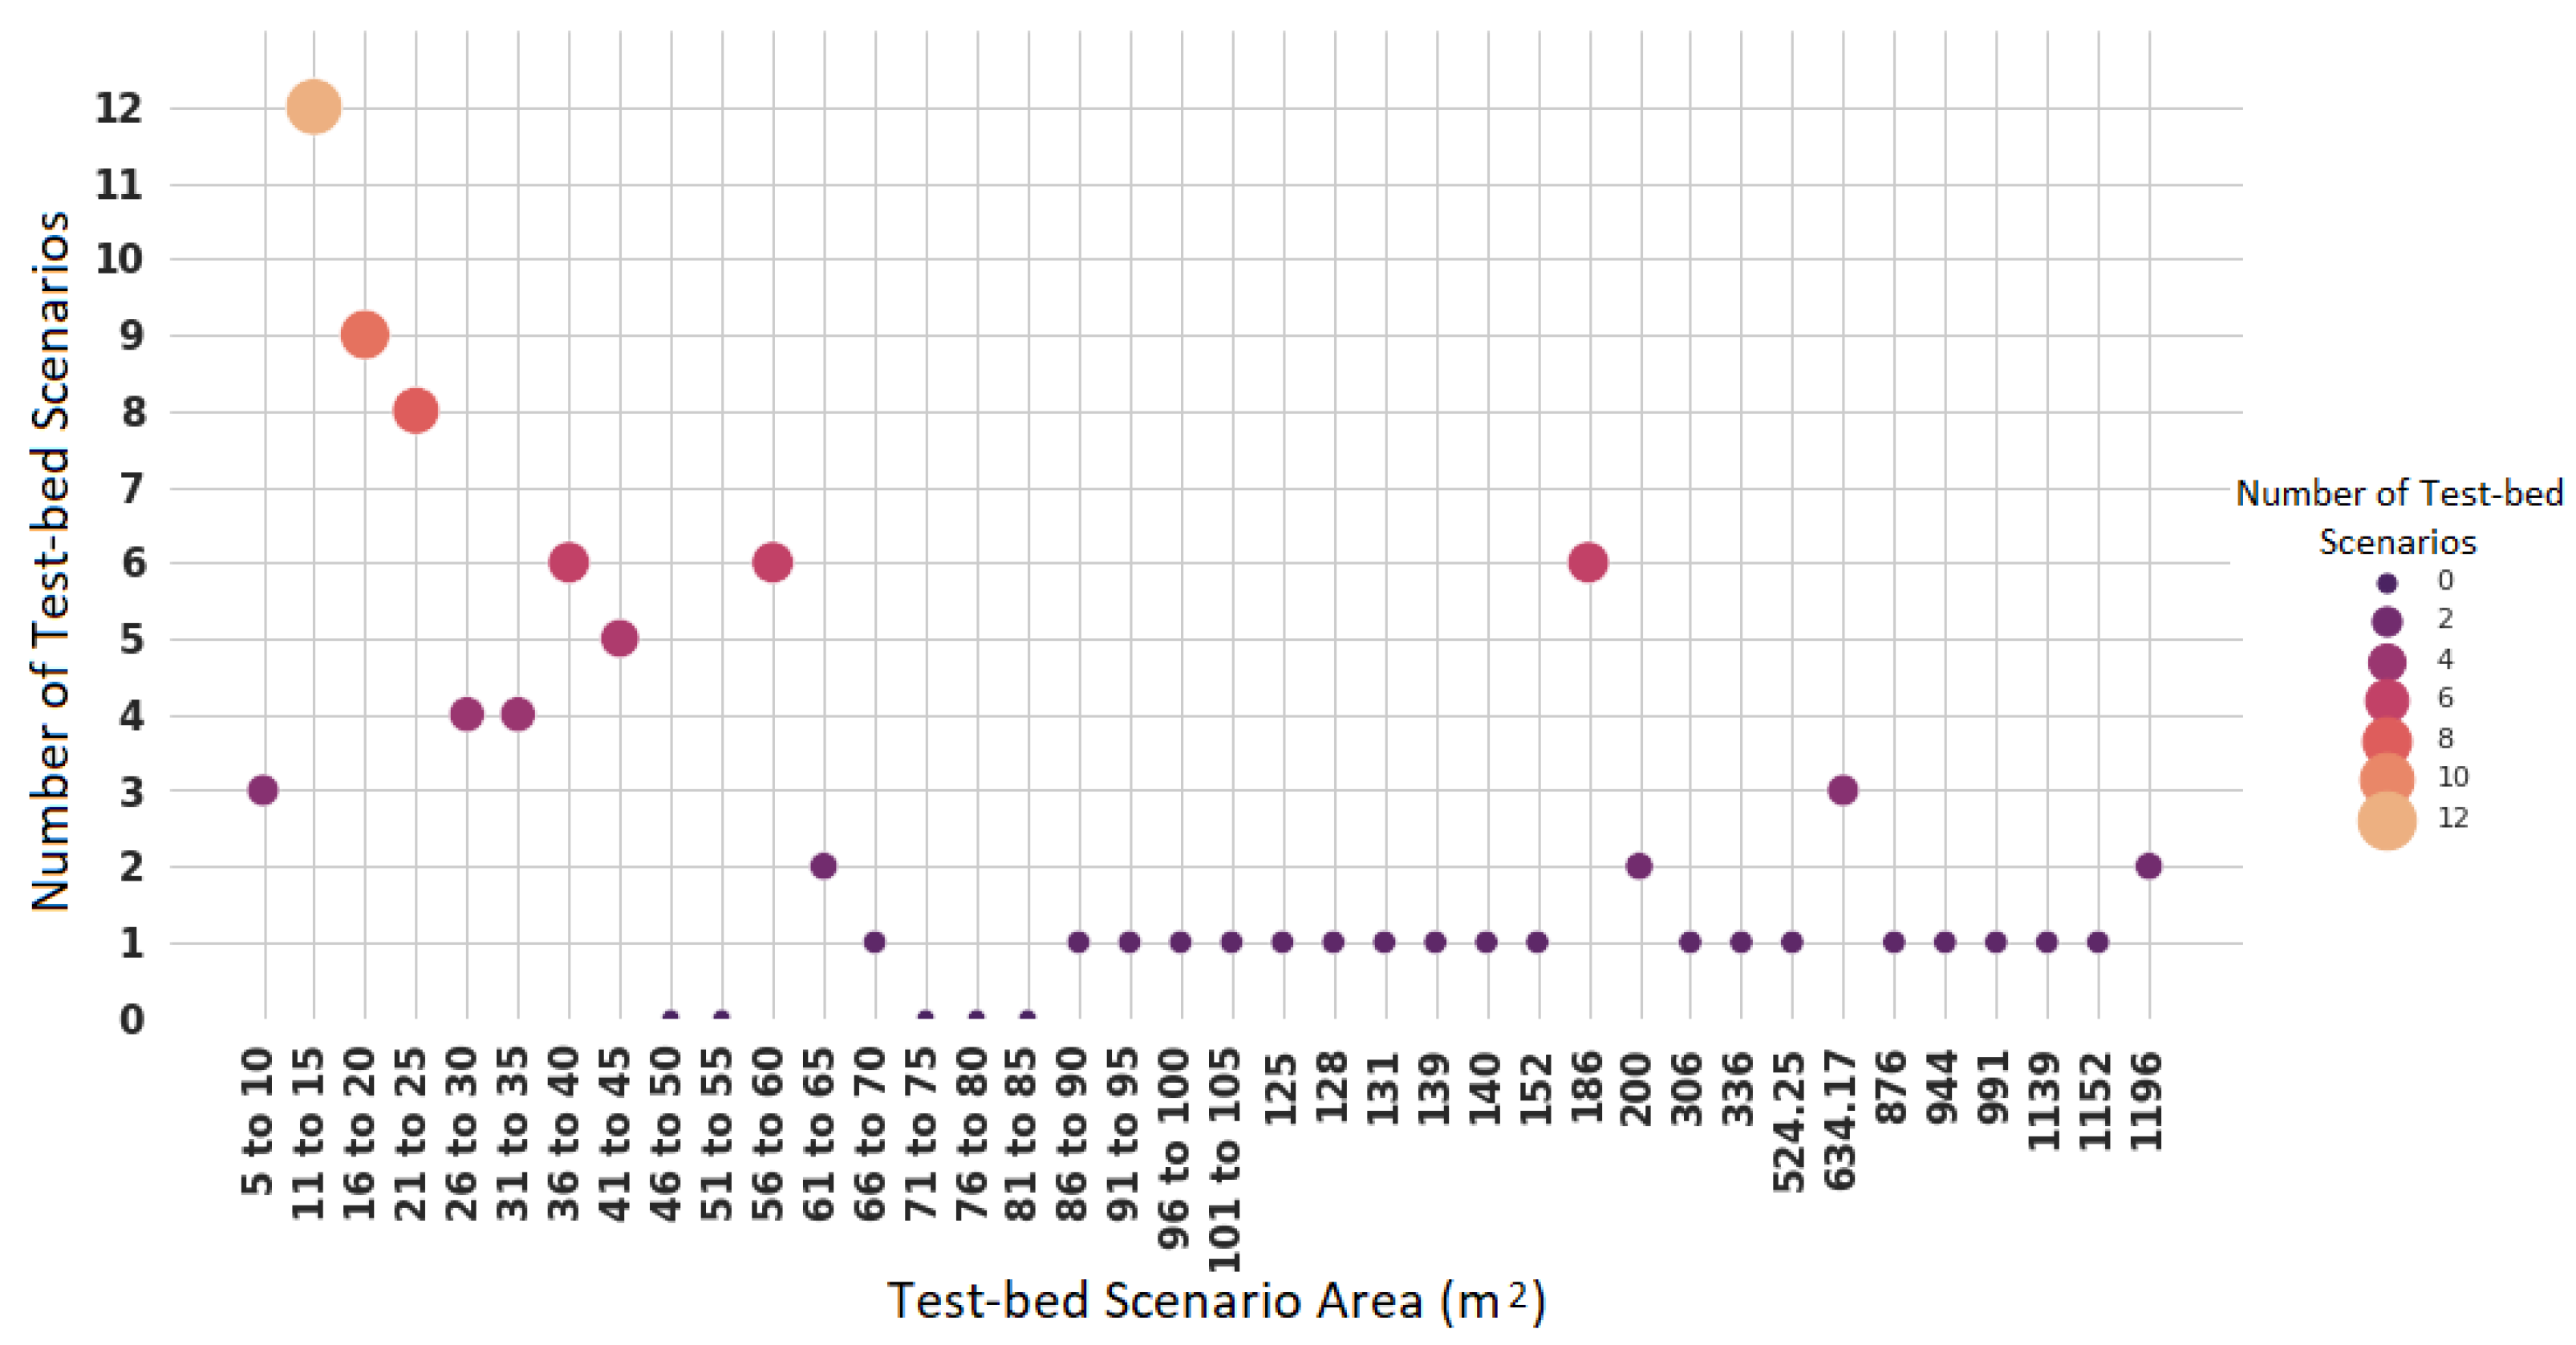
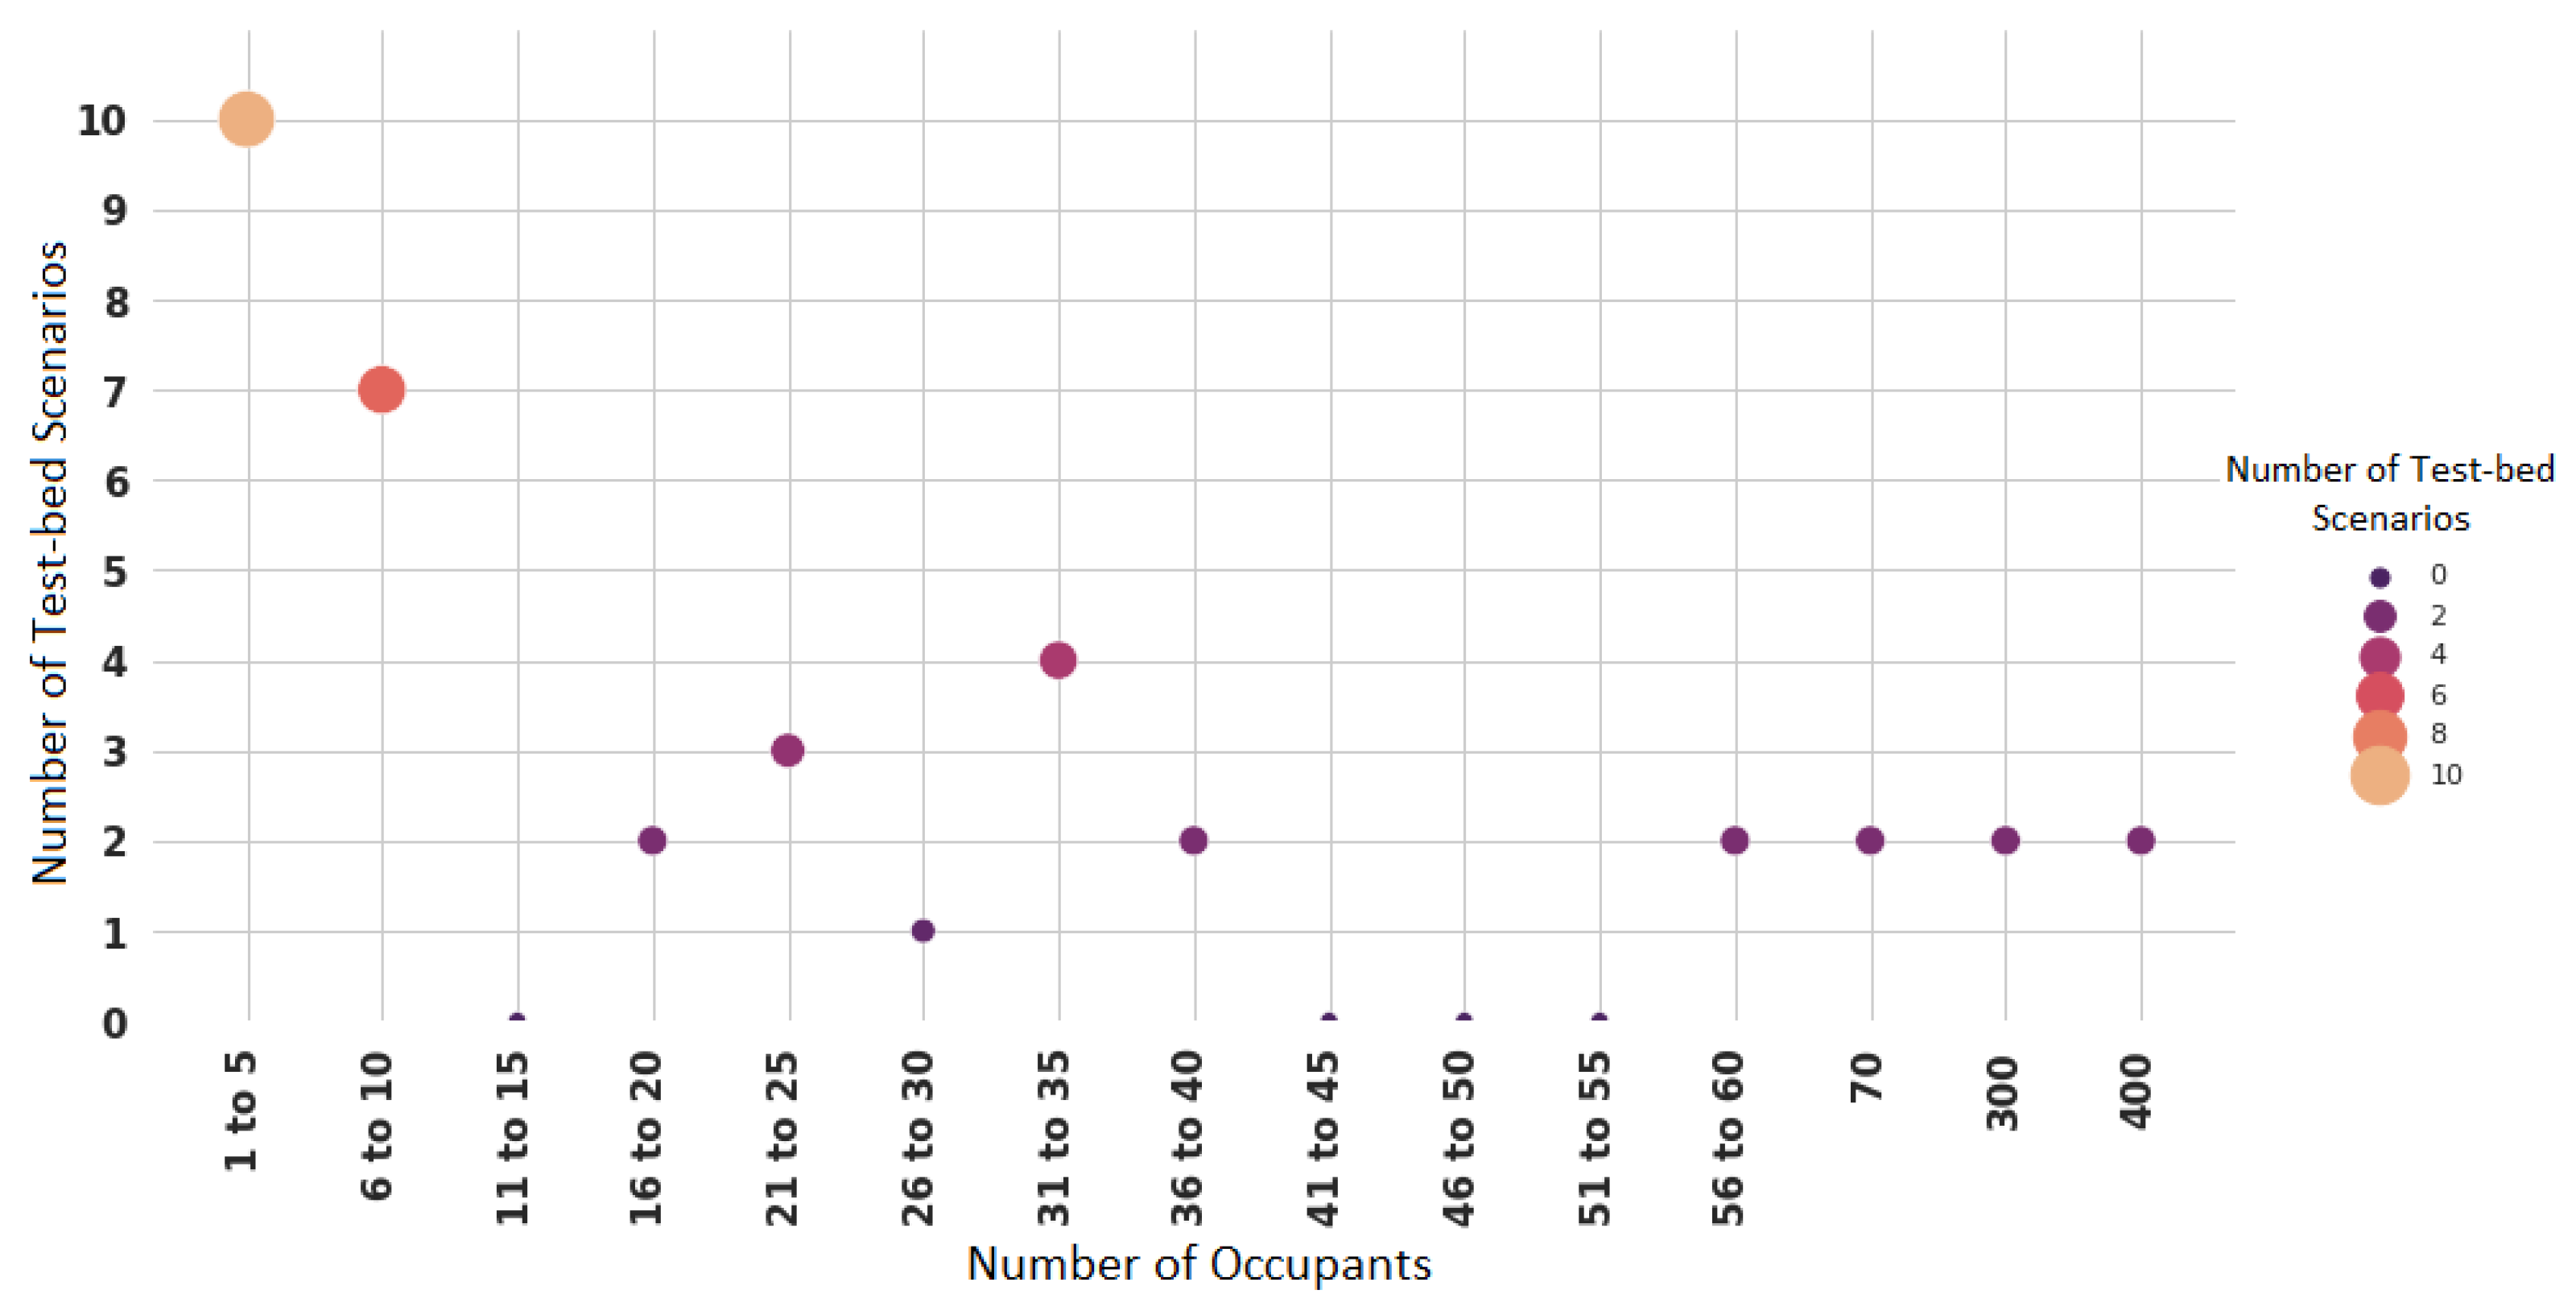
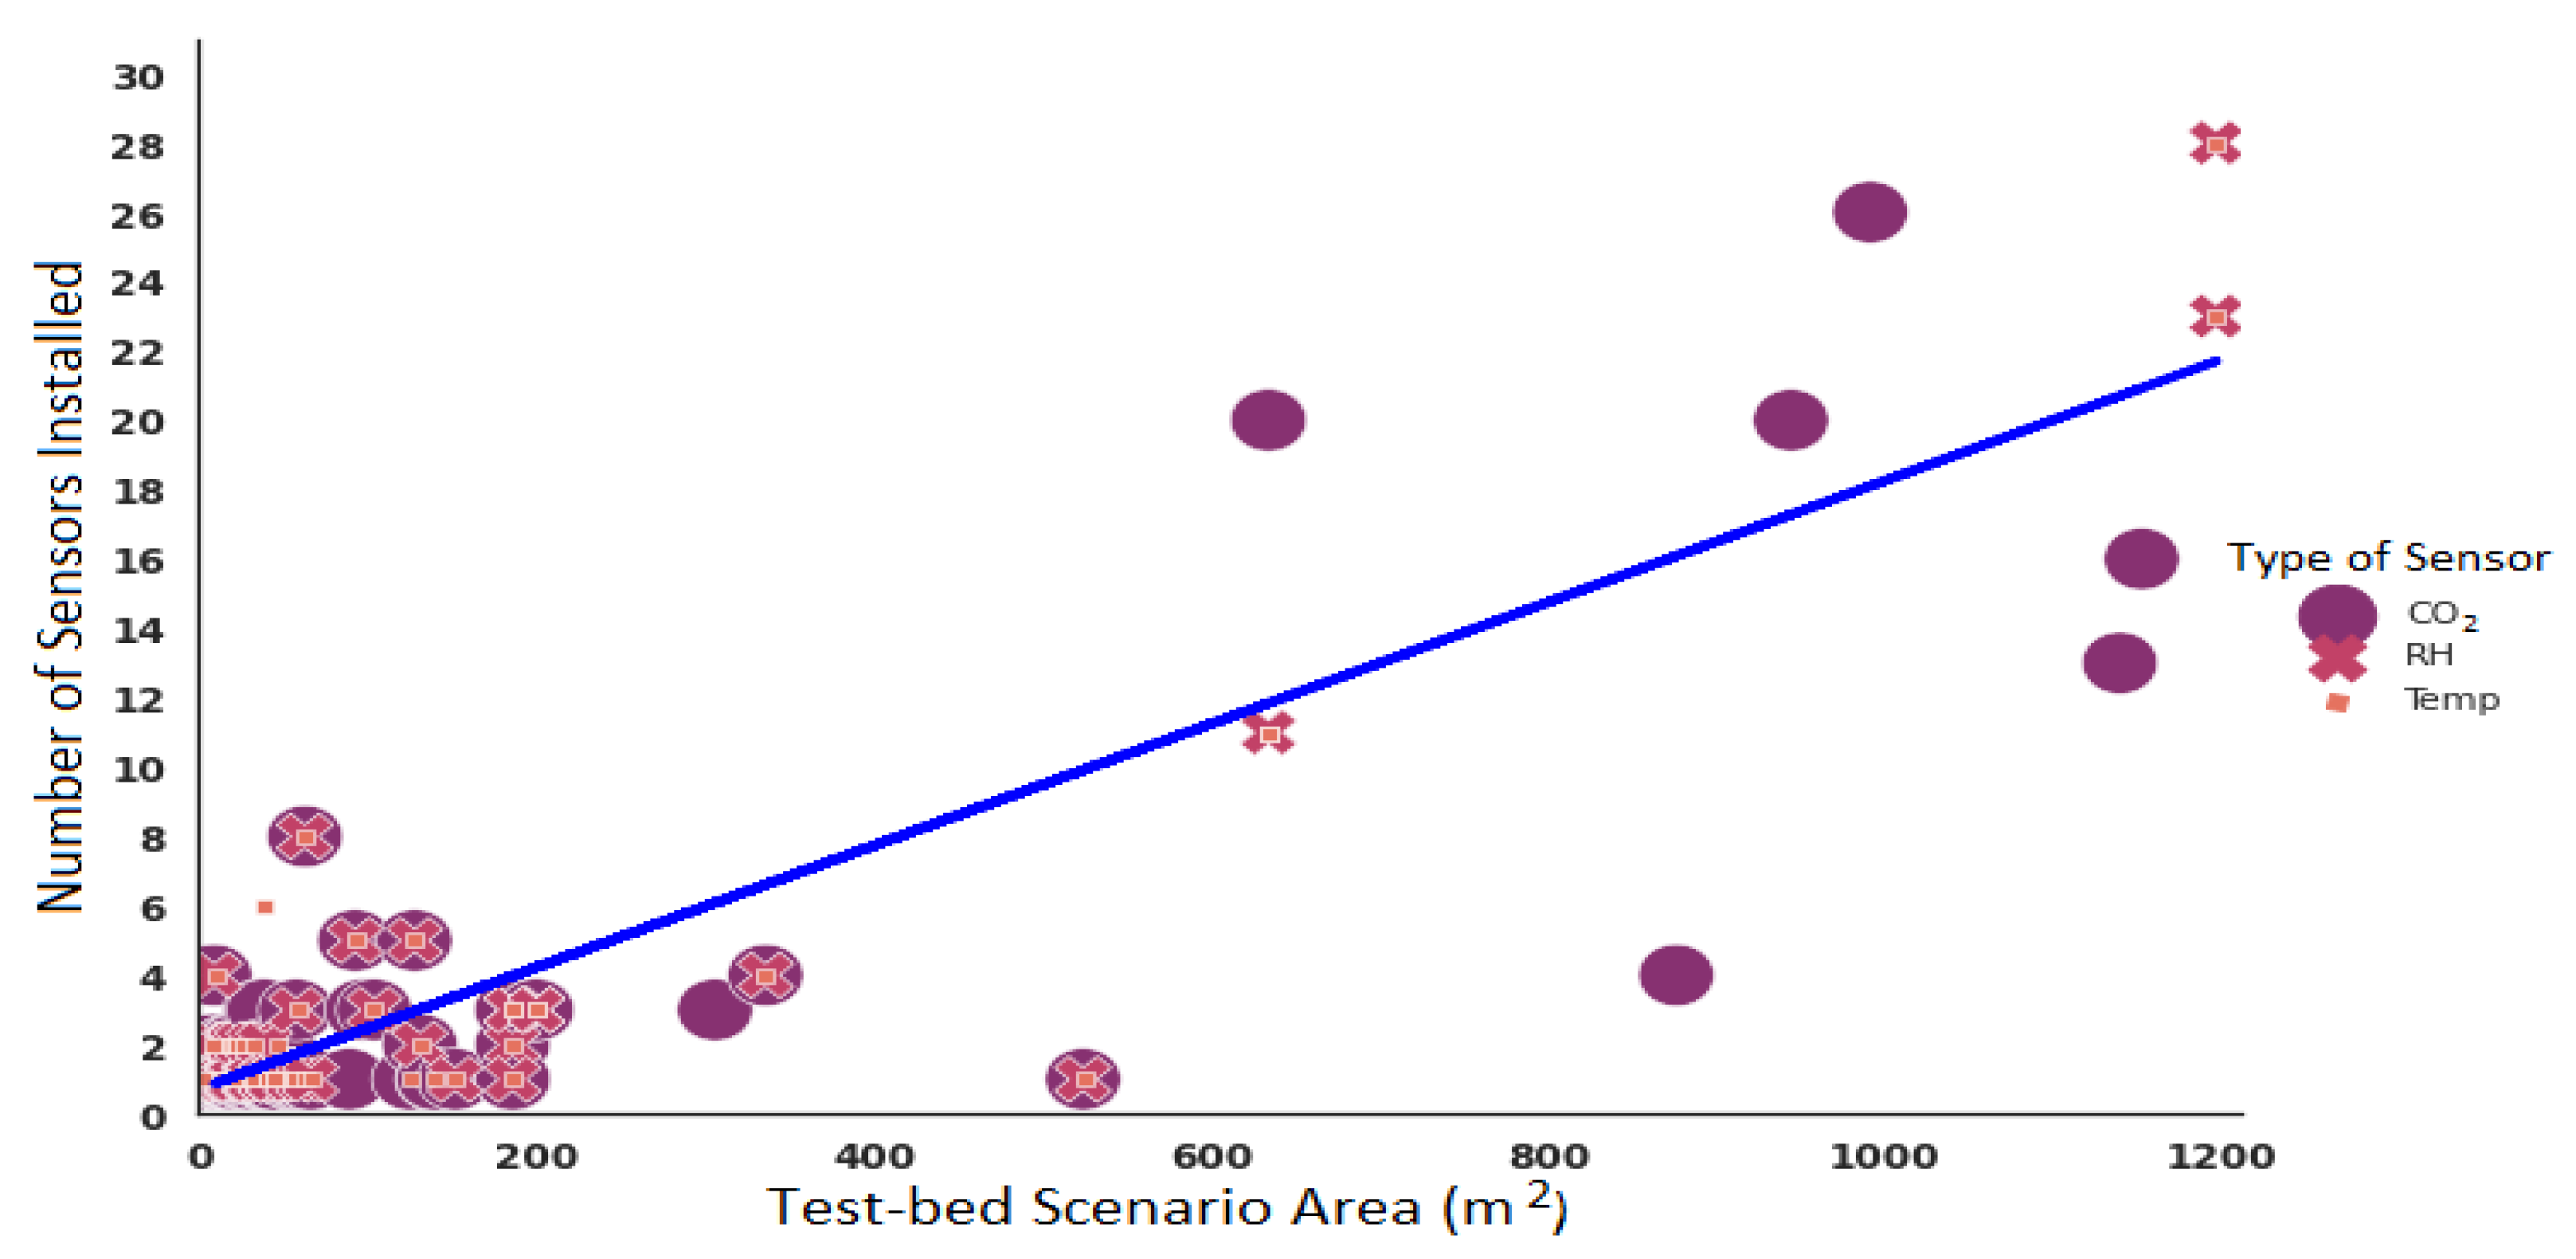
3.3. Place Dimension vs. Total Number of Sensors Deployed
3.4. Sensor Deployment Specifications
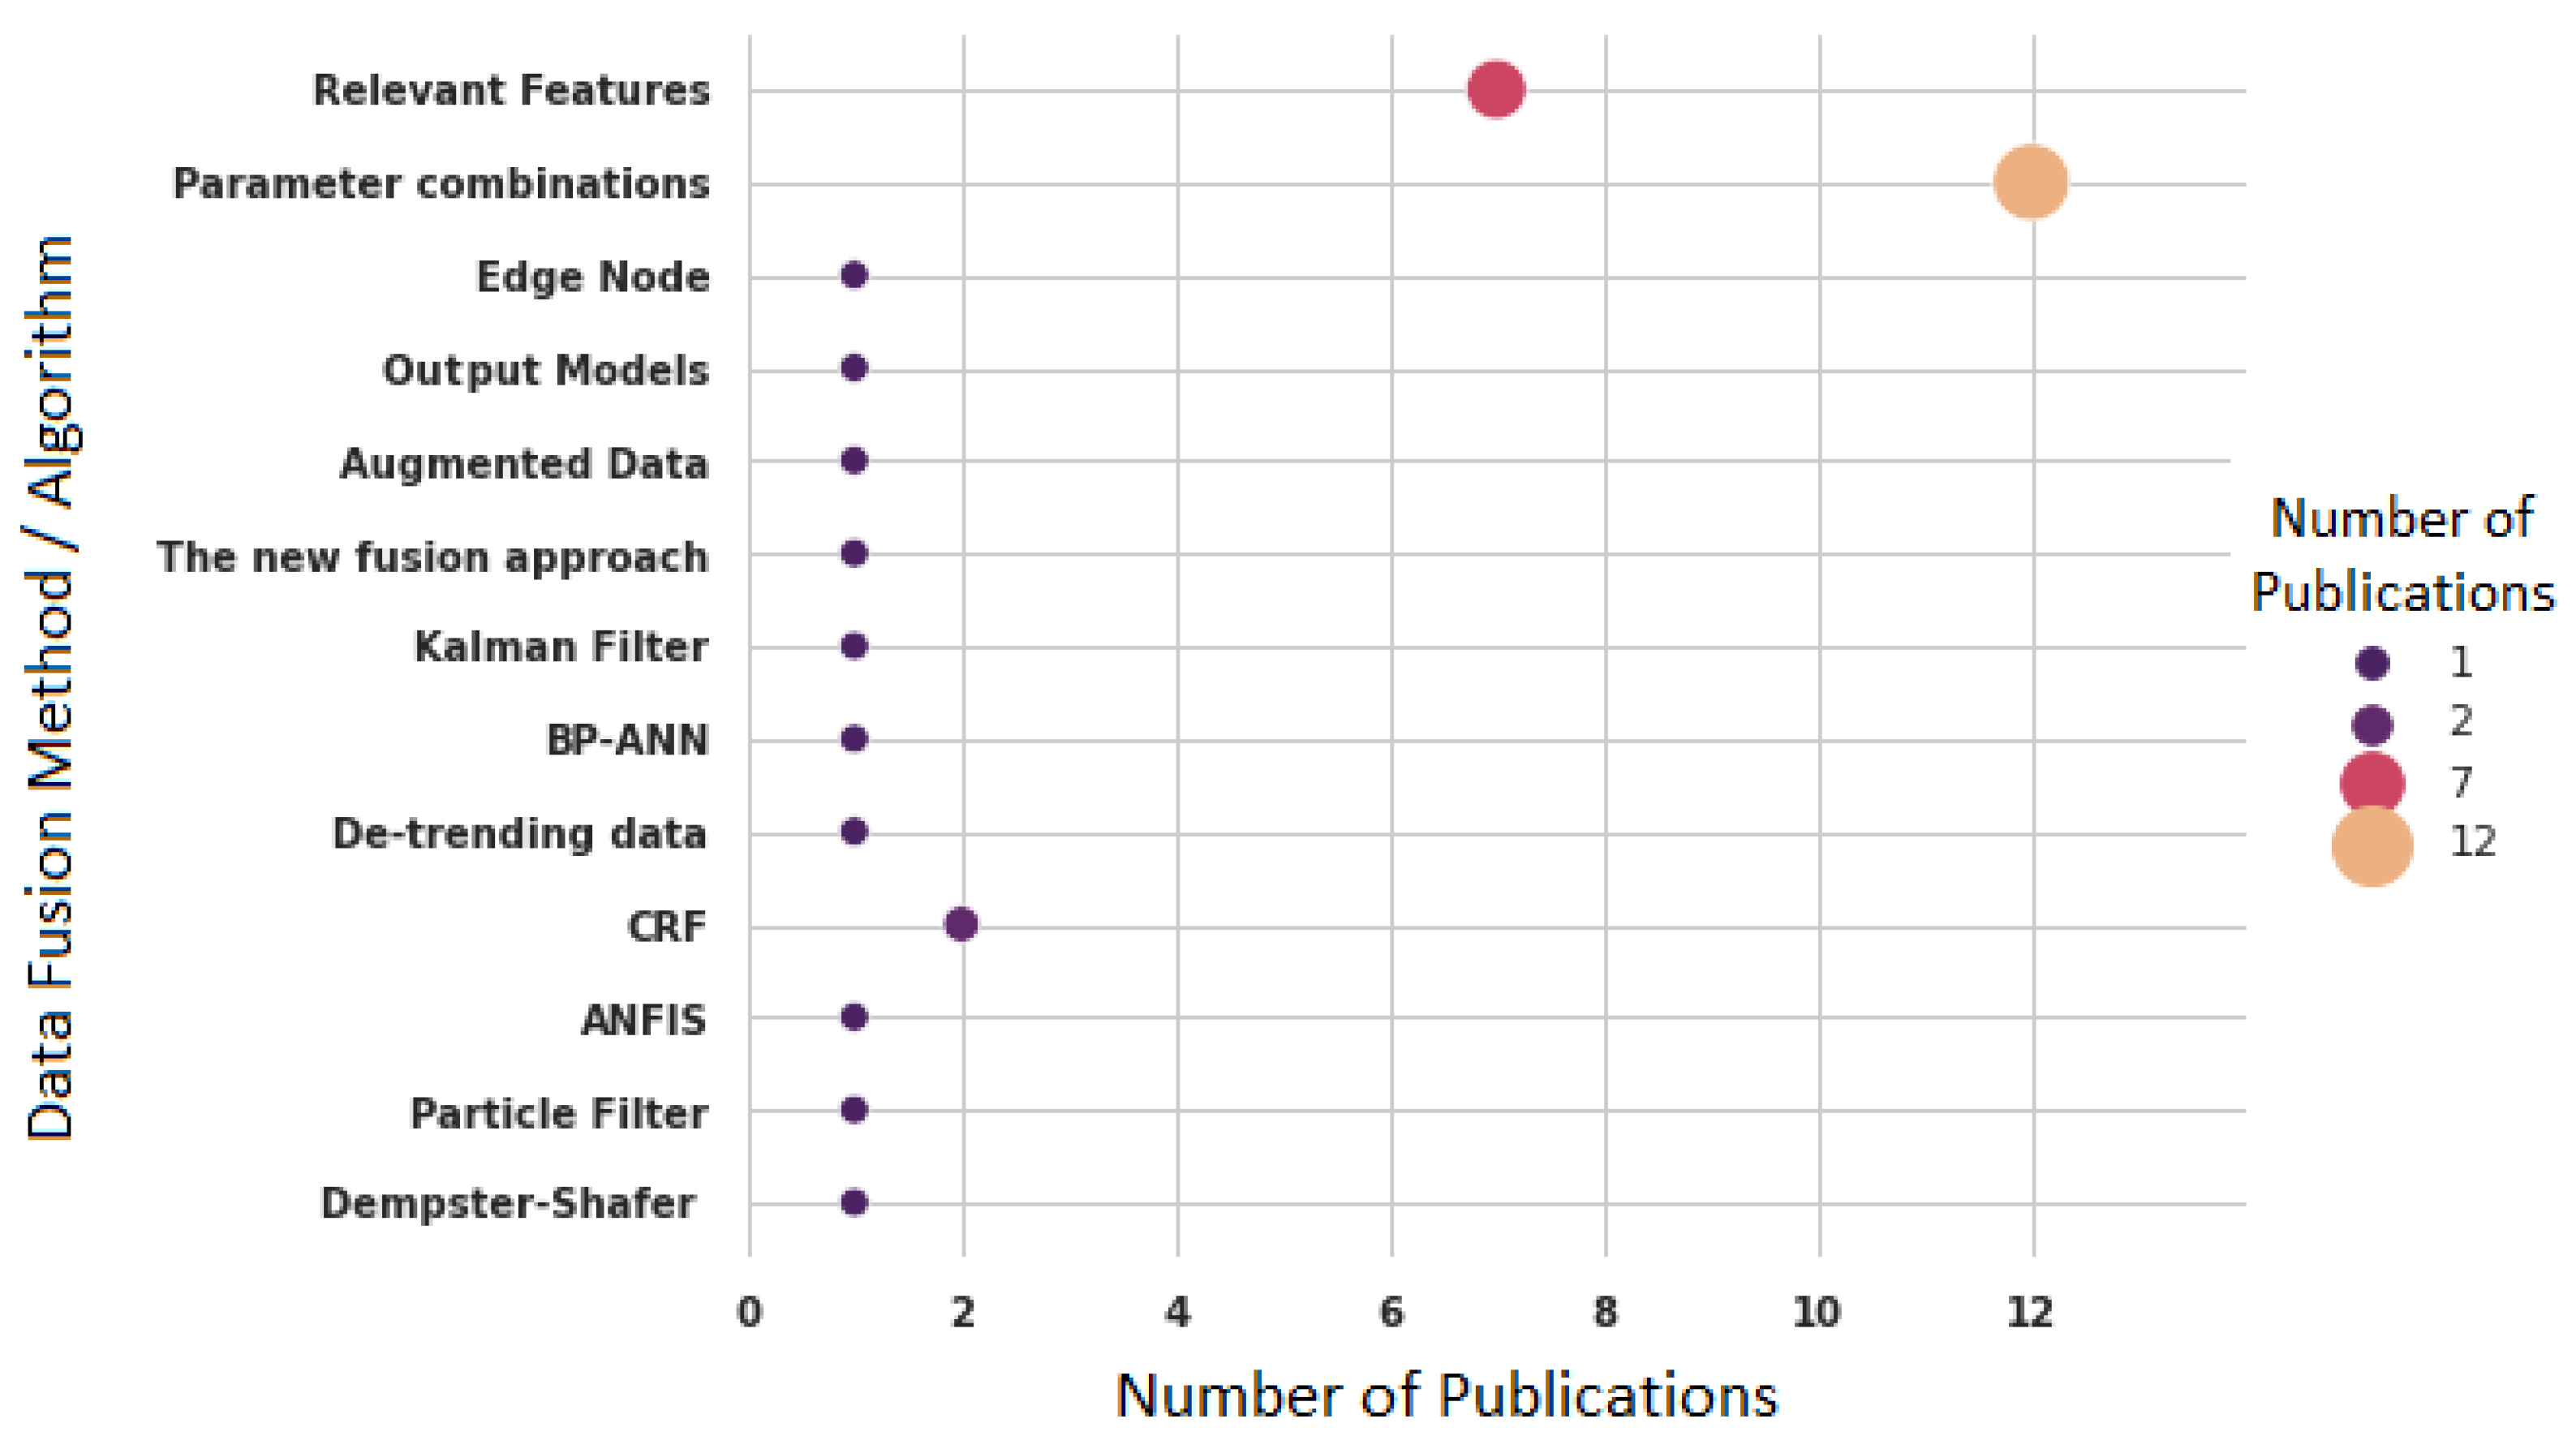
3.5. Data Fusion
3.6. Algorithms and Datasets
4. Discussion
5. Conclusions
Author Contributions
Funding
Institutional Review Board Statement
Informed Consent Statement
Data Availability Statement
Acknowledgments
Conflicts of Interest
Abbreviations
| A.F.R/A.V | Air Flow Rate/Air Volume |
| ADTree | Alternating Decision Tree |
| ANFIS | Adaptive Neuro-Fuzzy Inference System |
| ANN | Artificial Neural Network |
| ANNBRM | Artificial Neural Network with the Bayesian Regulation Method |
| ARHMM | Autoregressive Hidden Markov Model |
| ANN-PCA | Artificial Neural Network with one Principal Component Analysis step |
| BE | Bayesian Estimation |
| BMCMC | Bayesian Markov Chain Monte Carlo |
| BN | Bayesian Network |
| BR | Bayesian Ridge |
| BTM | Bagged Tree Model |
| CA | Correlation Analysis |
| CAM | Count Prediction Based on Data from 3D Stereovision Camera |
| CART | Classification And Regression Tree |
| CDBLSTM | Convolutional Deep Bi-Directional Long Short-Term Memory |
| CRF | Linear chain Conditional Random Field |
| CS | Cosine Similarity |
| Decision Stump | Decision Stump |
| DFE | Flow Detection Engine |
| DT | Decision Tree |
| D/W | Door/Windows status sensor |
| Dynamic ML | Dynamics Machine Learning strategies |
| ELM | Extreme learning machine |
| E.M | Electricity plug meter |
| EV | Ensemble voting |
| EWMA | Exponentially Weighted Moving Average |
| FFNN | Feed-Forward Neural Network |
| Flow Chart | Flow Chart |
| FML | Frequentist Maximum-Likelihood |
| FS-ELM | Feature scaled Extreme Learning Machine |
| Fuzzy C-means | Fuzzy C-means |
| GAFK | Genetic Algorithm—unscented Kalman Filter |
| GBM | Gradient Boosting Machines |
| GB | Gray-Box model |
| GP | Gaussian Processes |
| HAC | Hierarchical Cluster Analysis |
| HMM | Hidden Markov Model |
| HMSM | Hidden Markov-Switching Model |
| IBK | Instance-Bases learning with parameter k |
| IHMM | Inhomogeneous Hidden Markov Model |
| IHMM-MLR | Inhomogeneous Hidden Markov Model with Multinomial Logistic Regression |
| J48 | A decision tree classification algorithm based on Iterative Dichotomizer 3 |
| LAHMM | Location-Aware Hidden Markov Model |
| LBE | Learning-by-Examples |
| LDA | Linear Discriminant Analysis |
| LR | Linear Regression |
| LRF | Local Receptive Fields |
| LSTM | Long Short-Term Memory |
| LTP | Law of Total Probability |
| MAP-HMM | Maximum a Posteriori Probability estimation of Hidden Markov Model |
| MBM | Mass Balanced Models |
| MLR | Multiple Linear Regression model |
| MLP | Multi-Layer Perceptron |
| MSPRT | Multiple-Hypothesis Sequential Probability Ratio Test |
| NB | Naïve Bayes |
| NFA | New Fussion Aproach |
| NMF-ELSR | Non-Negative Matrix Factorization with Ensemble Least Square Regression |
| NNRW | Neural Network with Random Weight |
| NP strategy | Non-Parametric strategy |
| P strategy | Parametric strategy |
| PEA | Point Extraction Algorithm |
| PEM | Prediction Error Minimization |
| PI-PRM | Physics-Informed Pattern-Recognition Machine |
| PnP | The novel Plug-and-Play Method |
| QDA | Quadratic Discriminant Analysis |
| QL | Quantile Regression |
| RBE | Rule Based Engines |
| RBF-NN | Radial Basis Function Neural Network |
| RBH | Rule-Based Heuristic |
| REPTree | A fast decision tree learner |
| RF | Random Forest |
| RH | Relative Humidity |
| RIG-ELM | Rig Extreme Learning Machine |
| RNN | Random Neural Network |
| RUP-STD | Room Utilization Prediction with carbon dioxide sensor—Seasonal |
| Trend Decomposition | |
| RUP-STL | Room Utilization Prediction with carbon dioxide sensor—Seasonal |
| Trend decomposition based on Loess | |
| SD-HOC | Seasonal Decomposition for Human Occupancy Counting |
| SDE | Stochastic Differential Equations |
| SDLM | Sequential Deep Learning Model |
| SGF | Savitzky–Golay Filter |
| SLFFNN | Single-Layer Feed-Forward Neural Network |
| SMO | Sequential Minimal Optimization |
| SSA | Steady-State Approx |
| SURE | Stein’s Unbiased Risk Estimator |
| SVM | Support Vector Machine |
| TAN | Tree Augmented Naïve Bayes |
| TDNN | Dynamic Time Delayed Neural Network Model |
| TM | Transient Method |
| TSE | Triangular Shape Extraction |
| WRANK-ELM | Wrank Extreme Learning Machine |
| Yolo v4 | Yolo v4 tiny model |
| ZeroR | Zero Rule |
Appendix A

| Study | Sensed Time | Occ. Resol. | Data Avail. | Labels | Time-Stap Resol. | Algorithm | Results |
|---|---|---|---|---|---|---|---|
| [25] | 2 Y | Detection | NO | YES | 1 min | LTP, NB, CART | Accuracy 90.9–93.5% |
| [86] | 10 D | Num. People | NO | YES | 15 min | Yolo v4, BTM | Accuracy 99.5% |
| [87] | 15 D | Detection | NO | YES | 1 min | LSTM | Accuracy 96.8% |
| [84] | 21 D | Detection | NO | YES | 5 seg | SGF, SURE, PI-PRM | Accuracy 97% |
| [88] | 60 D | Detection | NO | YES | 5 min | SDLM, LSTM, RF, SVM | Accuracy 63–70% |
| [18] | 20 D | Num. People | NO | YES | 1 min | BMCMC | Accuracy 43.5% |
| [89] | 20 D | Num. People | NO | YES | 15 min | K-NN, GP, RF, BR, MLP | MAE 0.21–1.84 |
| [26] | Detection, Levels | NO | YES | 15 sec | SVM, LR, CS | Accuracy 96.9–97.95% | |
| [90] | 120 D | Num. People | YES | YES | CA | ||
| [66] | 6 D | Detection, Num. People | NO | YES | 1 min | NFA | Accuracy 98.3% |
| [7] | 30 D | Detection, Levels | NO | YES | 1 min | Bayes filter | Accuracy 85.57% |
| [2] | 11 H | Num.People | NO | YES | 1 seg | DFE | Recall 91.93–96.80% |
| [6] | Num.People | NO | YES | 1 min | MLR, QL | 88–91% | |
| [12] | 13 D | Levels | YES | YES | 10 seg, 30 seg, 1 min | K-NN, SVM, DT | Accuracy 88.39–99.67% |
| [48] | 30 D | Num. People | NO | YES | 1 min | GcForest | Accuracy 86% |
| [11] | 4 D | Detection, Levels | NO | YES | 5 min | FNN | Accuracy 83.6–94.3% |
| [65] | 10 D | Detection, Num. People | YES | NO | 30 min | BN | Accuracy 82–91% |
| [91] | 15 D | Num.People | NO | YES | 1 min | RF, ELM | RMSE of RF 2.75–10.44 Accuracy of ELM 67.92–69.17% |
| [63] | 1 D | Detection | NO | YES | Dynamic ML | ||
| [68] | 12 D | Num. People | NO | YES | 5 min | ANN, MLR | 96.5–97.5% |
| [78] | 45 D | Levels | NO | NO | 1 min | HCA, logical flow chart | Error 7–23% |
| [19] | 15 D | Detection | NO | YES | 10 seg | SVM | Precision 87% |
| [85] | 14 D | Num. People, Levels | NO | YES | 5 min | ANN, MLR | MAE 2.15–3.40, F1-score 73.57–84.36% |
| [3] | 120 D | Num. People | NO | YES | 10 min | FML, BE, ELM | NRMSE 0.2230–0.2470 |
| [10] | 4 D | Num. People | NO | YES | 5 min | SDE | Accuracy 88–94% |
| [22] | 37 D | Detection | YES | YES | 5 min | LR, LDA, K-NN, CART, NB, SVC, RF, GB | Accuracy 79–85% |
| [92] | 15 D | Detection, Num. People | YES | YES | 10 seg | LR, SVM, ANN | F-score 24.43–25.15% |
| [15] | Num. People | NO | YES | 5 seg | SMO, HMM, IBK, RF, J48, Bagging, REPTree, NB, Decision Stump | Accuracy 8.66–90.1% | |
| [93] | 90 D | Num. People | NO | YES | 30 seh | LR | Accuracy 90–95% |
| [94] | 7 D | Levels | NO | YES | 1 min | CA | |
| [13] | 90 D | Detection, socialization | NO | YES/NO | 5 min | LR, IBK, RF, K-means, Hierarchical, Fuzzy C-means, k-medoids | Accuracy 88.7–97.1% |
| [14] | 4 D | Detection, status (alive or dead) | NO | YES | 1 min | PEA, TSE | |
| [52] | 7–10 h | Num. People | YES | YES | 30 min | Proxy model | RMSE 60.44% |
| [62] | 12 D | Detection, status (active or not) | NO | YES | 30 min | MLR | Accuracy 50–99.8% |
| [58] | Num. People | NO | YES | ELM | RMSE 4.83–6.64 | ||
| [1] | 9 D | Num. People | NO | YES | 5 min | K-NN, ANN, SVM | MAE 2.3–2.6 |
| [75] | 49 D | Detection, Num. People | YES | YES | 15 seg | ZeroR, JRip, NB, J48, LR, K-NN, RF | Occ. Accuracy 50.8–75.1%, Num. People. Accuracy 42.7–64.3% |
| [83] | 7 Y | Detection, Levels | NO | YES | 1 min | CO concentration and computer electricity consumption indicators of occupancy leves | Error 0.25–73.71% |
| [77] | 1 Y | Detection, Num. People | NO | YES | 5 seg | CRF | Detection Accuracy 84–98%, Num. People. NRMSE 0.105–0.15 |
| [24] | 4 D | Num. People | NO | YES | 15 min | RNN | Accuracy 88% |
| [8] | 31 D | Levels | NO | YES | 15 min | WRANK-ELM, RIG-ELM | Accuracy 75.63–79.17% |
| [95] | 8 D | Detection | NO | YES | 4 min, 20 min | PnP | MAE 0.002–0.54 |
| [96] | 30 D | Num. People | NO | YES | GAKF, CAM | NRME 0.075–0.71 | |
| [67] | 16 D | Num. People | NO | YES | 3 min | K-NN, LDA | MCR 1.58–3.27% |
| [9] | 30 D | Levels | YES | YES | 15 min | ELM-LRF | Accuracy 77.27% |
| [45] | 120 D | Num. People | NO | YES | 5 min | MBM, ANN, PEM, SVM | RMSE 12.1–27.4 |
| [71] | 1 D | Detection | YES | YES | LDA, CART, RF, GBM | Training Accuracy 83.38–100% Testing Accuracy 32.68–99.33% | |
| [72] | 90 D | Levels | NO | yes | 5 min | RF | Accuracy 71–95.9% |
| [51] | 30 D | Num. People | NO | YES | 1 min | FS-ELM | Accuracy 94% |
| [16] | 90 D | Num. People, Detection, Levels | NO | YES | 10 min | CRF, HMM | Acuracy 85–93% |
| [74] | 16 D | Levels | NO | YES | 30 min | C4.5 | F1-Score 0.47–0.65 |
| [57] | 210 D | Num. People | NO | YES | 5 min | The Beam-break method, and the CO method | test p > 0.05 |
| [17] | 2 D | Levels | NO | YES | 20 seg 5 seg | HMM, ARHMM | Accuracy 25.2–84% |
| [54] | 1 Y | Detection, Levels | NO | YES | 10 seg | RBE, LBE | Accuracy 82% |
| [56] | 7.8 H | Detection | NO | YES | 10 min | BE, CA | Accuracy 66% |
| [4] | 20 D | Detection, Num. People | NO | YES | 1 min | SVM, K-NN, ANN, NB, TAN, DT | Local occ. RMSE 0.109–0.311 Global occ. RMSE 0.211–1.192 |
| [27] | Levels | NO | YES | 2 min, 10 min | ANFIS | ||
| [97] | 90 D | Num. People | NO | YES | 20 seg | ARHMM, SVM, HMM | RMSE 0.94–1.08 |
| [98] | 20 D | Num. People | NO | YES | 1 min | RBF-NN | Accuracy 86.50–88.74% |
| [73] | 300 D | Num. People | NO | YES | 1 min | SVM, ANN, HMM | Accuracy 65–75% |
| [41] | 300 D | Num. People | NO | yesYES | 20 min | SVM, ANN, HMM | Accuracy 70–75% |
| [53] | Detection | NO | YES | 15 min | EWMA | Accuracy 83.33–87.03% | |
| [46] | 1 M | Num. People | NO | YES | 5 min | SD-HOC | Accuracy 93.71–97.73% |
| [47] | 1 M | Num. People | NO | YES | 5 min | RUP-STD, RUP-STL, SVM, NMF-ELSR | Accuracy 69.96–99.52% |
| [99] | 31 D | Levels | NO | YES | 15 min | CDBLSTM | Accuracy 76.04% |
| [80] | 43 D | Num. People | YES | NO | 5, 10, 20, 30 min | HMM | Accuracy 90.24% |
| [76] | 32 D | Levels | NO | YES | 15 min | ELM, SVM, ANN, K-NN, LDA, CART | Accuracy 81.25–93.45% |
| [21] | 8 M | Levels | NO | YES | 1 min | SVM, NB, TAN, ANN, RF | Error 9.2–18.2% |
| [100] | 1 M | Levels | NO | YES | 5 min | ELM | Accuracy 81.37% |
| [20] | Levels | NO | YES | 10 seg | SVM | Occ. Index approx. 51% | |
| [101] | 10 W | Levels | NO | YES | 1 min | ADTree | The correlation 48.05% for acoustic, 35.70% for CO, 32.49% for RH, and 11.98% for temperature. |
| [102] | Detection, Num. People | NO | YES | 15 min | RBH, MLP, GP, LR, SVM, EV | Accuracy 46–92% | |
| [99] | 31 D | Detection | NO | YES | 15 min | IHMM-MLR | Accuracy 78.13% |
| [23] | 10 H | Levels | NO | YES | 1 seg | NNRW | Accuracy 52–100% |
| [103] | 33 H, 10.4 H, 4 H | Num. People | NO | YES | 7.5 seg | SMO, HMM, IBK, RF, J48, Bagging, REPTree, NB, DecisionStump | Accuracy 46.6–99.9% |
| [104] | 102 D | Num. People | NO | YES | 15 min | SSA, TM, FFNN | NMSE 0.23–1.60 |
| [105] | 28 D | Num. People | NO | YES | 1 min | IHMM, GcForest | EA% 74.3–83.3 |
| [49] | 9 W | Num. People | NO | YES | 5 min | GB | RMSE 0.66–0.77 |
| [106] | 9 M | Num. People | NO | YES | 15 min | CART, SMV | Accuracy 93.84–95.59% |
| [50] | 1 M | Detection | NO | YES | 5 min | HMSM | Accuracy 75.5–96.5% |
| [107] | 7 D | Detection | NO | YES | 1 min | SLFN | Accuracy 99.79% |
| [61] | 56 D | arrival time—departure time—number of People | NO | YES | ANNBRM | 92% | |
| [108] | 7 D | Levels | NO | YES | 3 min | LAHMM | Accuracy 90% |
| [59] | 1 Y | Detection | NO | YES | 10 min | Adaboost, C5.0, SVM, QDA, ANN-PCA | Accuracy 80% |
| [109] | 34 D | Levels | NO | YES | 30 min | C4.5, RF | Accuracy 86–88% |
| [60] | 7 D | Num. People | NO | YES | 1 min | CART, HMM | F-statistic 24 |
| [82] | 1 M | Detection | NO | NO | 5 min | HMM | |
| [110] | 6 M | Num. People | NO | YES | 1 min | TDNN | RMS 0.684–0.811 |
| [111] | 1 M | Levels | YES | YES | 5 min | P-strategy, NP-strategies, SVM, ANN | Accuracy 81.1–88% |
| [112] | 2 W | Levels | NO | YES | 1 min | MAP-HMM, MSPRT, ANN | RMSE 1.2–2 |
| [81] | 10 D | Levels | NO | NO | 30 min | HMM, BN | Accuracy 89–91% |
| [55] | 56 D | Detection, Levels | NO | YES | 10 seg | MLP, K-NN, DT, RF | F1 scores 0.15–0.94 |
| [113] | 18 D | Detection | NO | YES | 1 min | k-NN | Accuracy 74.51–97.36% |
| Study | Sensors | Place Type | Place Size | Est. Sensors to Deploy | ||||||||||||||
|---|---|---|---|---|---|---|---|---|---|---|---|---|---|---|---|---|---|---|
| CO | Tem | RH | A. Press | VOCs | PMs | A.F.R/A.V | PIR | IR | Acous. | Light/Lum. | D/W | Elec. Meter | Other | m | Num. Occ | |||
| [25] | 2 | 2 | 2 | 1 | 1 | 1 | 1 | Office | 19 | 5 | 1 | |||||||
| [86] | 1 | 1 | 1 | 1 | 1 | 1 | 1 | Kitchen Apartment | 20 | 1 | ||||||||
| [87] | 1 | 1 | 1 | 1 | 1 | Office | 0 | |||||||||||
| [84] | 1 | 1 | Room | 12.96 | 1 | |||||||||||||
| [88] | 1 | 1 | 1 | Office | 31 | 1 | ||||||||||||
| 1 | 1 | 1 | Office | 30 | 1 | |||||||||||||
| 1 | 1 | 1 | Office | 15 | 1 | |||||||||||||
| [18] | 3 | 1 | 1 | Office | 37 | 1 | ||||||||||||
| 3 | 1 | 1 | Office | 97 | 2 | |||||||||||||
| [89] | 2 | 2 | Office | 8 | 0 | |||||||||||||
| [26] | 4 | 4 | 4 | 4 | Room | 9.2 | 1 | |||||||||||
| [90] | 4 | 4 | 4 | Large Classroom | 336 | 6 | ||||||||||||
| 2 | 2 | 2 | Medium Classroom | 131 | 3 | |||||||||||||
| [66] | 8 | 8 | 8 | 3 | 8 | Office | 62.92 | 2 | ||||||||||
| [7] | 1 | Office | 186 | 4 | ||||||||||||||
| [2] | 1 | 1 | 1 | 1 | 1 | 1 | 5 | Indoor Univ. Hallway | 400 | 0 | ||||||||
| 1 | 1 | 1 | 1 | 1 | 1 | 5 | Outdoor Food Court | 400 | 0 | |||||||||
| [6] | 1 | 1 | 1 | 1 | Classroom | 524.25 | 10 | |||||||||||
| [12] | 1 | 1 | 1 | University Gym | 35 | 0 | ||||||||||||
| 1 | 1 | 1 | Living Room | 32 | 1 | |||||||||||||
| [48] | 1 | Office | 14.62 | 1 | ||||||||||||||
| [11] | 1 | 1 | 1 | 1 | 1 | 1 | 1 | 1 | 2 | 0 | Secretary’s Section | 1 | 0 | |||||
| 1 | 1 | 1 | 1 | 1 | 1 | 1 | 1 | 2 | 0 | Office | 4 | 0 | ||||||
| [65] | 30 | 30 | 30 | 30 | 30 | 30 | 30 | 30 | Office | 0 | ||||||||
| 5 | 5 | 5 | 5 | 5 | 5 | 5 | 5 | Apartment | 0 | |||||||||
| 1 | 1 | 1 | 1 | 1 | 1 | 1 | 1 | House | 0 | |||||||||
| [91] | 1 | 1 | Classroom | 70 | 0 | |||||||||||||
| 1 | 1 | Clasroom | 40 | 0 | ||||||||||||||
| 1 | 1 | Study Zone | 30 | 0 | ||||||||||||||
| 1 | 1 | Study Zone | 35 | 0 | ||||||||||||||
| [63] | 1 | 1 | 1 | 2 | 1 | EEBLab | 12 | 1 | ||||||||||
| [68] | 26 | 26 | 1 | 1 | 3 | Floor A | 991 | 18 | ||||||||||
| 13 | 10 | 1 | 1 | 5 | Floor B | 1139 | 20 | |||||||||||
| 20 | 21 | 1 | 1 | 2 | Floor C | 944 | 17 | |||||||||||
| 16 | 19 | 1 | 1 | 4 | Floor D | 1152 | 21 | |||||||||||
| [78] | 2 | 2 | 2 | 1 | 1 | 1 | 1 | Office | 19 | 1 | ||||||||
| [19] | 2 | 2 | 2 | 2 | 2 | 2 | Classroom | 25 | 0 | |||||||||
| [85] | 3 | 3 | 3 | 3 | Office | 200 | 4 | |||||||||||
| [3] | 1 | 1 | 1 | 1 | Office | 152 | 3 | |||||||||||
| [10] | 1 | Office | 30 | 1 | ||||||||||||||
| 1 | Office | 42 | 1 | |||||||||||||||
| [22] | 1 | 1 | Office | 12 | 1 | |||||||||||||
| [92] | 2 | 2 | 3 | 1 | Office | 46.75 | 1 | |||||||||||
| [15] | 1 | 1 | 1 | 2 | Office | 13.37 | 1 | |||||||||||
| 1 | 1 | 1 | 2 | Office | 44.59 | 1 | ||||||||||||
| 1 | 1 | 1 | 2 | Office | 55.74 | 1 | ||||||||||||
| [93] | 2 | 2 | 2 | 2 | Classroom | 0 | ||||||||||||
| [94] | 4 | 4 | 4 | Lab | 70 | 0 | ||||||||||||
| 2 | 2 | 2 | Lab | 31 | 0 | |||||||||||||
| [13] | 1 | 1 | 1 | 1 | 1 | 1 | Office | 3 | 0 | |||||||||
| 1 | 1 | 1 | 1 | 1 | 1 | Office | 2 | 0 | ||||||||||
| 1 | 1 | 1 | 1 | 1 | 1 | Office | 1 | 0 | ||||||||||
| [14] | 2 | 2 | 2 | 7th Floor House | 26 | 1 | ||||||||||||
| 2 | 2 | 2 | 1st Floor House | 21.3 | 1 | |||||||||||||
| 2 | 2 | 2 | Office | 33 | 1 | |||||||||||||
| [52] | 1 | Meeting Room | 140 | 3 | ||||||||||||||
| [62] | 1 | 1 | 1 | 4 | 1 | 1 | 1 | Control Testbed | 20 | 1 | ||||||||
| [58] | 1 | Bus | 0 | |||||||||||||||
| [1] | 3 | 3 | 3 | 3 | Office | 200 | 4 | |||||||||||
| [75] | 1 | 2 | 2 | 1 | Apartment 1 | 22 | 1 | |||||||||||
| 1 | 2 | 2 | 1 | Apartment 2 | 22 | 1 | ||||||||||||
| 1 | 2 | 2 | 1 | Apartment 3 | 22 | 1 | ||||||||||||
| 1 | 2 | 2 | 1 | Apartment 4 | 22 | 1 | ||||||||||||
| [83] | 2 | 2 | 2 | 1 | 3 | 3 | Office | 22 | 1 | |||||||||
| 2 | 2 | 2 | 1 | 3 | 3 | Office | 22 | 1 | ||||||||||
| [77] | 1 | 1 | 1 | 1 | 2 | 4 | Kitchen | 24 | 0 | |||||||||
| 1 | 1 | 1 | 1 | Researcher’s Office | 9 | 0 | ||||||||||||
| 1 | 2 | 3 | 2 | 2 | Office | 3 | 0 | |||||||||||
| [24] | 2 | 2 | 2 | 1 | 1 | 1 | Chamber | 8.86 | 1 | |||||||||
| 1 | 2 | 2 | 1 | 1 | 1 | Office | 10 | 0 | ||||||||||
| [8] | 3 | 3 | 3 | 3 | Office | 186 | 4 | |||||||||||
| [95] | 1 | 1 | 1 | 1 | 1 | 1 | Office | 5.04 | 1 | |||||||||
| 1 | 1 | 1 | 1 | 1 | 1 | Living Room Apartment | 14.2 | 1 | ||||||||||
| [96] | 1 | 1 | 1 | 4 | Study Zone | 125 | 3 | |||||||||||
| 1 | 1 | 1 | 4 | Classroom | 139 | 3 | ||||||||||||
| [67] | 1 | 1 | 1 | Clasroom | 66.24 | 2 | ||||||||||||
| [9] | 2 | 2 | 2 | 2 | Lab | 24 | 0 | |||||||||||
| [45] | 4 | Lecture Theatre | 876 | 16 | ||||||||||||||
| [71] | 1 | 1 | 1 | 1 | Office | 20.47 | 1 | |||||||||||
| [72] | 1 | 1 | 2 | Seminar Room CP103 | 20 | 0 | ||||||||||||
| 1 | 1 | 2 | Classroom CP106 | 58 | 0 | |||||||||||||
| 1 | 1 | 2 | Classroom CP108 | 58 | 0 | |||||||||||||
| [51] | 1 | Office | 186 | 4 | ||||||||||||||
| [16] | 1 | 1 | 1 | 1 | Meeting Room | 16 | 0 | |||||||||||
| 1 | 1 | 1 | 1 | 2 | Kitchen | 40 | 0 | |||||||||||
| 1 | 1 | 2 | 4 | Office | 10 | 0 | ||||||||||||
| 1 | 1 | 1 | 1 | Open Space | 4 | 0 | ||||||||||||
| [74] | 1 | 1 | 1 | 1 | 1 | 1 | 3 | 6 | Office | 45 | 1 | |||||||
| [57] | 1 | 1 | 1 | 1 | 1 | 1 | Hospital Rooms | 33 | 1 | |||||||||
| [17] | 4 | 4 | 4 | 2 | 4 | 2 | 1 | Lab | 10 | 0 | ||||||||
| [54] | 28 | 28 | Museum | 1196 | 21 | |||||||||||||
| [56] | 8 | 8 | Main Corridor | 0 | ||||||||||||||
| [4] | 1 | 1 | 1 | 1 | 1 | 1 | 1 | 1 | 1 | Office | 18.58 | 1 | ||||||
| 1 | 1 | 1 | 1 | 1 | 1 | 1 | 1 | 1 | Office | 39.94 | 1 | |||||||
| [27] | 3 | 3 | 3 | 1 | 3 | 4 | 3 | 4 | Office | 104.08 | 2 | |||||||
| [97] | 1 | 1 | 1 | 1 | 1 | 1 | Lab | 6 | 0 | |||||||||
| [98] | 1 | 1 | 1 | 2 | 1 | 1 | Lab 1 | 40 | 1 | |||||||||
| 1 | 1 | 1 | 2 | 1 | 1 | Lab 2 | 40 | 1 | ||||||||||
| [73] | 20 | 11 | 11 | 17 | 17 | 11 | 11 | 11 | Open Office | 634.17 | 12 | |||||||
| [41] | 20 | 11 | 11 | 17 | 17 | 11 | 11 | 11 | Open Office | 634.17 | 12 | |||||||
| [53] | 1 | 1 | Office | 12 | 3 | 1 | ||||||||||||
| [46] | 1 | Academic Staff Room | 12 | 1 | ||||||||||||||
| 1 | Cinema Theatre | 300 | 0 | |||||||||||||||
| [47] | 1 | Room | 12 | 1 | ||||||||||||||
| 1 | Cinema Theatre | 300 | 0 | |||||||||||||||
| [99] | 2 | 2 | 2 | 2 | Lab | 186 | 4 | |||||||||||
| [80] | 5 | 5 | 5 | House First Floor | 128 | 3 | ||||||||||||
| 5 | 5 | 5 | House Second Floor | 92.65 | 2 | |||||||||||||
| [76] | 1 | 1 | 1 | 1 | Lab | 186 | 4 | |||||||||||
| [21] | 1 | 1 | 1 | 1 | 1 | 1 | 1 | Office | 0 | 0 | ||||||||
| [100] | 3 | 3 | 3 | 3 | Tutorial Room | 57.75 | 37 | 1 | ||||||||||
| [20] | 23 | 23 | Museum | 1196 | 21 | |||||||||||||
| [101] | 20 | 11 | 11 | 17 | 11 | 11 | 11 | Open Office | 634.17 | 12 | ||||||||
| [102] | 2 | 2 | 2 | 2 | Lab 1 | 4 | 0 | |||||||||||
| 2 | 2 | 2 | 2 | Lab 2 | 10 | 0 | ||||||||||||
| [99] | 3 | 3 | 3 | 3 | Lab | 186 | 4 | |||||||||||
| [23] | 1 | Classroom | 60.75 | 1 | ||||||||||||||
| [103] | 1 | 1 | 1 | 5 | Room 1 | 13.4 | 1 | |||||||||||
| 1 | 1 | 1 | 5 | Room 2 | 44.6 | 1 | ||||||||||||
| 1 | 1 | 1 | 5 | Room 3 | 55.74 | 1 | ||||||||||||
| [104] | 3 | 1 | Univeristy Auditorium | 306 | 182 | 6 | ||||||||||||
| [105] | 1 | Office | 14.62 | 4 | 1 | |||||||||||||
| [49] | 1 | Office 1 | 40 | 6 | 1 | |||||||||||||
| 1 | Office 2 | 27.5 | 5 | 1 | ||||||||||||||
| [106] | 1 | 1 | 1 | 1 | 1 | Office | 22.51 | 1 | ||||||||||
| [50] | 1 | Summerhouse | 89 | 2 | ||||||||||||||
| 1 | Classroom | 41 | 1 | |||||||||||||||
| [107] | 1 | 1 | Office | 16.8 | 1 | |||||||||||||
| [61] | 1 | 2 | 1 | 1 | Office | 19.2 | 1 | |||||||||||
| [108] | 1 | 5 | 5 | 5 | 5 | 1 | Apartment | 0 | ||||||||||
| [59] | 5 | 5 | 5 | Elderly Caring Institution | 0 | |||||||||||||
| [109] | 2 | 3 | 2 | 4 | 1 | 1 | 2 | 3 | 4 | Office | 4 | 0 | ||||||
| [60] | 1 | 1 | 1 | 4 | 1 | BICT | 20 | 1 | ||||||||||
| [82] | 1 | 1 | 1 | 1 | 1 | House | 62 | 1 | ||||||||||
| [110] | 3 | 6 | 2 | 5 | 1 | 2 | Office | 39 | 1 | |||||||||
| [111] | 1 | 1 | Lab | 32 | 0 | |||||||||||||
| [112] | 1 | 6 | Office | 58 | 1 | |||||||||||||
| [81] | 2 | 3 | 2 | 2 | 1 | 1 | 2 | 3 | 4 | Office | 4 | 0 | ||||||
| [55] | 6 | 2 | KIT-ESHL | 60 | 1 | |||||||||||||
| [113] | 1 | 1 | 1 | Clasroom | 66.24 | 2 | ||||||||||||
References
- Wang, W.; Chen, J.; Hong, T. Occupancy prediction through machine learning and data fusion of environmental sensing and Wi-Fi sensing in buildings. Autom. Constr. 2018, 94, 233–243. [Google Scholar] [CrossRef]
- Longo, E.; Redondi, A.E.C.; Bianchini, M.; Bolzan, P.; Maffei, S. Smart Gate: A Modular System for Occupancy and Environmental Monitoring of Spaces. In Proceedings of the 2020 5th International Conference on Smart and Sustainable Technologies (SpliTech), Split, Croatia, 23–26 September 2020. [Google Scholar] [CrossRef]
- Wei, Y.; Xia, L.; Pan, S.; Wu, J.; Zhang, X.; Han, M.; Zhang, W.; Xie, J.; Li, Q. Prediction of occupancy level and energy consumption in office building using blind system identification and neural networks. Appl. Energy 2019, 240, 276–294. [Google Scholar] [CrossRef]
- Yang, Z.; Li, N.; Becerik-Gerber, B.; Orosz, M. A systematic approach to occupancy modeling in ambient sensor-rich buildings. Simulation 2013, 90, 960–977. [Google Scholar] [CrossRef]
- Mylonas, A.; Kazanci, O.B.; Andersen, R.K.; Olesen, B.W. Capabilities and limitations of wireless CO2, temperature and relative humidity sensors. Build. Environ. 2019, 154, 362–374. [Google Scholar] [CrossRef]
- Rastogi, K.; Lohani, D. IoT-Based Indoor Occupancy Estimation Using Edge Computing; Elsevier BV: Amsterdam, The Netherlands, 2020; Volume 171, pp. 1943–1952. [Google Scholar] [CrossRef]
- Jiang, C.; Chen, Z.; Su, R.; Masood, M.K.; Soh, Y.C. Bayesian filtering for building occupancy estimation from carbon dioxide concentration. Energy Build. 2020, 206, 109566. [Google Scholar] [CrossRef]
- Masood, M.; Soh, Y.C.; Jiang, C. Occupancy estimation from environmental parameters using wrapper and hybrid feature selection. Appl. Soft Comput. 2017, 60, 482–494. [Google Scholar] [CrossRef]
- Zhu, Q.; Chen, Z.; Masood, M.K.; Soh, Y.C. Occupancy estimation with environmental sensing via non-iterative LRF feature learning in time and frequency domains. Energy Build. 2017, 141, 125–133. [Google Scholar] [CrossRef]
- Wolf, S.; Cali, D.; Krogstie, J.; Madsen, H. Carbon dioxide-based occupancy estimation using stochastic differential equations. Appl. Energy 2019, 236, 32–41. [Google Scholar] [CrossRef]
- Adeogun, R.; Rodriguez, I.; Razzaghpour, M.; Berardinelli, G.; Christensen, P.H.; Mogensen, P.E. Indoor Occupancy Detection and Estimation using Machine Learning and Measurements from an IoT LoRa-based Monitoring System. In Proceedings of the 2019 Global IoT Summit (GIoTS), Aarhus, Denmark, 17–21 June 2019. [Google Scholar] [CrossRef]
- Vela, A.; Alvarado-Uribe, J.; Davila, M.; Hernandez-Gress, N.; Ceballos, H.G. Estimating Occupancy Levels in Enclosed Spaces Using Environmental Variables: A Fitness Gym and Living Room as Evaluation Scenarios. Sensors 2020, 20, 6579. [Google Scholar] [CrossRef]
- Crivello, A.; Mavilia, F.; Barsocchi, P.; Ferro, E.; Palumbo, F. Detecting occupancy and social interaction via energy and environmental monitoring. Int. J. Sens. Netw. 2018, 27, 61. [Google Scholar] [CrossRef]
- Jeon, Y.; Cho, C.; Seo, J.; Kwon, K.; Park, H.; Oh, S.; Chung, I.J. IoT-based occupancy detection system in indoor residential environments. Build. Environ. 2018, 132, 181–204. [Google Scholar] [CrossRef]
- Ahmed, S.; Kamal, U.; Toha, T.R.; Islam, N.; Islam, A.B.M.A.A. Predicting Human Count through Environmental Sensing in Closed Indoor Settings. In Proceedings of the 15th EAI International Conference on Mobile and Ubiquitous Systems: Computing, Networking and Services, New York, NY, USA, 5–7 November 2018. [Google Scholar] [CrossRef]
- Zikos, S.; Tsolakis, A.; Meskos, D.; Tryferidis, A.; Tzovaras, D. Conditional Random Fields—Based approach for real-time building occupancy estimation with multi-sensory networks. Autom. Constr. 2016, 68, 128–145. [Google Scholar] [CrossRef]
- Ai, B.; Fan, Z.; Gao, R.X. Occupancy estimation for smart buildings by an auto-regressive hidden Markov model. In Proceedings of the 2014 American Control Conference, Portland, OR, USA, 4–6 June 2014. [Google Scholar] [CrossRef]
- Rahman, H.; Han, H. Real-time ventilation control based on a Bayesian estimation of occupancy. Build. Simul. 2021, 14, 1487–1497. [Google Scholar] [CrossRef]
- Parise, A.; Manso-Callejo, M.A.; Cao, H.; Mendonca, M.; Kohli, H.; Wachowicz, M. Indoor Occupancy Prediction using an IoT Platform. In Proceedings of the 2019 Sixth International Conference on Internet of Things: Systems, Management and Security (IOTSMS), Granada, Spain, 22–25 October 2019; pp. 26–31. [Google Scholar] [CrossRef]
- Viani, F. Opportunistic occupancy estimation in museums through wireless sensor networks. Microw. Opt. Technol. Lett. 2015, 57, 1975–1977. [Google Scholar] [CrossRef]
- Yang, Z.; Becerik-Gerber, B. Cross-Space Building Occupancy Modeling by Contextual Information Based Learning. In Proceedings of the 2nd ACM International Conference on Embedded Systems for Energy-Efficient Built Environments (BuildSys’15), Seoul, Korea, 4–5 November 2015; Association for Computing Machinery: New York, NY, USA, 2015; pp. 177–186. [Google Scholar] [CrossRef]
- Zemouri, S.; Gkoufas, Y.; Murphy, J. A Machine Learning Approach to Indoor Occupancy Detection Using Non-Intrusive Environmental Sensor Data. In Proceedings of the 3rd International Conference on Big Data and Internet of Things—BDIOT 2019, Melbourn, Australia, 22–24 August 2019. [Google Scholar] [CrossRef]
- Faris Ramli, M.; Muniandy, K.; Adam, A.; Nasir, A.F.A.; Ibrahim Shapiai, M. Indoor occupancy estimation using carbon dioxide concentration and neural network with random weights. IOP Conf. Ser. Mater. Sci. Eng. 2020, 769, 012011. [Google Scholar] [CrossRef]
- Javed, A.; Larijani, H.; Ahmadinia, A.; Emmanuel, R.; Mannion, M.; Gibson, D. Design and Implementation of a Cloud Enabled Random Neural Network-Based Decentralized Smart Controller With Intelligent Sensor Nodes for HVAC. IEEE Internet Things J. 2017, 4, 393–403. [Google Scholar] [CrossRef]
- Fajilla, G.; Austin, M.C.; Mora, D.; Simone, M.D. Assessment of probabilistic models to estimate the occupancy state in office buildings using indoor parameters and user-related variables. Energy Build. 2021, 246, 111105. [Google Scholar] [CrossRef]
- Das, A.; Gupta, R.; Chakraborty, S. A Study on Real-Time Edge Computed Occupancy Estimation in an Indoor Environment. In Proceedings of the 2020 International Conference on COMmunication Systems & NETworkS (COMSNETS), Bengaluru, India, 7–11 January 2020. [Google Scholar] [CrossRef]
- Ekwevugbe, T.; Brown, N.; Fan, D. A design model for building occupancy detection using sensor fusion. In Proceedings of the 2012 6th IEEE International Conference on Digital Ecosystems and Technologies (DEST), Campione d’Italia, Italy, 18–20 June 2012. [Google Scholar] [CrossRef]
- Chen, Z.; Jiang, C.; Xie, L. Building occupancy estimation and detection: A review. Energy Build. 2018, 169, 260–270. [Google Scholar] [CrossRef]
- Dong, B.; Prakash, V.; Feng, F.; O’Neill, Z. A review of smart building sensing system for better indoor environment control. Energy Build. 2019, 199, 29–46. [Google Scholar] [CrossRef]
- Hayat, H.; Griffiths, T.; Brennan, D.; Lewis, R.P.; Barclay, M.; Weirman, C.; Philip, B.; Searle, J.R. The State-of-the-Art of Sensors and Environmental Monitoring Technologies in Buildings. Sensors 2019, 19, 3648. [Google Scholar] [CrossRef]
- Sun, K.; Zhao, Q.; Zou, J. A review of building occupancy measurement systems. Energy Build. 2020, 216, 109965. [Google Scholar] [CrossRef]
- Dai, X.; Liu, J.; Zhang, X. A review of studies applying machine learning models to predict occupancy and window-opening behaviours in smart buildings. Energy Build. 2020, 223, 110159. [Google Scholar] [CrossRef]
- Jin, Y.; Yan, D.; Chong, A.; Dong, B.; An, J. Building occupancy forecasting: A systematical and critical review. Energy Build. 2021, 251, 111345. [Google Scholar] [CrossRef]
- Saha, H.; Florita, A.R.; Henze, G.P.; Sarkar, S. Occupancy sensing in buildings: A review of data analytics approaches. Energy Build. 2019, 188–189, 278–285. [Google Scholar] [CrossRef]
- Mobaraki, B.; Lozano-Galant, F.; Soriano, R.P.; Pascual, F.J.C. Application of Low-Cost Sensors for Building Monitoring: A Systematic Literature Review. Buildings 2021, 11, 336. [Google Scholar] [CrossRef]
- Trivedi, D.; Badarla, V. Occupancy detection systems for indoor environments: A survey of approaches and methods. Indoor Built Environ. 2020, 29, 1053–1069. [Google Scholar] [CrossRef]
- Rueda, L.; Agbossou, K.; Cardenas, A.; Henao, N.; Kelouwani, S. A comprehensive review of approaches to building occupancy detection. Build. Environ. 2020, 180, 106966. [Google Scholar] [CrossRef]
- Page, M.J.; McKenzie, J.E.; Bossuyt, P.M.; Boutron, I.; Hoffmann, T.C.; Mulrow, C.D.; Shamseer, L.; Tetzlaff, J.M.; Akl, E.A.; Brennan, S.E.; et al. The PRISMA 2020 statement: An updated guideline for reporting systematic reviews. Syst. Rev. 2021, 10, 89. [Google Scholar] [CrossRef]
- Kofod-Petersen, A. How to Do a Structured Literature Review in Computer Science; Technical Report; Department of Computer and Information Science at Norwegian University of Science and Technology (NTNU): Trondheim, Norway, 2014. [Google Scholar]
- Scopus. Scopus, Elsevier B.V. 2021. Available online: https://www.scopus.com (accessed on 11 September 2021).
- Lam, K.; Hoeynck, M.; Dong, B.; Andrews, B.; Chiou, Y.S.; Zhang, R.; Benitez, D.; Choi, J.H. Occupancy detection through an extensive environmental sensor network in an open-plan office building. In Proceedings of the IBPSA 2009—International Building Performance Simulation Association 2009, Glasgow, Scotland, 27–30 July 2009. [Google Scholar]
- VOSviewer Visualizing Scientific Landscapes, Center for Science and Technology Studies, Leiden University, The Netherlands. 2021. Available online: https://www.vosviewer.com/ (accessed on 11 September 2021).
- van Eck, N.J.; Waltman, L. Software survey: VOSviewer, a computer program for bibliometric mapping. Scientometrics 2010, 84, 523–538. [Google Scholar] [CrossRef]
- Rabiee, R.; Karlsson, J. Multi-Bernoulli Tracking Approach for Occupancy Monitoring of Smart Buildings Using Low-Resolution Infrared Sensor Array. Remote Sens. 2021, 13, 3127. [Google Scholar] [CrossRef]
- Zuraimi, M.; Pantazaras, A.; Chaturvedi, K.; Yang, J.; Tham, K.; Lee, S. Predicting occupancy counts using physical and statistical Co2-based modeling methodologies. Build. Environ. 2017, 123, 517–528. [Google Scholar] [CrossRef]
- Arief-Ang, I.B.; Hamilton, M.; Salim, F.D. RUP: Large Room Utilisation Prediction with carbon dioxide sensor. Pervasive Mob. Comput. 2018, 46, 49–72. [Google Scholar] [CrossRef]
- Arief-Ang, I.B.; Salim, F.D.; Hamilton, M. SD-HOC: Seasonal Decomposition Algorithm for Mining Lagged Time Series. In Proceedings of the Data Mining, Melbourne, Australia, 19–20 August 2017; Springer: Singapore, 2018; pp. 125–143. [Google Scholar]
- Zhou, Y.; Chen, J.; Yu, Z.J.; Li, J.; Huang, G.; Haghighat, F.; Zhang, G. A novel model based on multi-grained cascade forests with wavelet denoising for indoor occupancy estimation. Build. Environ. 2020, 167, 106461. [Google Scholar] [CrossRef]
- Wolf, S.; Justo Alonso, M.; Calì, D.; Krogstie, J.; Martin Mathisen, H.; Madsen, H. CO2-based grey-box model to estimate airflow rate and room occupancy. E3S Web Conf. 2019, 111, 1–7. [Google Scholar] [CrossRef]
- Wolf, S.; Møller, J.K.; Bitsch, M.A.; Krogstie, J.; Madsen, H. A Markov-Switching model for building occupant activity estimation. Energy Build. 2019, 183, 672–683. [Google Scholar] [CrossRef]
- Jiang, C.; Masood, M.K.; Soh, Y.C.; Li, H. Indoor occupancy estimation from carbon dioxide concentration. Energy Build. 2016, 131, 132–141. [Google Scholar] [CrossRef]
- Jin, M.; Bekiaris-Liberis, N.; Weekly, K.; Spanos, C.J.; Bayen, A.M. Occupancy Detection via Environmental Sensing. IEEE Trans. Autom. Sci. Eng. 2018, 15, 443–455. [Google Scholar] [CrossRef]
- Zemouri, S.; Magoni, D.; Zemouri, A.; Gkoufas, Y.; Katrinis, K.; Murphy, J. An Edge Computing Approach to Explore Indoor Environmental Sensor Data for Occupancy Measurement in Office Spaces. In Proceedings of the 2018 IEEE International Smart Cities Conference (ISC2), Kansas City, MO, USA, 16–19 September 2018; pp. 1–8. [Google Scholar] [CrossRef]
- Viani, F.; Polo, A.; Robol, F.; Oliveri, G.; Rocca, P.; Massa, A. Crowd detection and occupancy estimation through indirect environmental measurements. In Proceedings of the 8th European Conference on Antennas and Propagation (EuCAP 2014), The Hague, The Netherlands, 6–11 April 2014. [Google Scholar] [CrossRef]
- Fiebig, F.; Kochanneck, S.; Mauser, I.; Schmeck, H. Detecting Occupancy in Smart Buildings by Data Fusion from Low-cost Sensors: Poster Description. In Proceedings of the Eighth International Conference on Future Energy Systems, Shatin, Hong Kong, 16–19 May 2017; pp. 259–261. [Google Scholar] [CrossRef]
- Weekly, K.; Rim, D.; Zhang, L.; Bayen, A.M.; Nazaroff, W.W.; Spanos, C.J. Low-cost coarse airborne particulate matter sensing for indoor occupancy detection. In Proceedings of the 2013 IEEE International Conference on Automation Science and Engineering (CASE), Madison, WI, USA, 17–20 August 2013. [Google Scholar] [CrossRef]
- Dedesko, S.; Stephens, B.; Gilbert, J.A.; Siegel, J.A. Methods to assess human occupancy and occupant activity in hospital patient rooms. Build. Environ. 2015, 90, 136–145. [Google Scholar] [CrossRef]
- Li, T.; Fong, S.; Yang, L. Counting Passengers in Public Buses by Sensing Carbon Dioxide Concentration. In Proceedings of the 2018 2nd International Conference on Big Data and Internet of Things—BDIOT 2018, Beijing, China, 24–26 October 2018. [Google Scholar] [CrossRef]
- Saralegui, U.; Anton, M.A.; Ordieres-Mere, J. Taking advantage of an existing indoor climate monitorization for measuring occupancy. WSEAS Trans. Environ. Dev. 2017, 13, 327–334. [Google Scholar]
- Ryu, S.H.; Moon, H.J. Development of an occupancy prediction model using indoor environmental data based on machine learning techniques. Build. Environ. 2016, 107, 1–9. [Google Scholar] [CrossRef]
- Vanus, J.; Machac, J.; Martinek, R.; Bilik, P.; Zidek, J.; Nedoma, J.; Fajkus, M. The design of an indirect method for the human presence monitoring in the intelligent building. Hum.-Centric Comput. Inf. Sci. 2018, 8, 28. [Google Scholar] [CrossRef]
- Kim, S.H.; Moon, H.J. Case study of an advanced integrated comfort control algorithm with cooling, ventilation, and humidification systems based on occupancy status. Build. Environ. 2018, 133, 246–264. [Google Scholar] [CrossRef]
- Elkhoukhi, H.; NaitMalek, Y.; Bakhouya, M.; Berouine, A.; Kharbouch, A.; Lachhab, F.; Hanifi, M.; Ouadghiri, D.E.; Essaaidi, M. A platform architecture for occupancy detection using stream processing and machine learning approaches. Concurr. Comput. Pract. Exp. 2019, 32, e5651. [Google Scholar] [CrossRef]
- Pentair Technical Products. Technical Information: Thermal Management; Pentair Technical Products: Pharr, TX, USA, 2011. [Google Scholar]
- Amayri, M.; Ploix, S.; Kazmi, H.; Ngo, Q.D.; Safadi, E.L.A.E.L. Estimating Occupancy from Measurements and Knowledge Using the Bayesian Network for Energy Management. J. Sens. 2019, 2019, 7129872. [Google Scholar] [CrossRef]
- Han, K.; Zhang, J. Energy-saving building system integration with a smart and low-cost sensing/control network for sustainable and healthy living environments: Demonstration case study. Energy Build. 2020, 214, 109861. [Google Scholar] [CrossRef]
- Szczurek, A.; Maciejewska, M.; Pietrucha, T. Occupancy determination based on time series of CO2 concentration, temperature and relative humidity. Energy Build. 2017, 147, 142–154. [Google Scholar] [CrossRef]
- Hobson, B.W.; Lowcay, D.; Gunay, H.B.; Ashouri, A.; Newsham, G.R. Opportunistic occupancy-count estimation using sensor fusion: A case study. Build. Environ. 2019, 159, 106154. [Google Scholar] [CrossRef]
- Alablani, I.; Alenazi, M. EDTD-SC: An IoT Sensor Deployment Strategy for Smart Cities. Sensors 2020, 20, 7191. [Google Scholar] [CrossRef]
- Cocchi, M. (Ed.) Data Fusion Methodology and Applications, 1st ed.; Elsevier: Amsterdam, The Netherlands, 2019; Volume 31, ISBN 978-0-444-63984-4. [Google Scholar]
- Candanedo, L.M.; Feldheim, V. Accurate occupancy detection of an office room from light, temperature, humidity and CO2 measurements using statistical learning models. Energy Build. 2016, 112, 28–39. [Google Scholar] [CrossRef]
- Dey, A.; Ling, X.; Syed, A.; Zheng, Y.; Landowski, B.; Anderson, D.; Stuart, K.; Tolentino, M.E. Namatad: Inferring occupancy from building sensors using machine learning. In Proceedings of the 2016 IEEE 3rd World Forum on Internet of Things (WF-IoT), Reston, VA, USA, 12–14 December 2016. [Google Scholar] [CrossRef]
- Dong, B.; Andrews, B.; Lam, K.P.; Höynck, M.; Zhang, R.; Chiou, Y.S.; Benitez, D. An information technology enabled sustainability test-bed (ITEST) for occupancy detection through an environmental sensing network. Energy Build. 2010, 42, 1038–1046. [Google Scholar] [CrossRef]
- Arora, A.; Amayri, M.; Badarla, V.; Bandyopadhyay, S. Occupancy Estimation Using non Intrusive Sensors in Energy Efficient Buildings. In Proceedings of the 14th Conference of International Building Performance Simulation Association, Hyderabad, India, 7–9 December 2015.
- Zimmermann, L.; Weigel, R.; Fischer, G. Fusion of Nonintrusive Environmental Sensors for Occupancy Detection in Smart Homes. IEEE Internet Things J. 2018, 5, 2343–2352. [Google Scholar] [CrossRef]
- Chen, Z.; Masood, M.K.; Soh, Y.C. A fusion framework for occupancy estimation in office buildings based on environmental sensor data. Energy Build. 2016, 133, 790–798. [Google Scholar] [CrossRef]
- Ioannidis, D.; Zikos, S.; Krinidis, S.; Tryferidis, A.; Tzovaras, D.; Likothanassis, S. Occupancy-driven facility management and building performance analysis. Int. J. Sustain. Dev. Plan. 2017, 12, 1155–1167. [Google Scholar] [CrossRef]
- Mora, D.; Fajilla, G.; Austin, M.C.; Simone, M.D. Occupancy patterns obtained by heuristic approaches: Cluster analysis and logical flowcharts. A case study in a university office. Energy Build. 2019, 186, 147–168. [Google Scholar] [CrossRef]
- Mulia, M.T.; Supangkat, S.H.; Hariyanto, N. A review on building occupancy estimation methods. In Proceedings of the 2017 International Conference on ICT For Smart Society (ICISS), Tangerang, Indonesia, 18–19 September 2017; pp. 1–7. [Google Scholar] [CrossRef]
- Candanedo, L.M.; Feldheim, V.; Deramaix, D. A methodology based on Hidden Markov Models for occupancy detection and a case study in a low energy residential building. Energy Build. 2017, 148, 327–341. [Google Scholar] [CrossRef]
- Amayri, M.; Ngo, Q.D.; Safadi, E.A.E.; Ploix, S. Bayesian network and Hidden Markov Model for estimating occupancy from measurements and knowledge. In Proceedings of the 2017 9th IEEE International Conference on Intelligent Data Acquisition and Advanced Computing Systems: Technology and Applications (IDAACS), Bucharest, Romania, 21–23 September 2017; Volume 2, pp. 690–695. [Google Scholar] [CrossRef]
- Chaney, J.; Hugh Owens, E.; Peacock, A.D. An evidence based approach to determining residential occupancy and its role in demand response management. Energy Build. 2016, 125, 254–266. [Google Scholar] [CrossRef]
- Díaz, J.; Jiménez, M. Experimental assessment of room occupancy patterns in an office building. Comparison of different approaches based on CO2 concentrations and computer power consumption. Appl. Energy 2017, 199, 121–141. [Google Scholar] [CrossRef]
- Kampezidou, S.I.; Ray, A.T.; Duncan, S.; Balchanos, M.G.; Mavris, D.N. Real-time occupancy detection with physics-informed pattern-recognition machines based on limited CO2 and temperature sensors. Energy Build. 2021, 242, 110863. [Google Scholar] [CrossRef]
- Wang, W.; Hong, T.; Xu, N.; Xu, X.; Chen, J.; Shan, X. Cross-source sensing data fusion for building occupancy prediction with adaptive lasso feature filtering. Build. Environ. 2019, 162, 106280. [Google Scholar] [CrossRef]
- Floris, A.; Porcu, S.; Girau, R.; Atzori, L. An IoT-Based Smart Building Solution for Indoor Environment Management and Occupants Prediction. Energies 2021, 14, 2959. [Google Scholar] [CrossRef]
- Hitimana, E.; Bajpai, G.; Musabe, R.; Sibomana, L.; Kayalvizhi, J. Implementation of IoT Framework with Data Analysis Using Deep Learning Methods for Occupancy Prediction in a Building. Future Internet 2021, 13, 67. [Google Scholar] [CrossRef]
- Khalil, M.; McGough, S.; Pourmirza, Z.; Pazhoohesh, M.; Walker, S. Transfer Learning Approach for Occupancy Prediction in Smart Buildings. In Proceedings of the 2021 12th International Renewable Engineering Conference (IREC), Amman, Jordan, 14–15 April 2021. [Google Scholar] [CrossRef]
- Choi, J.; Ge, H.; Koshizuka, N. IoT-based Occupants Counting with Smart Building State Variables. In Proceedings of the 2020 IEEE 29th International Conference on Enabling Technologies: Infrastructure for Collaborative Enterprises (WETICE), Bayonne, France, 10–13 September 2020. [Google Scholar] [CrossRef]
- Franco, A.; Leccese, F. Measurement of CO2 concentration for occupancy estimation in educational buildings with energy efficiency purposes. J. Build. Eng. 2020, 32, 101714. [Google Scholar] [CrossRef]
- Chitu, C.; Stamatescu, G.; Stamatescu, I.; Sgarciu, V. Assessment of Occupancy Estimators for Smart Buildings. In Proceedings of the 2019 10th IEEE International Conference on Intelligent Data Acquisition and Advanced Computing Systems: Technology and Applications (IDAACS), Metz, France, 18–21 September 2019. [Google Scholar] [CrossRef]
- Abade, B.; Abreu, D.P.; Curado, M. A Non-Intrusive Approach for Indoor Occupancy Detection in Smart Environments. Sensors 2018, 18, 3953. [Google Scholar] [CrossRef] [PubMed]
- Bathula, D.; Bansal, D.; Krishna, E.B.; Lohani, D. Occupancy Estimation Using Sensor Data Analytics. In Proceedings of the 2018 Fourteenth International Conference on Information Processing (ICINPRO), Bangalore, India, 21–23 December 2018. [Google Scholar] [CrossRef]
- Brennan, C.; Taylor, G.W.; Spachos, P. Distributed Sensor Network for Indirect Occupancy Measurement in Smart Buildings. In Proceedings of the 2018 14th International Wireless Communications & Mobile Computing Conference (IWCMC), Limassol, Cyprus, 25–29 June 2018. [Google Scholar] [CrossRef]
- Pedersen, T.H.; Nielsen, K.U.; Petersen, S. Method for room occupancy detection based on trajectory of indoor climate sensor data. Build. Environ. 2017, 115, 147–156. [Google Scholar] [CrossRef]
- Sangogboye, F.C.; Arendt, K.; Singh, A.; Veje, C.T.; Kjærgaard, M.B.; Jørgensen, B.N. Performance comparison of occupancy count estimation and prediction with common versus dedicated sensors for building model predictive control. Build. Simul. 2017, 10, 829–843. [Google Scholar] [CrossRef]
- Han, Z.; Gao, R.X.; Fan, Z. Occupancy and indoor environment quality sensing for smart buildings. In Proceedings of the 2012 IEEE International Instrumentation and Measurement Technology Conference Proceedings, Graz, Austria, 13–16 May 2012. [Google Scholar] [CrossRef]
- Yang, Z.; Li, N.; Becerik-Gerber, B.; Orosz, M. A Multi-Sensor Based Occupancy Estimation Model for Supporting Demand Driven HVAC Operations. In Proceedings of the 2012 Symposium on Simulation for Architecture and Urban Design, Orlando, FL, USA, 26–30 March 2012; Society for Computer Simulation International: San Diego, CA, USA, 2012. [Google Scholar]
- Chen, Z.; Zhao, R.; Zhu, Q.; Masood, M.K.; Soh, Y.C.; Mao, K. Building Occupancy Estimation with Environmental Sensors via CDBLSTM. IEEE Trans. Ind. Electron. 2017, 64, 9549–9559. [Google Scholar] [CrossRef]
- Masood, M.K.; Soh, Y.C.; Chang, V.W.C. Real-time occupancy estimation using environmental parameters. In Proceedings of the 2015 International Joint Conference on Neural Networks (IJCNN), Killarney, Ireland, 12–17 July 2015; pp. 1–8. [Google Scholar] [CrossRef]
- Zhang, R.; Lam, K.P.; Chiou, Y.S.; Dong, B. Information-theoretic environment features selection for occupancy detection in open office spaces. Build. Simul. 2012, 5, 179–188. [Google Scholar] [CrossRef]
- Mamidi, S.; Chang, Y.H.; Maheswaran, R. Improving Building Energy Efficiency with a Network of Sensing, Learning and Prediction Agents. In Proceedings of the 11th International Conference on Autonomous Agents and Multiagent Systems—Volume 1, Valencia, Spain, 4–8 June 2012; International Foundation for Autonomous Agents and Multiagent Systems: Richland, SC, USA, 2012; pp. 45–52. [Google Scholar]
- Kamal, U.; Ahmed, S.; Toha, T.R.; Islam, N.; Alim Al Islam, A.B.M. Intelligent Human Counting through Environmental Sensing in Closed Indoor Settings. Mob. Netw. Appl. 2020, 25, 474–490. [Google Scholar] [CrossRef]
- Momeni, M.; Wu, A.D.C. Data-driven Demand Control Ventilation Using Machine Learning CO2 Occupancy Detection Method. In Proceedings of the 33rd International Conference on Efficiency, Cost, Optimization, Simulation and Environmental Impact of Energy Systems (ECOS 2020), Osaka, Japan, 29 June–3 July 2020. [Google Scholar]
- Zhou, Y.; Yu, Z.J.; Li, J.; Huang, Y.; Zhang, G. A data mining model for building occupancy estimation based on deep learning methods. IOP Conf. Ser. Mater. Sci. Eng. 2019, 609, 072029. [Google Scholar] [CrossRef]
- Kim, S.; Song, Y.; Sung, Y.; Seo, D. Development of a Consecutive Occupancy Estimation Framework for Improving the Energy Demand Prediction Performance of Building Energy Modeling Tools. Energies 2019, 12, 433. [Google Scholar] [CrossRef]
- Jiang, C.; Chen, Z.; Png, L.C.; Bekiroglu, K.; Srinivasan, S.; Su, R. Building Occupancy Detection from Carbon-dioxide and Motion Sensors. In Proceedings of the 2018 15th International Conference on Control, Automation, Robotics and Vision (ICARCV), Singapore, 18–21 November 2018; pp. 931–936. [Google Scholar] [CrossRef]
- Yoshida, M.; Kleisarchaki, S.; Gtirgen, L.; Nishi, H. Indoor Occupancy Estimation via Location-Aware HMM: An IoT Approach. In Proceedings of the 2018 IEEE 19th International Symposium on “A World of Wireless, Mobile and Multimedia Networks” (WoWMoM), Chania, Greece, 12–15 June 2018; pp. 14–19. [Google Scholar] [CrossRef]
- Amayri, M.; Arora, A.; Ploix, S.; Bandhyopadyay, S.; Ngo, Q.D.; Badarla, V.R. Estimating occupancy in heterogeneous sensor environment. Energy Build. 2016, 129, 46–58. [Google Scholar] [CrossRef]
- Lee, J.; Jang, K.J.; Han, H. Occupancy estimation method using dynamic neural network model based on CO2 concentration and additional factors. In Proceedings of the Indoor Air 2014—13th International Conference on Indoor Air Quality and Climate, Hong Kong, 7–12 July 2014; pp. 318–323. [Google Scholar]
- Ebadat, A.; Bottegal, G.; Varagnolo, D.; Wahlberg, B.; Johansson, K.H. Estimation of Building Occupancy Levels through Environmental Signals Deconvolution. In Proceedings of the 5th ACM Workshop on Embedded Systems For Energy-Efficient Buildings (BuildSys’13), Roma, Italy, 11–15 November 2013; Association for Computing Machinery: New York, NY, USA, 2013; pp. 1–8. [Google Scholar] [CrossRef]
- Zhang, B.; Shen, Y.; Zhang, L. Inferring building occupancy based on statistical modeling of multi-sensor data. In Proceedings of the 2016 IEEE International Conference on Automation Science and Engineering (CASE), Fort Worth, TX, USA, 21–25 August 2016; pp. 809–814. [Google Scholar] [CrossRef]
- Szczurek, A.; Maciejewska, M.; Pietrucha, T. Occupancy Detection using Gas Sensors. In Proceedings of the 6th International Conference on Sensor Networks. SCITEPRESS—Science and Technology Publications, Porto, Portugal, 19–21 February 2017. [Google Scholar] [CrossRef]


| Inclusion Criteria | Exclusion Criteria | ||
|---|---|---|---|
| IC1 | Publications whose titles contain the word “occupancy” and at least one environmental variable (e.g., CO, Temperature, RH, etc.) considered. | EC1 | No match to the inclusion criteria. |
| IC2 | Articles that contain keywords that match the defined keywords. | EC2 | Duplicate publication. |
| IC3 | The abstracts include search keywords or have a detectable relationship with the selected theme. | EC3 | Research that involves datasets from other authors. |
| IC4 | Articles that include at least one environmental sensor in their experiments. | EC4 | Thesis, books, and preprint studies. |
| IC5 | The publication is available in full text in an open manner or through any of Tecnologico de Monterrey’s subscriptions. |
| Query No. | Query Strings | Results | Selected |
|---|---|---|---|
| 1 | KEY ((“occupancy” OR “occupancy estimation” OR “occupancy detection” OR “occupancy building” OR “occupancy levels”) AND ((“Ambient” AND (“sensing” OR “Variables”)) OR (“environmental” AND (“sensor” OR “variables” OR “parameters”)))) | 153 | 33 |
| 2 | TITLE-ABS-KEY (((indoor OR enclosed) AND (occupancy) AND ((environmental OR environment) AND (sensor OR variables OR parameters)))) | 623 | 15 |
| 3 | ALL ((indoor) OR (enclosed)) AND ((occupancy AND (estimation OR detection OR prediction))) AND ((environmental AND variables) OR (environmental AND sensing) OR (non-intrusive)) | 3031 | 45 |
| Total | 3807 | 93 |
Publisher’s Note: MDPI stays neutral with regard to jurisdictional claims in published maps and institutional affiliations. |
© 2022 by the authors. Licensee MDPI, Basel, Switzerland. This article is an open access article distributed under the terms and conditions of the Creative Commons Attribution (CC BY) license (https://creativecommons.org/licenses/by/4.0/).
Share and Cite
Mena, A.R.; Ceballos, H.G.; Alvarado-Uribe, J. Measuring Indoor Occupancy through Environmental Sensors: A Systematic Review on Sensor Deployment. Sensors 2022, 22, 3770. https://doi.org/10.3390/s22103770
Mena AR, Ceballos HG, Alvarado-Uribe J. Measuring Indoor Occupancy through Environmental Sensors: A Systematic Review on Sensor Deployment. Sensors. 2022; 22(10):3770. https://doi.org/10.3390/s22103770
Chicago/Turabian StyleMena, Alma Rosa, Hector G. Ceballos, and Joanna Alvarado-Uribe. 2022. "Measuring Indoor Occupancy through Environmental Sensors: A Systematic Review on Sensor Deployment" Sensors 22, no. 10: 3770. https://doi.org/10.3390/s22103770
APA StyleMena, A. R., Ceballos, H. G., & Alvarado-Uribe, J. (2022). Measuring Indoor Occupancy through Environmental Sensors: A Systematic Review on Sensor Deployment. Sensors, 22(10), 3770. https://doi.org/10.3390/s22103770