Abstract
Clustering nonlinearly separable datasets is always an important problem in unsupervised machine learning. Graph cut models provide good clustering results for nonlinearly separable datasets, but solving graph cut models is an NP hard problem. A novel graph-based clustering algorithm is proposed for nonlinearly separable datasets. The proposed method solves the min cut model by iteratively computing only one simple formula. Experimental results on synthetic and benchmark datasets indicate the potential of the proposed method, which is able to cluster nonlinearly separable datasets with less running time.
1. Introduction
Clustering algorithms classify data points into C clusters (or categories) on the basis of their similarity. Its applications range from image processing [1,2] to biology [3], sociology [4], and business [5]. Clustering algorithms mainly include partition-based clustering [6,7,8,9], density-based clustering [10,11], and graph-based clustering [12,13,14], etc. In partition-based clustering algorithms, the mean (or median) of a cluster is viewed as the clustering center, and a data point is assigned to the nearest center. In density-based clustering algorithms, clusters are groups of data points characterized by the same local density, and a clustering center is the data point of which local density is higher. Graph-based clustering algorithms define a graph with vertices equal to the elements of a dataset, and edges are weighted by the similarity between pairs of data points in the dataset. Then the algorithms find an optimal partition of the graph such that the edges between different subgraph have a very low weight and the edges within a subgraph have high weight. There are several popular constructions to transform a dataset into a similarity graph, such as k-nearest neighbor (KNN) graph and mutual k-nearest neighbor (MKNN) graph [12]. The commonly used graph cut criterions include min cut, ratio cut, normalized cut (Ncut) and Cheeger cut.
Clustering nonlinearly separable datasets is a challenging problem in clustering analysis. Many methods have been proposed to solve this problem. Kernel method maps a nonlinearly separable dataset into a higher-dimensional Hilbert space, and in the Hilbert space the dataset may be linearly separable. DBK clustering [15] proposes a density equalization principle, and then based on this principle, they propose an adaptive kernel clustering algorithm. Multiple kernels clustering algorithms [16,17,18,19] use multiple kernel functions to enhance the performance of kernel clustering algorithms. Kernel K-means (or Kernel fuzzy K-means) algorithms with appropriate kernel functions are able to cluster nonlinearly separable datasets, but it is difficult to select appropriate kernel functions.
Spectral clustering, which is a famous graph-based clustering algorithm, firstly constructs a graph Laplacian matrix, and then computes eigenvalues and eigenvectors of the graph Laplacian matrix. It regards eigenvectors corresponding to the k smallest eigenvalues as low-dimensional embeddings of the dataset, and finally uses some basic clustering algorithms (for example, K-means) to obtain a clustering result. Hyperplanes clustering method [20] sets up a hyperplane framework to solve the Ncut problem. Sparse subspace clustering [21] builds a similarity graph by sparse representation techniques, and then uses spectral clustering to compute clustering results. Subspace Clustering by Block Diagonal Representation (BDR) [22] proposes a theory of block diagonal property, and is then based on the theory to build the similarity graph. Spectral clustering provides good clustering results for nonlinearly separable datasets, but it is complex to compute eigenvalues and eigenvectors.
In this article, a simple but effective clustering algorithm (called iterative min cut clustering) for nonlinearly separable datasets is proposed. The proposed method is based on graph cuts theory, and it does not require computing the Laplacian matrix, eigenvalues, and eigenvectors. The proposed iterative min cut clustering uses only one formula to map a nonlinearly separable dataset to a linearly separable one-dimensional representation. We demonstrate the performance of the proposed method on synthetic and real datasets.
The remainder of this article is organized as follows. Section 2 introduces the proposed iterative min cut (IMC) algorithm. Section 3 presents the experimental results on nonlinearly separable datasets. Finally, concluding remarks are given in Section 4.
1.1. Related Works
Graph cuts clustering partitions a dataset into C clusters by constructing a graph and finding a partition of the graph such that vertexes (a data point is seen as a vertex of the graph) in same subgraph are similar to each vertex and vertexes in different subgraph are dissimilar from each vertex. The construction methods of transforming a data into a graph mainly include
- (1)
- -neighborhood graph. It connects all vertexes (data points) whose pairwise distances are smaller than , and then obtains an undirected graph.
- (2)
- K-nearest neighbor graphs. It connects a vertex and a vertex if is among the K-nearest neighbors of or if is among the K-nearest neighbors of (or if both is among the K-nearest neighbors of and is among the K-nearest neighbors of ).
- (3)
- The fully connected graph. It connects all points, and then obtains a fully connected graph.
Graph cuts problem is an NP hard problem, and spectral clustering is the most popular method to solve this problem. The spectral clustering algorithm is detailed in Algorithm 1.
| Algorithm 1: Spectral clustering. |
| Input: |
| Do: |
| (1) Compute where is the similarity between and , |
| and is usually computed by |
| (2) Compute the Laplacian matrix where is the degree matrix, |
| and is computed by |
| (3) Compute the first k eigenvectors of , and these eigenvectors are seen as low |
| dimensiona embedding of the original dataset |
| (4) Using K-means to cluster the low dimensional embedding |
| Output: Clustering results of K-means |
Spectral clustering provides good clustering results for nonlinearly separable datasets, but it requires to compute eigenvectors and eigenvalues of the Laplace matrix . The cost of computing eigenvectors and eigenvalues is high without built-in tool.
2. Iterative Min Cut Clustering
In this section, we propose an iterative min cut clustering (IMC). The proposed IMC clustering algorithm partitions a dataset into C clusters by minimizing the following objective function
where is the similarity (i.e., the edge weight) between and . For computational convenience, we normalize the data point as follows. For any ,
The similarity is computed by
We can use -neighborhood graph or K-nearest neighbor graphs (shown in Section 1.1) to select neighbors.
To solve (1), we define a feature f (f is a scalar) for each data point. If two data points belong to the same cluster, then their f values are the same. If two data points belong to the different cluster, then their f values are different. Let represent the feature of . if and belong to the same cluster, and otherwise. can be viewed as a one-dimensional embedding of the dataset X. (1) is equivalent to the following function
The problem is equivalent to . By the Rayleigh–Ritz theorem [23], eigenvectors and eigenvalues of the matrix are approximately equal to those of , so spectral clustering computes eigenvectors of instead of computing eigenvectors of . In this article, we use a novel solution to solve problem (4).
According to (4), we have for every that
Equating all the previous partial derivatives to zero (i.e., ), we obtain the following values of , for every
According to variational method [24], (7) contains two f, and we can view a f as , and view the other f as . The proposed ideal is from variational method. The variational method is well supported by the theory, so the proposed method is indirectly supported by the theory of variational method. The proposed method uses only one formula to solve the problem (4) (Spectral clustering requires computing eigenvalues and eigenvectors to solve this problem, and computing eigenvalues and eigenvectors is complex). The initial is initialized randomly. The proposed IMC algorithm is detailed in Algorithm 2.
| Algorithm 2: IMC algorithm. |
| Input: |
| compute by (3), Randomly initialize |
| Repeat |
| Compute via |
| Until is less than a prescribed tolerance or n is equal to the maximum |
| number of iterations |
| Output: |
Figure 1 shows a nonlinearly separable dataset, and Figure 2 shows its computed by IMC. From Figure 2 we can see that is linearly separable, and we can partition it by using thresholding method. Figure 3 shows a final clustering result of IMC, and from it we can see that the clustering result is consistent with the dataset shown in Figure 1.
Figure 1.
A nonlinearly separable dataset containing three clusters.
Figure 2.
The plot of for the dataset shown in Figure 1. X-axis means i (i.e., the subscript of ), Y-axis means f.
Figure 3.
A clustering result of the dataset shown in Figure 1.
Next, we consider obtaining the final clustering results by one-dimensional vector . We partition the one-dimensional vector into C categories by using some basic clustering algorithms (e.g., K-means) or thresholding method:
where is the c-th threshold.
3. Experiments
In this section, we used experiments to evaluate the effectiveness of the proposed method. The variational method indirectly provided a theoretical support for the proposed method. The purpose of experiments was to verify whether the proposed method was valid. We used six datasets: two synthetic datasets (Dataset 1 and 2) and four UCI real datasets. Dataset 2 was from [10]. Dataset 1 and 2 were composed of 300 and 1587 data points from two and five classes, respectively. The two synthetic datasets are shown in Figure 4, and ground-truth labels are presented in Figure 5. UCI real datasets are detailed in Table 1.
Figure 4.
Synthetic datasets. (a) Dataset 1. (b) Dataset 2.
Figure 5.
Ground-truth labels of two synthetic datasets. (a) Dataset 1. (b) Dataset 2.
Table 1.
UCI real datasets.
All the experiments were implemented using MATLAB 2015a on a standard Window PC with an Intel 2.3 GHz CPU and 8 GB RAM.
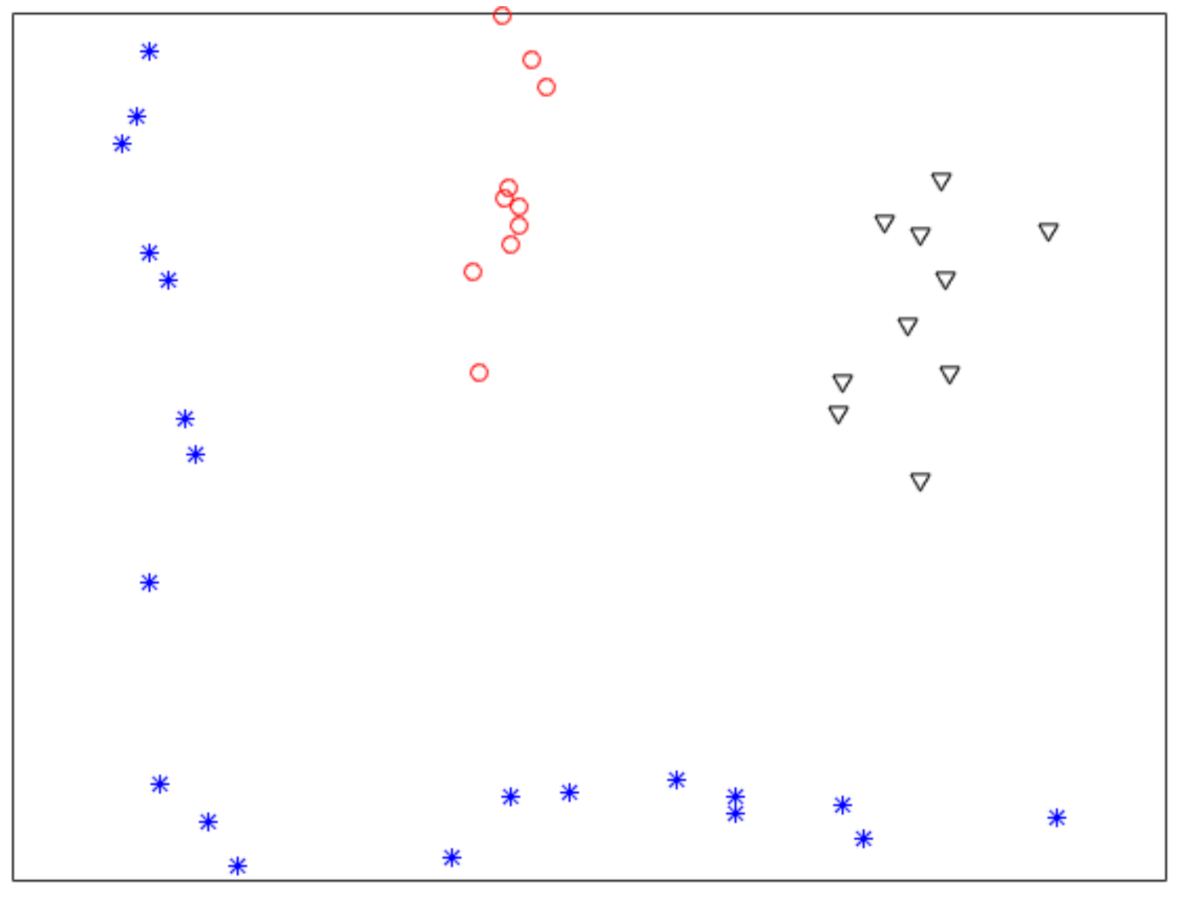
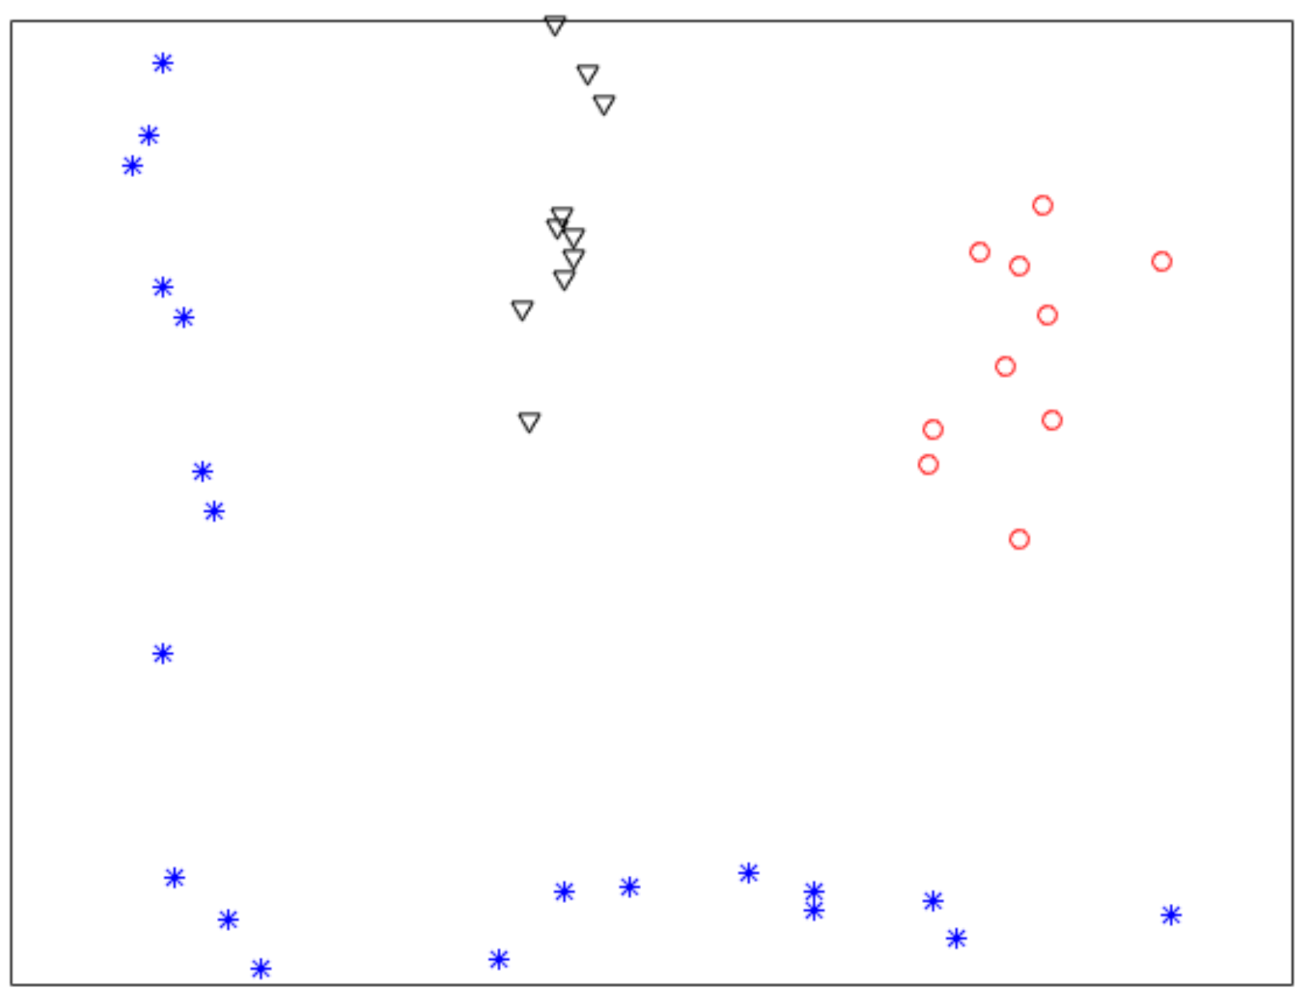
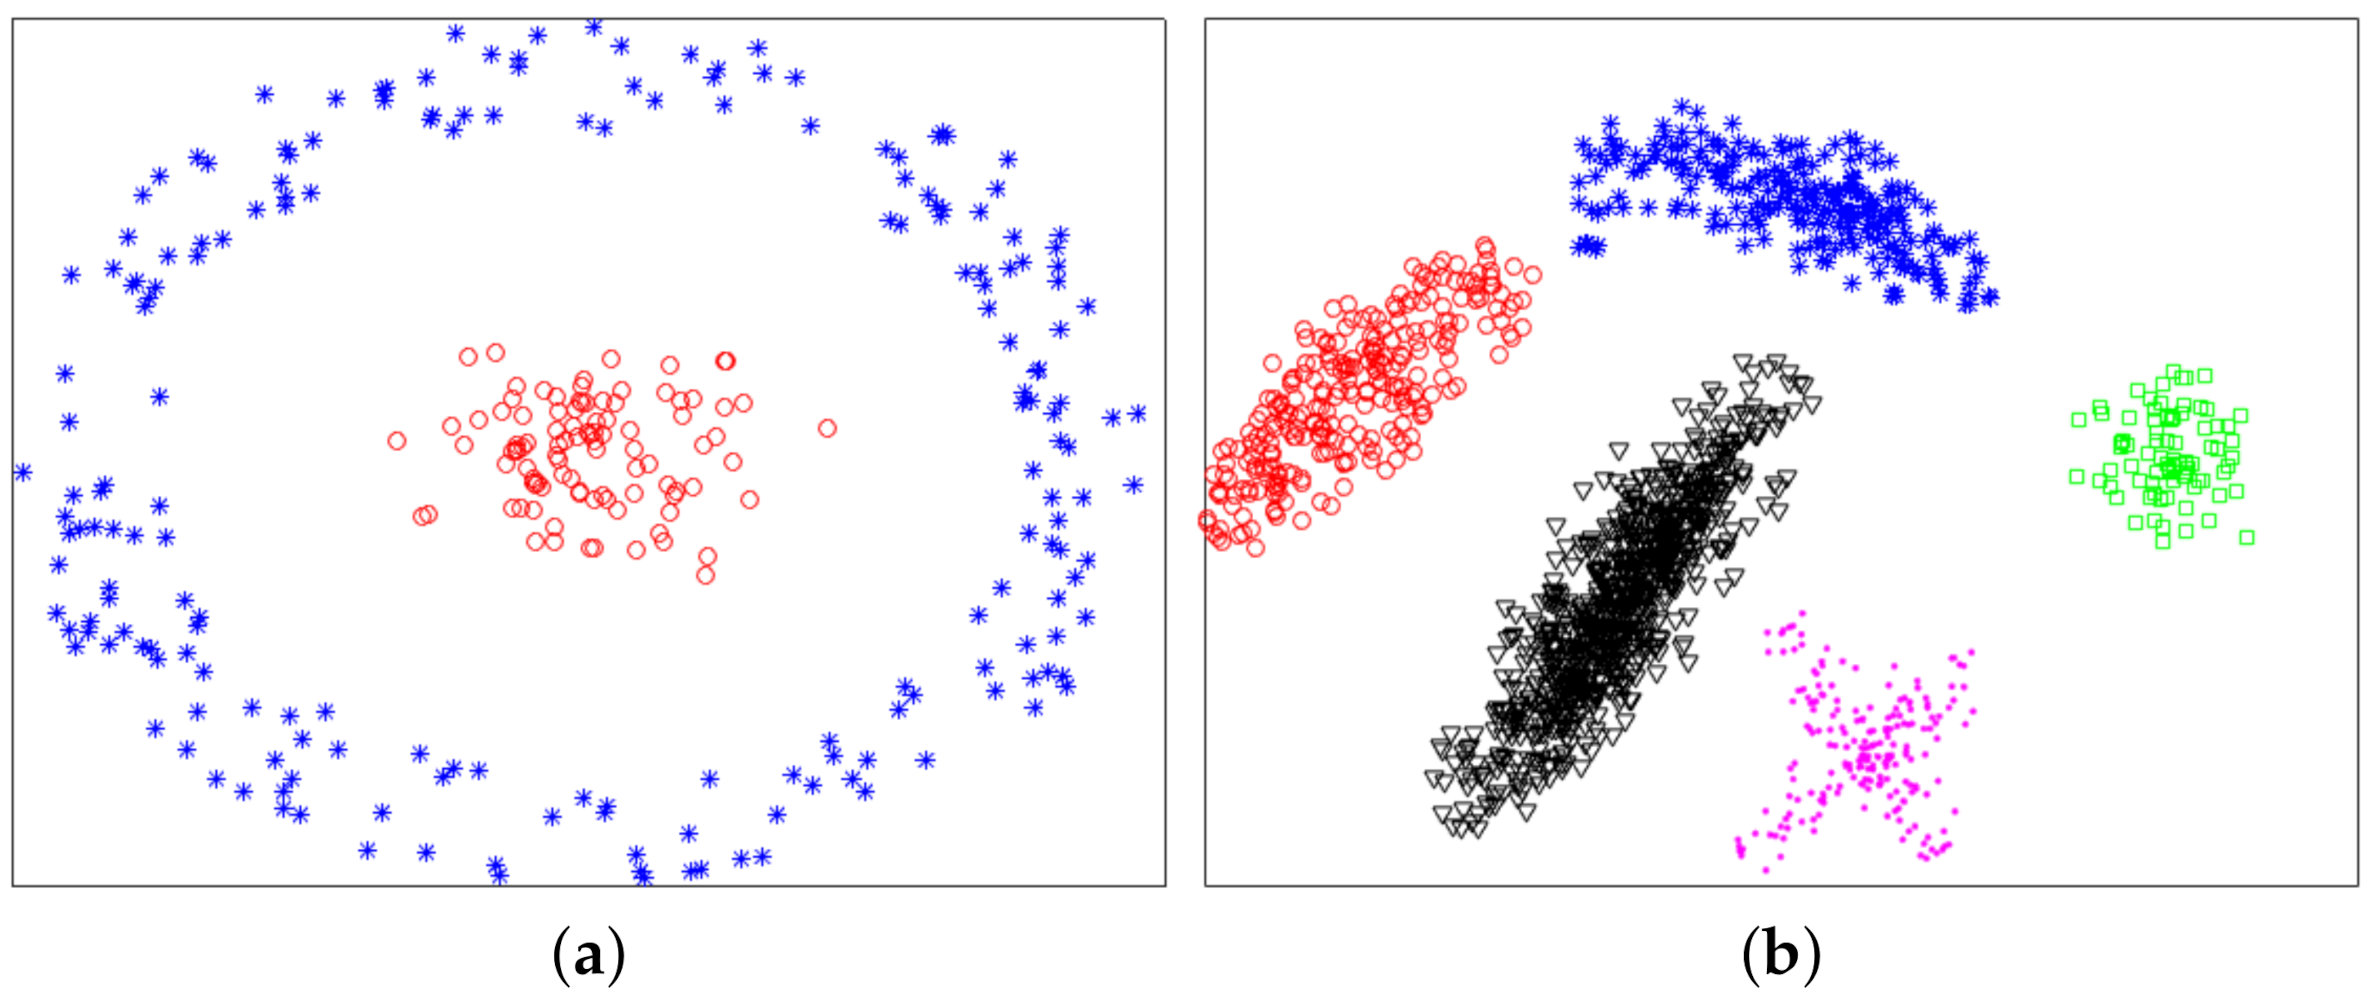
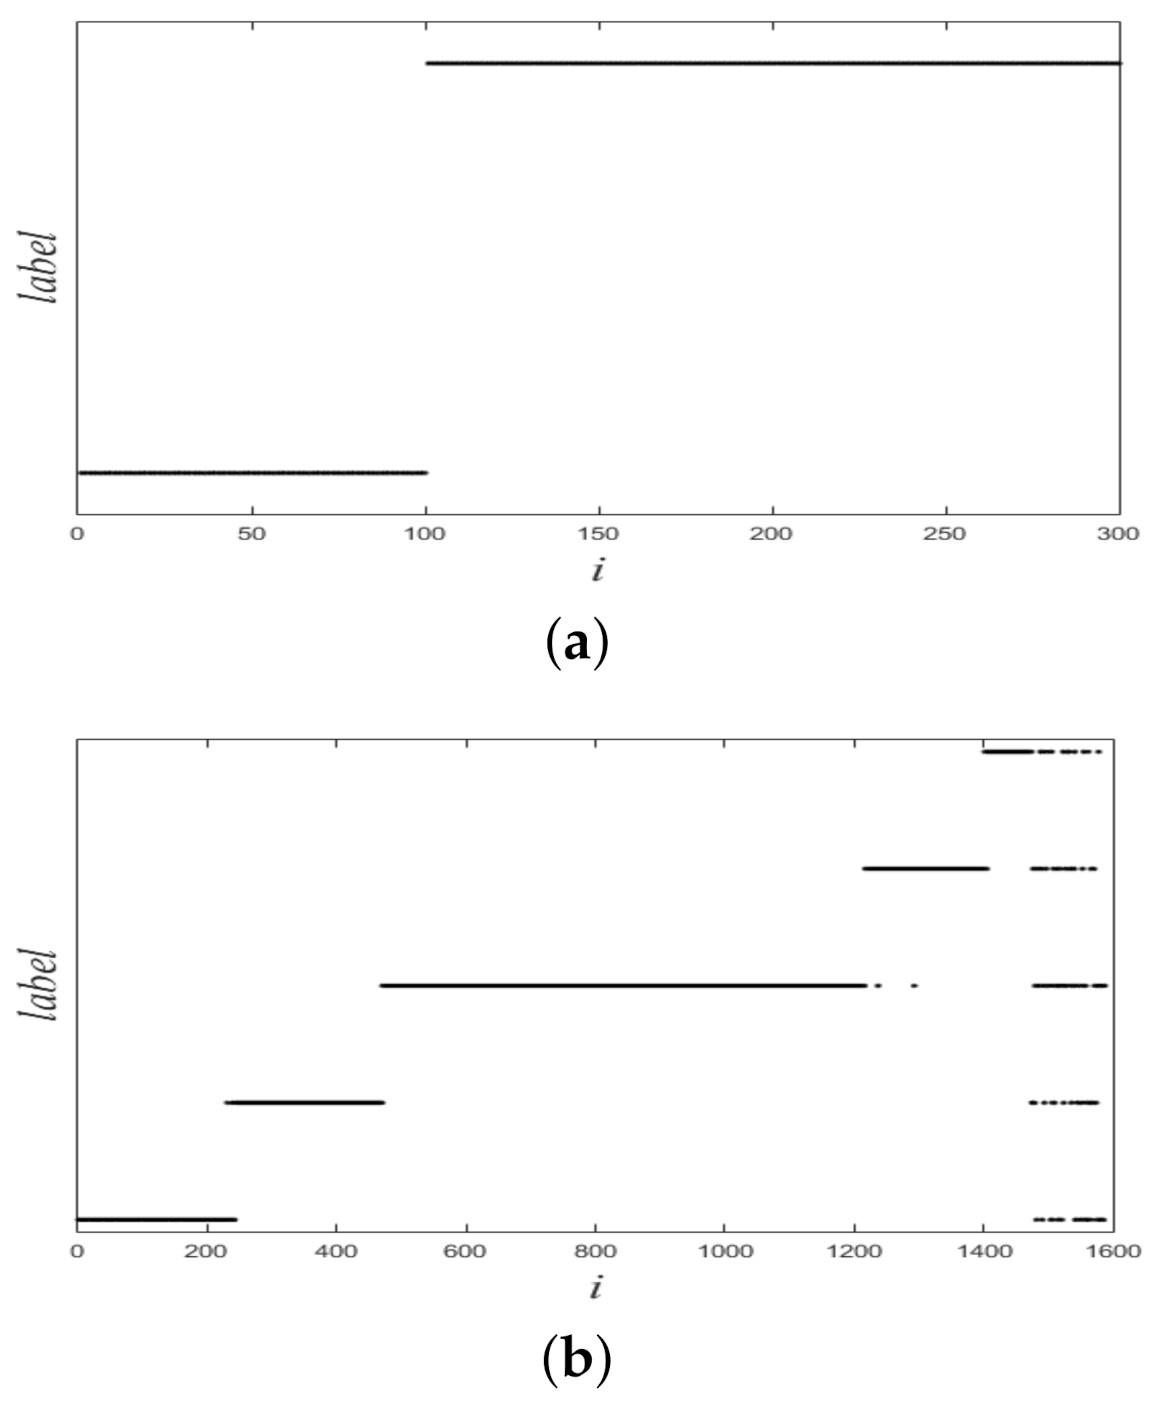
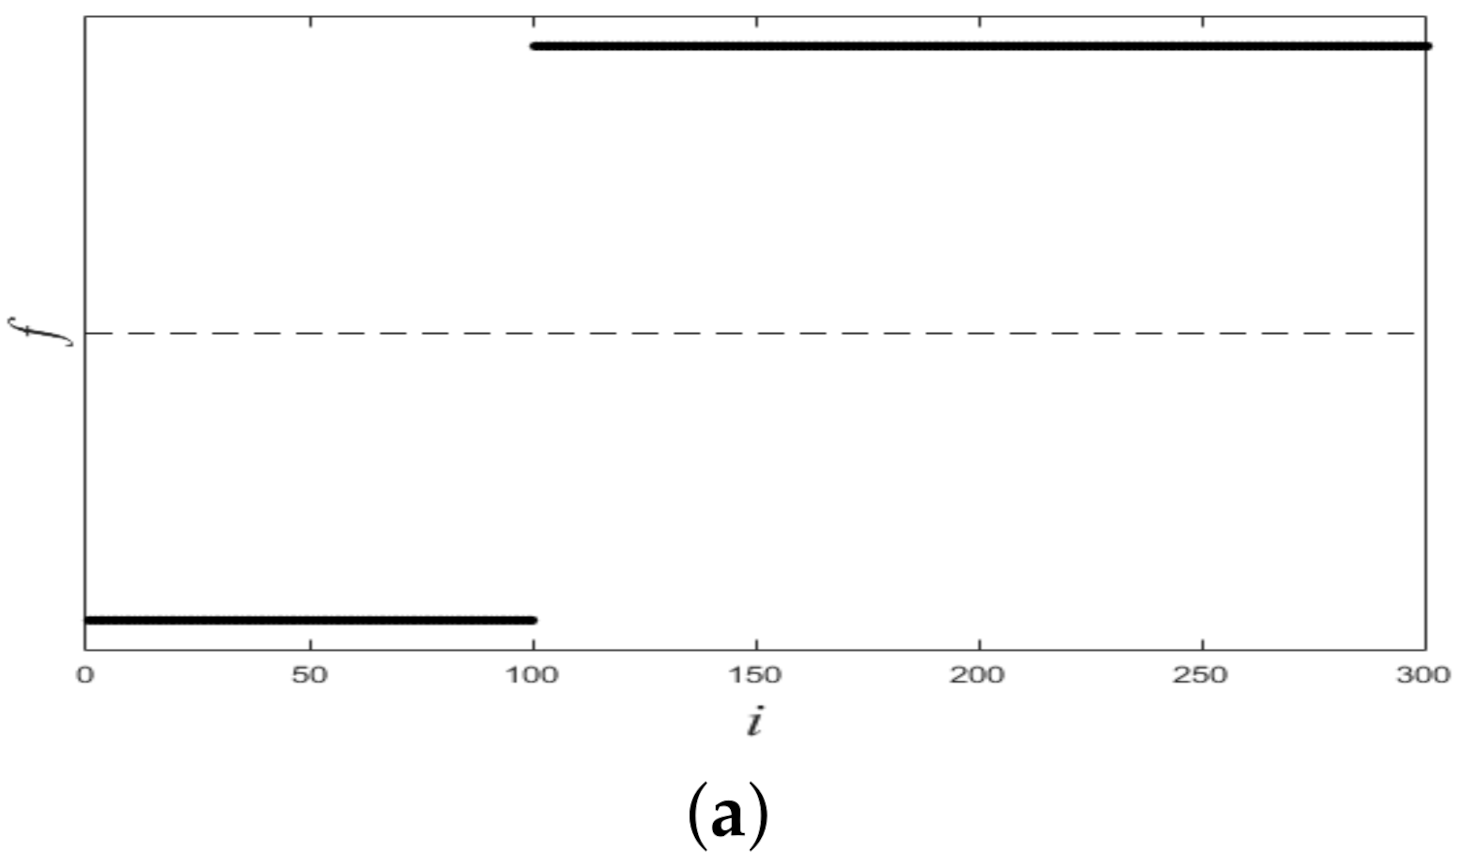
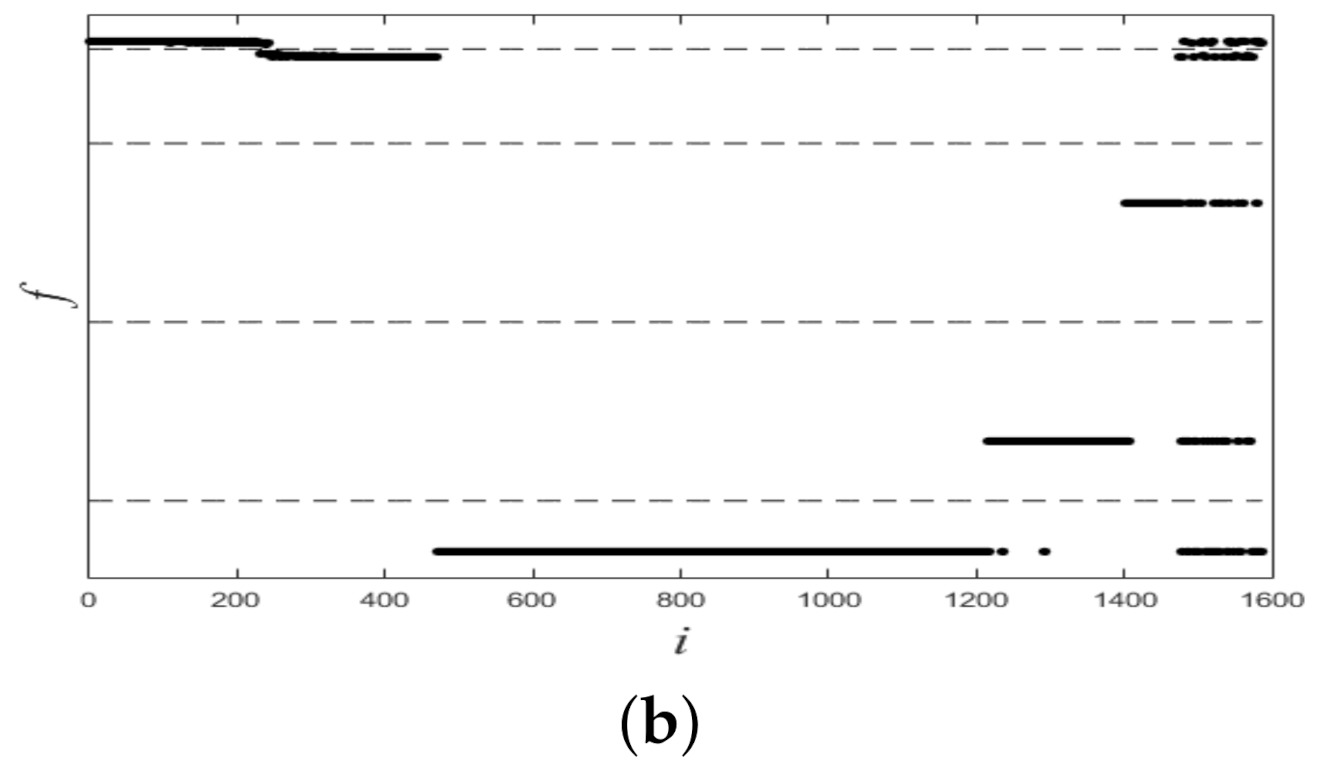
3.1. Experiments for Synthetic Datasets
In this subsection, we used synthetic datasets to demonstrate the performance of the proposed method for nonlinearly separable datasets. We used KNN graph and set . The of (3) was set to 0.1. The maximum number of iterations was 8000 (Note that the computational complexity of (7) was very low, so the algorithm did not take too much time).
Figure 6 shows plots of partitioned on two datasets, and from it we see that all plots of were linearly separable. Figure 7 shows final clustering results for two datasets, and from it we see that all clustering results were consistent with ground-truth labels, so all clustering results were correct.

Figure 6.
Plots of f for two synthetic datasets. (a) Dataset 1. (b) Dataset 2.
Figure 7.
Final clustering results of the proposed IMC. (a) Dataset 1. (b) Dataset 2.
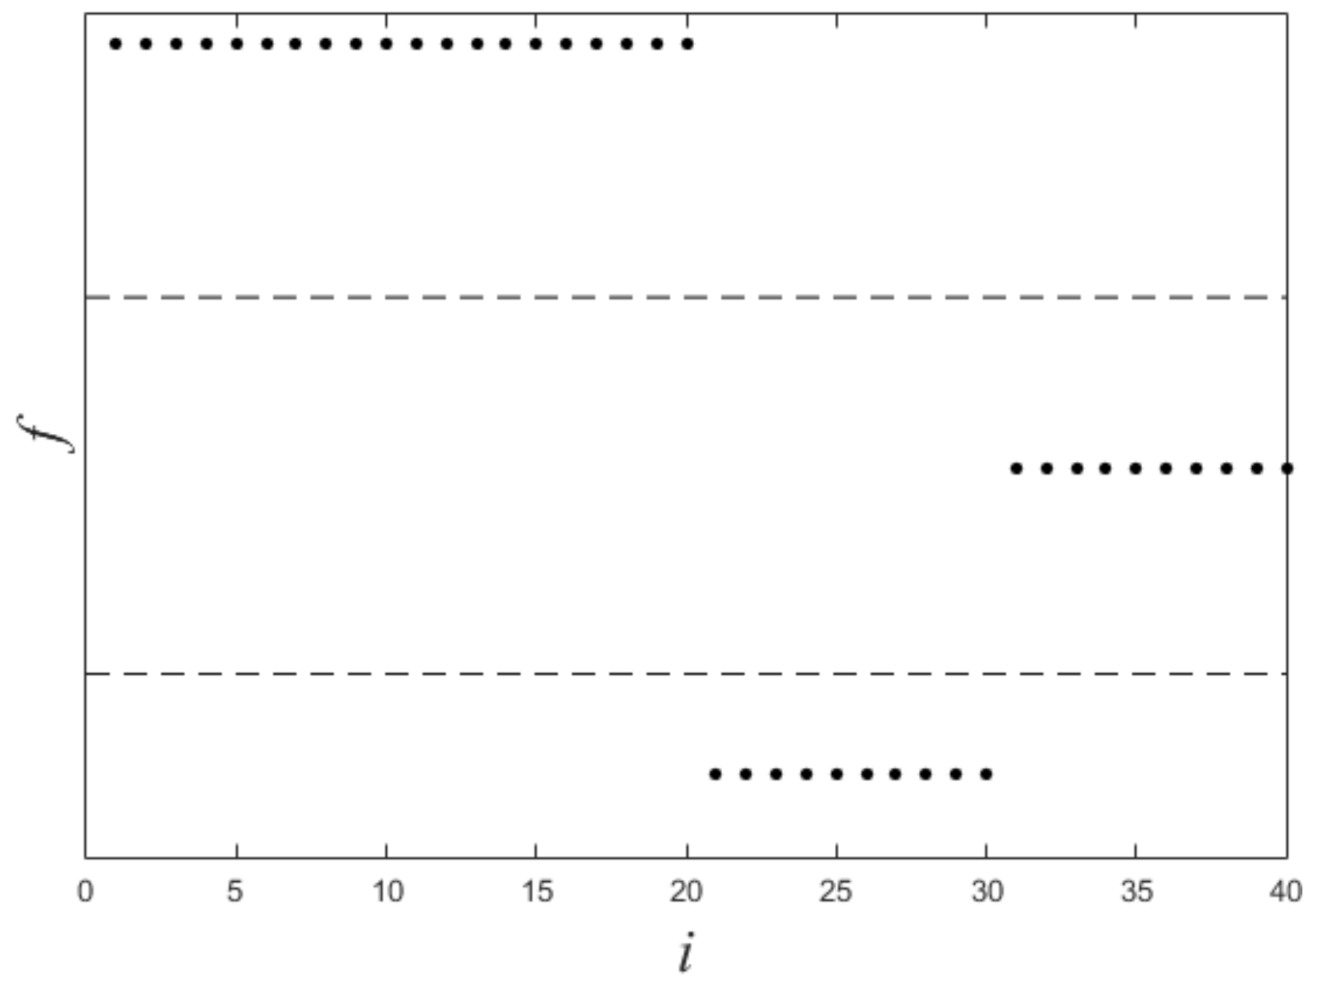
3.2. Experiment about Convergence
We further carried on to evaluate the convergence of the proposed method. We ran the proposed method 100 times on two datasets with different initial values. If all the results were correct, then the algorithm could be globally convergent. We used NMI [25] as the clustering evaluation metric. NMI is a normalization of the Mutual Information score to evaluate the clustering results between 0 (no mutual information) and 1 (perfect correlation).
Table 2 shows the min, max, and mean of NMI of the proposed method for two datasets. From it we can see that all of clustering results were correct. Thus, the proposed IMC could usually obtain correct clustering results.
Table 2.
The min, max, and mean of NMI of the proposed method on two datasets.
3.3. Experiments for Real Datasets
In this subsection, we evaluated the performance of the proposed method on real datasets (shown in Table 1). We ran the proposed method (IMC) and spectral clustering (SC) 50 times, and the mean result was retained.
Table 3 shows the mean of NMI and the mean of running time of IMC and SC on two real datasets. The better results in each case are highlighted in bold. From it we can see that:
Table 3.
NMI and running time comparisons of IMC with spectral clustering (SC) on UCI real datasets.
- (1)
- when the max iteration number was set to 1000 and 2000, IMC needed less running time than SC, but obtained higher NMI than SC;
- (2)
- for different max iteration numbers, IMC obtained different NMI, but all NMI of IMC were higher than those of SC.
4. Concluding Remarks
In this article, we propose a novel graph-based clustering algorithm called IMC for solving the clustering problem on nonlinearly separable datasets. We first compute similarities between pairs of data points. Then the proposed IMC maps a nonlinearly separable dataset to a one-dimensional vector by using only one formula. Finally, we use thresholding method or K-means to obtain final clustering results. We use experiments to evaluate the performance of the proposed method on synthetic nonlinearly separable datasets and real datasets, and we also use experiments to demonstrate the convergence of the proposed method. By experiments, on synthetic datasets and little real datasets, the proposed method can provide good clustering results.
We summarize the advantages of the proposed method from the following two aspects.
Theoretical view: (1) the proposed ideal is from variational method. The variational method is well supported by the mathematics theory, so the proposed method is indirectly supported by the theory of variational method; (2) it uses only one formula to solve the problem (spectral clustering requires to compute eigenvalues and eigenvectors to solve this problem, and computing eigenvalues and eigenvectors is complex).
Practical view: the proposed method can obtain good clustering results for synthetic nonlinearly separable datasets and some real datasets.
In the future, we will consider extending IMC by using other graph cut criteria. Moreover, we think one-dimensional data may not represent the structure of large datasets completely, but one-dimensional data is simple (It is both a strength and a weakness). We will consider how to solve this problem.
Author Contributions
Data curation, T.Z. and Z.Z.; writing—original draft, B.L.; writing—review and editing, Y.L. and Z.L. All authors have read and agreed to the published version of the manuscript.
Funding
This research was funded by National Natural Science Foundation of China (No. 61876010, 61806013, and 61906005), and Scientific Research Project of Beijing Educational Committee (KM202110005028).
Institutional Review Board Statement
Not applicable.
Informed Consent Statement
Not applicable.
Data Availability Statement
Not applicable.
Conflicts of Interest
All authors declare no conflict of interest.
Abbreviations
The following abbreviations are used in this manuscript:
| dataset | |
| number of data points in a dataset | |
| H | dimension of data points |
| i-th data points in a dataset | |
| similarity matrix | |
| similarity between and | |
| degree matrix | |
| Laplace matrix | |
| the feature of | |
| i-th value of |
References
- Otto, C.; Wang, D.; Jain, A. Clustering Millions of Faces by Identity. IEEE Trans. Pattern Anal. Mach. Intell. 2018, 40, 289–303. [Google Scholar] [CrossRef] [PubMed]
- Kim, S.; Yoo, C.D.; Nowozin, S.; Kohli, P. Image Segmentation Using Higher-Order Correlation Clustering. IEEE Trans. Pattern Anal. Mach. Intell. 2014, 36, 1761–1774. [Google Scholar] [CrossRef] [PubMed]
- Taylor, M.J.; Husain, K.; Gartner, Z.J.; Mayor, S.; Vale, R.D. A DNA-Based T Cell Receptor Reveals a Role for Receptor Clustering in Ligand Discrimination. Cell 2017, 169, 108–119. [Google Scholar] [CrossRef] [PubMed]
- Liu, A.A.; Su, Y.T.; Nie, W.Z.; Kankanhalli, M. Hierarchical Clustering Multi-Task Learning for Joint Human Action Grouping and Recognition. IEEE Trans. Pattern Anal. Mach. Intell. 2016, 39, 102–114. [Google Scholar] [CrossRef] [PubMed]
- Xu, J.; Wu, Y.; Zheng, N.; Tu, L.; Luo, M. Improved Affinity Propagation Clustering for Business Districts Mining. In Proceedings of the IEEE 30th International Conference on Tools with Artificial Intelligence (ICTAI), Volos, Greece, 5–7 November 2018; pp. 387–394. [Google Scholar]
- Macqueen, J. Some Methods for Classification and Analysis of Multivariate Observations. In Proceedings of the 5th Berkeley Symposium on Mathematical Statistics and Probability, Oakland, CA, USA, 21 June–18 July 1965; pp. 281–297. [Google Scholar]
- Arthur, D.; Vassilvitskii, S. K-means++: The Advantages of Careful Seeding. In Proceedings of the Eighteenth Annual ACM-SIAM Symposium on Discrete Algorithms, SODA 2007, New Orleans, LA, USA, 7–9 January 2007; pp. 1027–1035. [Google Scholar]
- Bezdek, J.C. Pattern recognition with fuzzy objective function algorithms. Adv. Appl. Pattern Recognit. 1981, 22, 203–239. [Google Scholar]
- Tan, D.; Zhong, W.; Jiang, C.; Peng, X.; He, W. High-order fuzzy clustering algorithm based on multikernel mean shift. Neurocomputing 2020, 385, 63–79. [Google Scholar] [CrossRef]
- Rodriguez, A.; Laio, A. Clustering by Fast Search and Find of Density Peaks. Science 2014, 344, 1492–1496. [Google Scholar] [CrossRef] [PubMed]
- Khan, M.M.R.; Siddique, M.A.B.; Arif, R.B.; Oishe, M.R. ADBSCAN: Adaptive Density-Based Spatial Clustering of Applications with Noise for Identifying Clusters with Varying Densities. In Proceedings of the 4th International Conference on Electrical Engineering and Information & Communication Technology (iCEEiCT), Dhaka, Bangladesh, 13–15 September 2018; pp. 107–111. [Google Scholar]
- Luxburg, U.V. A tutorial on spectral clustering. Stat. Comput. 2007, 17, 395–416. [Google Scholar] [CrossRef]
- Szlam, A.; Bresson, X. Total Variation and Cheeger Cuts. In Proceedings of the International Conference on Machine Learning, Haifa, Israel, 21–25 June 2010; pp. 1039–1046. [Google Scholar]
- Bresson, X.; Laurent, T.; Uminsky, D.; Von Brecht, J. Multiclass total variation clustering. Adv. Neural Inf. Process. Syst. 2013, 26, 1421–1429. [Google Scholar]
- Marin, D.; Tang, M.; Ayed, I.B.; Boykov, Y. Kernel Clustering: Density Biases and Solutions. IEEE Trans. Pattern Anal. Mach. Intell. 2019, 41, 136–147. [Google Scholar] [CrossRef] [PubMed]
- Yu, S.; Tranchevent, L.; Liu, X.; Glanzel, W.; Suykens, J.A.; De Moor, B.; Moreau, Y. Optimized Data Fusion for Kernel k-Means Clustering. IEEE Trans. Pattern Anal. Mach. Intell. 2012, 34, 1031–1039. [Google Scholar] [PubMed]
- Huang, H.; Chuang, Y.; Chen, C. Multiple Kernel Fuzzy Clustering. IEEE Trans. Fuzzy Syst. 2012, 20, 120–134. [Google Scholar] [CrossRef]
- Thiagarajan, J.J.; Ramamurthy, K.N.; Spanias, A. Multiple Kernel Sparse Representations for Supervised and Unsupervised Learning. IEEE Trans. Image Process. 2014, 23, 2905–2915. [Google Scholar] [CrossRef] [PubMed]
- Jia, L.; Li, M.; Zhang, P.; Wu, Y.; Zhu, H. SAR Image Change Detection Based on Multiple Kernel K-Means Clustering With Local-Neighborhood Information. IEEE Geosci. Remote Sens. Lett. 2016, 13, 856–860. [Google Scholar] [CrossRef]
- Hofmeyr, D.P. Clustering by Minimum Cut Hyperplanes. IEEE Trans. Pattern Anal. Mach. Intell. 2017, 39, 1547–1560. [Google Scholar] [CrossRef] [PubMed]
- Elhamifar, E.; Vidal, R. Sparse Subspace Clustering: Algorithm, Theory, and Applications. IEEE Trans. Pattern Anal. Mach. Intell. 2013, 35, 2765–2781. [Google Scholar] [CrossRef] [PubMed]
- Lu, C.; Feng, J.; Lin, Z.; Mei, T.; Yan, S. Subspace Clustering by Block Diagonal Representation. IEEE Trans. Pattern Anal. Mach. Intell. 2019, 41, 487–501. [Google Scholar] [CrossRef] [PubMed]
- Trenkler, G. Handbook of Matrices. Comput. Stats Data Anal. 1997, 25, 243. [Google Scholar] [CrossRef]
- Rudin, L.I.; Osher, S.; Fatemi, E. Nonlinear total variation based noise removal algorithms. Phys. D Nonlinear Phenom. 1992, 60, 259–268. [Google Scholar] [CrossRef]
- Zhang, Z.; Liu, L.; Shen, F.; Shen, H.T.; Shao, L. Binary Multi-View Clustering. IEEE Trans. Pattern Anal. Mach. Intell. 2019, 41, 1774–1782. [Google Scholar] [CrossRef] [PubMed]
Publisher’s Note: MDPI stays neutral with regard to jurisdictional claims in published maps and institutional affiliations. |
© 2021 by the authors. Licensee MDPI, Basel, Switzerland. This article is an open access article distributed under the terms and conditions of the Creative Commons Attribution (CC BY) license (http://creativecommons.org/licenses/by/4.0/).


