
Multi-Location External Workload Profile in Women’s Basketball Players. A Case Study at the Semiprofessional-Level

 ,
, 
 and
and 
Abstract
:1. Introduction
2. Materials and Methods
2.1. Design
2.2. Participants
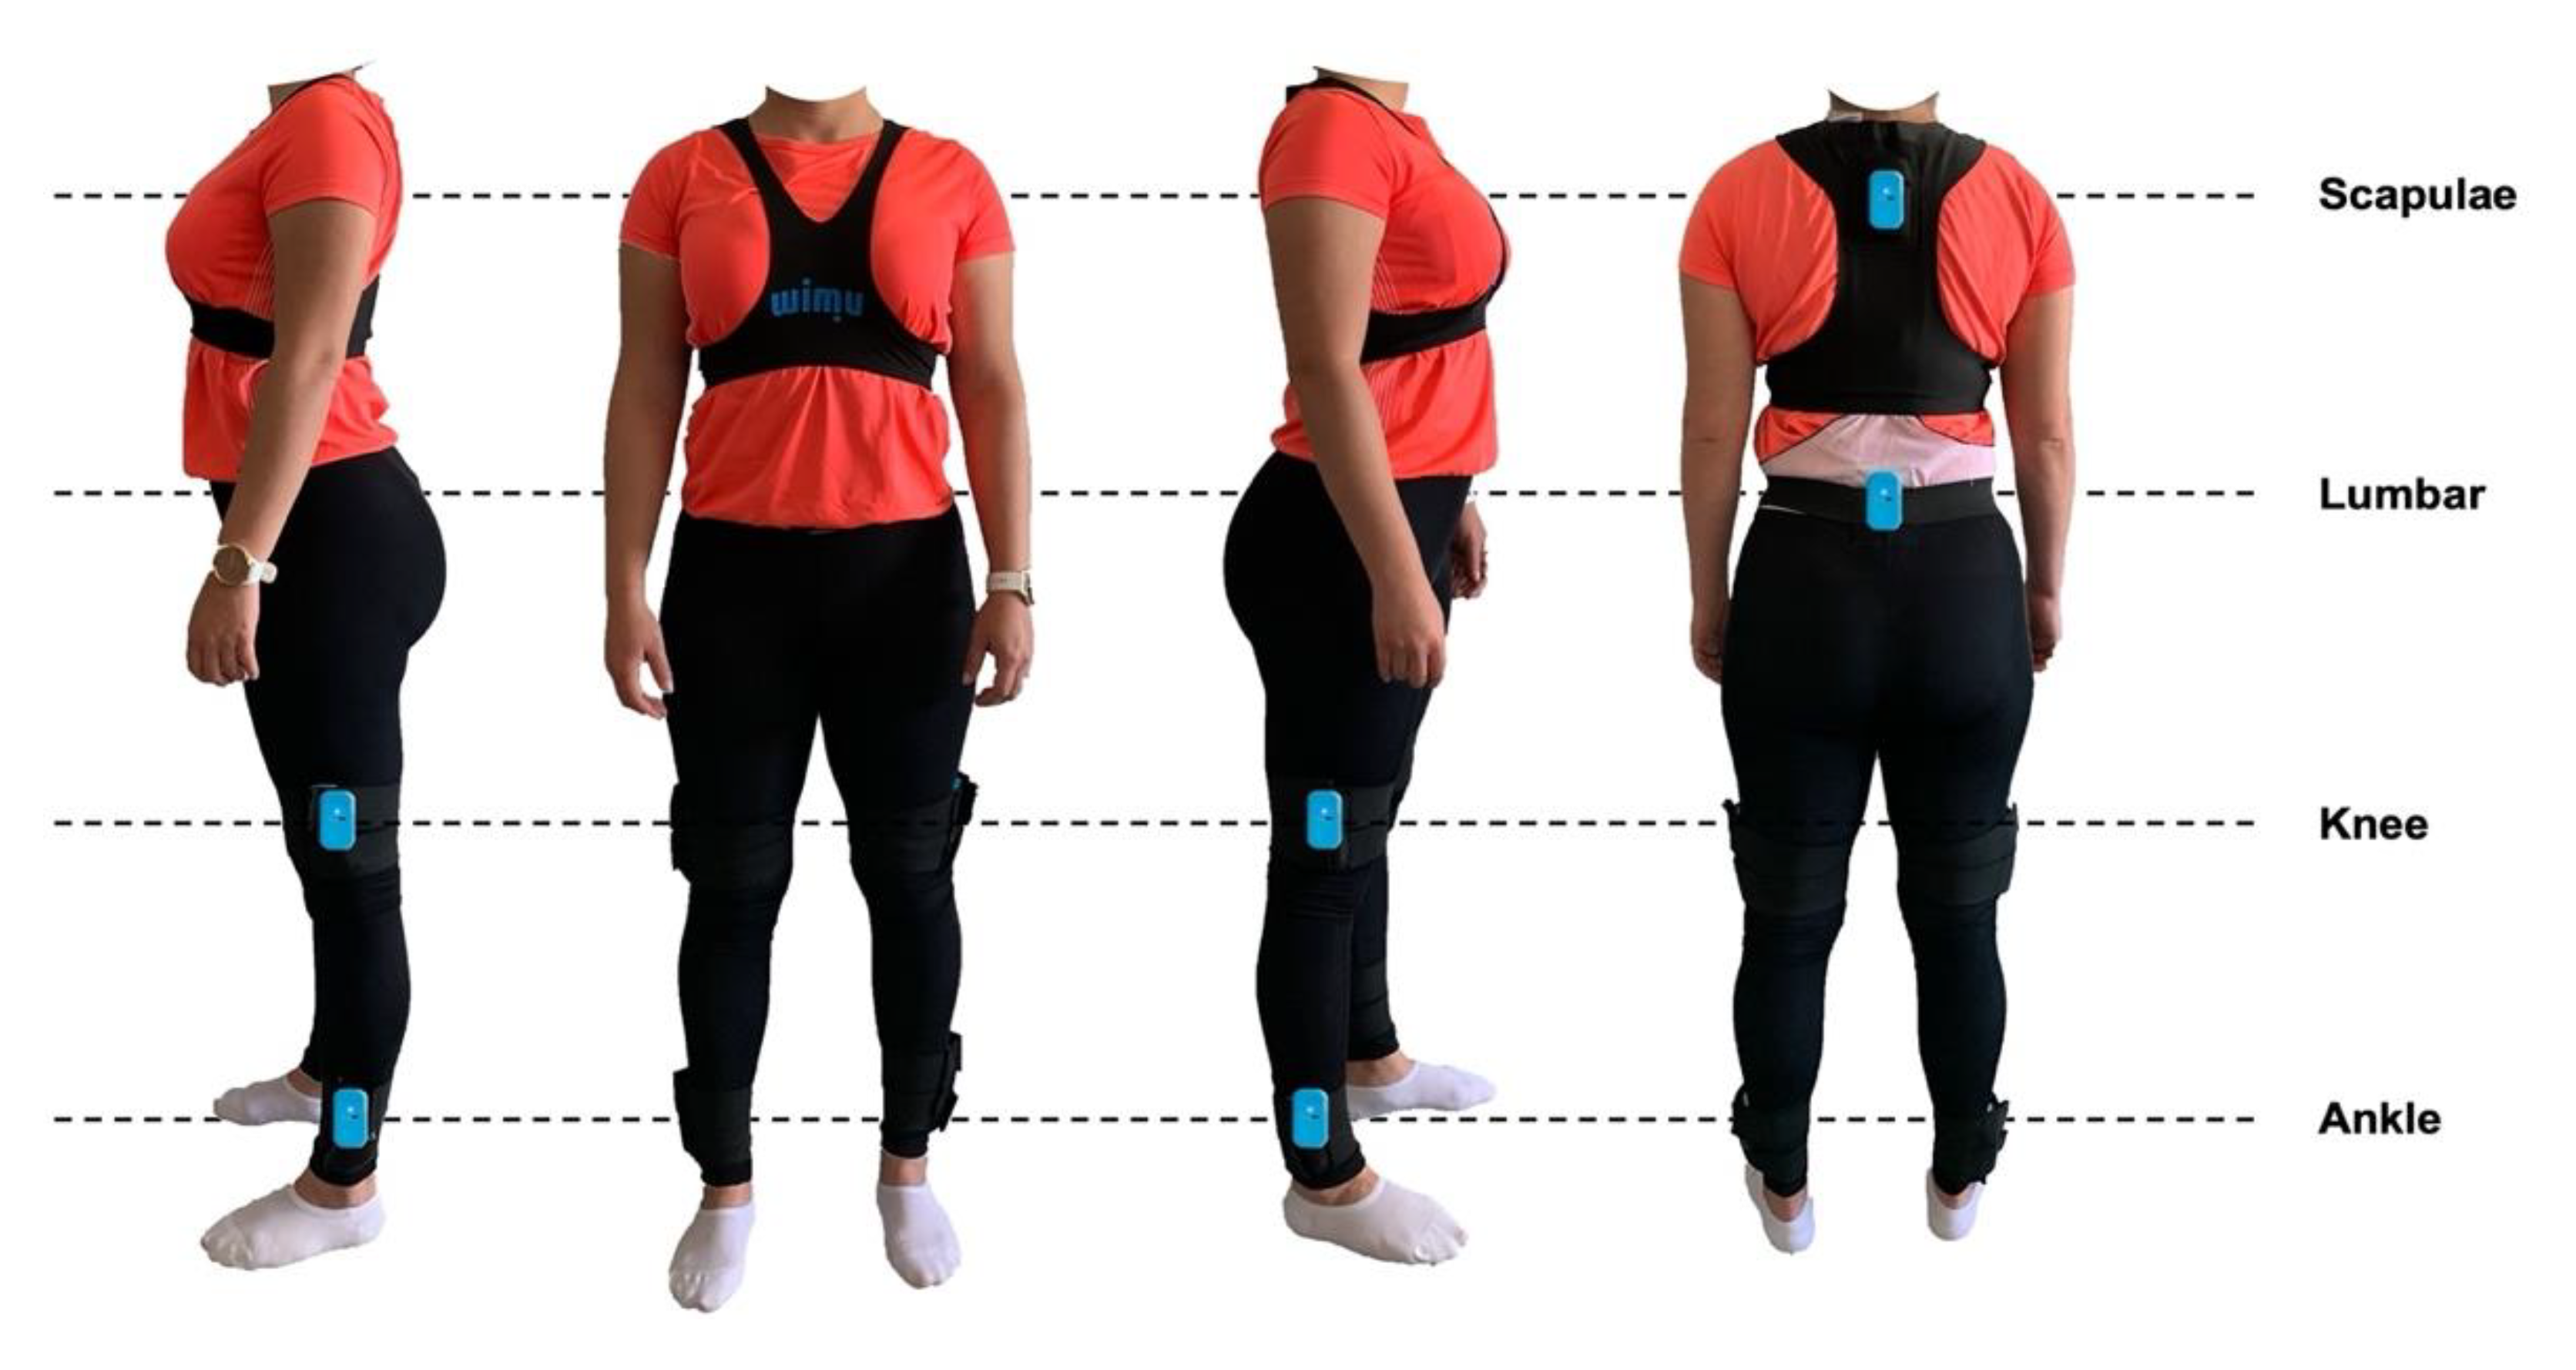
2.3. Procedures
2.4. Statistical Analysis
3. Results
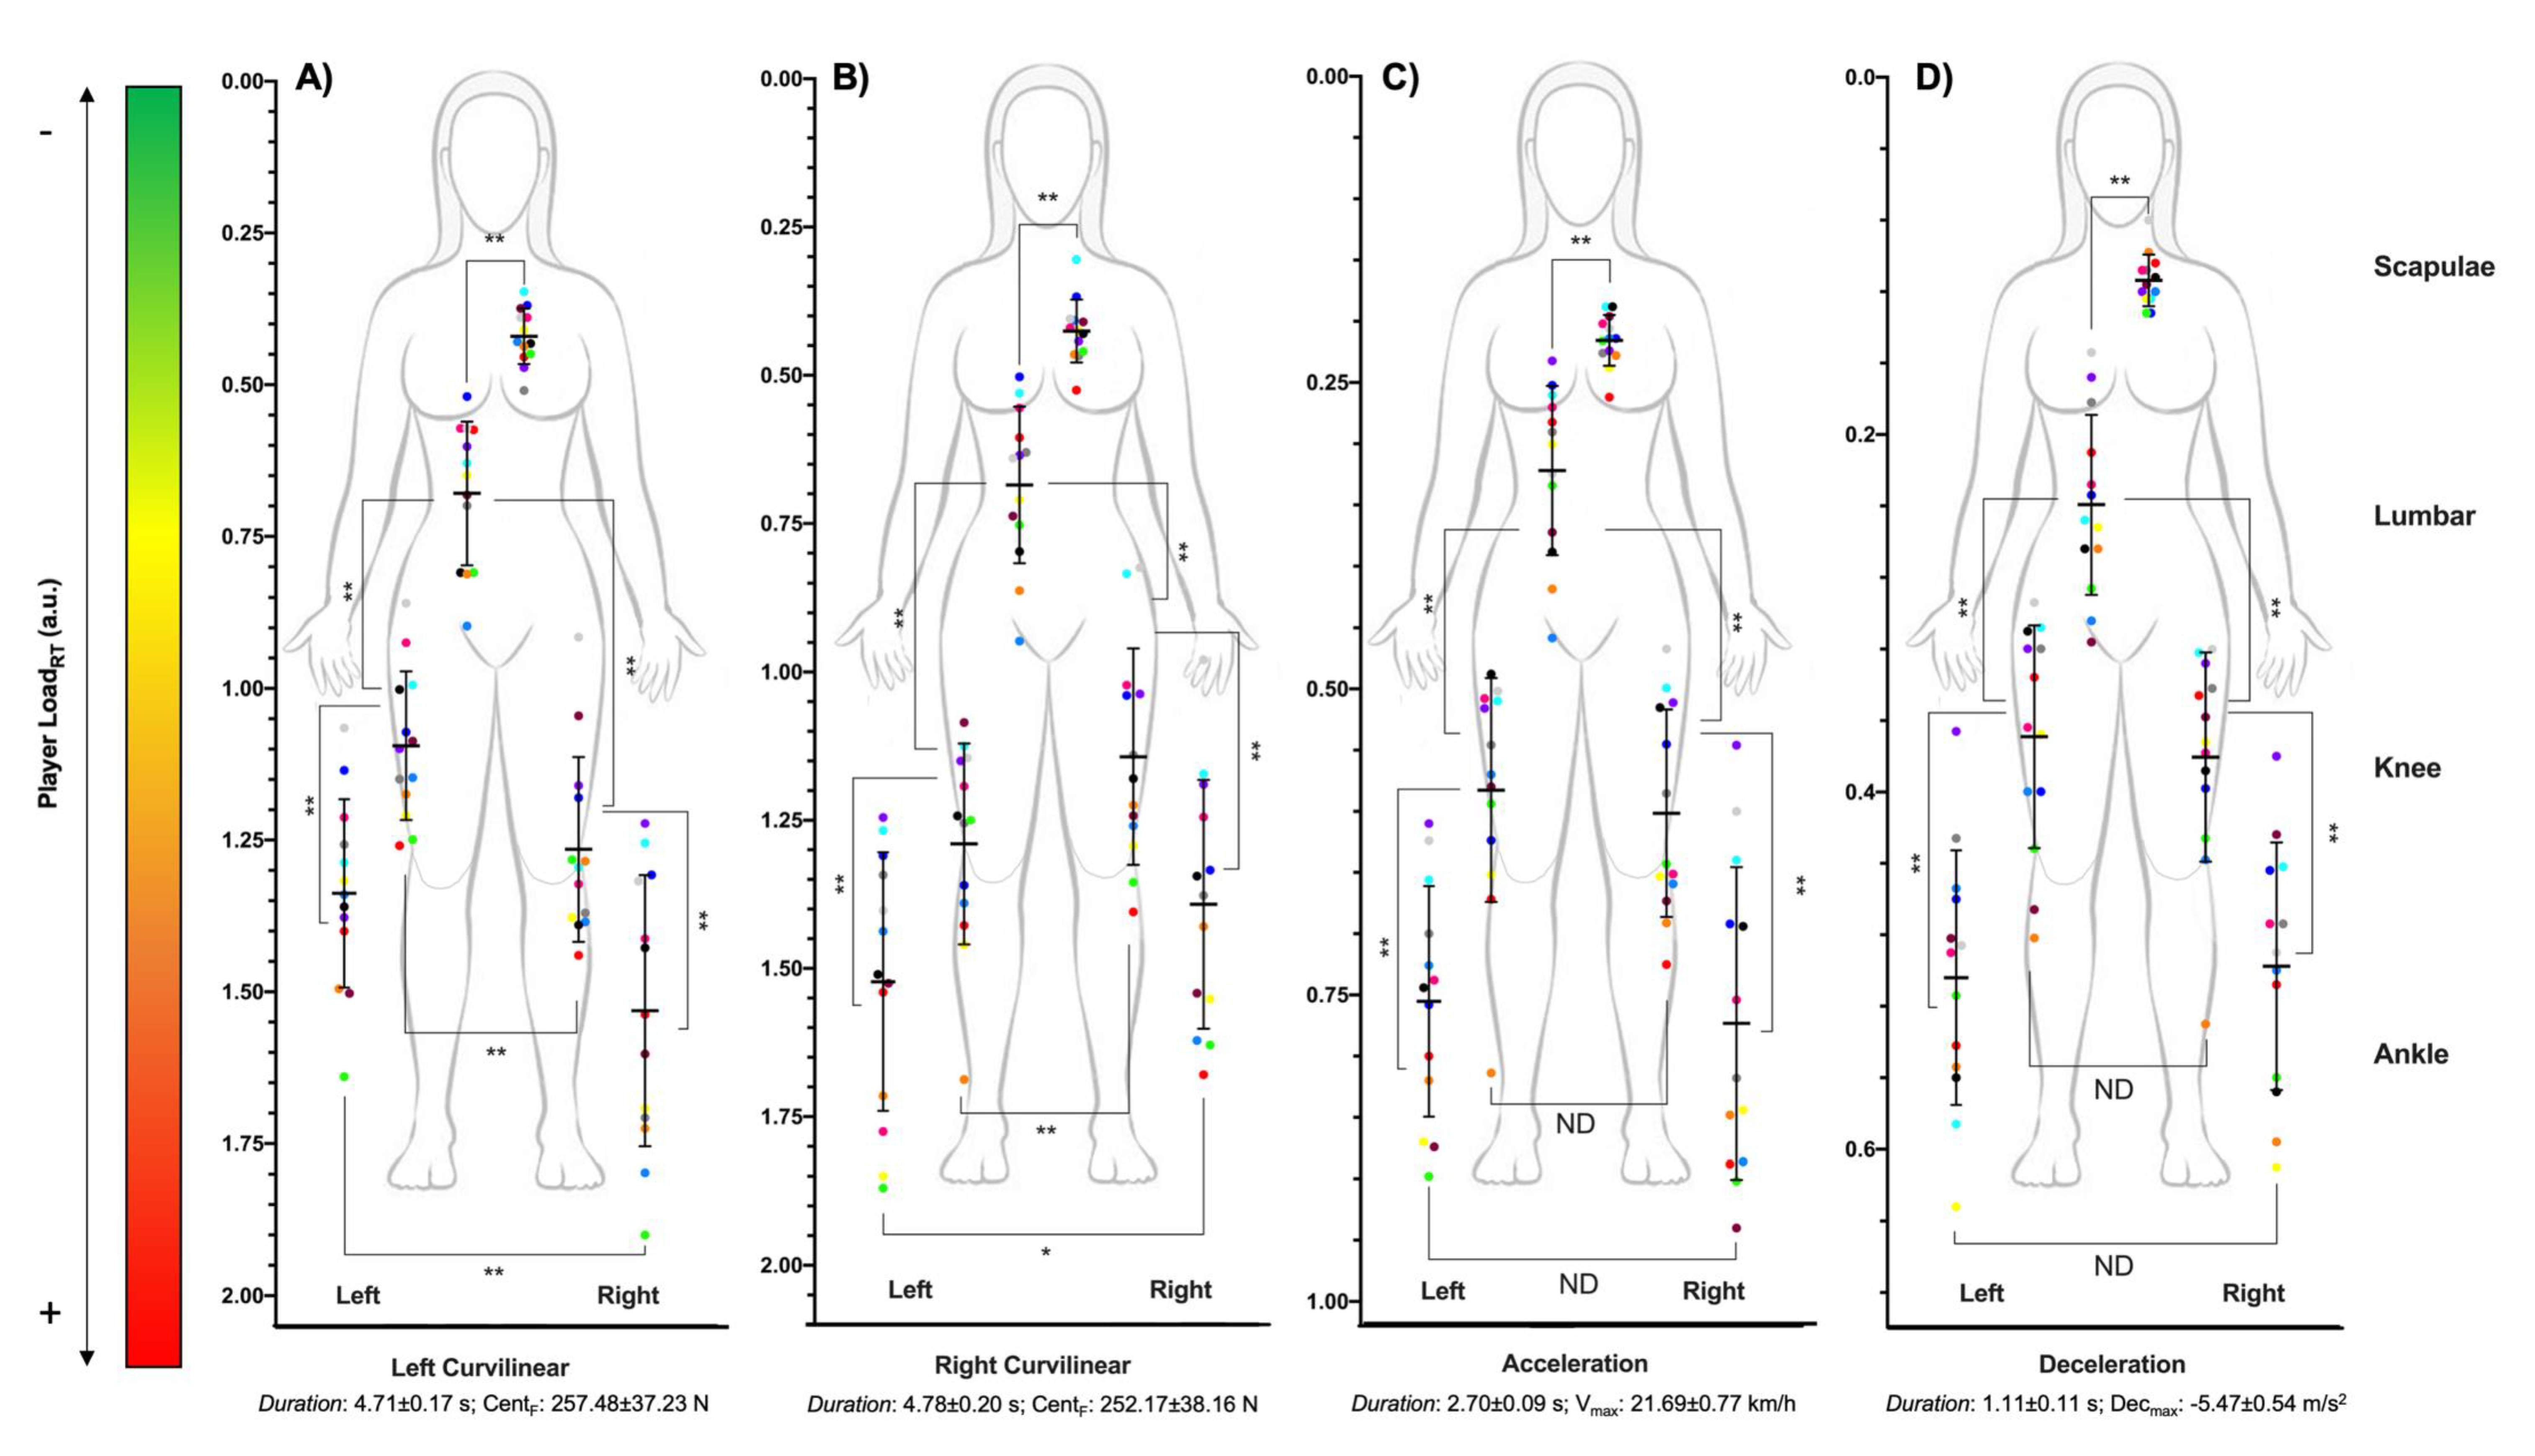
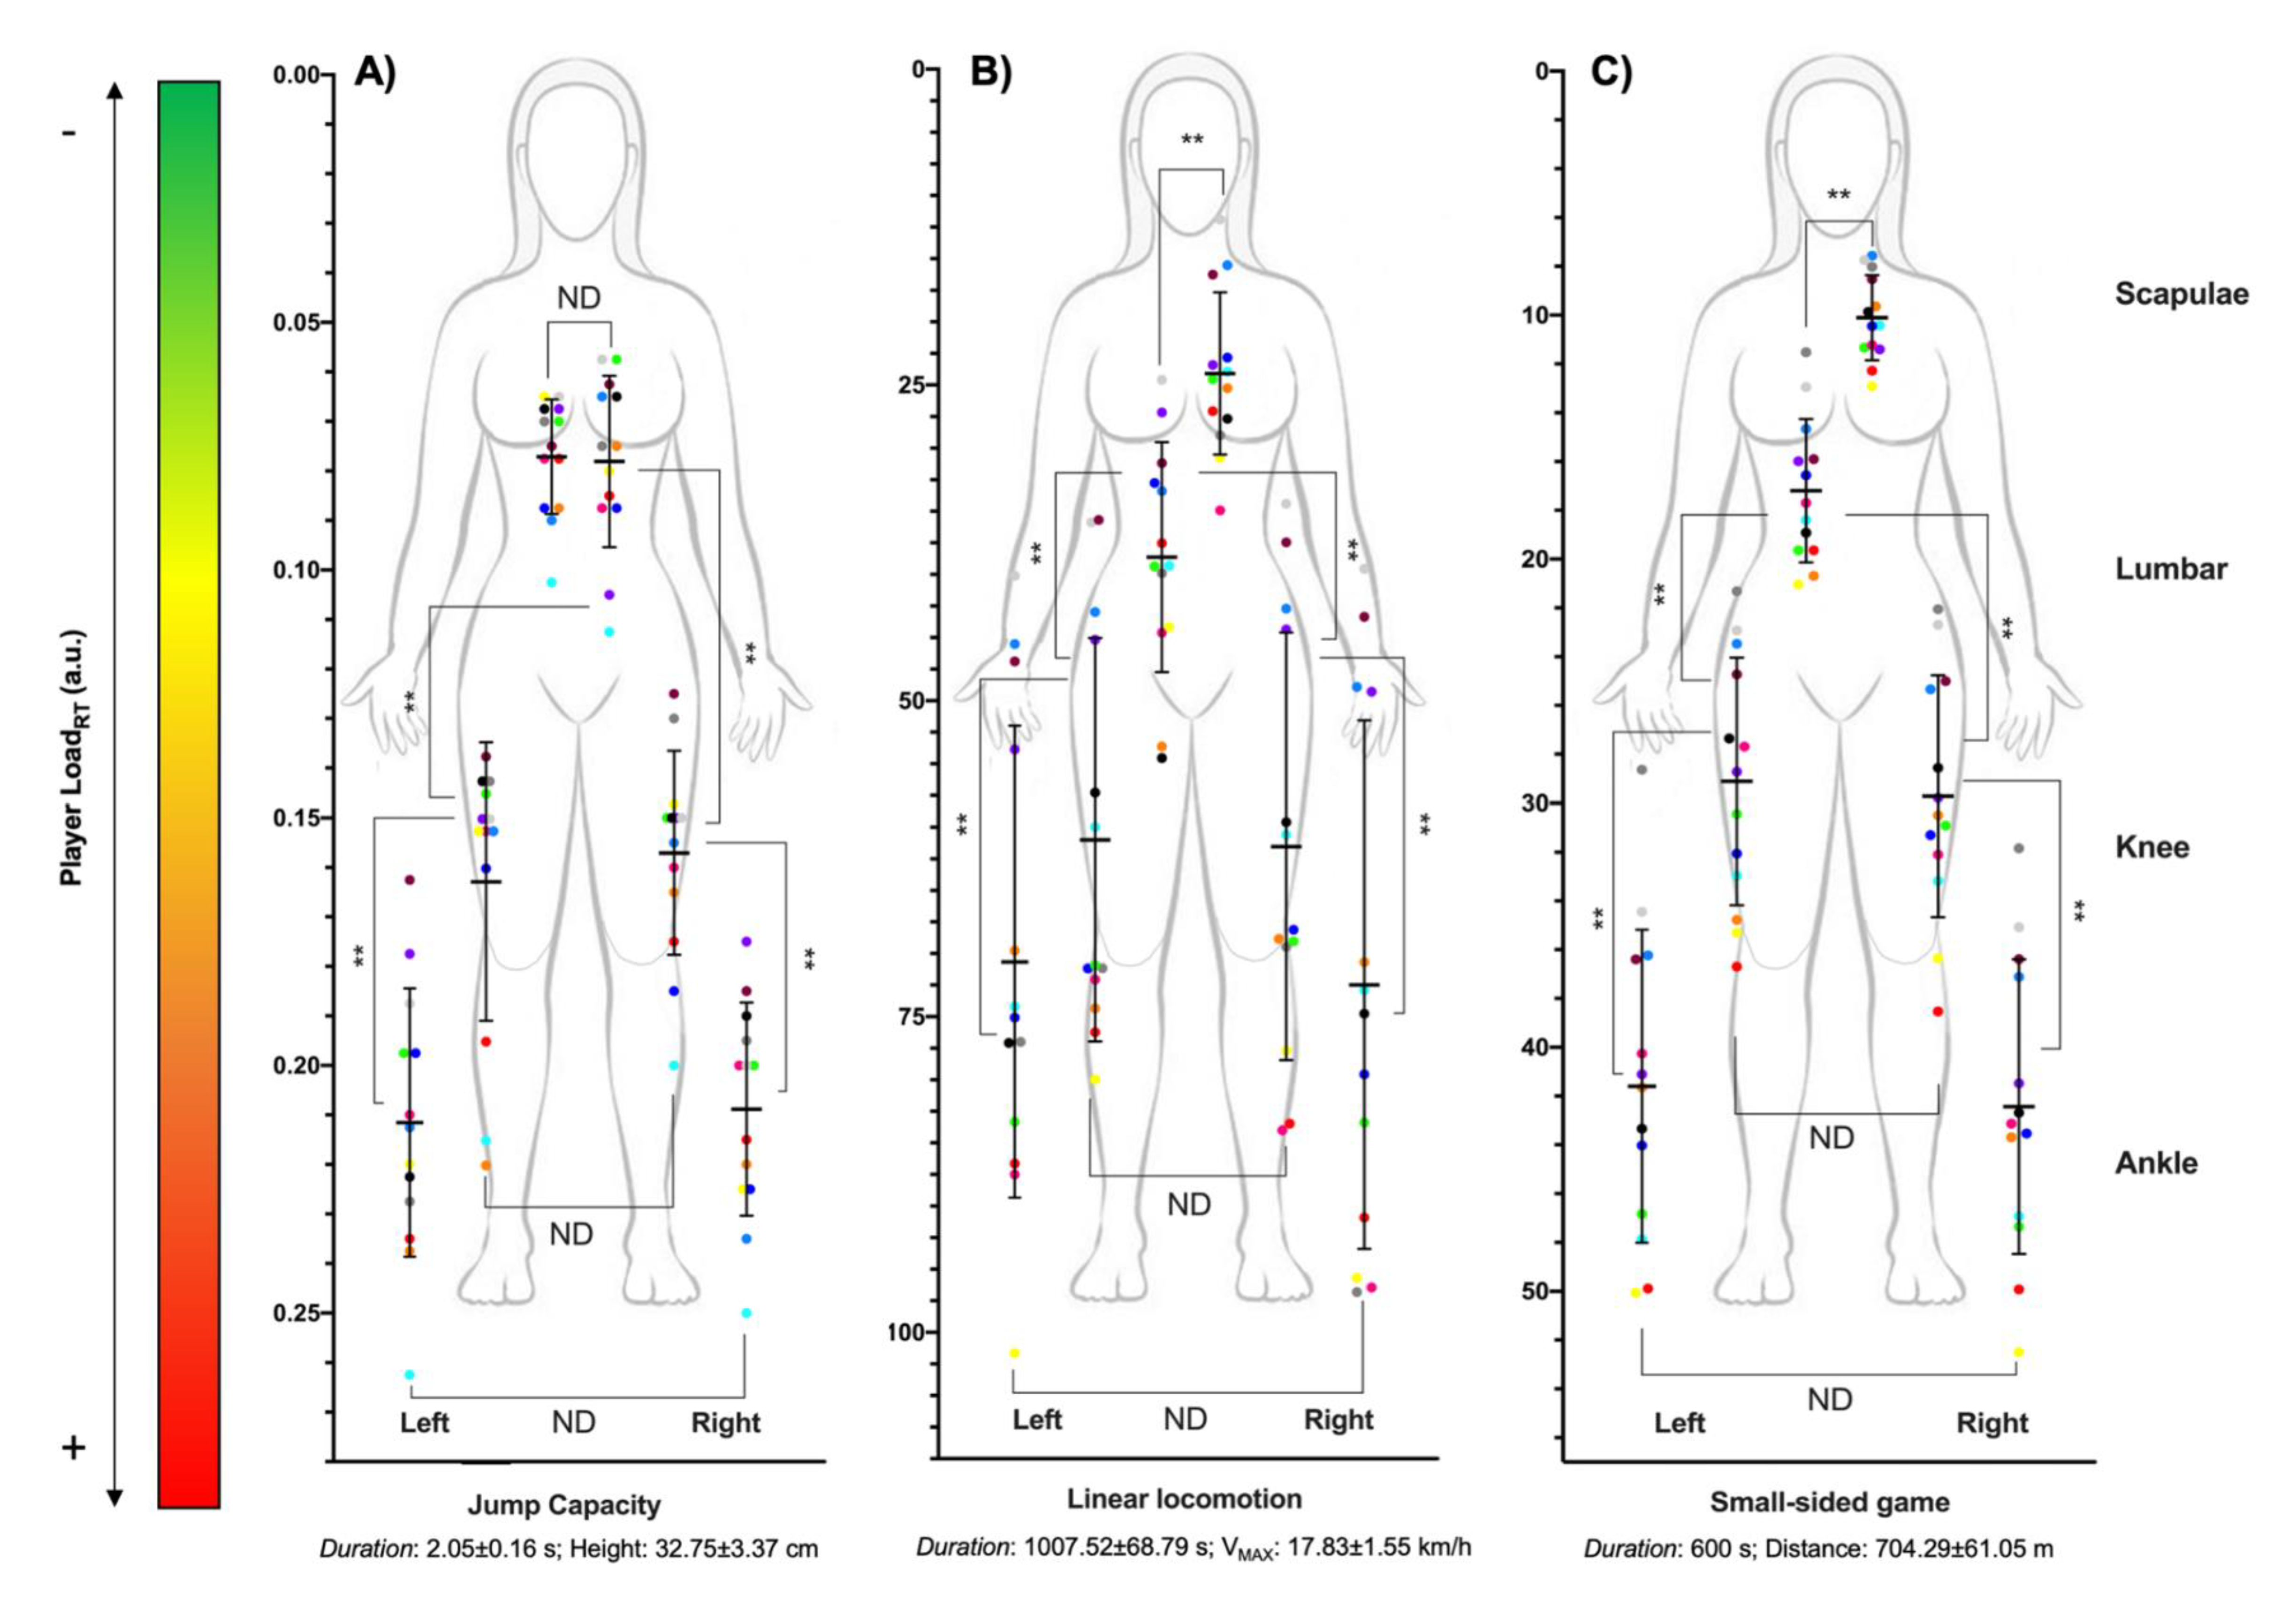
3.1. Multi-Location External Workload Profile
3.2. Vertical and Horizontal Differences
4. Discussion
5. Conclusions
Author Contributions
Funding
Institutional Review Board Statement
Informed Consent Statement
Data Availability Statement
Conflicts of Interest
References
- Hoffman, J.; Maresh, C. Physiology of basketball. In Exercise and Sport Science; Garrett, W.E., Jr., Kirkendall, D.T., Eds.; Lippincott Williams & Wilkins: Philadelphia, PA, USA, 2000; pp. 733–744. [Google Scholar]
- Ministerio de Cultura y Deporte, Gobierno de España. Anuario de Estadísticas Deportivas 2020, 1st ed.; Secretaría General Técnica, Subdirección General de Atención al ciudadano, Documentación y Publicaciones: Madrid, Spain, 2020. [Google Scholar]
- Reina, M.; García-Rubio, J.; Ibáñez, S.J. Training and competition load in female basketball: A systematic review. Int. J. Environ. Res. Public Health 2020, 17, 2639. [Google Scholar] [CrossRef] [Green Version]
- Ziv, G.; Lidor, R. Physical attributes, physiological characteristics, on-court performances and nutritional strategies of female and male basketball players. Sports Med. Auckl. N. Z. 2009, 39, 547–568. [Google Scholar] [CrossRef]
- Ransdell, L.B.; Murray, T.; Gao, Y.; Jones, P.; Bycura, D. A 4-year profile of game demands in Elite Women’s Division I college basketball. J. Strength Cond. Res. 2020, 34, 632–638. [Google Scholar] [CrossRef]
- Reina, M.; García-Rubio, J.; Pino-Ortega, J.; Ibáñez, S.J. The acceleration and deceleration profiles of U-18 women’s basketball players during competitive matches. Sports 2019, 7, 165. [Google Scholar] [CrossRef] [Green Version]
- Stojanović, E.; Stojiljković, N.; Scanlan, A.T.; Dalbo, V.J.; Berkelmans, D.M.; Milanović, Z. The activity demands and physiological responses encountered during basketball match-play: A systematic review. Sports Med. 2018, 48, 111–135. [Google Scholar] [CrossRef]
- Fox, J.L.; Scanlan, A.T.; Stanton, R. A review of player monitoring approaches in basketball: Current trends and future directions. J. Strength Cond. Res. 2017, 31, 2021–2029. [Google Scholar] [CrossRef] [PubMed]
- Gómez-Carmona, C.D.; Bastida-Castillo, A.; Ibáñez, S.J.; Pino-Ortega, J. Accelerometry as a method for external workload monitoring in invasion team sports. A systematic review. PLoS ONE 2020, 15, e0236643. [Google Scholar] [CrossRef]
- Gastin, P.B.; Hunkin, S.L.; Fahrner, B.; Robertson, S. Deceleration, acceleration, and impacts are strong contributors to muscle damage in professional Australian football. J. Strength Cond. Res. 2019, 10. [Google Scholar] [CrossRef]
- Bowen, L.; Gross, A.S.; Gimpel, M.; Li, F.-X. Accumulated workloads and the acute:Chronic workload ratio relate to injury risk in elite youth football players. Br. J. Sports Med. 2017, 51, 452–459. [Google Scholar] [CrossRef] [PubMed] [Green Version]
- Gabbett, T.; Jenkins, D.; Abernethy, B. Physical collisions and injury in professional rugby league match-play. J. Sci. Med. Sport 2011, 14, 210–215. [Google Scholar] [CrossRef] [PubMed]
- Nedergaard, N.J.; Robinson, M.A.; Eusterwiemann, E.; Drust, B.; Lisboa, P.J.; Vanrenterghem, J. The relationship between whole-body external loading and body-worn accelerometry during team-sport movements. Int. J. Sports Physiol. Perform. 2017, 12, 18–26. [Google Scholar] [CrossRef] [Green Version]
- Gómez-Carmona, C.D.; Bastida-Castillo, A.; Moreno-Pérez, V.; Ibáñez, S.J.; Pino-Ortega, J. Multi-location external workload profile in U-18 soccer players. [Perfil Multi-Ubicación de Carga Externa En Jugadores de Fútbol Sub-18]. RICYDE Rev. Int. Cienc. Deporte 2021, 17, 124–139. [Google Scholar] [CrossRef]
- Deitch, J.R.; Starkey, C.; Walters, S.L.; Moseley, J.B. Injury risk in professional basketball players: A comparison of women’s national basketball association and national basketball association athletes. Am. J. Sports Med. 2006, 34, 1077–1083. [Google Scholar] [CrossRef] [PubMed]
- Gómez-Carmona, C.D.; Pino-Ortega, J.; Ibáñez, S.J. Design and validity of a field test battery for assessing multi-location external load profile in invasion team sports. E-Balonmano com. 2020, 16, 23–48. [Google Scholar]
- Chambers, R.; Gabbett, T.J.; Cole, M.H.; Beard, A. The Use of wearable microsensors to quantify sport-specific movements. Sports Med. 2015, 45, 1065–1081. [Google Scholar] [CrossRef]
- Jafari, M.; Roshanian, J. Optimal redundant sensor configuration for accuracy and reliability increasing in space inertial navigation systems. J. Navig. 2013, 66, 199–208. [Google Scholar] [CrossRef] [Green Version]
- Gómez-Carmona, C.D.; Bastida-Castillo, A.; García-Rubio, J.; Ibáñez, S.J.; Pino-Ortega, J. Static and dynamic reliability of WIMU PROTM accelerometers according to anatomical placement. Proc. Inst. Mech. Eng. Part P J. Sports Eng. Technol. 2019, 233, 238–248. [Google Scholar] [CrossRef]
- Gomez-Carmona, C.D.; Bastida-Castillo, A.; González-Custodio, A.; Olcina, G.; Pino-Ortega, J. Using an inertial device (WIMU PROTM) to quantify neuromuscular load in running: Reliability, convergent validity and the influence of type of surface and device location. J. Strength Cond. Res. 2020, 34, 365–373. [Google Scholar] [CrossRef]
- Bastida Castillo, A.; Gómez Carmona, C.D.; Pino Ortega, J.; de la Cruz Sánchez, E. Validity of an inertial system to measure sprint time and sport task time: A proposal for the integration of photocells in an inertial system. Int. J. Perform. Anal. Sport 2017, 17, 600–608. [Google Scholar] [CrossRef]
- Cohen, J. Chapter 8. The analysis of variance and covariance. In Statistical Power Analysis for the Behavioral Sciences; Routledge Academic: New York, NY, USA, 1988; pp. 273–406. [Google Scholar]
- Akenhead, R.; Nassis, G.P. Training load and player monitoring in high-level football: Current practice and perceptions. Int. J. Sports Physiol. Perform. 2016, 11, 587–593. [Google Scholar] [CrossRef]
- Vanrenterghem, J.; Nedergaard, N.J.; Robinson, M.A.; Drust, B. Training load monitoring in team sports: A novel framework separating physiological and biomechanical load-adaptation pathways. Sports Med. 2017, 47, 2135–2142. [Google Scholar] [CrossRef] [PubMed]
- Hibbs, A.E.; Thompson, K.G.; French, D.; Wrigley, A.; Spears, I. Optimizing performance by improving core stability and core strength. Sports Med. 2008, 38, 995–1008. [Google Scholar] [CrossRef]
- Moran, J.; Ramirez-Campillo, R.; Liew, B.; Chaabene, H.; Behm, D.G.; García-Hermoso, A.; Izquierdo, M.; Granacher, U. Effects of bilateral and unilateral resistance training on horizontally orientated movement performance: A systematic review and meta-analysis. Sports Med. 2021, 51, 225–242. [Google Scholar] [CrossRef]
- Bezodis, N.E.; North, J.S.; Razavet, J.L. Alterations to the orientation of the ground reaction force vector affect sprint acceleration performance in team sports athletes. J. Sports Sci. 2017, 35, 1817–1824. [Google Scholar] [CrossRef] [Green Version]
- Hall, S. Basic Biomechanics, 7th ed.; McGraw-Hill: Sydney, Australia, 2014. [Google Scholar]
- Nimphius, S.; Callaghan, S.J.; Bezodis, N.E.; Lockie, R.G. Change of direction and agility tests: Challenging our current measures of performance. Strength Cond. J. 2018, 40, 26–38. [Google Scholar] [CrossRef] [Green Version]
- Courtine, G.; Schieppati, M. Human Walking along a Curved Path. II. Gait Features and EMG Patterns. Eur. J. Neurosci. 2003, 18, 191–205. [Google Scholar] [CrossRef] [PubMed]
- Mancha-Triguero, D.; García-Rubio, J.; Ibáñez, S.J. Batería de test de campo para evaluar la condición física de jugadores de baloncesto: SBAFIT. E-Balonmano Com. 2019, 15, 107–126. [Google Scholar]
- Bartlett, J.D.; O’Connor, F.; Pitchford, N.; Torres-Ronda, L.; Robertson, S.J. Relationships Between internal and external training load in team-sport athletes: Evidence for an individualized approach. Int. J. Sports Physiol. Perform. 2017, 12, 230–234. [Google Scholar] [CrossRef]
- Blanch, P.; Gabbett, T.J. Has the athlete trained enough to return to play safely? The Acute: Chronic workload ratio permits clinicians to quantify a player’s risk of subsequent injury. Br. J. Sports Med. 2016, 50, 471–475. [Google Scholar] [CrossRef] [PubMed]
- Shrier, I.; Safai, P.; Charland, L. Return to play following injury: Whose decision should it be? Br. J. Sports Med. 2014, 48, 394–401. [Google Scholar] [CrossRef] [PubMed]
- Suzuki, H.; Omori, G.; Uematsu, D.; Nishino, K.; Endo, N. Hip strength and pelvis kinematic asymmetries and knee injury and osteoarthritis outcome score in competitive female basketball players after anterior cruciate ligament reconstruction: A pilot study. J. Athl. Train. 2017, 52, S161. [Google Scholar]
- Smith, H.C.; Vacek, P.; Johnson, R.J.; Slauterbeck, J.R.; Hashemi, J.; Shultz, S.; Beynnon, B.D. Risk factors for anterior cruciate ligament injury: A review of the literature—Part 1: Neuromuscular and anatomic risk. Sports Health 2012, 4, 69–78. [Google Scholar] [CrossRef] [Green Version]
- Lin, C.Y.; Casey, E.; Herman, D.C.; Katz, N.; Tenforde, A.S. Sex differences in common sports injuries. PM&R 2018, 10, 1073–1082. [Google Scholar] [CrossRef]
- Balachandar, V.; Marciniak, J.-L.; Wall, O.; Balachandar, C. Effects of the menstrual cycle on lower-limb biomechanics, neuromuscular control, and anterior cruciate ligament injury risk: A systematic review. Muscles Ligaments Tendons J. 2017, 7, 136. [Google Scholar] [CrossRef]
- Mendiguchia, J.; Ford, K.R.; Quatman, C.E.; Alentorn-Geli, E.; Hewett, T.E. Sex differences in proximal control of the knee joint. Sports Med. 2011, 41, 541–557. [Google Scholar] [CrossRef] [Green Version]


| Guard (n = 3) | Forward (n = 5) | Center (n = 5) | Total (n = 13) | |
|---|---|---|---|---|
| Age (years) | 17.33 ± 0.58 | 17.81 ± 2.66 | 20.32 ± 3.57 | 18.49 ± 2.27 |
| Height (m) | 1.65 ± 0.05 | 1.70 ± 0.05 | 1.81 ± 0.06 | 1.73 ± 0.08 |
| Weight (kg) | 59.33 ± 8.13 | 64.26 ± 9.38 | 72.66 ± 11.46 | 66.64 ± 10.94 |
| BMI (kg/m2) | 21.80 ± 3.87 | 22.30 ± 3.26 | 22.41 ± 2.96 | 22.25 ± 3.15 |
| Fat mass (%) | 23.60 ± 7.86 | 26.29 ± 3.97 | 28.31 ± 2.80 | 26.72 ± 4.68 |
| Muscle mass (%) | 72.56 ± 7.52 | 69.98 ± 3.77 | 68.05 ± 2.68 | 69.58 ± 4.47 |
| Test | Statistics | Vertical Differences | Horizontal Differences | |||||
|---|---|---|---|---|---|---|---|---|
| Scapulae 1 vs. Lumbar 2 | Lumbar 1 vs. Right Knee 2 | Lumbar 1 vs. Left Knee 2 | Right Knee 1 vs. Right Ankle 2 | Left Knee 1 vs. Left Ankle 2 | Right 1 vs. Left 2 Knee | Right 1 vs. Left 2 Ankle | ||
| Left curvilinear | t (p) | 8.38 (<0.01) | 13.60 (<0.01) | 10.97 (<0.01) | 4.47 (<0.01) | 7.58 (<0.01) | 4.53 (<0.01) | 4.92 (<0.01) |
| ηp2, ES | 0.85 high | 0.94 high | 0.91 high | 0.62 high | 0.83 high | 0.63 high | 0.56 high | |
| %diff, 1-e-2 | 38.06 0-0-13 | 46.11 0-0-13 | 37.76 0-0-13 | 17.38 0-0-13 | 18.11 0-0-13 | 13.40 12-1-0 | 12.65 11-1-1 | |
| Right curvilinear | t (p) | 7.35 (<0.01) | 10.41 (<0.01) | 13.15 (<0.01) | 13.30 (<0.01) | 3.87 (<0.01) | 3.05 (<0.01) | 2.16 (0.04) |
| ηp2, ES | 0.82 high | 0.90 high | 0.94 high | 0.94 high | 0.56 high | 0.44 high | 0.33 high | |
| %diff, 1-e-2 | 37.62 0-0-13 | 40.18 0-0-13 | 46.90 0-0-13 | 17.94 0-0-13 | 15.28 0-1-12 | 11.39 2-1-10 | 8.53 2-3-8 | |
| Acceleration | t (p) | 5.08 (<0.01) | 11.44 (<0.01) | 9.64 (<0.01) | 9.48 (<0.01) | 7.36 (<0.01) | 0.97 (0.35) | 0.91 (0.38) |
| ηp2, ES | 0.68 high | 0.92 high | 0.89 high | 0.88 high | 0.82 high | <0.01 | <0.01 | |
| %diff, 1-e-2 | 33.13 0-1-12 | 46.80 0-0-13 | 45.03 0-0-13 | 22.19 0-0-13 | 22.69 0-0-13 | 3.25 6-4-3 | 2.34 4-6-3 | |
| Deceleration | t (p) | 10.04 (<0.01) | 9.76 (<0.01) | 10.55 (<0.01) | 7.15 (<0.01) | 5.31 (<0.01) | 0.95 (0.36) | 0.43 (0.67) |
| ηp2, ES | 0.89 high | 0.89 high | 0.90 high | 0.81 high | 0.70 high | <0.01 | <0.01 | |
| %diff, 1-e-2 | 52.29 0-0-13 | 37.15 0-0-13 | 35.14 0-0-13 | 23.44 0-0-13 | 26.96 0-1-12 | 2.95 3-9-1 | 1.26 4-6-3 | |
| Jump | t (p) | 0.22 (0.83) | 19.98 (<0.01) | 14.15 (<0.01) | 11.79 (<0.01) | 8.48 (<0.01) | 1.06 (0.31) | 0.64 (0.64) |
| ηp2, ES | 0.00 | 0.97 high | 0.94 high | 0.92 high | 0.86 high | <0.01 | <0.01 | |
| %diff, 1-e-2 | 1.20 1-11-1 | 49.99 0-0-13 | 53.49 0-0-13 | 24.64 0-0-13 | 23.26 0-1-12 | 3.49 3-5-5 | 1.28 4-6-3 | |
| Linear | t (p) | 7.73 (<0.01) | 6.08 (<0.01) | 6.39 (<0.01) | 5.76 (<0.01) | 4.76 (<0.01) | 0.41 (0.68) | 0.96 (0.36) |
| ηp2, ES | 0.83 high | 0.76 high | 0.77 high | 0.73 high | 0.65 high | <0.01 | <0.01 | |
| %diff, 1-e-2 | 37.67 0-0-13 | 37.21 0-0-13 | 36.66 0-0-13 | 15.12 0-0-13 | 13.68 0-0-13 | 0.85 2-10-1 | 2.52 4-7-2 | |
| Small-sided game | t (p) | 12.91 (<0.01) | 15.06 (<0.01) | 14.76 (<0.01) | 23.39 (<0.01) | 15.66 (<0.01) | 1.12 (0.28) | 2.21 (0.06) |
| ηp2, ES | 0.93 high | 0.95 high | 0.95 high | 0.98 high | 0.95 high | <0.01 | <0.01 | |
| %diff, 1-e-2 | 41.23 0-0-13 | 42.11 0-0-13 | 40.91 0-0-13 | 29.97 0-0-13 | 30.02 0-0-13 | 2.03 1-11-1 | 1.98 2-11-0 | |
Publisher’s Note: MDPI stays neutral with regard to jurisdictional claims in published maps and institutional affiliations. |
© 2021 by the authors. Licensee MDPI, Basel, Switzerland. This article is an open access article distributed under the terms and conditions of the Creative Commons Attribution (CC BY) license (https://creativecommons.org/licenses/by/4.0/).
Share and Cite
Gómez-Carmona, C.D.; Mancha-Triguero, D.; Pino-Ortega, J.; Ibáñez, S.J. Multi-Location External Workload Profile in Women’s Basketball Players. A Case Study at the Semiprofessional-Level. Sensors 2021, 21, 4277. https://doi.org/10.3390/s21134277
Gómez-Carmona CD, Mancha-Triguero D, Pino-Ortega J, Ibáñez SJ. Multi-Location External Workload Profile in Women’s Basketball Players. A Case Study at the Semiprofessional-Level. Sensors. 2021; 21(13):4277. https://doi.org/10.3390/s21134277
Chicago/Turabian StyleGómez-Carmona, Carlos D., David Mancha-Triguero, José Pino-Ortega, and Sergio J. Ibáñez. 2021. "Multi-Location External Workload Profile in Women’s Basketball Players. A Case Study at the Semiprofessional-Level" Sensors 21, no. 13: 4277. https://doi.org/10.3390/s21134277
APA StyleGómez-Carmona, C. D., Mancha-Triguero, D., Pino-Ortega, J., & Ibáñez, S. J. (2021). Multi-Location External Workload Profile in Women’s Basketball Players. A Case Study at the Semiprofessional-Level. Sensors, 21(13), 4277. https://doi.org/10.3390/s21134277