Quartz Enhanced Photoacoustic Spectroscopy Based on a Custom Quartz Tuning Fork

 , , and
Abstract
1. Introduction
1.1. Commercial Quartz Tuning Forks
1.2. Custom Quartz Tuning Forks
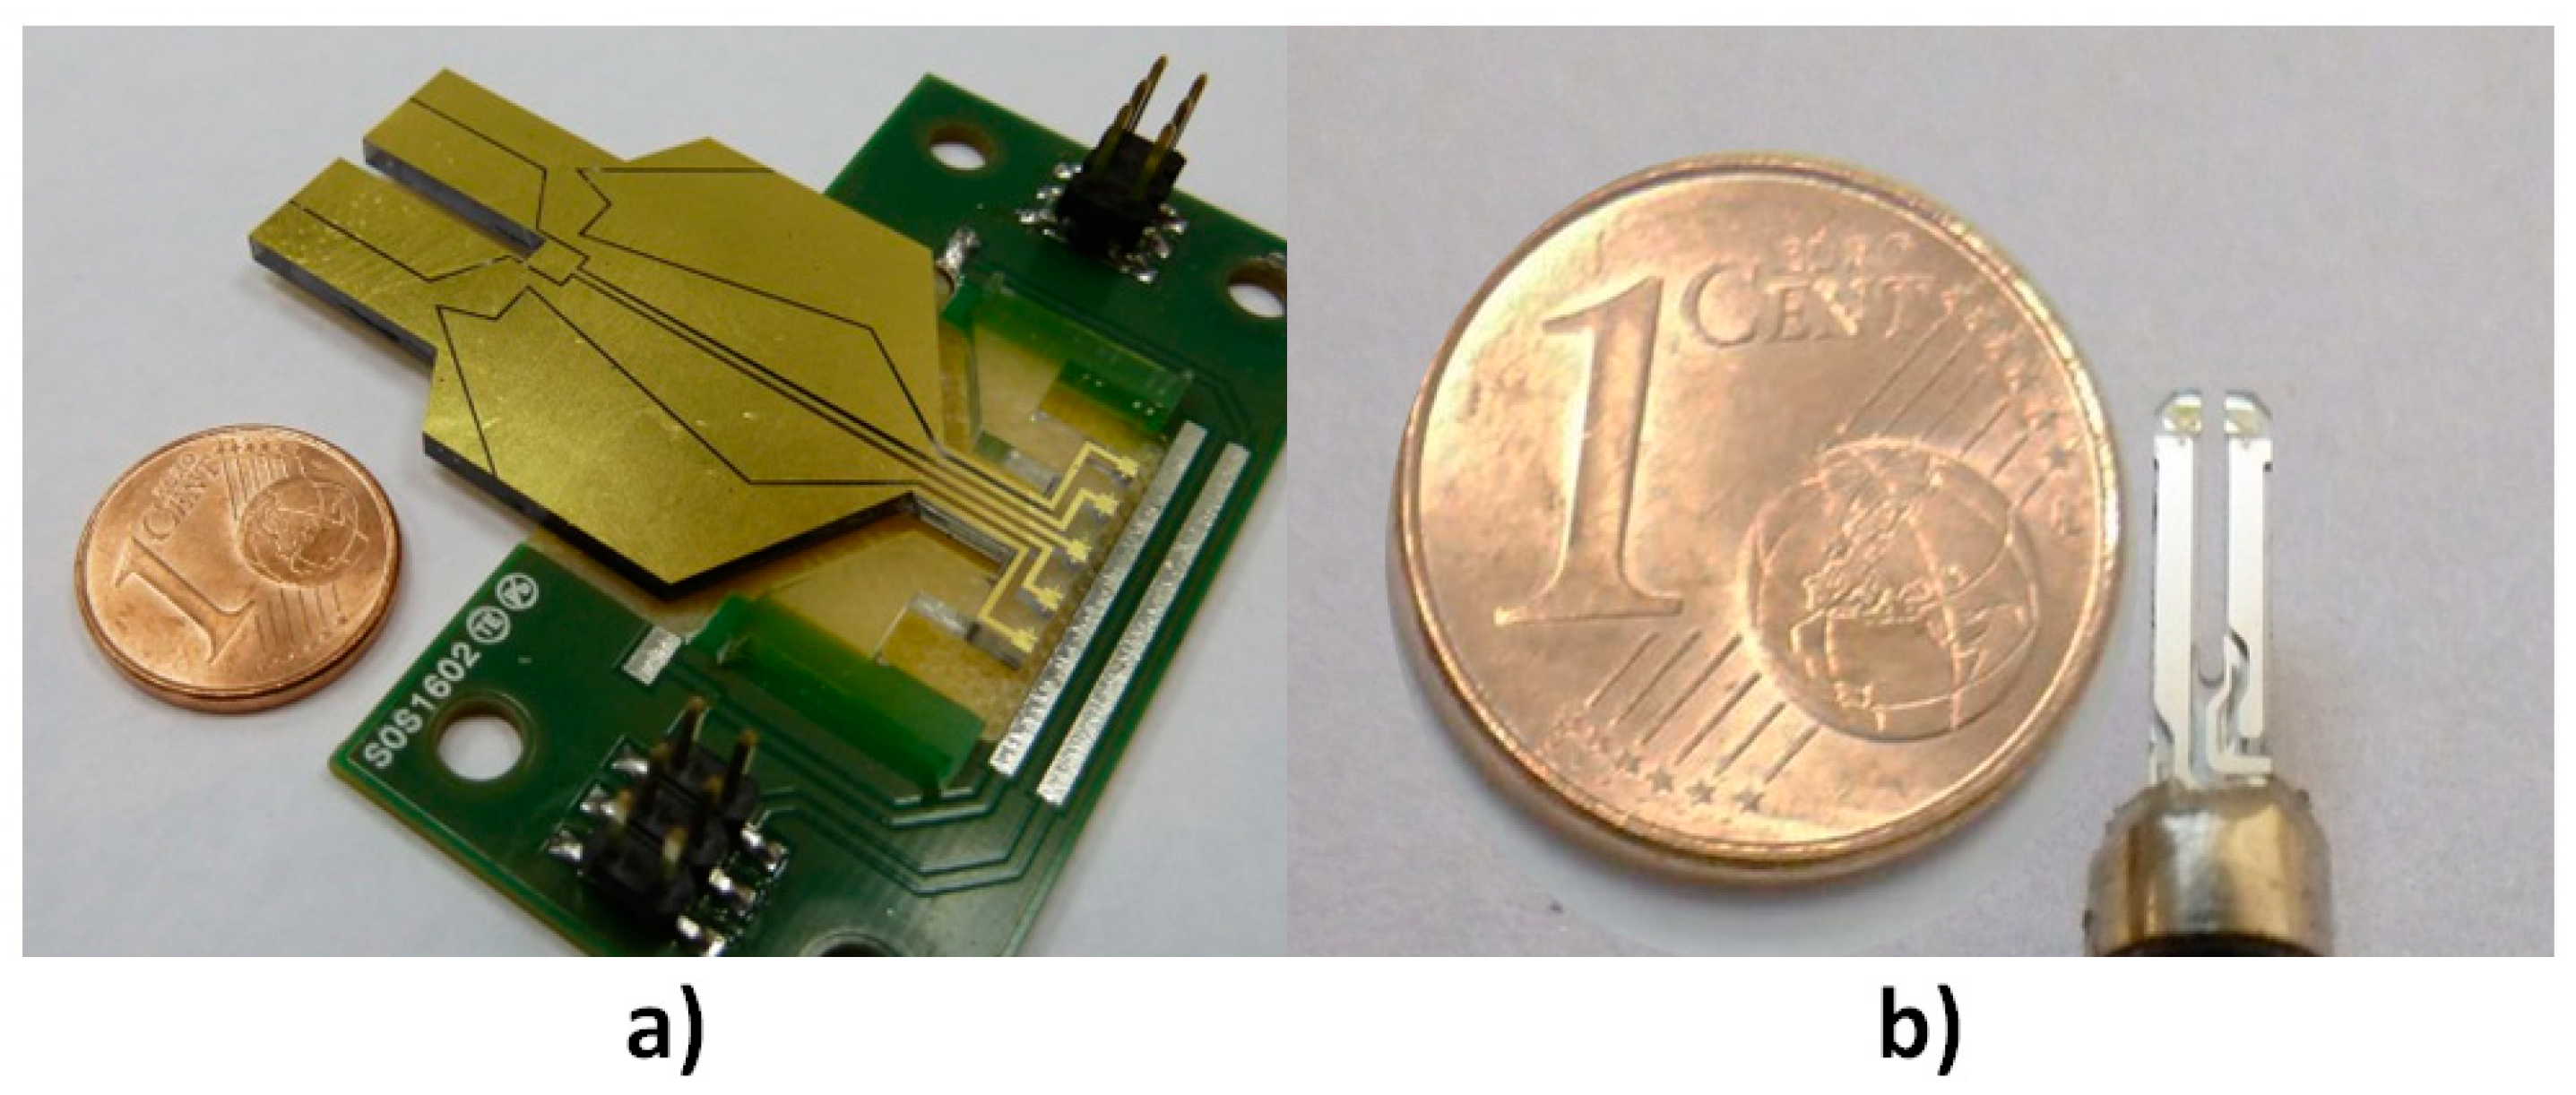
1.3. Our Custom Quartz Tuning Fork
2. Influence of Added Acoustic Devices
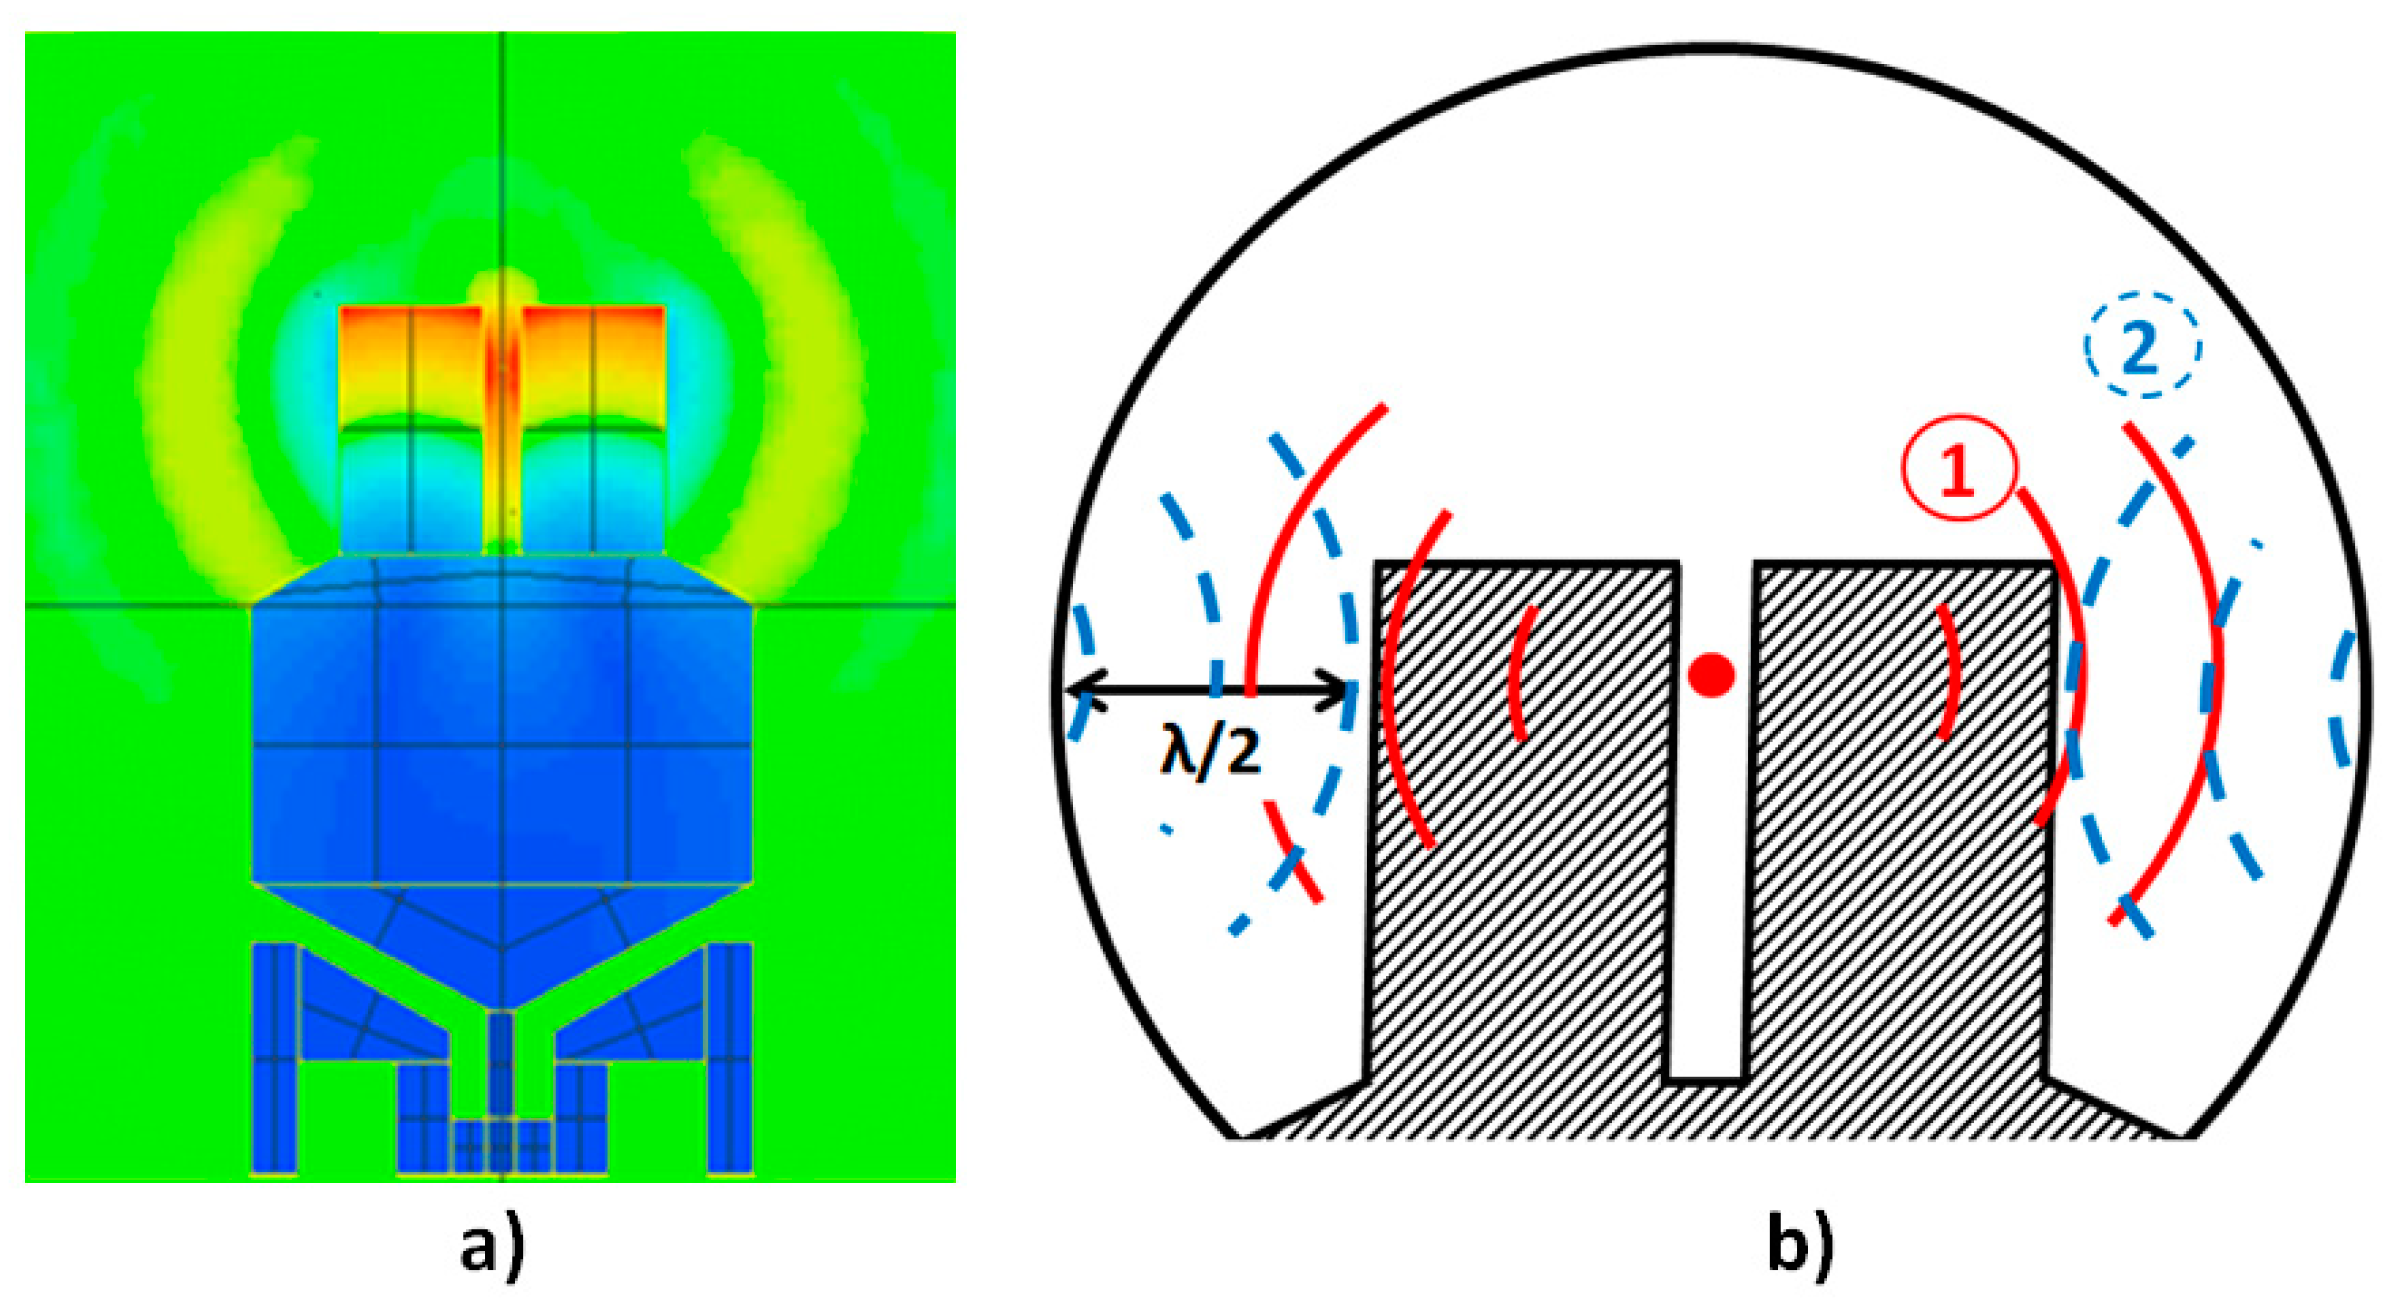
2.1. Environment Isolation by an Acoustic Cavity
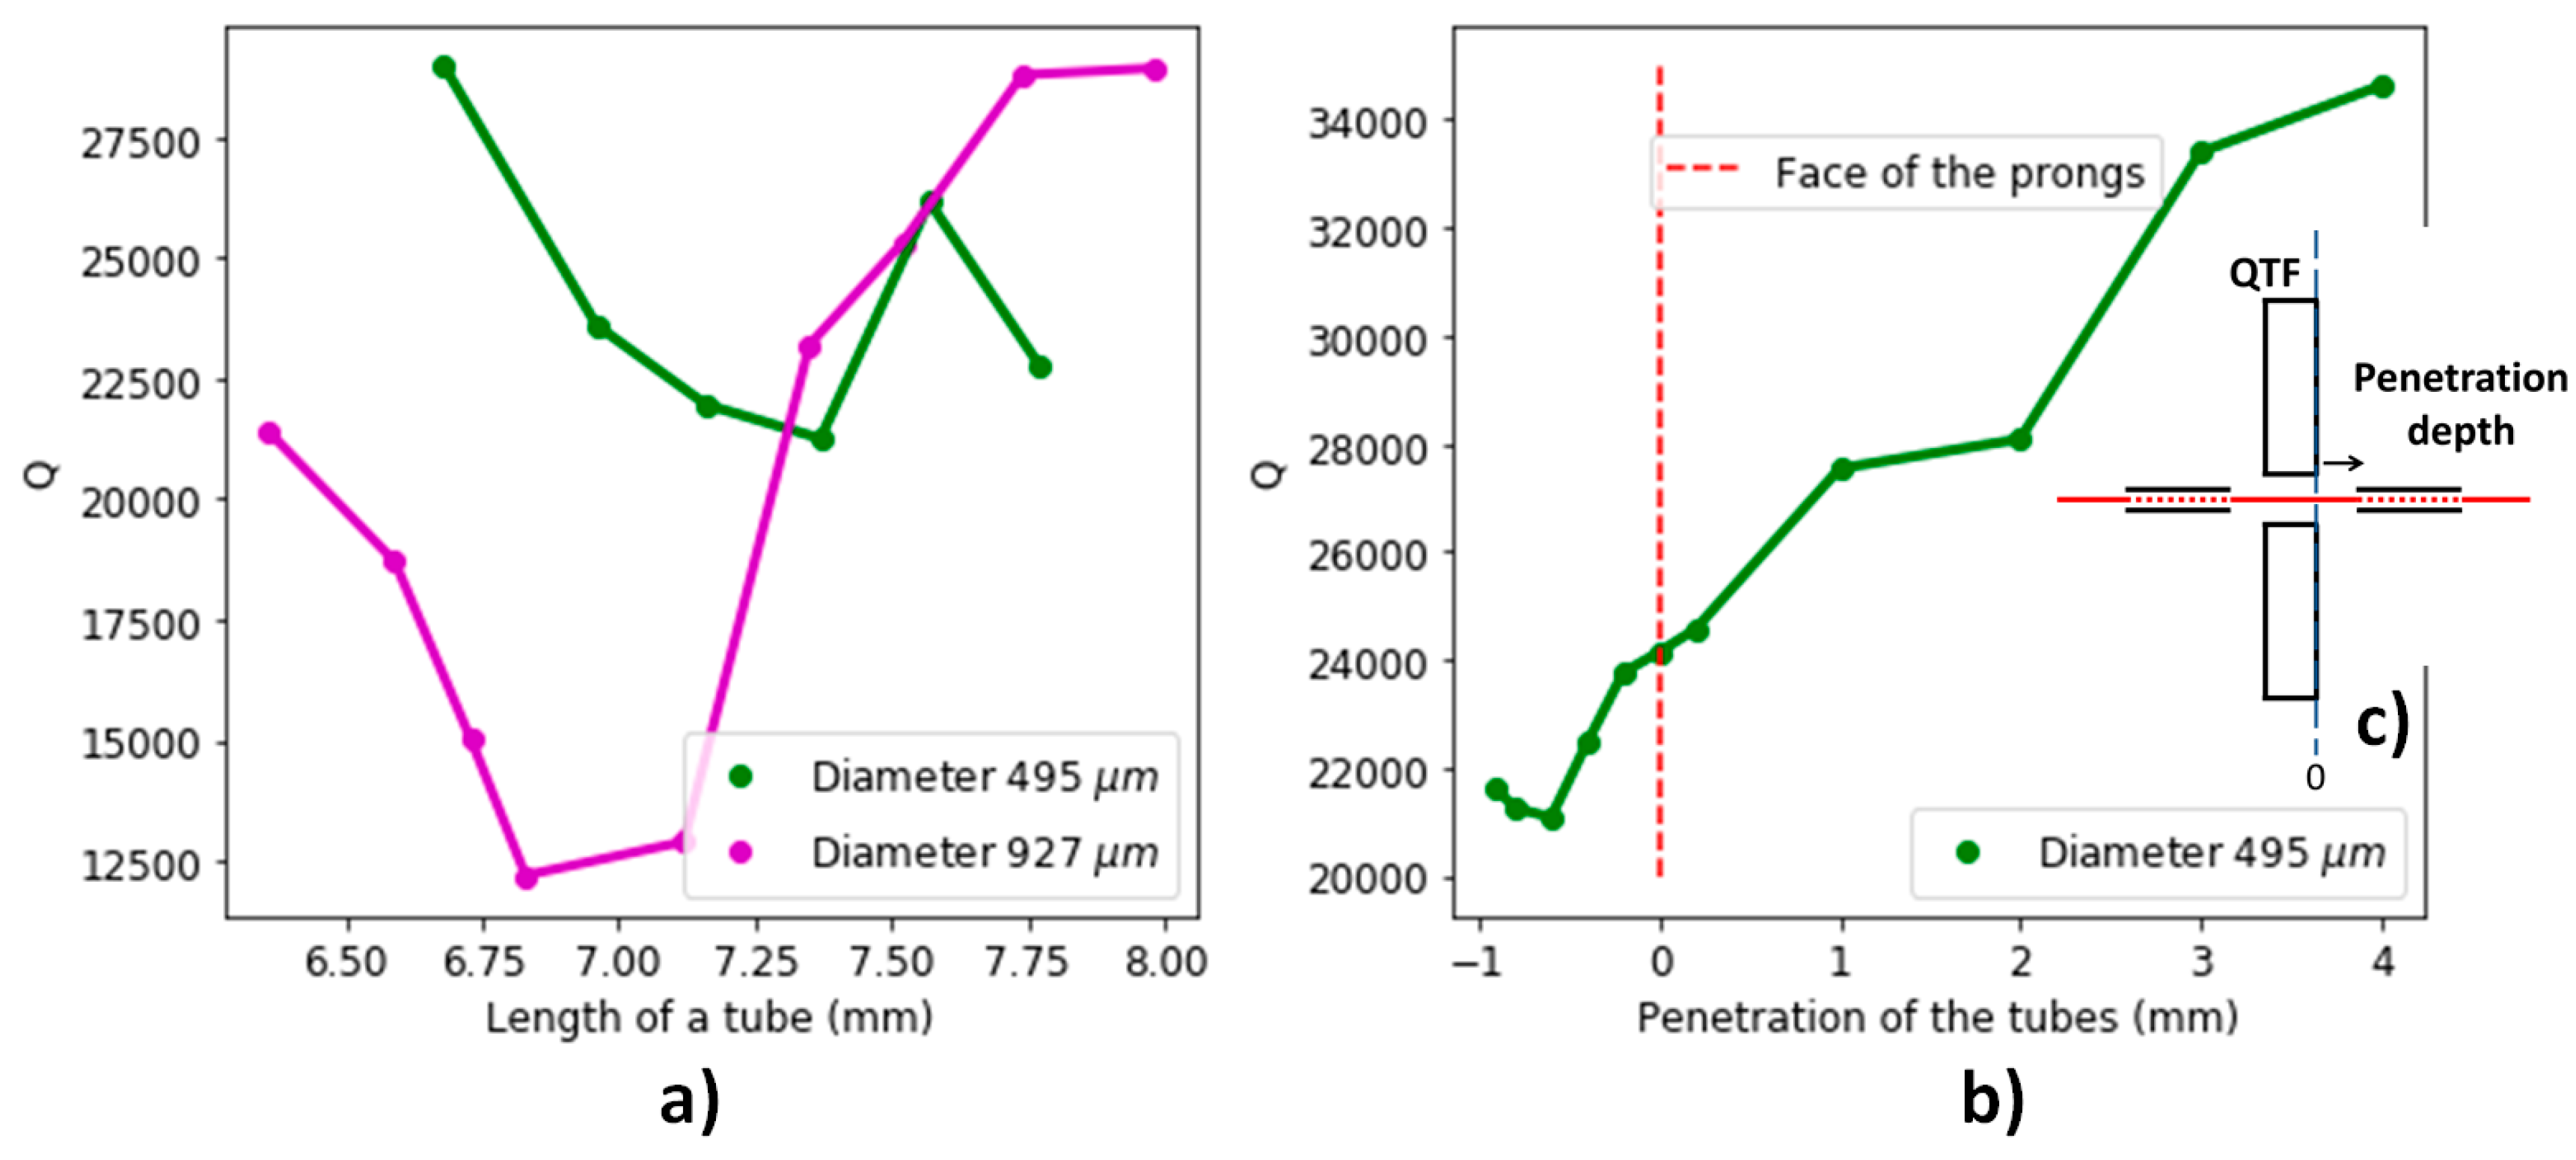
2.2. Design Optimization of the Microresonators
3. Gas Detection
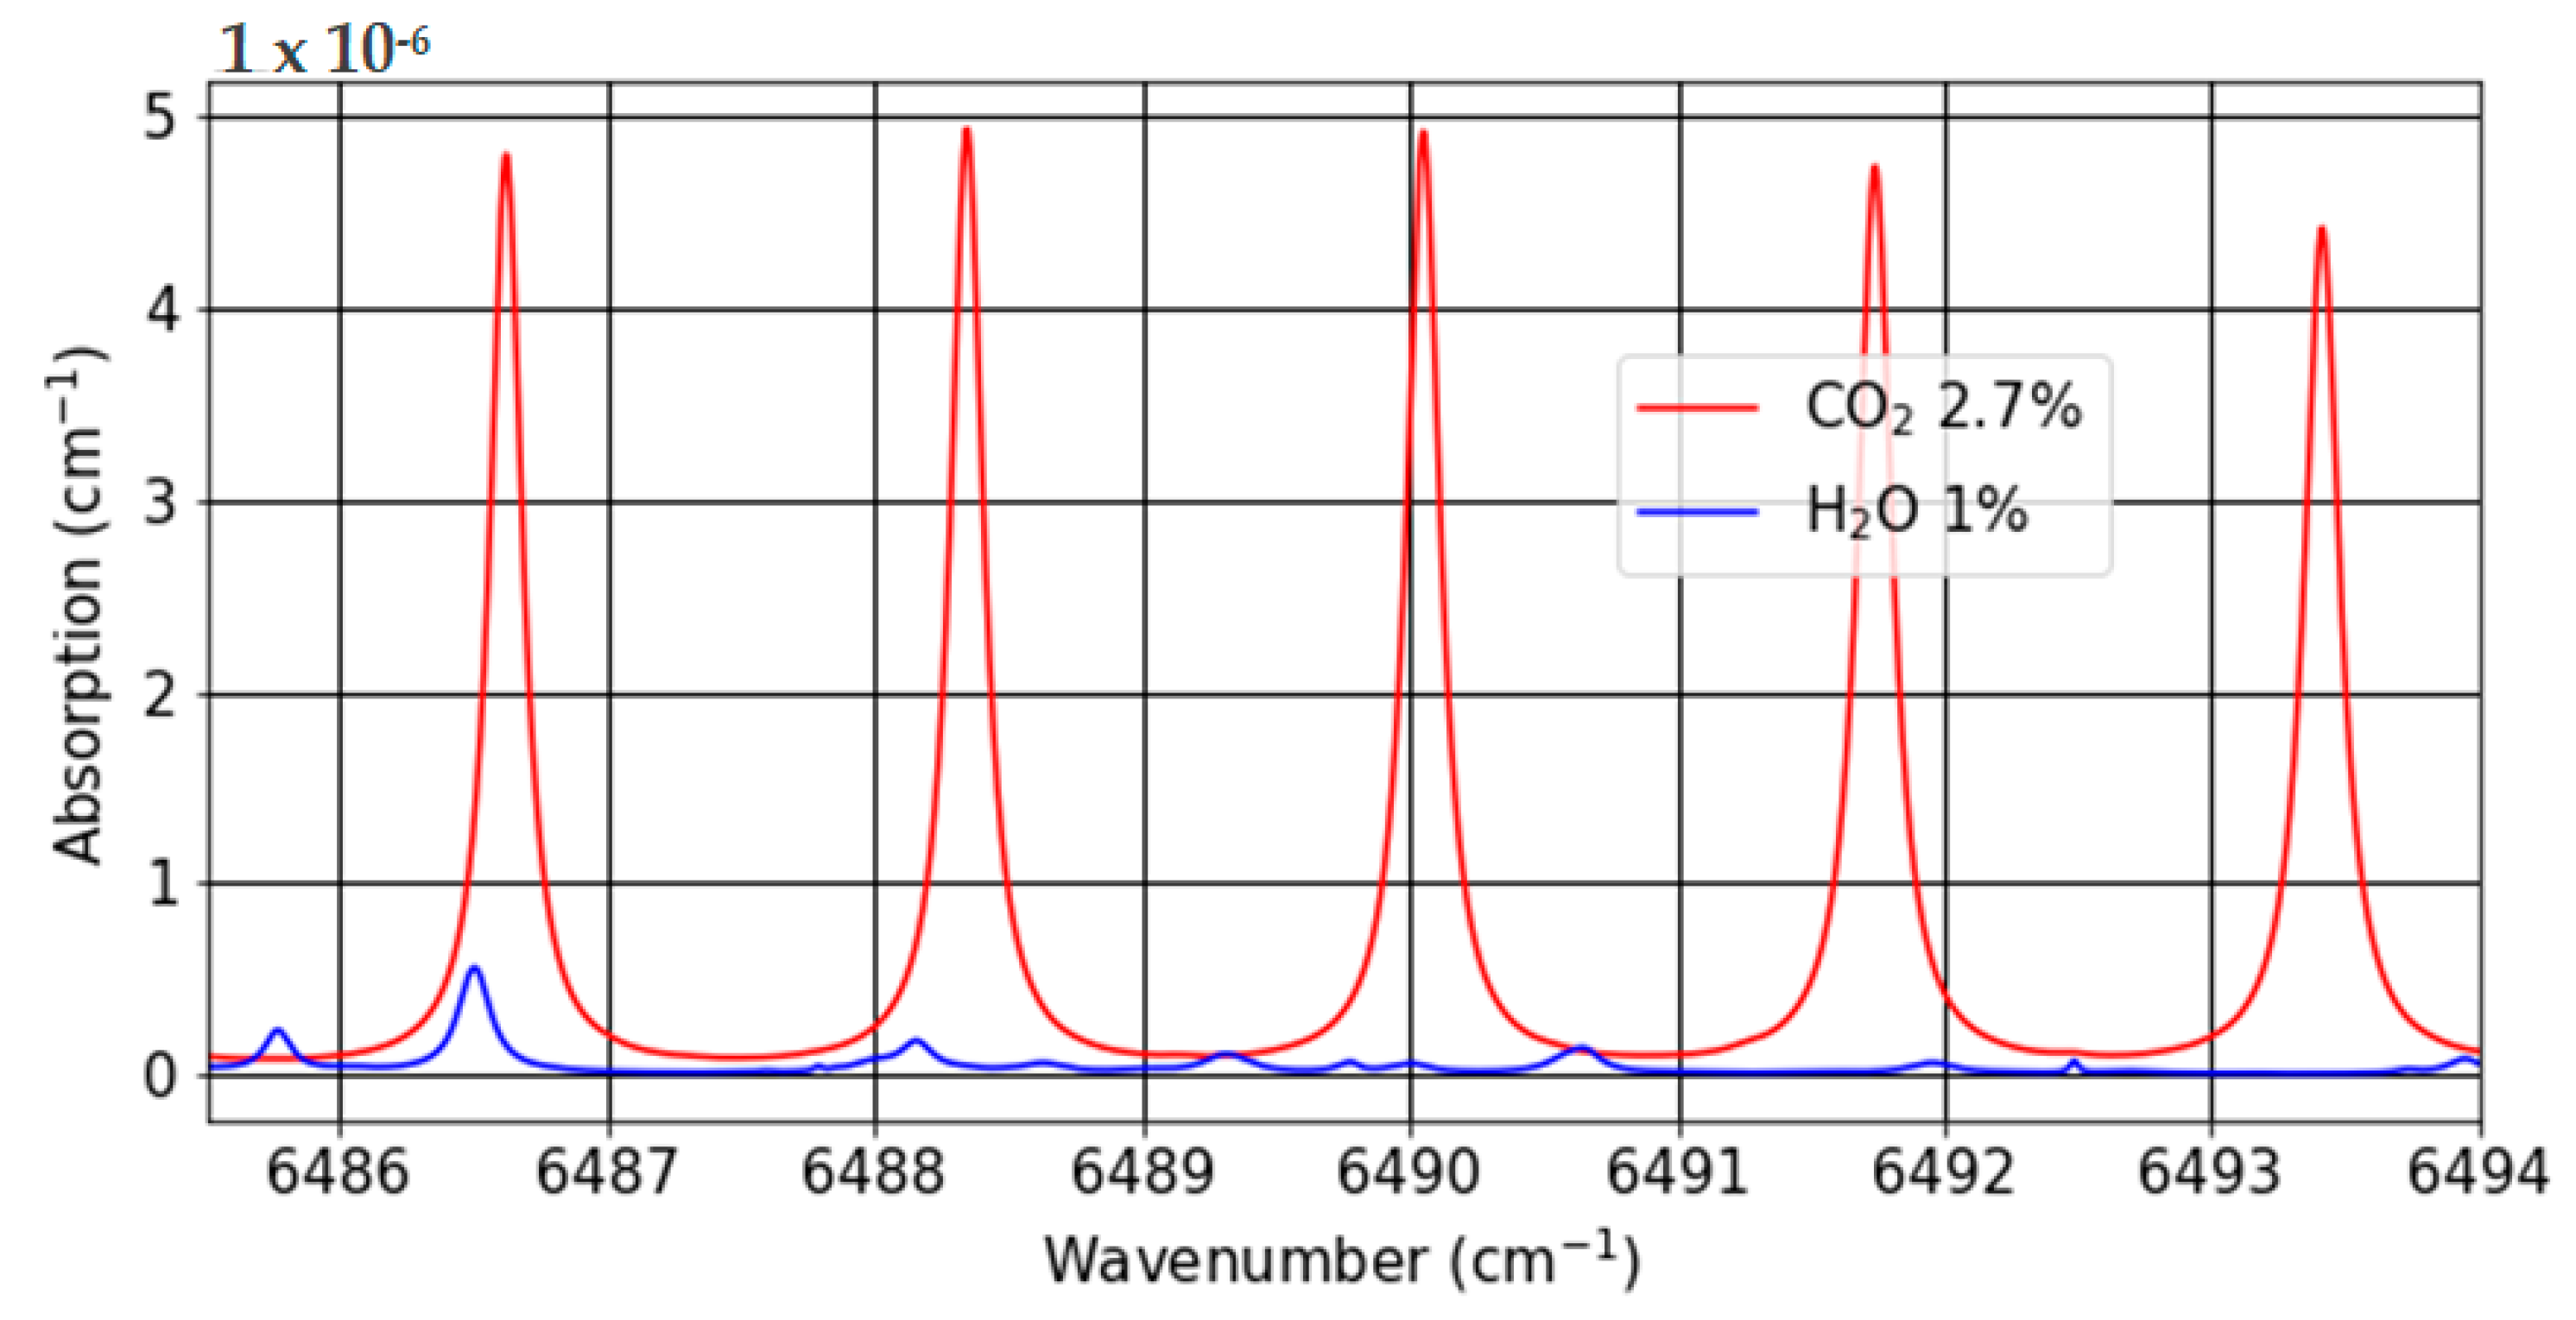
3.1. Targeted Absorption Line
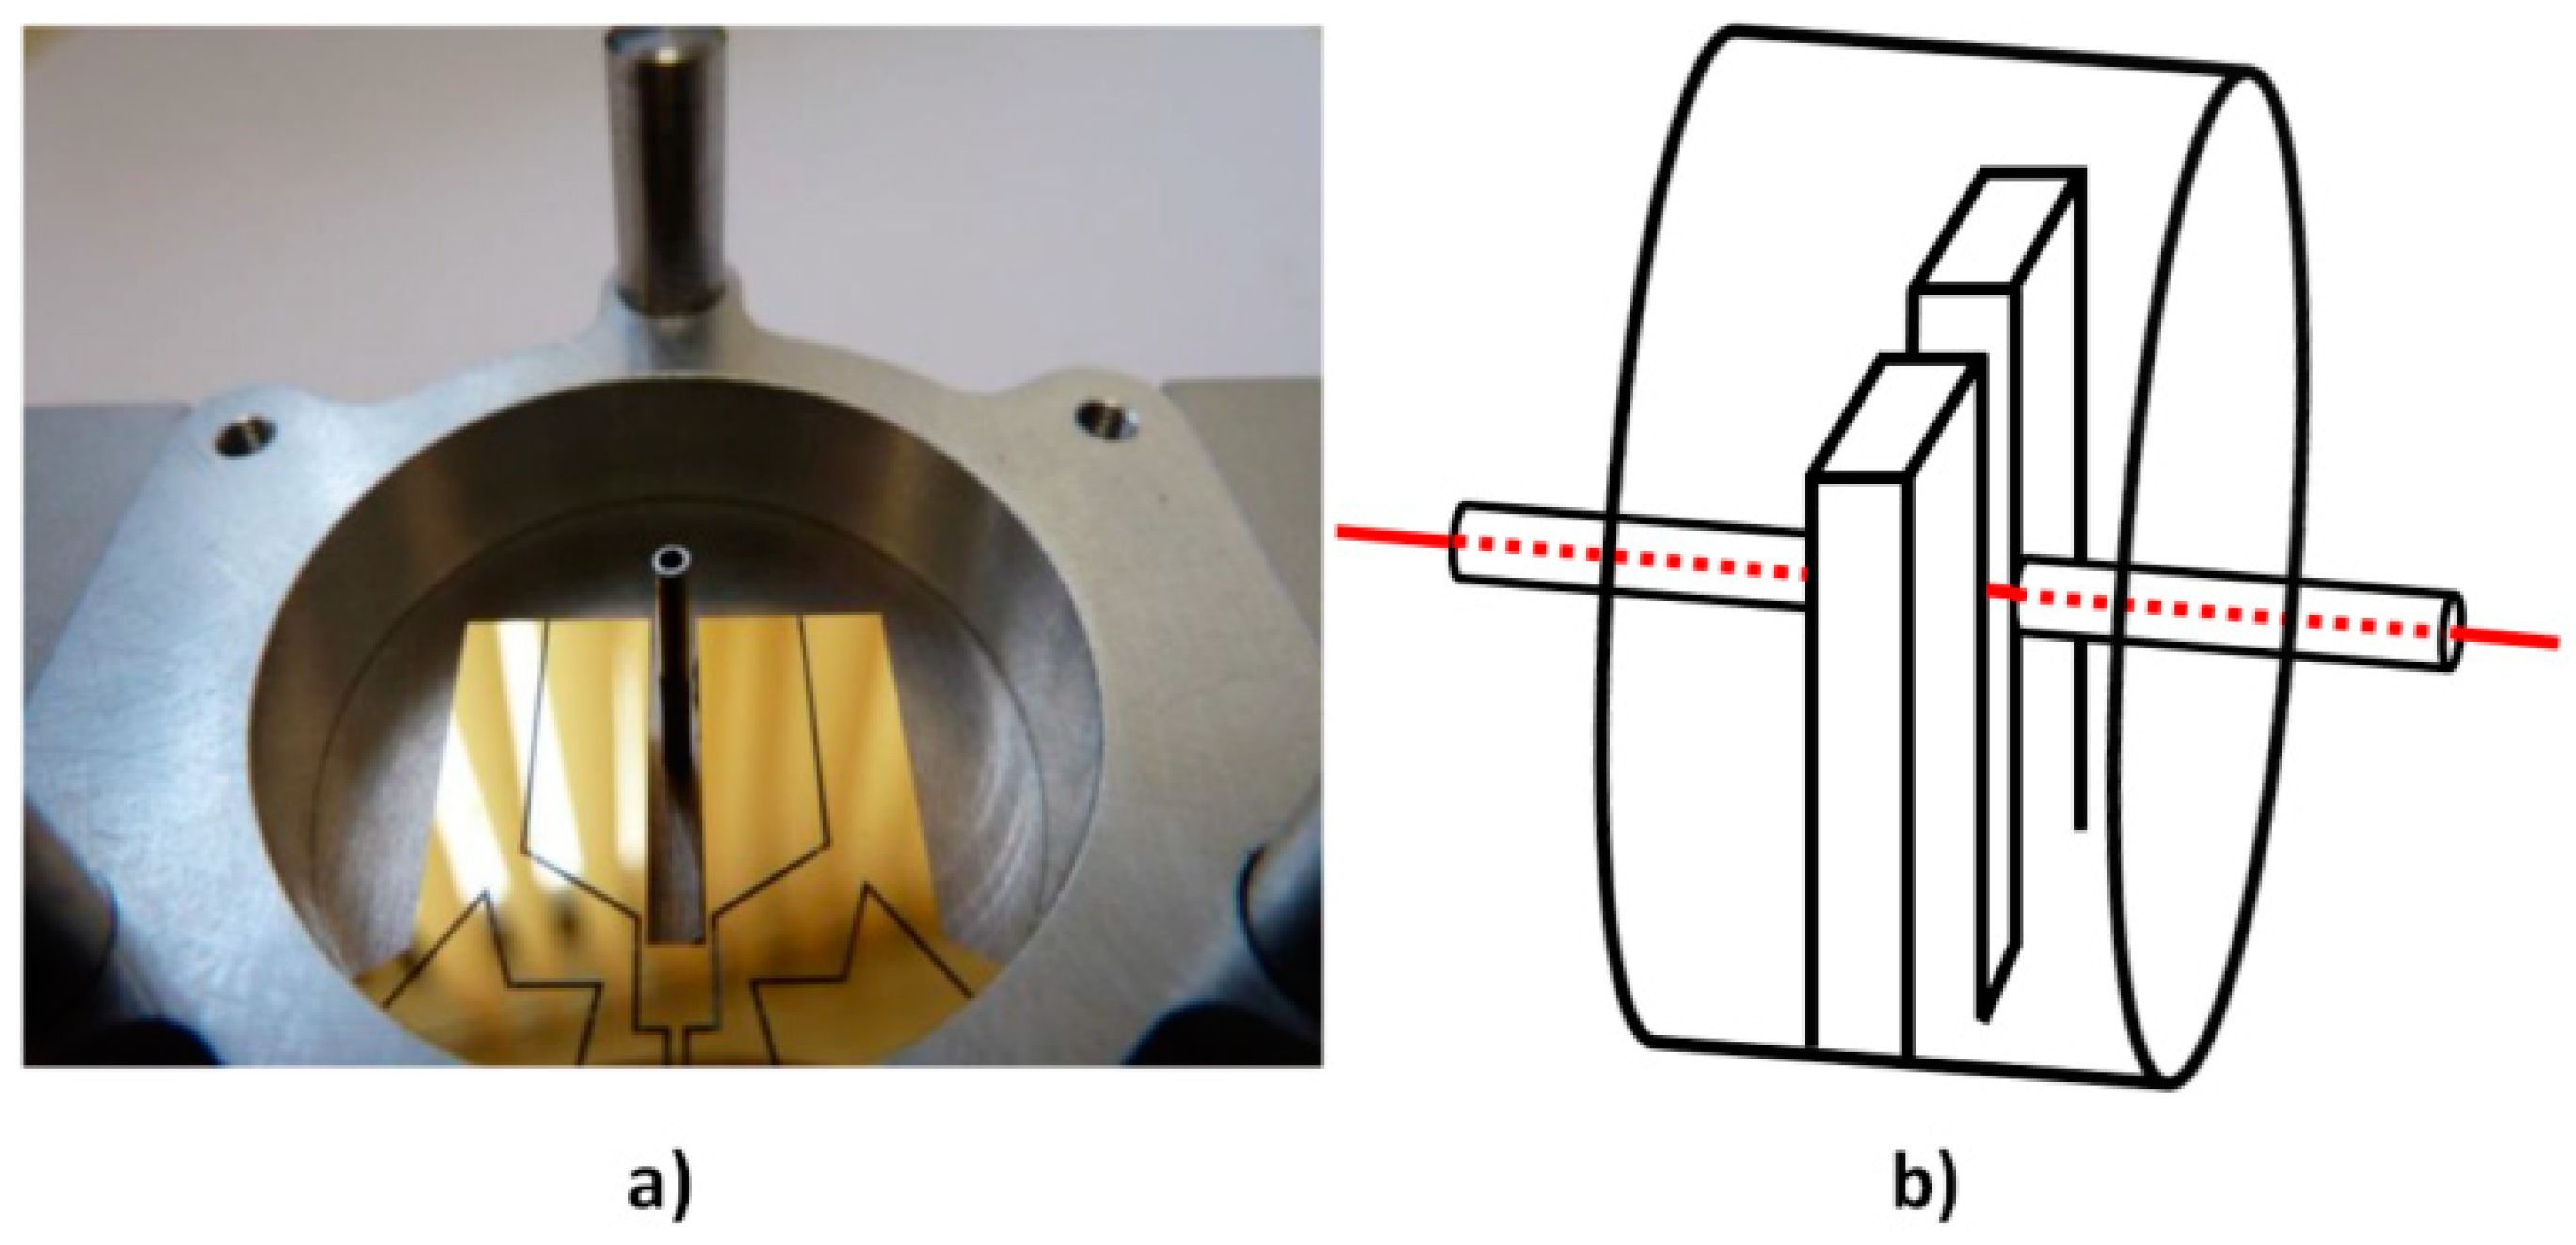
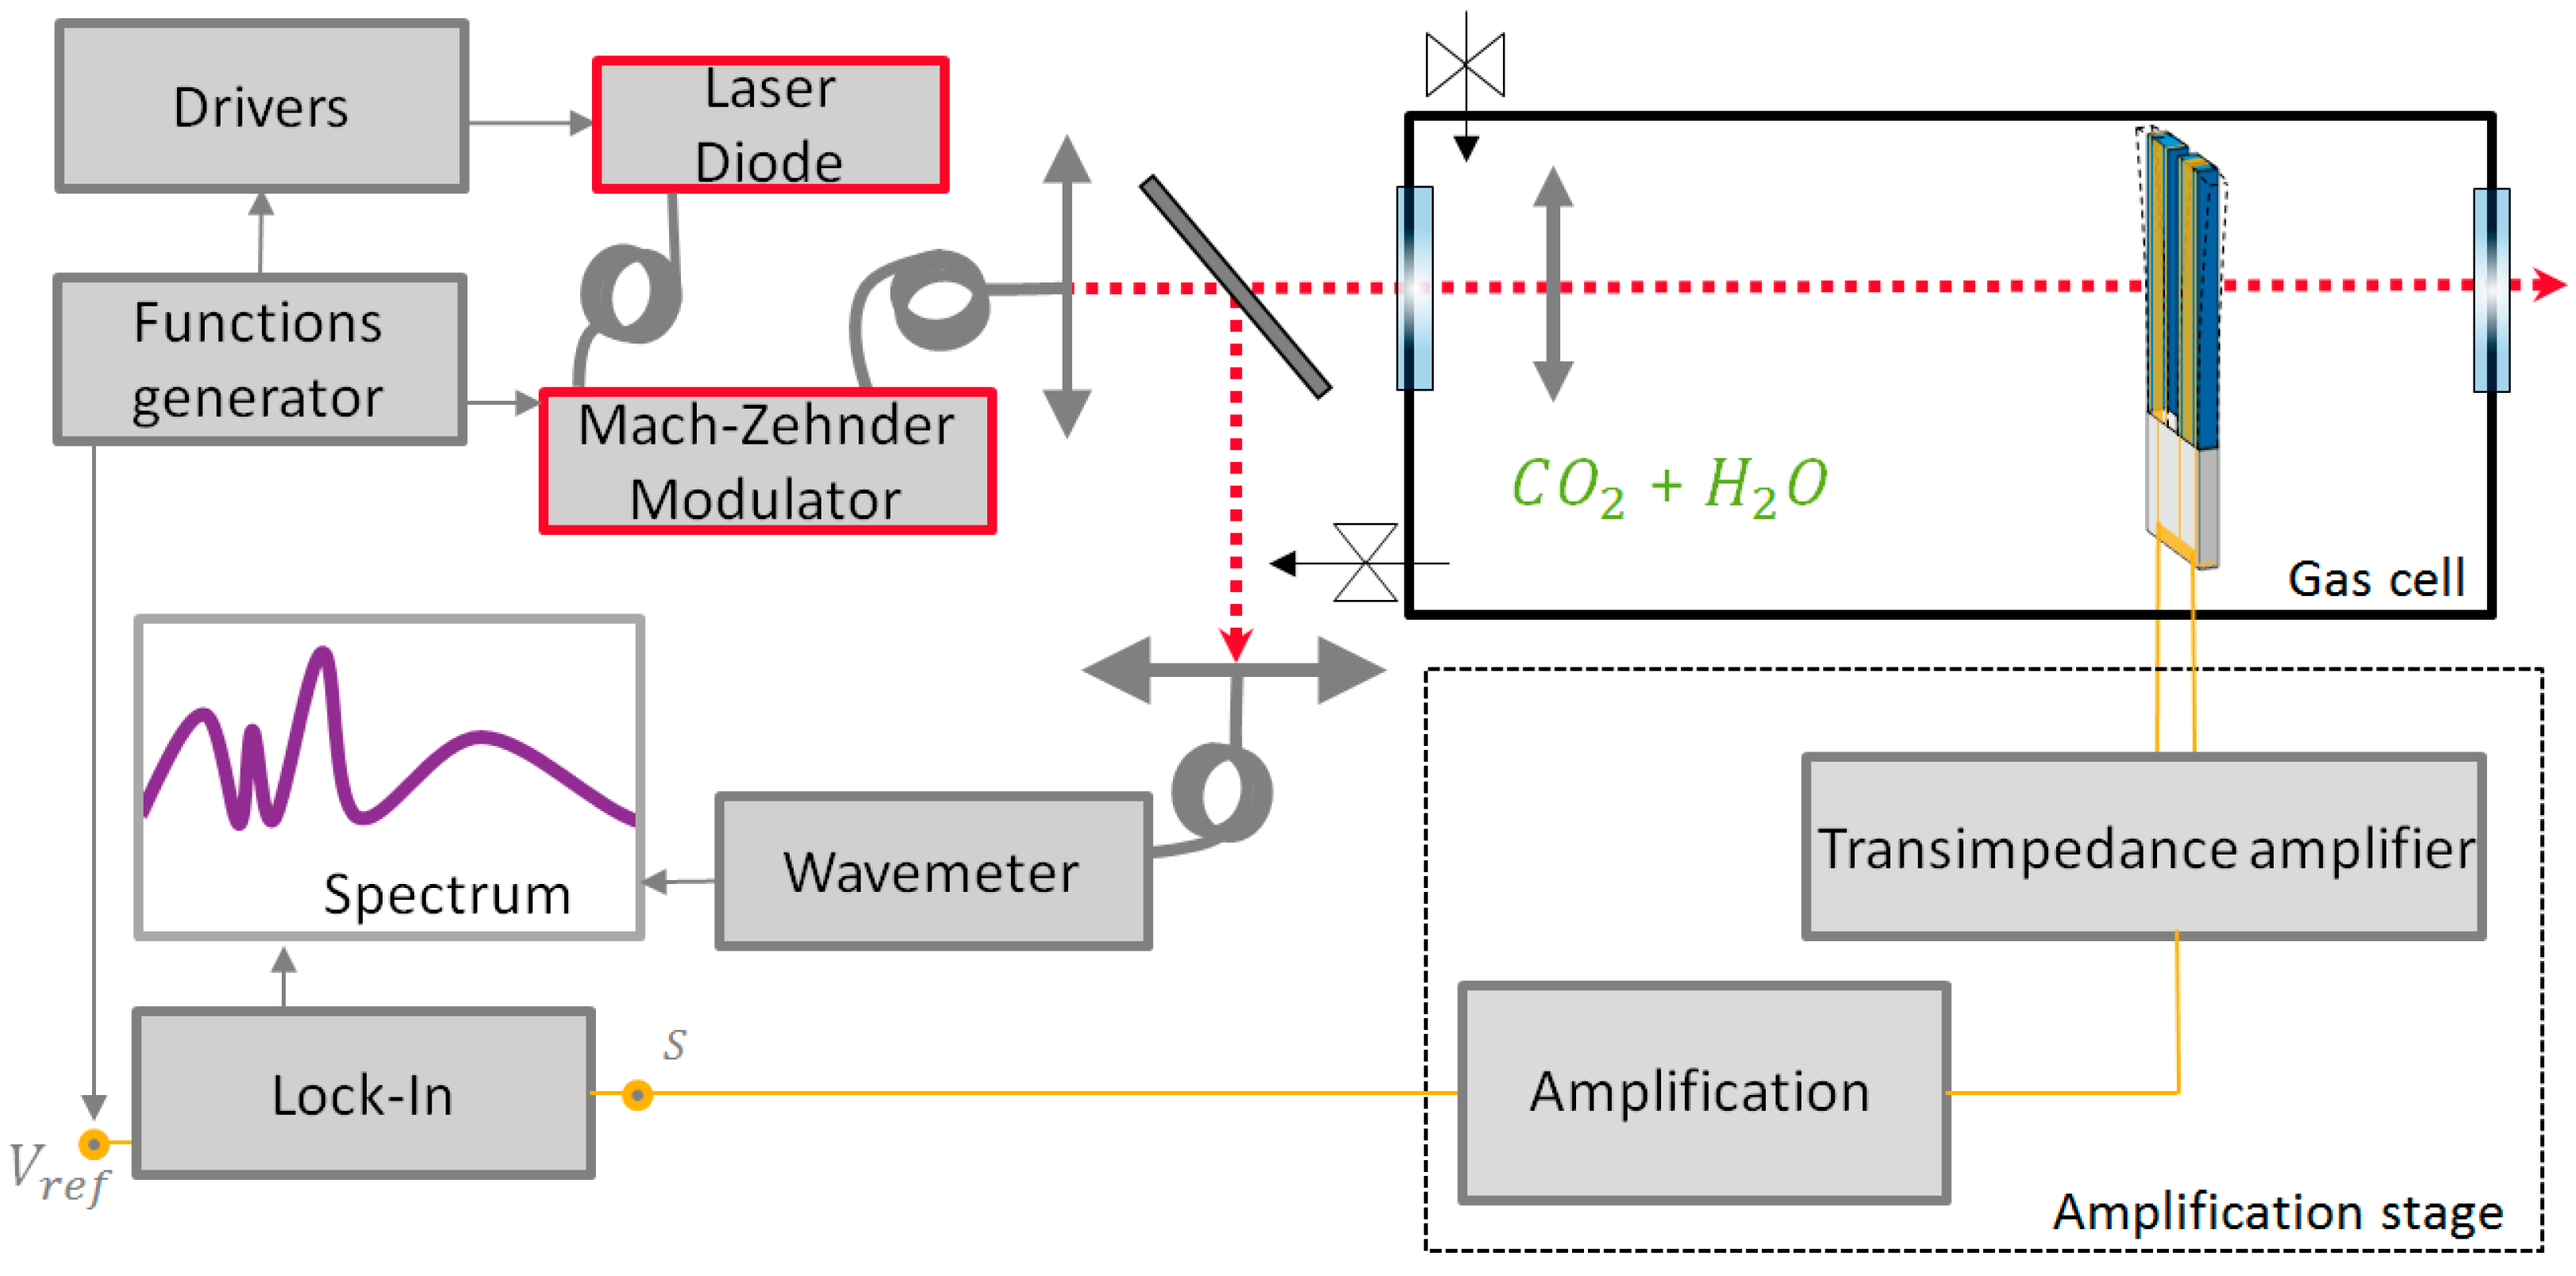
3.2. Setup
3.3. CO2 Detection
4. Conclusions
Author Contributions
Funding
Conflicts of Interest
References
- Bell, A.G. Upon the Production of Sound by Radiant Energy; Gibson Brothers, printers: Washington, DC, USA, 1881. [Google Scholar]
- Kosterev, A.A.; Bakhirkin, Y.A.; Curl, R.F.; Tittel, F.K. Quartz-enhanced photoacoustic spectroscopy. Opt. Lett. 2002, 27, 1902–1904. [Google Scholar] [CrossRef] [PubMed]
- Lee, M.; Jahng, J.; Kim, K.; Jhe, W. Quantitative atomic force measurement with a quartz tuning fork. Appl. Phys. Lett. 2007, 91, 023117. [Google Scholar] [CrossRef]
- Patimisco, P.; Spagnolo, V.; Vitiello, M.; Scamarcio, G.; Bledt, C.; Harrington, J. Low-loss hollow waveguide fibers for mid-infrared quantum cascade laser sensing applications. Sensors 2013, 13, 1329–1340. [Google Scholar] [CrossRef] [PubMed]
- Wysocki, G.; Kosterev, A.A.; Tittel, F.K. Influence of molecular relaxation dynamics on quartz-enhanced photoacoustic detection of CO2 at λ = 2 μm. Appl. Phys. B 2006, 85, 301–306. [Google Scholar] [CrossRef]
- Dong, L.; Kosterev, A.A.; Thomazy, D.; Tittel, F.K. QEPAS spectrophones: Design, optimization, and performance. Appl. Phys. B 2010, 100, 627–635. [Google Scholar] [CrossRef]
- Wu, H.; Dong, L.; Zheng, H.; Liu, X.; Yin, X.; Ma, W.; Zhang, L.; Yin, W.; Jia, S.; Tittel, F.K. Enhanced near-infrared QEPAS sensor for sub-ppm level H2S detection by means of a fiber amplified 1582 nm DFB laser. Sens. Actuators B Chem. 2015, 221, 666–672. [Google Scholar] [CrossRef]
- Sampaolo, A.; Patimisco, P.; Giglio, M.; Vitiello, M.; Beere, H.; Richie, D.; Scamarcio, G.; Tittel, F.K.; Spagnolo, V. Improved tuning fork for terahertz Quartz-Enhanced Photoacoustic Spectroscopy. Sensors 2016, 16, 439. [Google Scholar] [CrossRef] [PubMed]
- Zeninari, V.; Parvitte, B.; Courtois, D.; Kapitanov, V.A.; Ponomarev, Y.N. Methane detection on the sub-ppm level with a near-infrared diode laser photoacoustic sensor. Infrared Phys. Technol. 2003, 44, 253–261. [Google Scholar] [CrossRef]
- Tittel, F.K.; Sampaolo, A.; Patimisco, P.; Dong, L.; Geras, A.; Starecki, T.; Spagnolo, V. Analysis of overtone flexural modes operation in quartz-enhanced photoacoustic spectroscopy. Opt. Express 2016, 24, A682–A692. [Google Scholar] [CrossRef]
- Patimisco, P.; Sampaolo, A.; Giglio, M.; dello Russo, S.; Mackowiak, V.; Rossmadl, H.; Cable, A.; Tittel, F.K.; Spagnolo, V. Tuning forks with optimized geometries for quartz-enhanced photoacoustic spectroscopy. Opt. Express 2019, 27, 1401–1415. [Google Scholar] [CrossRef] [PubMed]
- Patimisco, P.; Sampaolo, A.; Dong, L.; Tittel, F.K.; Spagnolo, V. Recent advances in quartz enhanced photoacoustic sensing. App. Phys. Rev. 2018, 5, 011106. [Google Scholar] [CrossRef]
- Wu, H.; Yin, X.; Dong, L.; Pei, K.; Sampaolo, A.; Patimisco, P.; Zheng, H.; Ma, W.; Zhang, L.; Yin, W.; et al. Simultaneous dual-gas QEPAS detection based on a fundamental and overtone combined vibration of quartz tuning fork. Appl. Phys. Lett. 2017, 110, 121104. [Google Scholar] [CrossRef]
- Ma, Y.F.; Tong, Y.; He, Y.; Long, J.H.; Yu, X. Quartz-enhanced photoacoustic spectroscopy sensor with a small-gap quartz tuning fork. Sensors 2018, 18, 2047. [Google Scholar] [CrossRef] [PubMed]
- Zheng, H.; Dong, L.; Yin, X.; Liu, X.; Wu, H.; Zhang, L.; Ma, W.; Yin, W.; Jia, S. Ppb-level QEPAS NO2 sensor by use of electrical modulation cancellation method with a high power blue LED. Sens. Actuators B Chem. 2015, 208, 173–179. [Google Scholar] [CrossRef]
- Levy, R.; Duquesnoy, M.; Aoust, G.; Melkonian, J.M. New Signal Processing for Fast and Accurate QEPAS Measurements. In Proceedings of the 2018 IEEE International Ultrasonics Symposium (IUS), Kobe, Japan, 22–25 October 2018; pp. 1–3. [Google Scholar]
- Liu, K.; Guo, X.; Yi, H.; Chen, W.; Zhang, W.; Gao, X. Off-beam quartz-enhanced photoacoustic spectroscopy. Opt. Lett. 2009, 34, 1594–1596. [Google Scholar] [CrossRef]
- Rousseau, R.; Loghmari, Z.; Bahriz, M.; Chamassi, K.; Teissier, R.; Baranov, A.N.; Vicet, A. Off-beam QEPAS sensor using an 11-µm DFB-QCL with an optimized acoustic resonator. Optics Express 2019, 27, 7435–7446. [Google Scholar] [CrossRef] [PubMed]
- Aoust, G.; Levy, R.; Verlhac, B.; Le Traon, O. Ultra high quality factor resonators operated in fluids. Sens. Actuators A Phys. 2018, 269, 569–573. [Google Scholar] [CrossRef]
- Aoust, G. Développements de Sources Infrarouges et de Résonateurs en Quartz Pour la Spectroscopie Photoacoustique. Ph.D. Thesis, Université Paris-Saclay, Paris, France, 2016. [Google Scholar]
- OOFELIE: Multiphysics by Open Engineering. Available online: https://www.open-engineering.com (accessed on 1 March 2019).
- Aoust, G.; Levy, R.; Verlhac, B.; Le Traon, O. Optimal quality factor for tuning forks in a fluid medium. Sens. Actuators A Phys. 2016, 243, 134–138. [Google Scholar] [CrossRef]
- Zheng, H.; Dong, L.; Sampaolo, A.; Wu, H.; Patimisco, P.; Yin, X.; Ma, W.; Zhang, L.; Yin, W.; Spagnolo, V.; et al. Single-tube on-beam quartz-enhanced photoacoustic spectroscopy. Opt. Lett. 2016, 41, 978–981. [Google Scholar] [CrossRef]
- Wu, H.; Sampaolo, A.; Dong, L.; Patimisco, P.; Liu, X.; Zheng, H.; Yin, X.; Ma, W.; Zhang, L.; Yin, W.; et al. Quartz enhanced photoacoustic H2S gas sensor based on a fiber-amplifier source and a custom tuning fork with large prong spacing. Appl. Phys. Lett. 2015, 107, 111104. [Google Scholar] [CrossRef]
- Aoust, G.; Levy, R.; Raybaut, M.; Godard, A.; Melkonian, J.M.; Lefebvre, M. Theoretical analysis of a resonant quartz-enhanced photoacoustic spectroscopy sensor. Appl. Phys. B 2017, 123, 63. [Google Scholar] [CrossRef]
- Ma, Y.; Lewicki, R.; Razeghi, M.; Tittel, F.K. QEPAS based ppb-level detection of CO and N2O using a high power CW DFB-QCL. Opt. Express 2013, 21, 1008–1019. [Google Scholar] [CrossRef] [PubMed]
- Dong, L.; Wright, J.; Peters, B.; Ferguson, B.A.; Tittel, F.K.; McWhorter, S. Compact QEPAS sensor for trace methane and ammonia detection in impure hydrogen. Appl. Phys. B 2012, 107, 459–467. [Google Scholar] [CrossRef]


| Bare QTF | QTF + Acoustic Recovery | |
|---|---|---|
| Frequency | 21.23 kHz | 21.23 kHz |
| Qsupport | 1 × 10⁶ | 1 × 10⁶ |
| Qthermo | 5.48 × 10⁷ | 5.48 × 10⁷ |
| Qsqueeze | 3.82 × 10⁷ | 3.82 × 10⁷ |
| Qviscous (lateral) | 2.91 × 10⁵ | 2.91 × 10⁵ |
| Qviscous (frontal) | 2.96 × 10⁵ | 2.96 × 10⁵ |
| Qacoustic | 7.76 × 10³ | - |
| Q total | 7.32 × 10³ | 1.27 × 10⁵ |
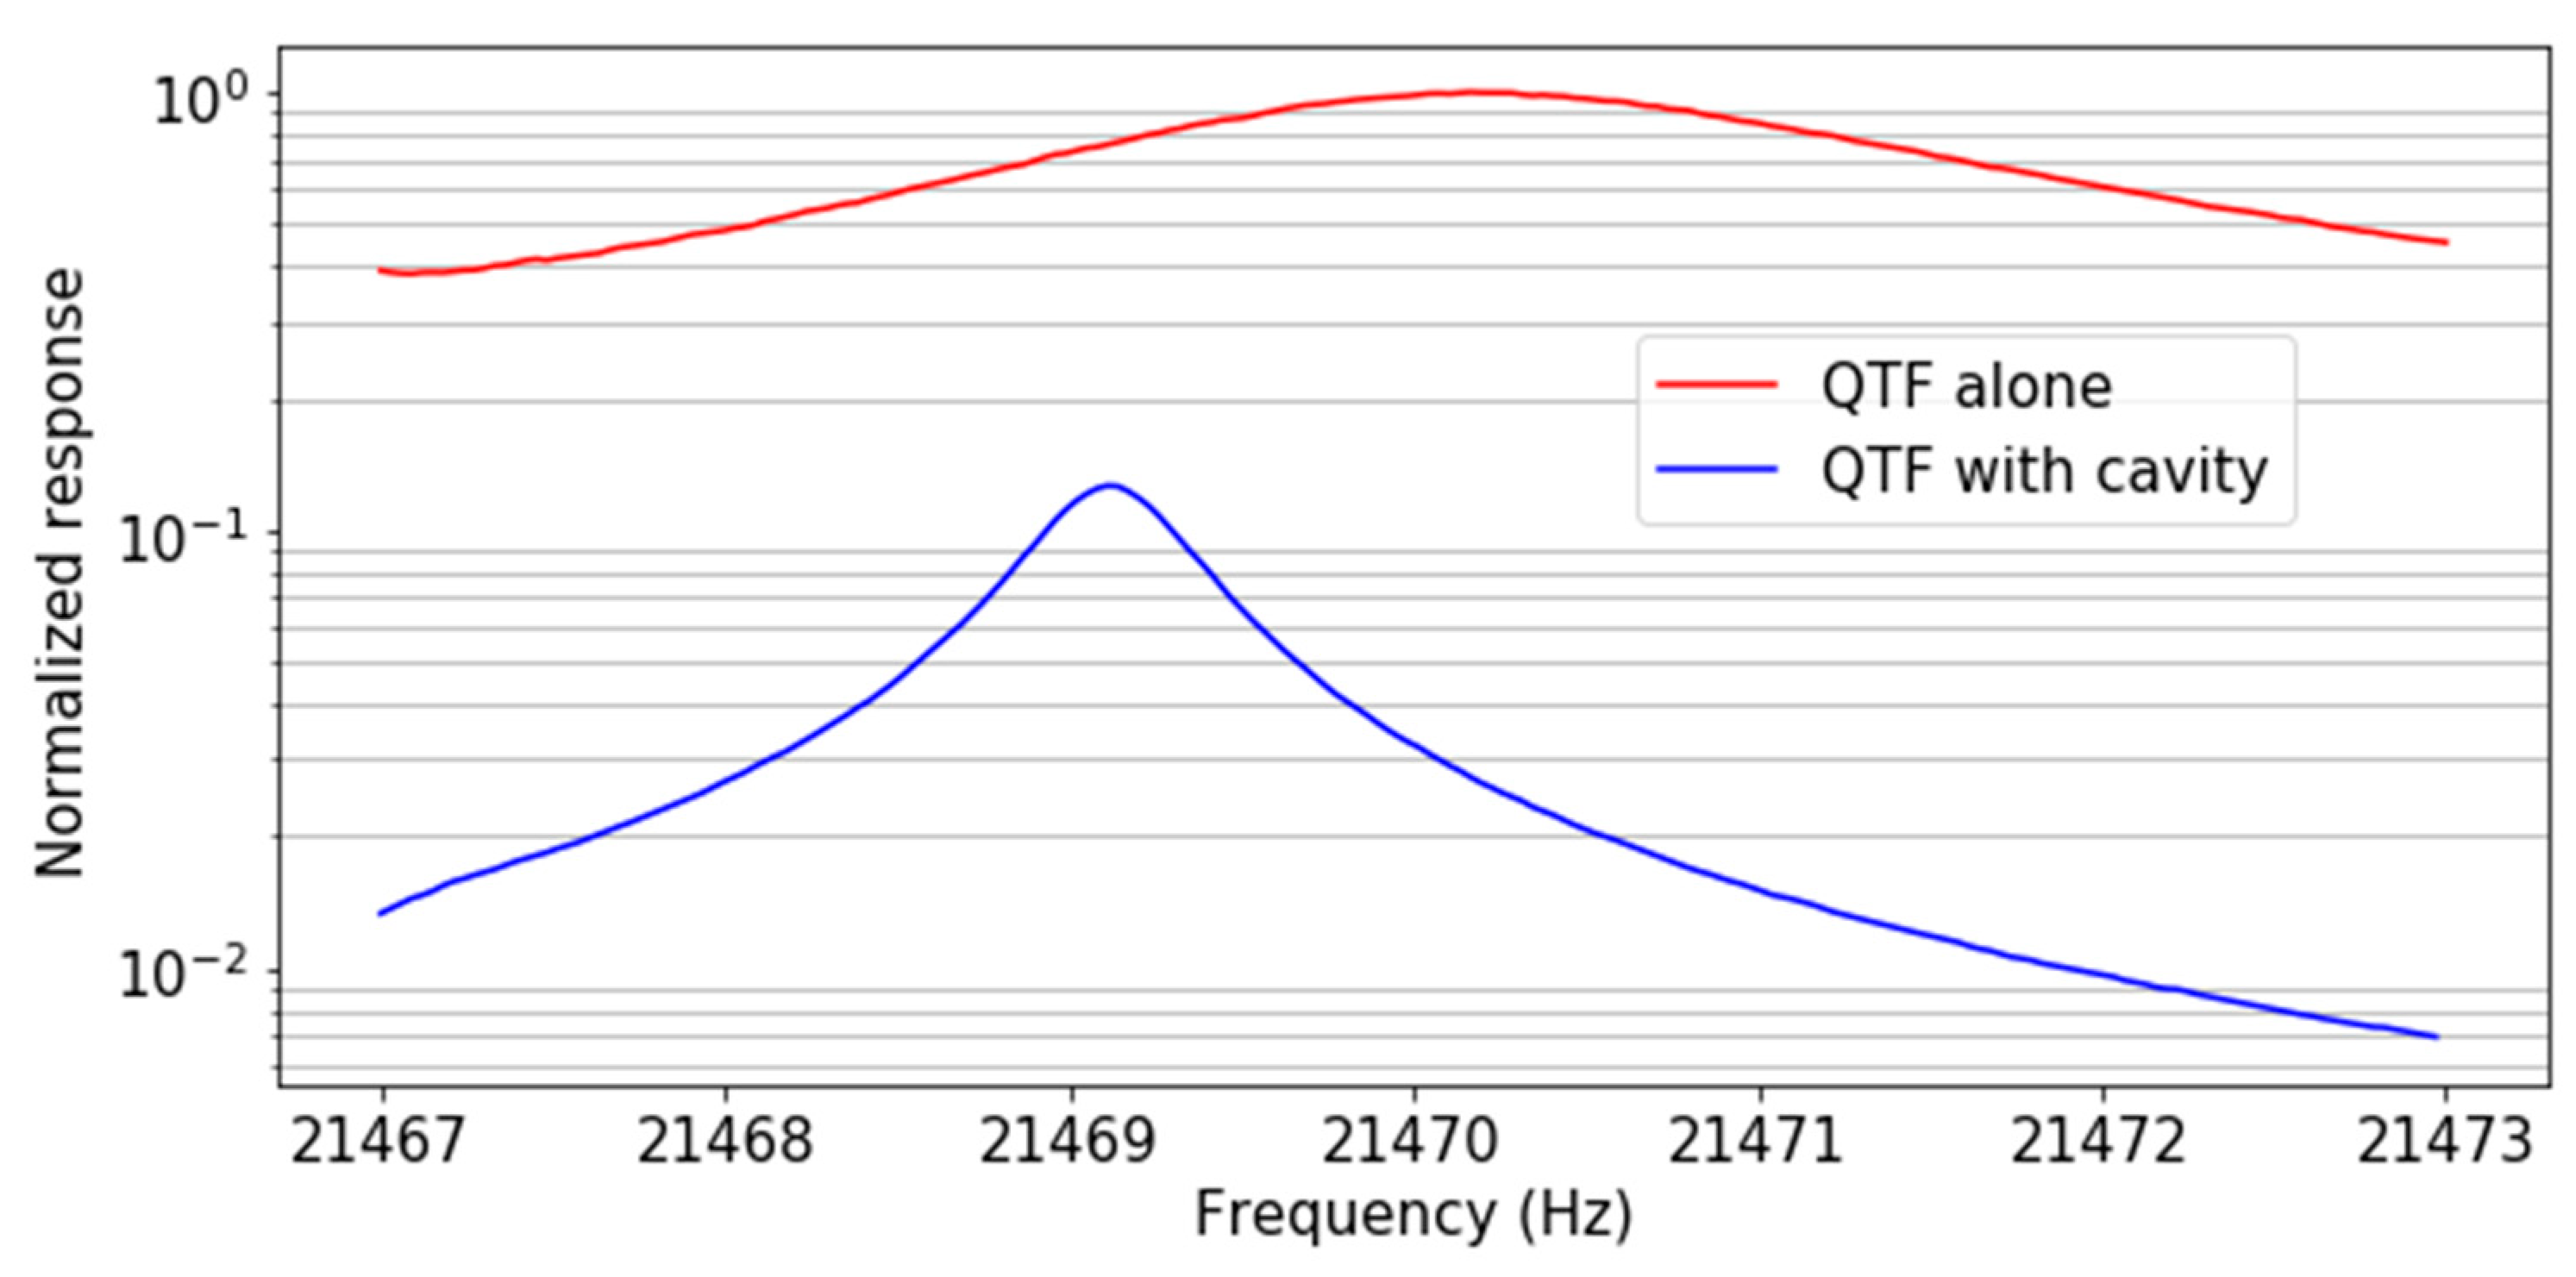
| C2 Alone | C2 with Cavity | |
|---|---|---|
| Frequency (Hz) | 21,470.22 | 21,469.12 |
| Q factor | 7600 | 45,441 |
| Normalized sensitivity to external sound | 1 | 1/8 |
© 2019 by the authors. Licensee MDPI, Basel, Switzerland. This article is an open access article distributed under the terms and conditions of the Creative Commons Attribution (CC BY) license (http://creativecommons.org/licenses/by/4.0/).
Share and Cite
Duquesnoy, M.; Aoust, G.; Melkonian, J.-M.; Lévy, R.; Raybaut, M.; Godard, A. Quartz Enhanced Photoacoustic Spectroscopy Based on a Custom Quartz Tuning Fork. Sensors 2019, 19, 1362. https://doi.org/10.3390/s19061362
Duquesnoy M, Aoust G, Melkonian J-M, Lévy R, Raybaut M, Godard A. Quartz Enhanced Photoacoustic Spectroscopy Based on a Custom Quartz Tuning Fork. Sensors. 2019; 19(6):1362. https://doi.org/10.3390/s19061362
Chicago/Turabian StyleDuquesnoy, Maxime, Guillaume Aoust, Jean-Michel Melkonian, Raphaël Lévy, Myriam Raybaut, and Antoine Godard. 2019. "Quartz Enhanced Photoacoustic Spectroscopy Based on a Custom Quartz Tuning Fork" Sensors 19, no. 6: 1362. https://doi.org/10.3390/s19061362
APA StyleDuquesnoy, M., Aoust, G., Melkonian, J.-M., Lévy, R., Raybaut, M., & Godard, A. (2019). Quartz Enhanced Photoacoustic Spectroscopy Based on a Custom Quartz Tuning Fork. Sensors, 19(6), 1362. https://doi.org/10.3390/s19061362