Abstract
An In2O3/ITO thin film thermocouple was prepared via screen printing. Glass additives were added to improve the sintering process and to increase the density of the In2O3/ITO films. The surface and cross-sectional images indicate that both the grain size and densification of the ITO and In2O3 films increased with the increase in annealing time. The thermoelectric voltage of the In2O3/ITO thermocouple was 53.5 mV at 1270 °C at the hot junction. The average Seebeck coefficient of the thermocouple was calculated as 44.5 μV/°C. The drift rate of the In2O3/ITO thermocouple was 5.44 °C/h at a measuring time of 10 h at 1270 °C.
1. Introduction
Many thermal sensors, such as thermocouples [1,2], infrared sensors [3], and optical fiber sensors [4], have been developed for high temperature measurement, especially in turbine engines. To meet the requirements of such extreme environments, a variety of noble metal materials are used to make thermocouples, such as platinum vs. palladium [5,6] and platinum vs. platinum/rhodium alloy [7]. To achieve in-situ temperature detection of hot end members such as turbine blades and vanes, a thin film thermocouple (TFTC) can be directly integrated with component surfaces [7,8,9]. These can obtain stable outputs at lower temperatures [10]. However, they cannot perform well at high temperatures in oxidation environments due to their weak anti-oxidation characteristics. Oxidation can cause instability and degradation of the noble metal materials of the thermocouple [11]. Thereafter, thin film thermocouples with good oxidation resistance and high temperature stability have become important.
In order to obtain a high thermoelectric output voltage and high temperature thermal stability in engine applications (a high temperature and oxygen atmosphere), many researchers have focused on composite ceramic oxides for thermocouples to achieve measurements at harsh temperatures. Owing to their high output voltage, quick thermo-response, and good anti-oxidation, metal oxide materials, such as ZnO and Al-doped ZnO (AZO), ITO and In2O3 have been used to make thin film thermocouples for use in extreme environments [12,13]. Among these metal oxide thermocouples, the In2O3/ITO (95/5) thin film thermocouple is an important temperature sensor and has potential for use at temperatures up to 1200 °C with high thermal output and quick response [13,14]. As a result, the preparation and performance of an In2O3/ITO thin film thermocouple working over 1200 °C for a long period of time is worth studying.
In this paper, an In2O3/ITO thermocouple was prepared via screen printing. Glass powders were used as additives to improve the microstructure and sintering properties of ITO and In2O3 films. The surface and cross-sectional morphologies of both ITO and In2O3 films were studied using SEM. The thermoelectric voltages of the In2O3/ITO thermocouple were measured. The high thermal response of In2O3/ITO thin film thermocouples was investigated.
2. Materials and Methods
2.1. Fabrication of In2O3/ITO Thin Film Thermocouple
The In2O3/ITO thin film thermocouple was deposited on an Al2O3 substrate via screen printing. The Al2O3 substrate (100 mm × 25 mm × 0.8 mm) was first cleaned with ethyl alcohol and deionized water with an ultrasonic washing machine and then dried for 2 h at 100 °C. ITO and In2O3 slurries were prepared for screen printing separately. First, the same amounts of terpilenol and ethyl cellulose (10 wt % of powder) additives were mixed with ITO and In2O3 powders as starting materials, respectively. After pre-mixing of the slurries, glass additives (mixed by CaO and SiO2) were added to the slurries separately under continuous stirring for 3 h to obtain uniform precursors. In order to study the effects of glass additives on the oxide films, the ITO and In2O3 slurries without glass additives were also prepared for comparison. Shadow masks were employed to form different thermocouple electrodes with various dimensions. The width of the ITO and In2O3 film electrodes was 4 mm, and the hot junction area was 4 × 4 mm. ITO slurry was screen-printed with a surgical blade onto the surface of the substrate using a screen mask, and dried at 100 °C for 1 h. Then, the In2O3 thin film was prepared using the same process. The processes were repeated three times to obtain thicker films. The samples prepared were annealed at 600 °C for 1 h and then thermally treated at 1250 °C for 1 h in a furnace in air. Copper wires (20 cm) were attached to the ITO and In2O3 films via silver paste at the cold junction, and dried at 150 °C for 2 h.
2.2. Measurements
SEM surface and cross-sectional images were obtained by a field-emission scanning electron microscope (FESEM, Quanta 250 FEG, FEI, Hillsboro, OR, USA). The thermoelectric response of the In2O3/ITO thermocouple was obtained by using the lab-made test measurement setup. A schematic diagram of the test system is shown in Figure 1. The hot junction of the thermocouple was placed in a modified high-temperature furnace (KSY-12-16S, Shanghai Laboratory, Shanghai, China), and the cold junction was in the outside of the furnace. The cooling of the cold junction was achieved via natural cooling. The furnace was heated from room temperature (22 °C) to 1270 °C at a heating rate of 5 °C/min. S-type and K-type thermocouples were used to measure the temperatures of hot sections and cold sections, respectively. The hot junctions of the In2O3/ITO thermocouple and a standard S-type were inserted into the furnace at the same position. The temperature of the cold junction was measured by a standard K-type thermocouple. The hot junction temperature (Th) by S-type thermocouple and the cold junction temperature (Tc) by K-type thermocouple, as well as the thermoelectric voltage, were recorded at the same time by a data recorder (LR8431, HIOKI Company, Nagano-ken, Japan). The Seebeck coefficient of the thermocouple was calculated and determined accordingly.
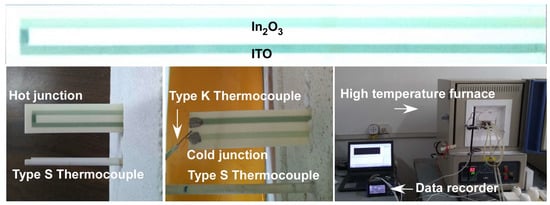
Figure 1.
The In2O3/ITO thermocouple and its measuring system.
3. Results and Discussion
3.1. Microstructures of ITO and In2O3 Films
Figure 2 shows SEM surface and cross-sectional images of ITO and In2O3 films without glass powder measured at 1250 °C for different times, from 2 to 10 h. The surface images show that both films are very porous and fragile. With the increase in measuring time, the grain size of ITO and In2O3 films increase. The cross-sectional images indicate that the thickness of the ITO films exhibits a significant decrease from 47.3 µm at 2 h to 34.7 µm at 10 h, while the thickness of the In2O3 film decreases from 31.5 µm at 2 h to 24.9 µm at 10 h. The results are attributed to the thermal volatilization of the In2O3/ITO materials under high temperature conditions above 1250 °C [15,16,17], which can lead to deterioration of the high temperature response of the thermocouple and its failure.
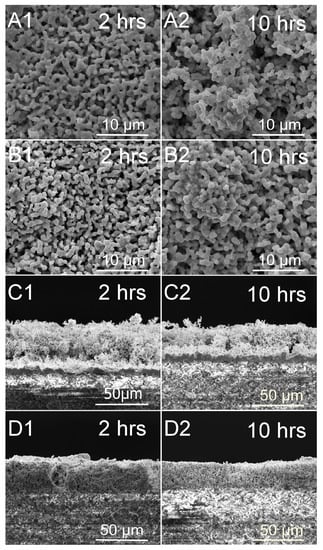
Figure 2.
SEM surface and cross-sectional images of ITO and In2O3 films without glass additives annealed at 1250 °C with different measuring times. (A,C) ITO film; (B,D) In2O3 film.
Figure 3 shows the SEM surface and cross-sectional images of ITO and In2O3 films with 8 wt % glass additives annealed at 1250 °C with different measuring times, from 2 to 10 h. It can be seen from the surface images that denser films can be obtained for all samples that do not have obvious holes in the film after the addition of the glass additives. The grain size of the ITO and In2O3 films increases with the annealing time, especially in the In2O3 films. The cross-sectional images indicate that all films were dense and continuous. There were no significant decreases of the thicknesses for both the ITO and In2O3 films as measuring time increased. This is attributed to the densification of films after the addition of glass additives, which effectively inhibit the volatilization of ITO and In2O3. The improved microstructure characteristics therefore lead to a good performance of the In2O3/ITO thermocouple at high temperature.
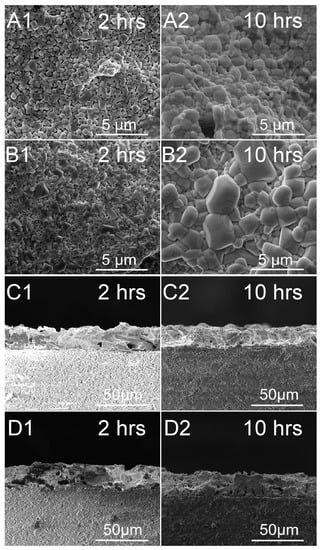
Figure 3.
SEM surface and cross-sectional images of ITO and In2O3 films with 8 wt % glass additives annealed at 1250 °C with different measuring times. (A,C) ITO film; (B,D) In2O3 film.
3.2. Thermoelectric Properties
To obtain thermoelectric voltages and the Seebeck coefficient of the ITO and In2O3 films, pure platinum wires (Seebeck coefficient 1.67 µV/°C [18]) were attached to the ITO or In2O3 films to form two kinds of ITO–Pt and In2O3–Pt thermocouples, respectively. As shown in Figure 4, the output voltages and Seebeck coefficients were both negative, due to their n-type semiconductor behavior. It can also be seen that, with the increase in temperature to 1150 °C, the absolute value of thermoelectric voltage increased continuously for all samples. For the ITO and In2O3 films with glass additives, the peak values of voltage could reach up to 56.6 mV and 129.7 mV, respectively, which is much higher than those for the samples without glass powder. From Figure 4c,d, the absolute values of the Seebeck coefficient of the ITO and In2O3 films with 8 wt % glass additives increased significantly with the increase of temperature difference. The Seebeck coefficients could reach up to 49.2 µV/°C and 112.3 µV/°C, respectively. The cold junction temperature was not stable and increased slowly from room temperature to 81 °C via natural cooling. The cold junction temperature reached 81 °C when the temperature of the hot junction was 1270 °C. The temperature changes in the cold and hot junctions of the thermocouple in the heating process are not shown here, but can be found in the supporting materials Figure S1.
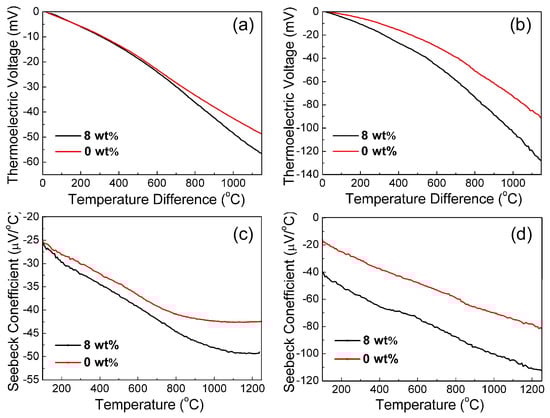
Figure 4.
Thermoelectric properties of ITO and In2O3 films: (a,c) ITO film; (b,d) In2O3 film.
In the heating process of the thermocoples, changes in output voltage can be attributed to the reaction of phonons and electrons. Such interactions are closely dependent on temperature. For non-degenerate semiconductor materials, the Seebeck coefficient is given in Equation (1):
where S is the Seebeck coefficient, ND is the carrier concentration, A is the transport constant, k is the Boltzmann constant, e is the electron charge, is the effective mass, and is Planck’s constant [19]. In a low temperature range, the interactions between phonons and electrons play a major role. The electrons are dragged by phonons along the temperature gradient, resulting in an increase in thermoelectric voltage as temperature difference increases. In a high temperature range, the interactions between phonons and phonons become the main factor, which contributes to the thermal output voltages of the films. At the same time, the electronic flow is inhibited, leading to a slowly increasing Seebeck coefficient, particularly for the ITO films. In addition, the increase in Seebeck coefficient is attributed to the microstructure improved with glass additives, which results in a reduction in charge concentration of the films.
Figure 5 shows the output thermoelectric voltage of the In2O3/ITO thermocouple as a function of temperature difference between the hot junction and the cold junction in a heating process. The peak value of the temperature difference can reach 1198 °C. At the same time, the hot juction temperature can reach 1270 °C. To further describe the relationship between thermoelectric voltage and temperature, a third polynomial term is kept in Equation (2) [20]:

Figure 5.
Thermoelectric voltage of In2O3/ITO thermocouple as a function of temperature difference: (a) without glass additives; (b) with 8 wt % glass additives.
The coefficients of the polynomial are shown in Table 1, and all R2 of the values are more than 0.999. The Seebeck coefficient of the thermocouple can be obtained by Equation (3):
where S is the Seebeck coefficient, ΔT is temperature difference between the hot junction and the cold junction, ΔV is the voltage difference between the ITO and In2O3 materials, and and is the thermoelectric voltage for the ITO and In2O3 films, respectively [19,20,21]. The overall Seebeck coefficients are 39.6 µV/°C (without glass additives) and 44.5 µV/°C (with 8 wt % glass additives).

Table 1.
Polynomials used to describe the thermoelectric output of In2O3/ITO thermocouples with different glass additives.
The Seebeck effect can be attributed to charge–carrier diffusion and phonon drag, which can also be influenced by the microstructure of the electrode materials. The glass additives produce a liquid phase during sintering that can adequately fill the pores between the grains in the ITO and In2O3 films, obviously increasing the densification of the films with the up to 8% increase in glass additive content. When the content of the additives is over than 8%, the change in densification is not obvious, and the microstructure becomes stable. In addition, the growth of In2O3 grains is inhibited when too many glass additives are added (SEM pictures are not shown here, but can be found in the supporting materials Figure S2). On the other hand, the charge–carrier concentrations of the films both slightly decrease at the same time, especially for In2O3 films. The Seebeck coefficient of the In2O3/ITO thermocouple with a different amount of glass additives at 1270 °C is shown in Table 2. The results show that the Seebeck coefficients of the films slightly increase with the up to 8% increase in glass additives, and the maximum Seebeck coefficient is obtained for the sample with the 8 wt % addition of glass additive.
Table 2.
Seebeck coefficients of In2O3/ITO thermocouples with different glass additives measured at 1270 °C.
3.3. Thermal Responses of In2O3/ITO Thin Film Thermocouple
Figure 6 shows the thermoelectric responses of the In2O3/ITO thin film thermocouple. There are three thermal cycles in the measurement process. The first and third cycles just show the thermal response for the different heating temperatures. The second cycle shows the thermal stability at high temperature, while the hot juction is holding at a temperature of 1270 °C for 10 h during the measurement process. The performance of thermal response of the thin films thermocouples can be described by the drift rate (DR), which is defined according to Equation (4):
where DR(T) is the drift rate, is the change in voltage at holding temperature, is the initial voltage when the hot junction reaches the maximum temperature, T is the temperature of the hot junction, and is the holding time [22]. The drift rate of the In2O3/ITO thermocouples with 0 and 8 wt % glass additives are 6.81 °C/h and 5.44 °C/h, respectively, as shown in Table 1. By stabilizing the microstructure of the film, the drift rate can be significantly reduced. In addition, the drifting rate seems to reduce significantly after 45 h of measurement, evidenced by the third voltage peak in Figure 6, not significantly lower than the second one for both samples. This phenomena can be attributed to the stabilization of microstructure also. The 8 wt % glass additives make the ITO and In2O3 films denser, enhance the sintering behavior, lead to the changes in the microstructure of films, and stabilize the characteristics of thermoelectric output. From Figure 6b, the thermoelectric voltage is 51.74 mV at the end of the second cycle. The Seebeck coefficient of the In2O3/ITO thermocouple is calculated as 43.6 µV/°C at the end of the second cycle. In addition, it can be seen in the third thermal cycle that the thin film thermocouple shows excellent response even after a 10 h measuring time in the second cycle.
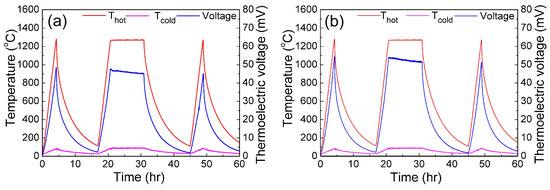
Figure 6.
Thermal responses of the thin film thermocouples: (a) without glass additives; (b) with 8 wt % glass additives.
4. Conclusions
An In2O3/ITO thin film thermocouple has been prepared on an Al2O3 substrate via screen printing. After adding 8 wt % glass powder additives, the In2O3/ITO thin film thermocouple becomes dense and compact, and the evaporation of ITO and In2O3 film is significantly inhibited. By stabilizing the microstructure of the film, the thermoelectric output voltage and reduction in drift rate for the thermocouple with 8 wt % glass powder additives are both significantly improved. The In2O3/ITO thin film thermocouple exhibits a high Seebeck coefficient of 44.5 µV/°C and a small drift rate of 5.44 °C/h for a measuring time of 10 h at temperatures as high as 1270 °C.
Supplementary Materials
The following are available online at http://www.mdpi.com/1424-8220/18/4/958/s1, Figure S1: The temperature changes of the cold and hot junctions of thermocouple in the heating process, Figure S2: SEM surface images of ITO and In2O3 films with different glass additives annealed at 1250 °C for 2 h. (A) ITO film, (B) In2O3 film.
Acknowledgments
This work was financial supported by the National Key Basic Research Program of China granted No. 2015CB057402 and 111 Project of China (B14040). The authors appreciate the support from the International Joint Laboratory for Micro/Nano Manufacturing and Measurement Technologies. We also thank Yijun Zhang for the help in the SEM measurements.
Author Contributions
All the authors conceived and designed the experiments, and analyzed the data.
Conflicts of Interest
The authors declare no conflict of interest.
References
- Yang, J.; Li, M.; Zhang, H.L.; Gao, C.X. Preparation of W-Ta thin-film thermocouple on diamond anvil cell for in-situ temperature measurement under high pressure. Rev. Sci. Instrum. 2011, 82, 045108. [Google Scholar] [CrossRef] [PubMed]
- Godefroy, J.C.; Gageant, C.; François, D.; Portat, M. Thin film temperature sensors deposited by radio frequency cathodic sputtering. J. Vac. Sci. Technol. A Vac. Surf. Films 1987, 5, 2917–2923. [Google Scholar] [CrossRef]
- Char, J.M.; Yeh, J.H. Study on propane flame temperature measurement with infrared technique. Exp. Therm. Fluid Sci. 1993, 7, 154–155. [Google Scholar] [CrossRef]
- Torres, G.B.; Payá-Zafortezaa, I.; Calderón, G.P.A. New fiber optic sensor for monitoring temperatures in concrete structures during fires. Sens. Actuators A Phys. 2017, 254, 116–125. [Google Scholar]
- Tougas, I.M.; Gregory, O.J. Thin film platinum-palladium thermocouples for gas turbine engine applications. Thin Solid Films 2013, 539, 345–349. [Google Scholar] [CrossRef]
- Kenneth, D.H. An investigation of palladium oxidation in the platinum/palladium thermocouple system. Metrologia 2002, 39, 51–58. [Google Scholar]
- Budhani, R.C.; Prakash, S.; Bunshah, R.F. Thin-film temperature sensors for gas turbine engines: Problems and prospects. J. Vac. Sci. Technol. A Vac. Surf. Films 1986, 4, 2609–2617. [Google Scholar] [CrossRef]
- Francis, E.K.; Dan, F.; Li, J.Y. Thin film thermocouple arrays for sliding surface temperature measurement. Wear 1997, 207, 46–54. [Google Scholar]
- Madhu, S.K.M.; Zhao, J.Z.; Li, J.Y.; Pan, H.; Chris, Y.; Li, X.C. In-situ temperature measurement in lithium ion battery by transferable flexible thin film thermocouples. J. Power Sources 2014, 260, 43–49. [Google Scholar]
- Chen, Y.Z.; Jiang, H.C.; Zhao, W.Y.; Zhang, W.L.; Liu, X.Z. Fabrication and calibration of Pt-10% Rh/Pt thin film thermocouples. Measurement 2014, 48, 248–251. [Google Scholar] [CrossRef]
- Kenneth, G.K. Sputtered high temperature thin film thermocouples. J. Vac. Sci. Technol. A Vac. Surf. Films 1993, 11, 1401–1405. [Google Scholar]
- Wrbanek, J.D.; Fralick, G.C.; Zhu, D.M. Ceramic thin film thermocouples for SiC-based ceramic matrix compasites. Thin Solid Films 2012, 520, 5801–5806. [Google Scholar] [CrossRef]
- Ian, M.T.; Matin, A.; Otto, J.G. Metallic and Ceramic Thin Film Thermocouples for Gas Turbine Engines. Sensors 2013, 13, 15324–15347. [Google Scholar]
- Gregory, O.J.; Amani, M.; Tougas, I.M.; Drehman, A.J. Stability and microstructure of indium tin oxynitride thin films. J. Am. Ceram. Soc. 2012, 95, 705–710. [Google Scholar] [CrossRef]
- Dewit, J.H.W. The High Temperature Behavior of In2O3. J. Solid State Chem. 1975, 13, 192–200. [Google Scholar] [CrossRef]
- Sunde, T.O.L.; Einarsrud, M.A.; Grande, T. Solid state sintering of nano-crystalline indium tin oxide. J. Eur. Ceram. Soc. 2013, 33, 565–574. [Google Scholar] [CrossRef]
- Lamoreaux, R.H.; Hildenbrand, D.L.; Brewer, L. High-Temperature Vaporization Behavior of Oxides II. Oxides of Be, Mg, Ca, Sr, Ba, B, Al, Ga, In, Tl, Si, Ge, Sn, Pb, Zn, Cd, and Hg. J. Phys. Chem. Ref. Date 1987, 16, 419–443. [Google Scholar] [CrossRef]
- American Society for Testing and Materials E230/E230M-12. Standard Specification and Temperature- Electromotive Force (EMF) Tables for Standardized Thermocouples; ASTM International: West Conshohocken, PA, USA, 2012. [Google Scholar]
- Zhao, X.H.; Li, H.T.; Chen, Y.Z.; Jiang, H.C. Preparation and thermoelectric characteristics of ITO/Pt thin film thermocouples on Ni-based superalloy substrate. Vacuum 2017, 140, 116–120. [Google Scholar] [CrossRef]
- Gregory, O.J.; Busch, E.; Fralick, G.C.; Chen, X.M. Peparation and characterization of ceramic thin film thermocouples. Thin Solid Film 2010, 518, 6093–6098. [Google Scholar] [CrossRef]
- Zhu, Q.; Hee, S.K.; Ren, Z.F. A rapid method to extract Seebeck coefficient under a large temperature difference. Rev. Sci. Instrum. 2017, 88, 094902. [Google Scholar] [CrossRef] [PubMed]
- Chen, X.; Gregory, O.J.; Amani, M. Thin-film thermocouple based on the system In2O3-SnO2. J. Am. Ceram. Soc. 2011, 94, 854–860. [Google Scholar] [CrossRef]
© 2018 by the authors. Licensee MDPI, Basel, Switzerland. This article is an open access article distributed under the terms and conditions of the Creative Commons Attribution (CC BY) license (http://creativecommons.org/licenses/by/4.0/).