Abstract
Recently, a project was initiated in Japan to transport a large amount of liquid hydrogen (LH2) from Australia to Japan by sea. It is important to understand the sloshing and boil-off that are likely to occur inside an LH2 tank during marine transportation by ship, but such characteristics are yet to be experimentally clarified. To do so, we combined the liquid level detected by five 500 mm long external-heating-type magnesium diboride (MgB2) level sensors with synchronous measurements of temperature, pressure, ship motion, and acceleration during a zigzag maneuver. During this zigzag maneuver, the pressure of gaseous hydrogen (GH2) in the small LH2 tank increased to roughly 0.67 MPaG/h, and the temperature of the GH2 in the small LH2 tank increased at the position of gaseous hydrogen at roughly 1.0 K/min when the maximum rolling angle was 5°; the average rolling and liquid-oscillation periods were 114 and 118 s, respectively, as detected by the MgB2 level sensors, which therefore detected a long-period LH2 wave due to the ship’s motion.
1. Introduction
In 2015, the 21st session of the Conference of the Parties (COP21) to the United Nations Framework Convention on Climate Change was convened in Paris, France. A goal was agreed on for the parties to the Paris Agreement to reduce their greenhouse gas emissions in the post-2020 period. Against this background, hydrogen has been attracting immense attention as a medium for solving global environmental problems and avoiding a future energy crisis, because only water is produced when hydrogen chemically reacts with oxygen. Moreover, hydrogen is highly attractive as a secondary energy medium for renewable energies such as solar and wind power.
In Japan, a country with insufficient energy resources, it is very important to establish where and how to produce hydrogen if hydrogen energy is to become widespread. Currently, hydrogen gas is produced using brown coal from Australia. This hydrogen gas is then liquefied on site because liquid hydrogen (LH2: 20 K) is roughly 800 times denser than gaseous hydrogen (GH2: 300 K, 0.1 MPa). Thus, from now until 2020, large quantities of LH2 will be transported by sea from Australia to Kobe, Japan by a cargo ship equipped with two 1250 m3 LH2 tanks [].
The characteristics of LH2 sloshing and boil-off that occur during marine transportation are yet to be experimentally clarified, despite a similar phenomenon occurring inside tanks of liquefied natural gas (LNG, 112 K). The boil-off is generated by natural heat input in the stationary state, but boil-off by sloshing inside the LH2 tank is added during marine transportation. Sloshing LH2 does not damage the tank because the storage weight is much smaller than that of LNG. However, the amount of LH2 evaporation is 10 times higher than that of LNG because the amount of boil-off gas (BOG) increases as heat is exchanged with the inner wall of the LH2 tank when sloshing occurs inside it []. To reduce the amount of BOG, it is important to study the sloshing characteristics of an LH2 tank.
The external-heating-type superconducting magnesium diboride (MgB2) level sensor for LH2 is highly linear and has high resolution, good reproducibility, and good static and dynamic level-detecting characteristics [,,,,,,,,,]. Moreover, its response time to variations of LH2 level is around 0.1 s, and the difference between the level optically read and that detected by MgB2 level sensors is around 5 mm at a heater input of 9 W [,]. Thus, multiple MgB2 level sensors have been installed inside an LH2 tank to simultaneously measure the liquid level, and these sensors are expected to clarify the sloshing inside an LH2 tank.
The purpose of the present study was to use five 500 mm long external-heating-type MgB2 level sensors to understand the sloshing that occurred inside the LH2 optical cryostat (small LH2 tank) during marine transportation by the training ship Fukae-maru. Previous papers have outlined the first experiments conducted on LH2 transport by the Fukae-maru and have presented qualitative results on the rates of temperature and pressure increase inside its LH2 tank, but with no measurements of liquid level []. In the present paper, we discuss (i) the relationship between the liquid-surface oscillation detected by five MgB2 level sensors and the rates of temperature and pressure increase inside the small LH2 tank; (ii) the relationship between the rolling and pitching angles and the acceleration of the ship; and (iii) the relationship between the liquid-surface oscillation detected by the five MgB2 level sensors and the rolling and pitching periods of the ship during a zigzag maneuver.
2. External-Heating-Type MgB2 Level Sensor
Figure 1 shows the measurement principle of the external-heating-type MgB2 level sensor. A superconducting level sensor utilizes differing electrical resistance R between the liquid phase (R = 0) and the vapor phase (R > 0), meaning that the liquid level can be obtained by measuring the overall electrical resistance of the MgB2 level sensor. However, when exposed to the vapor phase, the sensor is cooled by the evaporated gas, and part of it becomes superconducting. Thus, an external heater is wound in a spiral around the MgB2 wire. The MgB2 wire used in this experiment was 0.32 mm in diameter and reinforced by a CuNi (7:3) sheath. It was fabricated in situ using the powder-in-tube method with a heat treatment of 1 h at 873.15 K. To reduce critical temperature Tc of the MgB2 wire, 10% SiC was added as an impurity to the MgB2 core; as a result, Tc was around 32 K. A polyester-coated Manganin wire of 0.2 mm diameter was wound in a spiral around the MgB2 wire with a pitch of 2 mm for use as an external heater. For this experiment, we manufactured five 500 mm long MgB2 level sensors (denoted as A1, A2, B1, B2, and C), which were cut from three 1.7 m long MgB2 wires (wires A, B, and C). After that, we examined their static and dynamic level-detecting characteristics. The results showed that performance variation among the MgB2 sensors caused by individual differences in the wire rods was minimal, and that these MgB2 level sensors have good reproducibility [,,,].
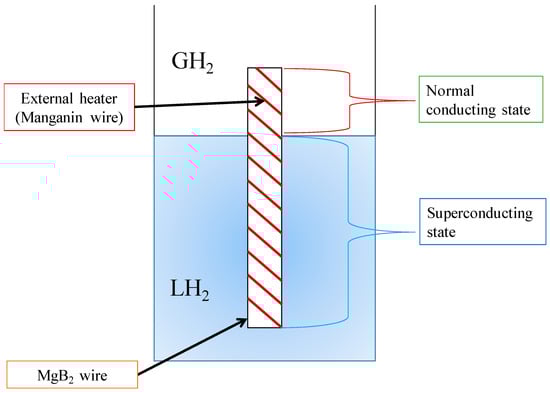
Figure 1.
Principle of the external-heating-type MgB2 level sensor.
3. Apparatus and Method
Figure 2 shows a schematic diagram of the LH2 optical cryostat (small LH2 tank), which comprises a vacuum jacket, an LH2 space (20 L), a liquid nitrogen (LN2) space (15 L), a 77 K aluminum shield, and five optical windows. The optical cryostat is 1327 mm tall, and the optical windows are made of Pyrex glass and have an effective diameter of 60 mm. The natural heat-input power to the LH2 space was found experimentally to be roughly 0.72 W, and that to the LN2 space was roughly 5.8 W when all optical windows were covered with aluminum caps. Figure 3 shows the layout of the five MgB2 level sensors. The bow direction of the ship was equal to the pitch direction, as shown in Figure 3. Sensors B2 and A2 were positioned to detect the liquid-surface oscillation in the roll direction, A1 and C were positioned to detect the liquid-surface oscillation in the pitch direction, and B1 was positioned to detect the liquid-surface oscillation at the center of the small LH2 tank. In addition, all five sensors were fixed with a stainless steel plate and the glass fiber-reinforced plastics (GFRP) rod.
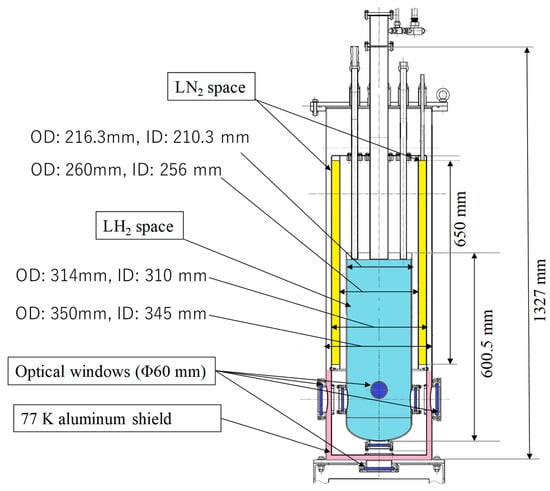
Figure 2.
Schematic diagram of the experimental apparatus.
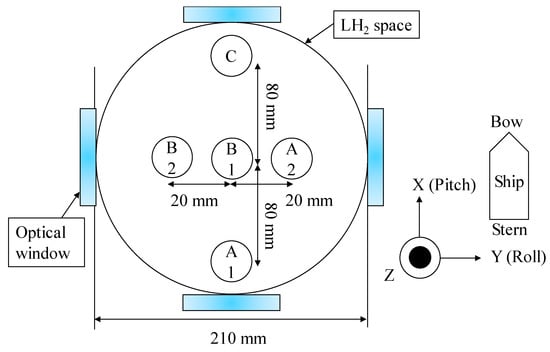
Figure 3.
Layout of the five MgB2 level sensors with a diameter of 0.32 mm.
Figure 4 shows the measurement system. It consists of an optical cryostat (a small LH2 tank), five MgB2 level sensors, two carbon ceramic temperature sensors (CCSs), a digital pressure sensor, current sources for the level sensors and CCSs, a power supply for the external heaters of the level sensors, a data logger (NR-600; Keyence, Osaka, Japan), a GPS-aided microelectromechanical inertial system (NAV440; Memsic, Andover, MA, USA), and a PC. The A and B CCSs were attached to the level-sensor support at distances of 250 and 125 mm, respectively, from the bottom of level Sensor B1. Data regarding liquid level, temperature, and pressure inside the cryostat were obtained by the data logger, and data regarding ship motion (in the form of accelerations in the X, Y, and Z directions) were obtained by the inertial system through a shipboard local area network. All the data were collected synchronously by the PC in conjunction with the GPS clock.
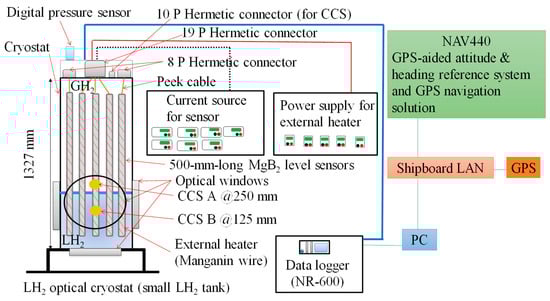
Figure 4.
Measurement system.
Figure 5 shows the setup of the experimental apparatus. Figure 6 shows a photograph of the experimental setup on the afterdeck of the training ship Fukae-maru, which is 50 m long and has a gross weight of 449 tons. All electronic equipment was placed in the onboard measurement room to protect it from possible explosion. In addition, all optical windows were covered with aluminum caps during the marine-transportation test.
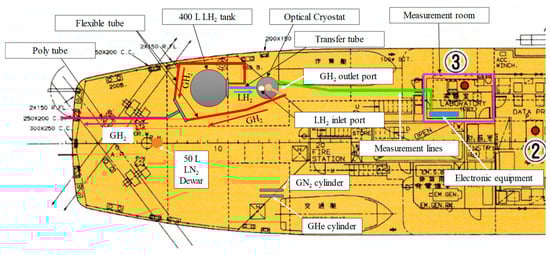
Figure 5.
Setup of the experimental apparatus.
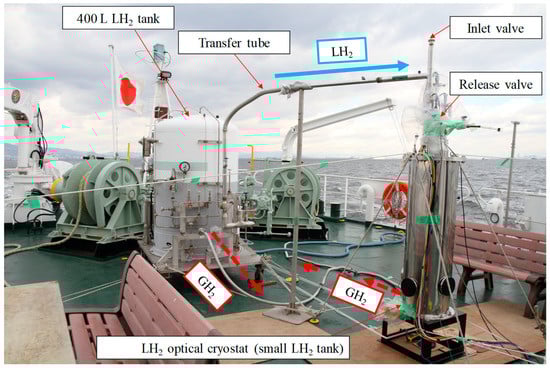
Figure 6.
Photograph of the experimental setup on the afterdeck.
Table 1 provides a time chart of the experimental processes conducted in Osaka Bay on February 2, 2017, and Figure 7 shows the corresponding track chart of the Fukae-maru. In Table 1, test numbers ①–⑥ refer to the experimental processes: ①–③ denote rapid depressurizations of the small LH2 tank with a release valve, ④ denotes drifting with the engine stopped and under the influence of natural wind and waves, ⑤ denotes the zigzag maneuver as shown in Figure 7, and ⑥ denotes a sharp turn at a 360° circle. During ①–⑤, the liquid level detected by the five 500 mm long MgB2 level sensors at a heater input of 9 W was synchronously measured with the temperature and pressure inside the cryostat. Finally, during ⑥, the temperature and pressure were synchronously measured without the liquid level at a heater input of zero under natural heat-input conditions. All the rapid-depressurization tests were conducted by manually opening the release valve after achieving a pressure of around 0.2 MPaG. Tests ① and ⑥ were reported. Herein, we discuss Test ⑤ when the ship motion was maximum with liquid-level measurement.

Table 1.
Time chart of experimental processes conducted inside Osaka Bay.
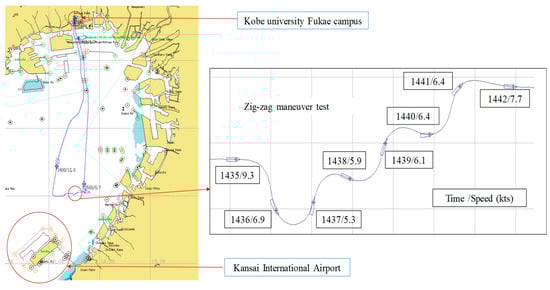
Figure 7.
Track chart of the Fukae-maru inside Osaka Bay.
4. Results and Discussion
To investigate the influence of disturbances, such as onboard noise, we examined the static level-detecting characteristics of the five 500 mm long MgB2 level sensors onboard. We did this by determining the relationship between the sensor output voltage and the liquid level at atmospheric pressure and a heater input of 9 W while we decreased the liquid level (i) from 130 to 85 mm for Sensors A1 and C, and (ii) from 100 to 55 mm for Sensors A2, B1, and B2. The liquid-level ranges observable from the optical windows were 85–130 mm at Sensors A1 and C, and 55–100 mm at Sensors A2, B1, and B2 because the vertical positions of the windows differed in the X and Y directions. In this experiment, we used a four-wire technique to measure sensor output voltage. The onboard and laboratory [] results are compared in Figure 8. This figure shows the linear approximate curved line except the experimental result for ease of viewing. The gradients of the straight lines approximating the onboard and laboratory data agree with each other, as do the relevant Y intercepts. No influence of disturbances can be seen in Figure 8. The results from the other sensors show similar tendencies.
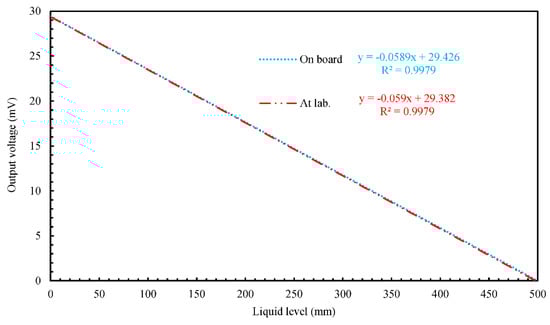
Figure 8.
Comparison of onboard and laboratory results for the static level-detecting characteristics of the 500 mm long MgB2 level sensor A1 at a heater input of 9 W.
Figure 9, Figure 10 and Figure 11 show the experimental results for liquid level, temperature, pressure, ship motion, and accelerations during marine-transportation test ⑤ from 14:28 to 14:42 at 1 s intervals. As shown in Figure 9, the liquid level increased rapidly from around 200 to 220 mm, as indicated by all five MgB2 level sensors. This was due to bumping of the LH2 surface, with the temperature of CCS A at the position of the gaseous phase rapidly decreasing, from around 45 to 21 K after 14:28. This is because mist occurred in the LH2 space. This phenomenon was observed by the naked eye.
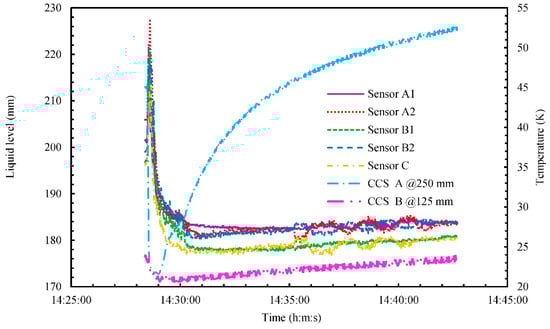
Figure 9.
Time series of liquid level and temperature inside the cryostat during marine-transportation test ⑤ from 14:28 to 14:42.
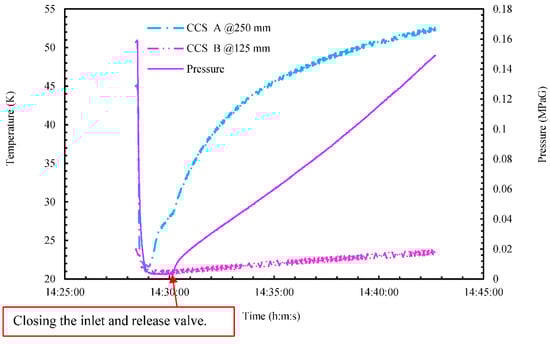
Figure 10.
Time series of temperature and pressure inside the cryostat during marine-transportation test ⑤ from 14:28 to 14:42.
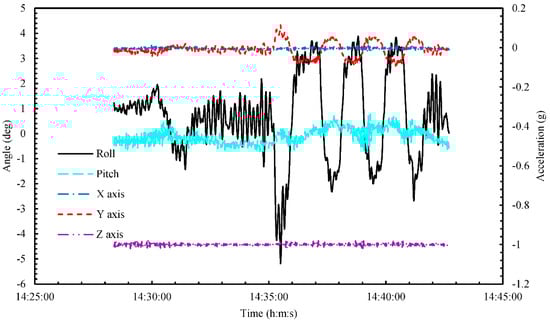
Figure 11.
Time series of angle and acceleration during marine-transportation test ⑤ from 14:28 to 14:42.
At the same time, pressure rapidly decreased from around 0.16 MPaG, as shown in Figure 10. This is because the rapid-depressurization tests were conducted by opening the release valve after 14:28. The pressurization test was started at 14:30 by closing the release valve, as shown in Figure 10. During the zigzag maneuver after 14:35, all five MgB2 level sensors detected sloshing inside the small LH2 tank, as shown in Figure 9. At the same time, as shown in Figure 11, the ship moved with a maximum rolling angle of around 5°, a maximum pitching angle of around 0.8°, and a maximum Y-direction (i.e., the roll direction) acceleration of roughly 0.1 g, where g is acceleration due to gravity. In this experiment, the rolling and pitching angles were small because the experimental area was an inland sea in Osaka Bay. By comparison, the maximum rolling and pitching angles of the training ship on the open sea are around 25° and 20°, respectively. During the zigzag maneuver (14:35–14:41), pressure increased to roughly 0.67 MPaG/h, and CCS A temperature increased to roughly 1.0 K/min, as shown in Figure 10. By comparison, for about zero rolling and pitching angles (Tests ①–④), pressure increased to roughly 0.45 MPaG/h and CCS A temperature increased to roughly 2.2 K/min. We reason that the higher rate of pressure during the zigzag maneuver was due to sloshing inside the small LH2 tank, which increased the amount of BOG as heat was exchanged with the inner wall of the tank. On the contrary, the lower rate of the temperature of CCS A during the zigzag maneuver was due to cooling GH2 inside the small LH2 tank by the amount of BOG.
In the case of all five external heater input values being 0 W (without liquid-level measurement), pressure increased to roughly 0.15 MPaG/h and CCS A temperature increased to roughly 1.1 K/min with a maximum rolling angle of six degrees, and a maximum pitching angle of two degrees in the Test ⑥ [].
In addition, the temperature of CCS B located within liquid phase increased from 22 to 24 K with the increased pressure after 14:30. This means that the saturation temperature of the LH2 increased with increasing the pressure of the small LH2 tank.
Figure 12 shows the time series of the liquid level and rolling angle during the zigzag maneuver (14:35–14:42). In this figure, the error bar of liquid level and rolling angle were omitted to understand the time variation. To clarify the relationship between liquid level and rolling angle, we used the rolling angle and the results from Sensors A2 and B2. As shown in Figure 12, the rolling signal was in phase with that of Sensor A2, and out of phase with that of Sensor B2. The average rolling period was 114 s, and the average liquid oscillation period was 118 s at the positions of Sensors A2 and B2. Figure 13 shows the time series of the liquid level and pitching angle during the zigzag maneuver (14:35–14:42). In this figure, the error bar of liquid level and pitching angle were omitted to understand the time variation. To clarify the relationship between liquid level and pitching angle, we used the pitching angle and results from Sensors A1 and C. As shown in Figure 13, the Sensors A1 and C can be detected the small liquid oscillation with small pitching angle.
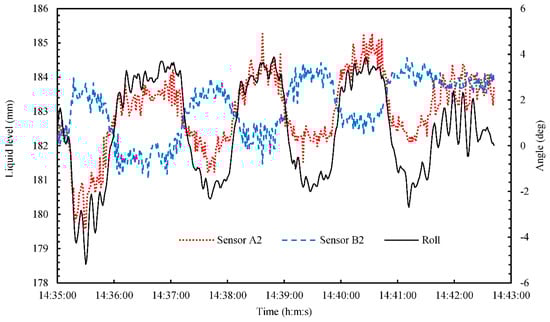
Figure 12.
Time series of the liquid level and rolling angle during a zigzag maneuver from 14:35 to 14:42.
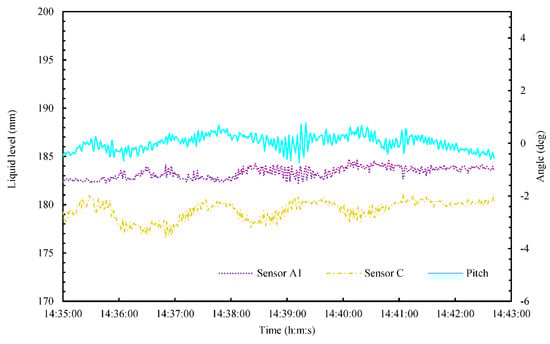
Figure 13.
Time series of the liquid level and pitching angle during a zigzag maneuver from 14:35 to 14:42.
5. Summary
The first experiments on LH2 marine transportation by the training ship Fukae-maru were carried out successfully with the measurement of the liquid level inside the small LH2 tank using five 500 mm long external-heating-type MgB2 level sensors. We synchronously measured the liquid level, temperature, pressure, ship motion, and accelerations during a zigzag maneuver. It was found that sloshing inside the small LH2 tank affected the rates of temperature and pressure increase during the zigzag maneuver, for which the maximum rolling angle was 5°. Moreover, the level sensors detected a long-period LH2 wave due to the ship’s motion. In this experiment, the rolling and pitching angles remained small because the experimental area was an inland sea in Osaka Bay. As future work, to clarify the influence of sloshing inside an LH2 tank in rough seas, we plan to perform experiments in the open sea.
Author Contributions
Conceptualization, K.M. and M.T.; Methodology, K.M. and M.T.; Formal Analysis, K.M.; Investigation, K.M., M.T. and H.K.; Data Curation, Y.M.; Writing-Original Draft Preparation, K.M.; Writing-Review and Editing, K.M. and M.T.; Supervision, M.T.
Funding
This research was funded by Kansai Research Foundation for Technology Promotion grant number 2016R030.
Acknowledgments
The authors would like to thank Professor Captain Yoshiji Yano and Professor Nobukazu Wakabayashi for helpful discussions and technical support.
Conflicts of Interest
The authors declare no conflict of interest.
References
- Kamiya, S.; Nishimura, M.; Harada, E. Study on Introduction of CO2 Free Energy to Japan with Liquid Hydrogen. Phys. Procedia 2015, 67, 11–19. [Google Scholar] [CrossRef]
- Takeda, M.; Matsuno, Y.; Kodama, I.; Kumakura, H. Characteristics of MgB2 sensor for detecting level of liquid hydrogen. AIP Conf. Proc. 2008, 985, 933–939. [Google Scholar]
- Takeda, M.; Matsuno, Y.; Kodama, I.; Kumakura, H.; Kazama, C. Application of MgB2 Wire to Liquid Hydrogen Level Sensor—External-Heating-Type MgB2 Level Sensor. IEEE Trans. Appl. Supercond. 2009, 19, 764–767. [Google Scholar] [CrossRef]
- Maekawa, K.; Takeda, M.; Matsuno, Y.; Fujikawa, S.; Kuroda, T.; Kumakura, H. Thermal response of MgB2 level sensor for liquid hydrogen using external heater. In Proceedings of the 24th International Cryogenic Engineering Conference and International Cryogenic Materials Conference (ICEC24-ICMC2012), Fukuoka, Japan, 14–18 May 2012; pp. 59–62. [Google Scholar]
- Takeda, M.; Fujikawa, S.; Matsuno, Y.; Maekawa, K.; Kuroda, T.; Kumakura, H. Synchronous measurements of liquid level, temperature and pressure inside a 2000 liter liquid hydrogen tank during a truck transportation. In Proceedings of the 24th International Cryogenic Engineering Conference and International Cryogenic Materials Conference (ICEC24-ICMC2012), Fukuoka, Japan, 14–18 May 2012; pp. 311–314. [Google Scholar]
- Maekawa, K.; Takeda, M.; Matsuno, Y.; Fujikawa, S.; Kuroda, T.; Kumakura, H. Optimization of External-heating-type MgB2 Level Sensor for Liquid Hydrogen. TEION KOGAKU 2014, 49, 69–75. [Google Scholar] [CrossRef]
- Maekawa, K.; Takeda, M.; Matsuno, Y.; Fujikawa, S.; Kuroda, T.; Kumakura, H. Effect of Sensor Length on Thermal Response of External-heating-type MgB2 Level Sensor for Liquid Hydrogen. J. Jpn. Inst. Mar. Eng. 2014, 49, 547–553. [Google Scholar] [CrossRef]
- Takeda, M.; Nara, H.; Maekawa, K.; Fujikawa, S.; Matsuno, Y.; Kuroda, T.; Kumakura, H. Simulation of Liquid Level, Temperature and Pressure Inside a 2000 Liter Liquid Hydrogen Tank During Truck Transportation. Phys. Procedia 2015, 67, 208–214. [Google Scholar] [CrossRef]
- Maekawa, K.; Takeda, M.; Matsuno, Y.; Fujikawa, S.; Kuroda, T.; Kumakura, H. Fundamental Study of Tank with MgB2 Level Sensor for Transportation of Liquid Hydrogen. Phys. Procedia 2015, 67, 1164–1168. [Google Scholar] [CrossRef]
- Takeda, M.; Inoue, Y.; Maekawa, K.; Matsuno, Y.; Fujikawa, S.; Kumakura, H. Superconducting characteristics of short MgB2 wires of long level sensor for liquid hydrogen. IOP Conf. Ser. Mater. Sci. Eng. 2015, 101, 12156. [Google Scholar] [CrossRef]
- Maekawa, K.; Takeda, M.; Matsuno, Y.; Fujikawa, S.; Kuroda, T.; Kumakura, H. Individual Difference Performance Evaluation of External-heating-type MgB2 Level Sensor for Liquid Hydrogen. TEION KOGAKU 2015, 50, 368–373. [Google Scholar] [CrossRef]
- Maekawa, K.; Takeda, M.; Matsuno, Y.; Fujikawa, S.; Kuroda, T.; Kumakura, H. Fundamental Study of Sloshing inside Liquid Hydrogen Tank with External-Heating-Type MgB2 Level Sensors for Marine Transportation. J. Jpn. Inst. Mar. Eng. 2016, 51, 383–389. [Google Scholar] [CrossRef]
- Maekawa, K.; Takeda, M.; Hamaura, T.; Suzuki, K.; Matsuno, Y.; Fujikawa, S.; Kumakura, H. Dynamic Level-Detecting Characteristics of External-Heating-Type MgB2 Liquid Hydrogen Level Sensors under Liquid Level Oscillation and Its Application to Sloshing Measurement. IEEE Trans. Appl. Supercond. 2017, 27, 9000304. [Google Scholar] [CrossRef]
- Maekawa, K.; Takeda, M.; Hamaura, T.; Suzuki, K.; Miyake, Y.; Matsuno, Y.; Fujikawa, S.; Kumakura, H. First experiment on liquid hydrogen transportation by ship inside Osaka bay. IOP Conf. Ser. Mater. Sci. Eng. 2017, 278, 12066. [Google Scholar] [CrossRef]
© 2018 by the authors. Licensee MDPI, Basel, Switzerland. This article is an open access article distributed under the terms and conditions of the Creative Commons Attribution (CC BY) license (http://creativecommons.org/licenses/by/4.0/).