1. Introduction
Recently, with the rapid development of wearable sensor environments, a human activity recognition (HAR) with consistently collected daily data and various learning classifiers has become a popular issue: a vision-based recognition using a camera [
1], recognition of five daily activities with acceleration data from a mobile phone and vital signs [
2], and recognition with acceleration data from a chest-wearable device [
3], and so on. However, despite mature studies and analyses on simple actions, like walking, standing, or sitting, complex activities that are composed of many low-level contexts and show various sensor patterns with respect to the background contexts have not been deeply studied yet [
4].
In this paper, we propose a method which recognizes the eating activities in real life. Providing automatically information related with eating activities, such as the time and duration of eating activities, is crucial for healthcare management systems for people, in general, automatic monitoring for patients, such as diabetics, whose eating activities should be carefully managed, or the elderly who live alone, and so on. Although there are already plentiful studies recognizing simple eating and other daily activities, their approach did not catch the very large variety of activities in real life and are, therefore, difficult to extend to real situations. Eating activities could be a very complicated activity to recognize using sensors, especially with limited low-power sensors, as it could have different sensor patterns with respect to different backgrounds and spatial/temporal contexts. In this paper, we propose a probabilistic method, especially the Bayesian network, which is based on the idea that those complexities might be handled better with a probabilistic approach.
The paper is organized as follows: In
Section 2, we provide some analyses to show the complexity of eating activities based on the real-life logging, and specify requirements to deal with those issues. In
Section 3, we explore HAR-related works using low-level sensor data, and related theories analyzing components of human activity. In
Section 4, we explain how to construct Bayesian networks in further detail, and verify their realistic usefulness in a variety of angles in
Section 5. Finally,
Section 6 concludes the paper and discusses future works.
2. Background
Before further discussions, we have collected the sensor data of 10 daily activities, including eating activities, from 25 subjects (detailed specifications are provided in
Section 5) equipped with the wrist-wearable device and a smartphone with sensors (see
Section 4.1), and have analyzed to ascertain the complexity of eating activities and show the requirements for the eating activity recognizer to be useful in the real world.
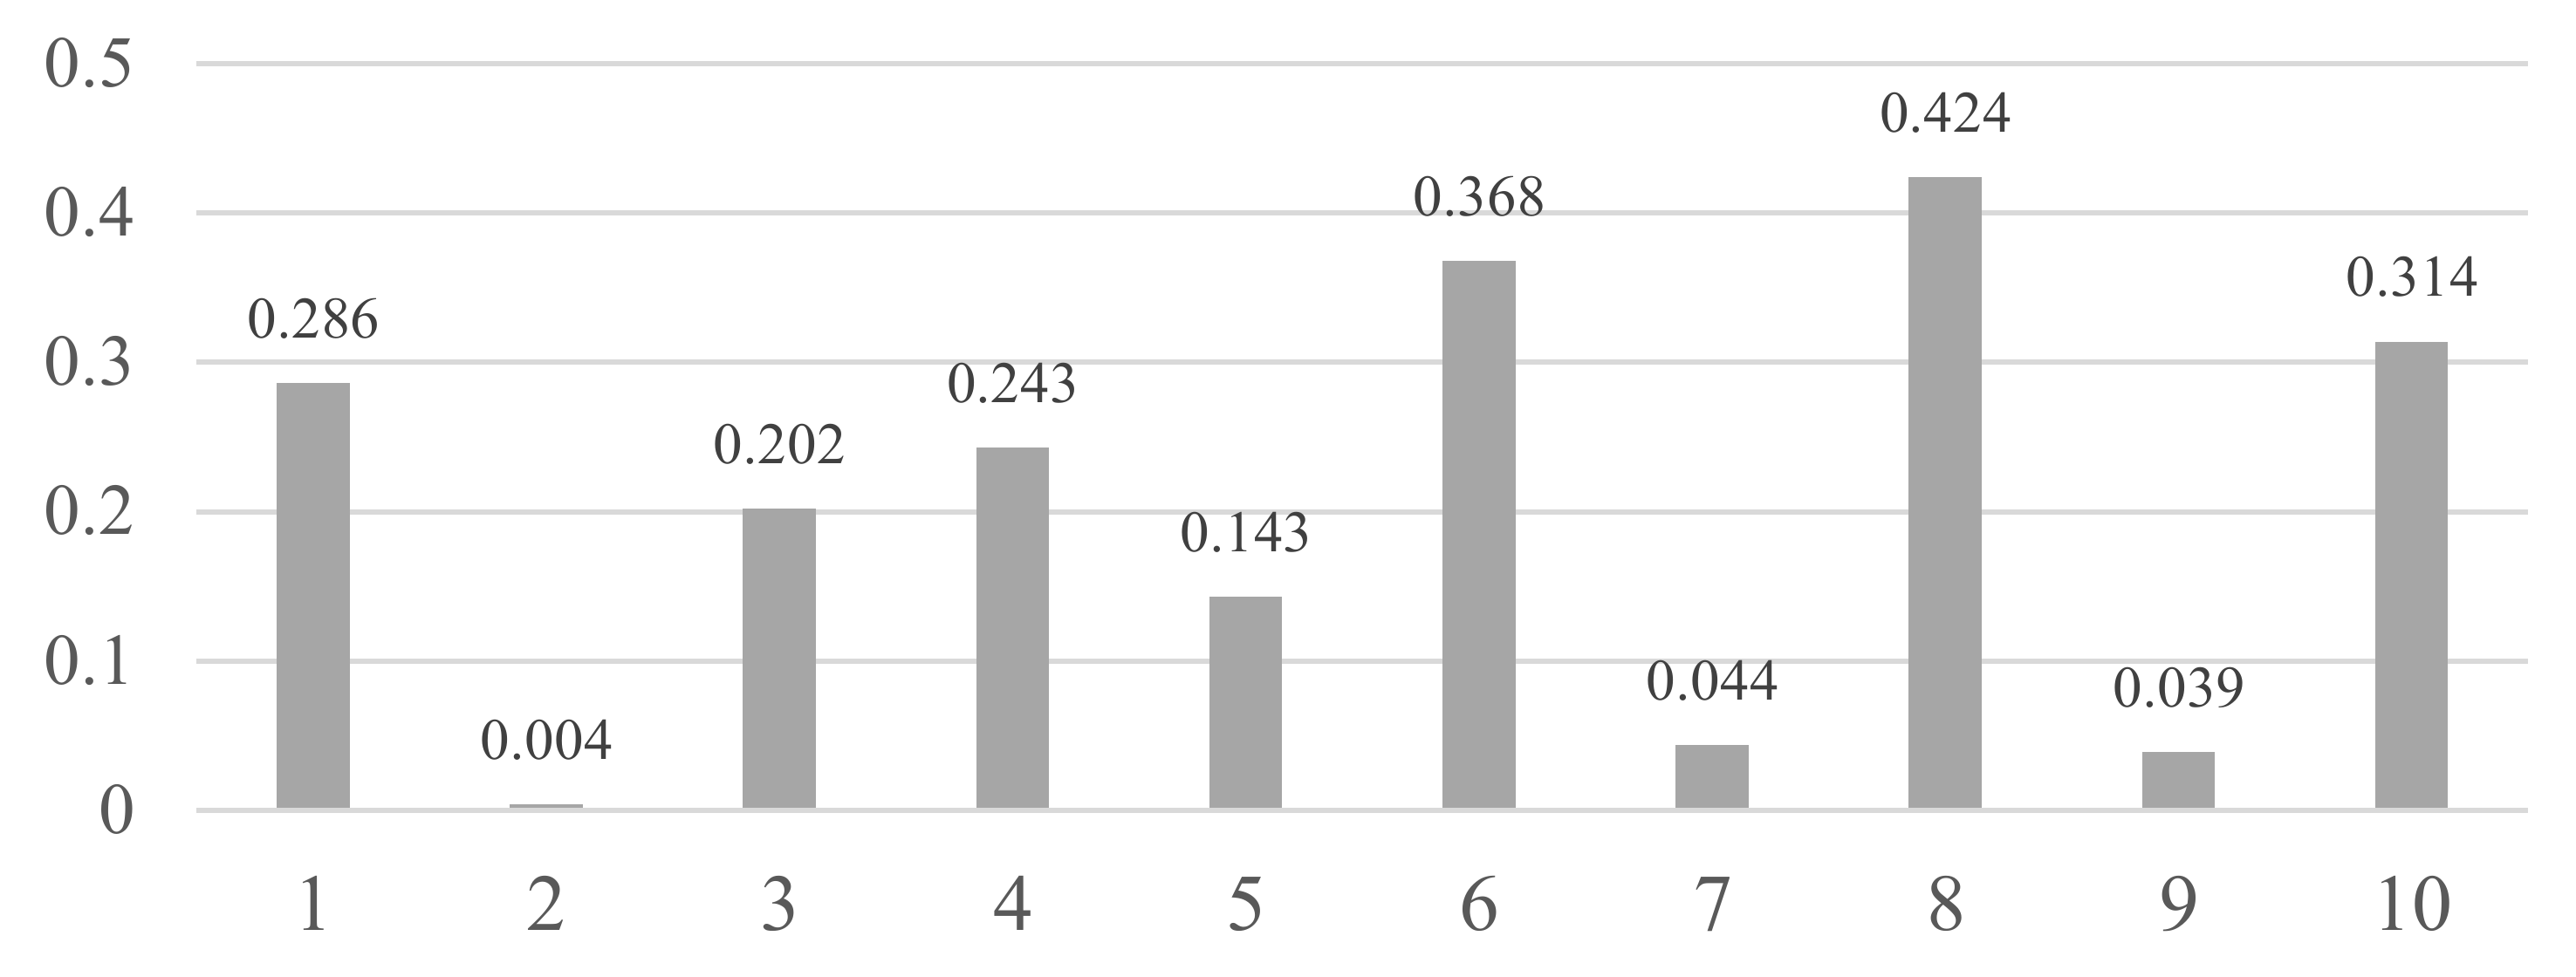
Table 1 shows the correlation scores of each attribute with respect to the class (darker color indicates higher value). Since we had collected the various eating activities, such as eating chicken with a fork, or a sandwich with a hand, eating activities of a baby, and so on, each attribute itself showed very low correlation scores. Despite the popular adoption and relatively high performance of accelerometers, the scores of ‘h_acc’s (‘h’ for a hand, ‘acc’ for an accelerometer) are considerably low, even lower than those of the environmental attributes (‘lux’ for illuminance, ‘temp’ for temperature, ‘hum’ for humidity), except the ‘h_acc_y’ which measures the back-and-forth motion of the hand when eating. The scores of ‘acc’s are considerably high compared to other attributes, but they are also fairly low and largely caused by the constraints that the collection was not done with the user’s phone and they usually did not use the phone. Considering many people operate their smartphone while eating, it is rational to expect that those scores would be lower, like ‘h_acc’s.
Table 2 shows the correlation matrix of the attributes (darker color indicates higher value), which also shows very low value, except ‘h_acc_x’ and ‘h_acc_y’, and ‘acc’s.
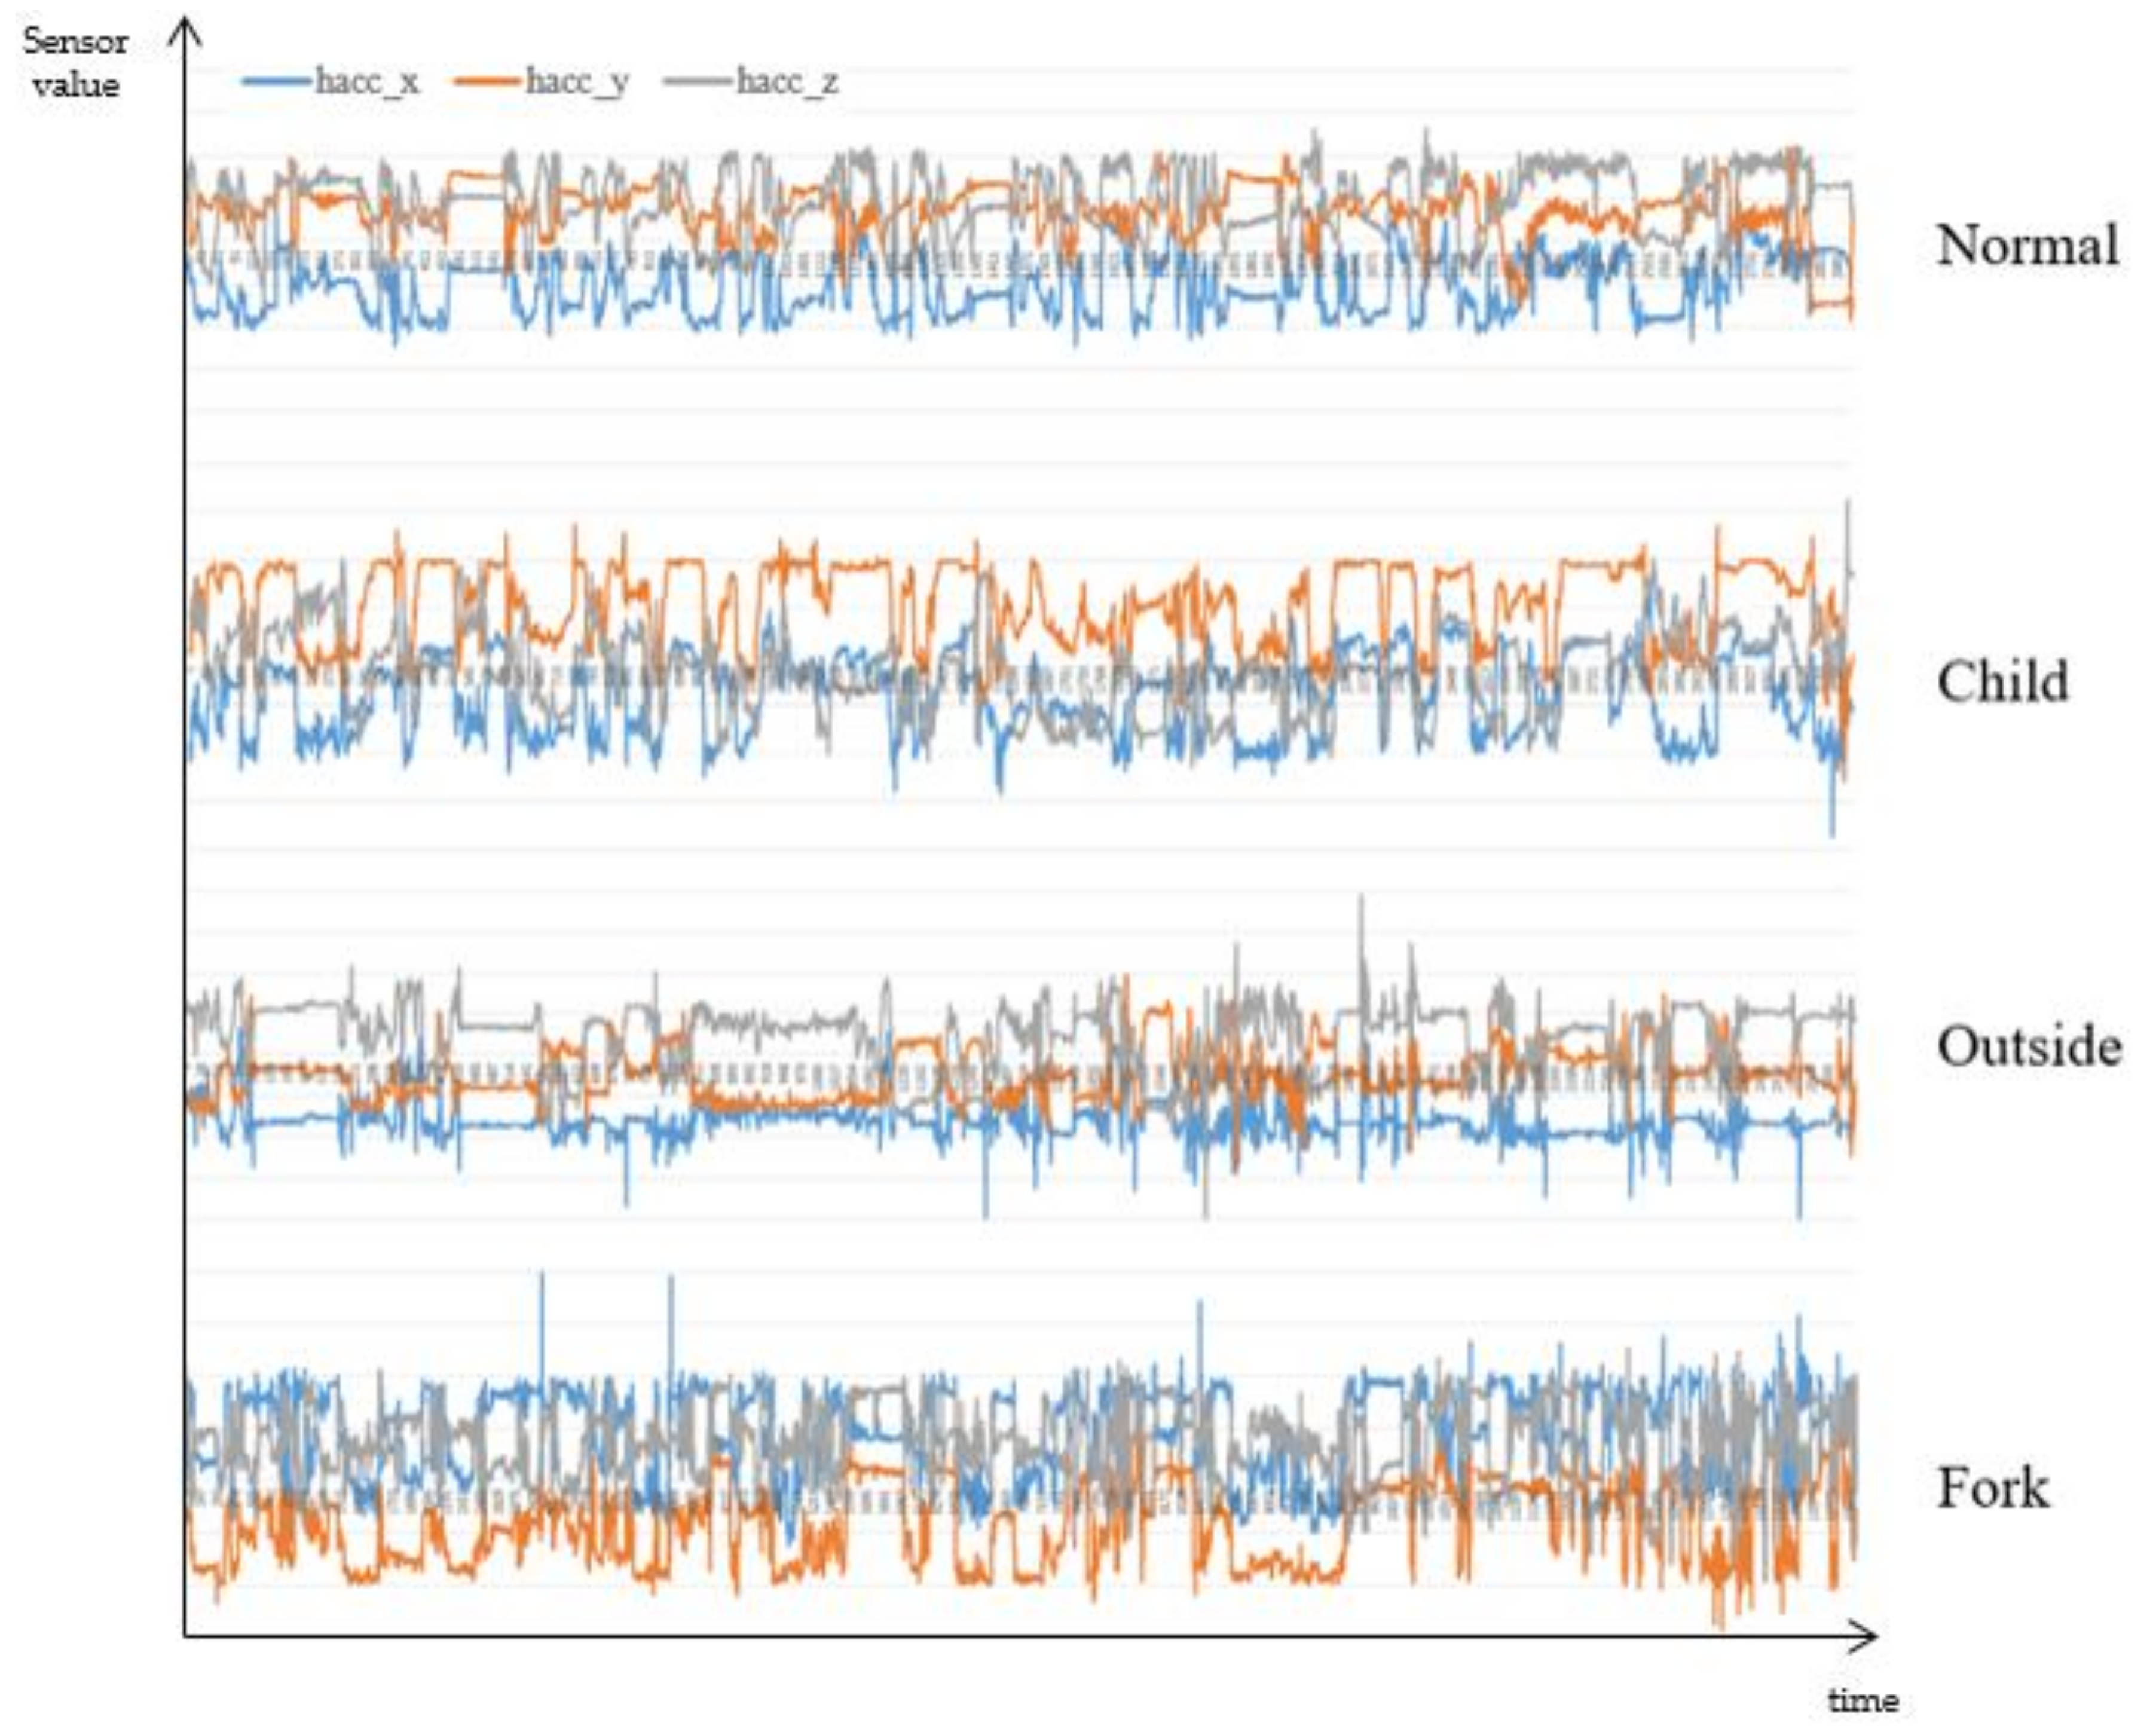
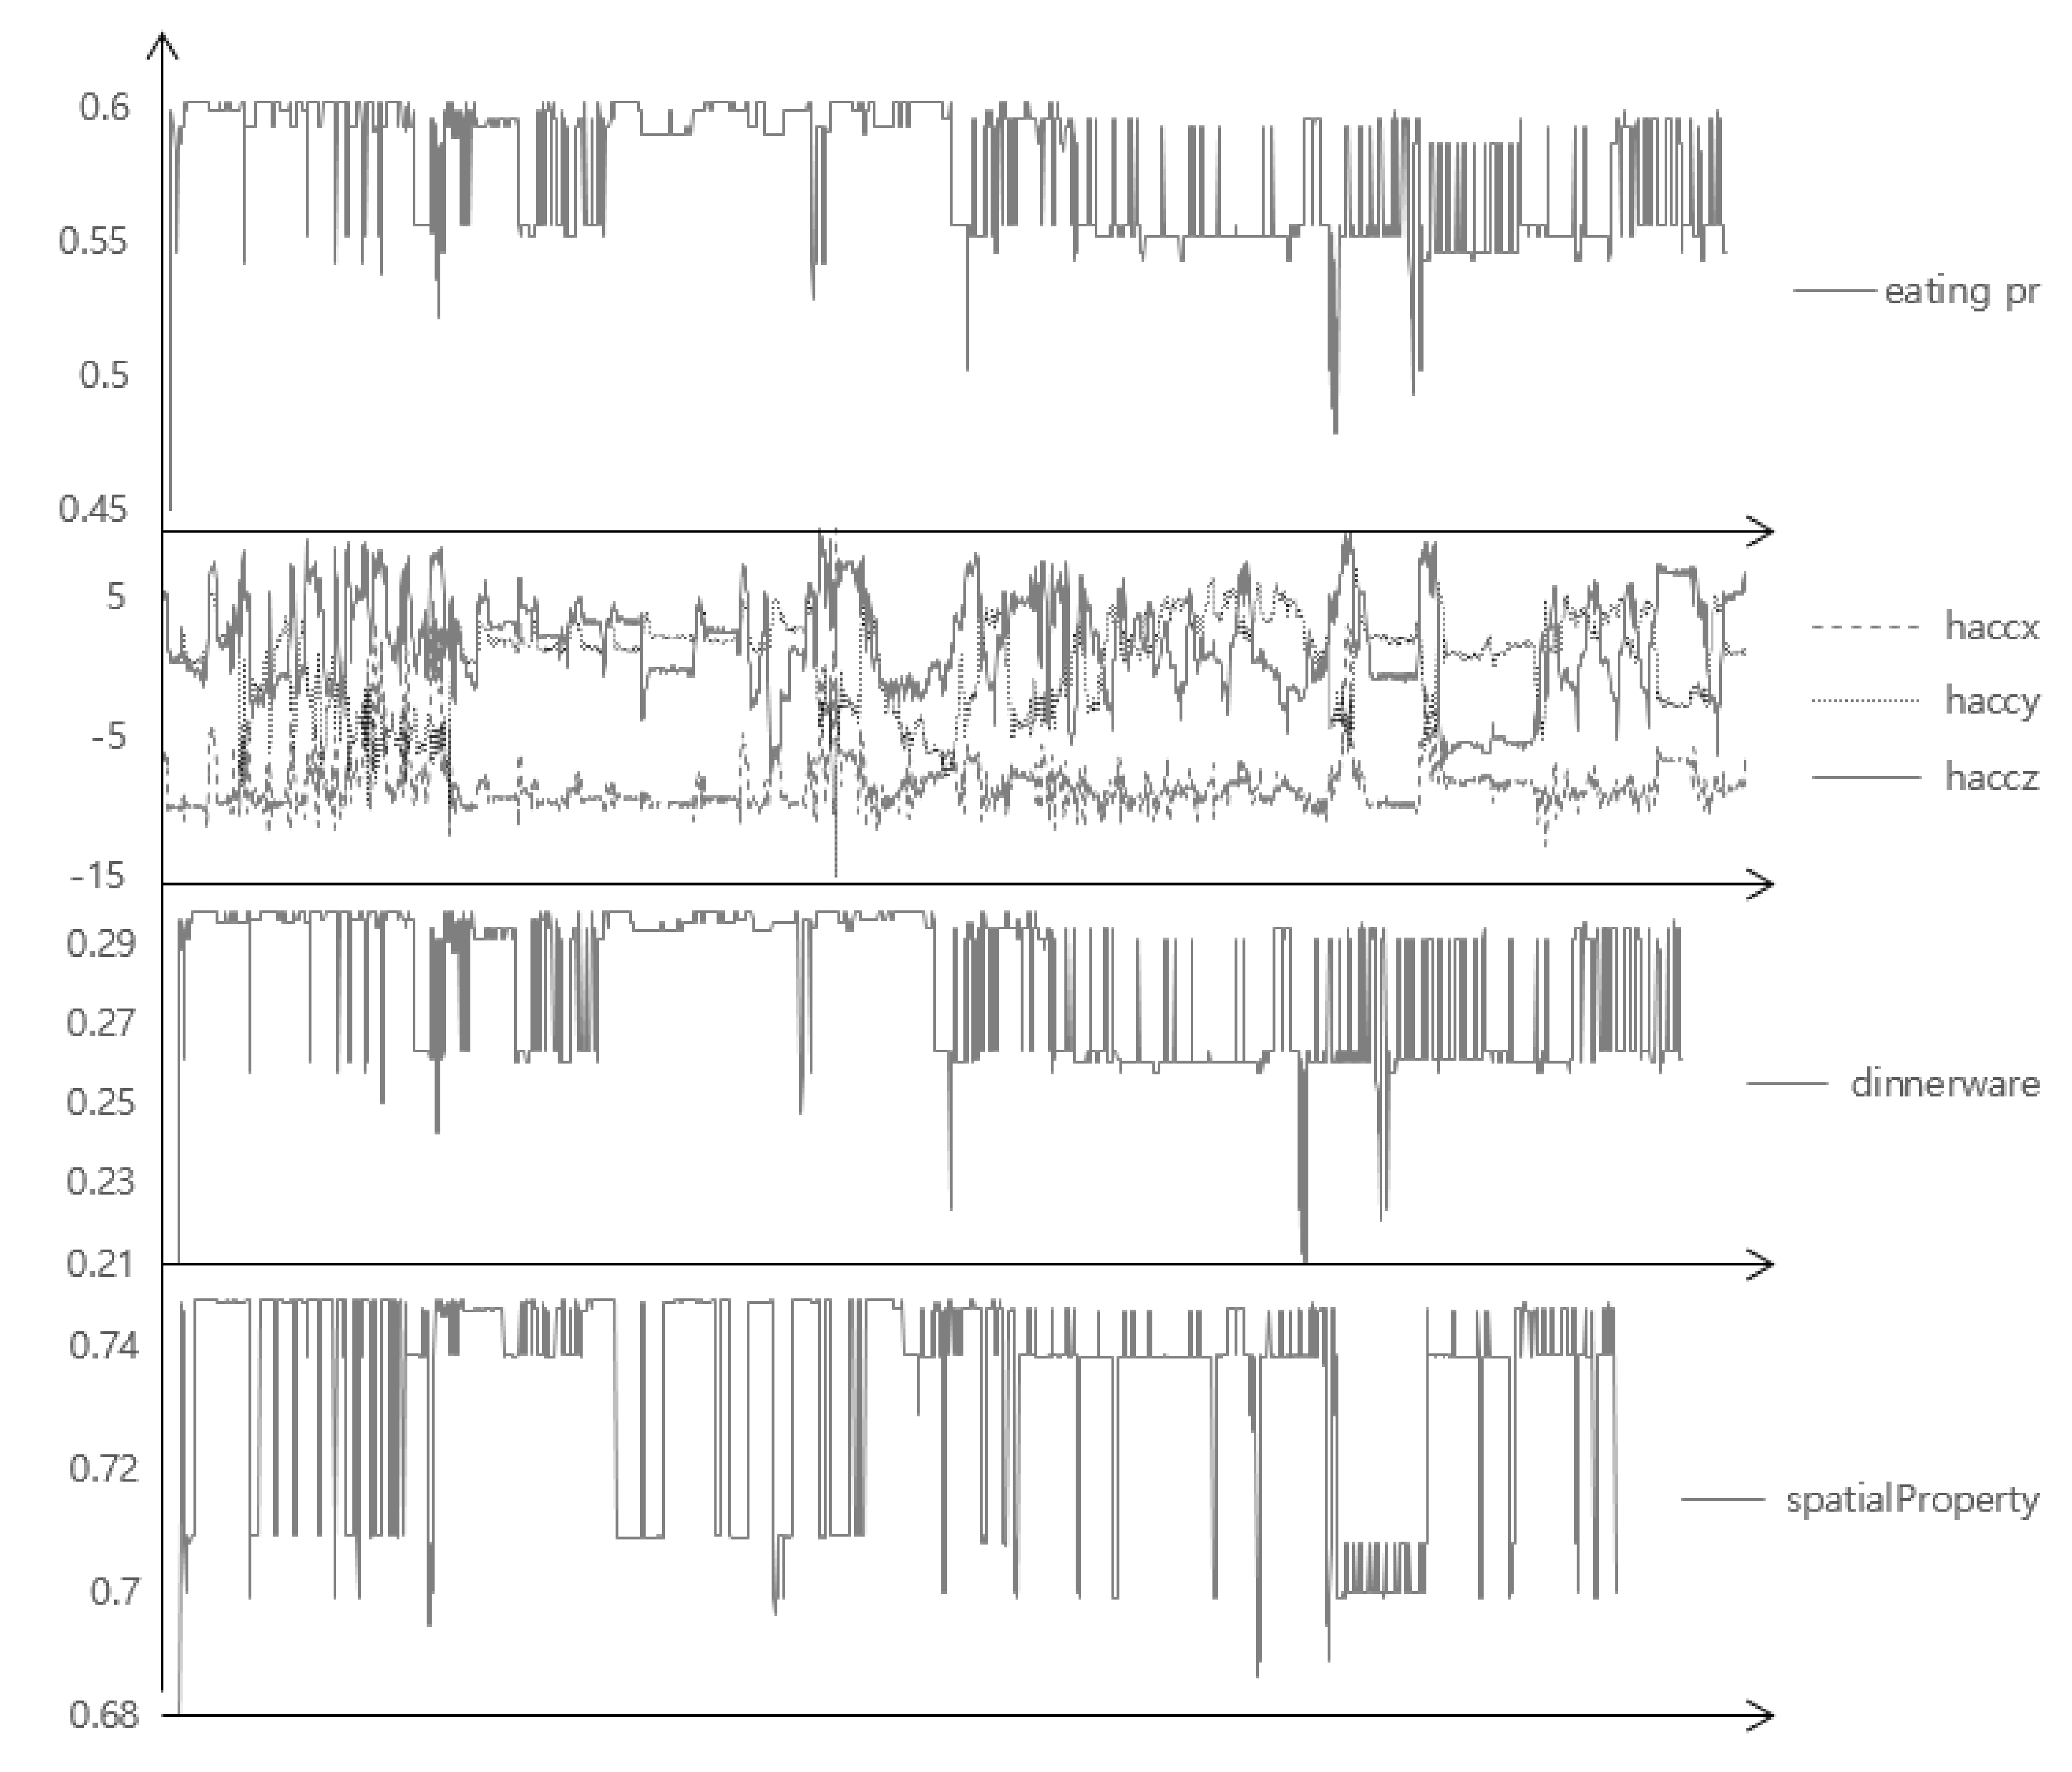
Figure 1 shows a more specific example of a three-axis accelerometer value of the hand of four different eating activities. Even with a glimpse of observation, there are considerably different patterns: ‘h_acc_y’ of the child is comparably low as the position of the food is higher for them; the variance of all values is low when eating outside, as the user grabbed a sandwich and did not move his hand frequently; ‘h_acc_x’ is much higher than other cases when eating chicken using a fork, as the user tore on the left and right sides, and so on. In addition to the value of the sensor located on the wrist, the value of the smartphone sensor could be more unpredictable and variable as the smartphone could be anywhere while eating: in the pocket, on the table, in the hand, and so on. These could imply that the recognizer may require (i) manual modeling of activity instead of using the sensor value itself, or automatically extracted features with a learning classifier; (ii) a probabilistic reasoning that infers various kinds of contexts occurring probabilistically. In addition to the precise recognition itself; (iii) the constraint of the power and memory consumption of sensors; and (iv) the obtrusiveness to the user should be considered for the practical usage [
5], as a recognizer should collect and recognize continuously without charging and too high a battery consumption could restrict the usage of devices for the original purpose.
To fulfill those requirements, the proposed method (i) uses only five types of low-power sensors attached to the smartphone and the wrist-wearable device (
Figure 2); (ii) is built on the context model of an eating activity which could represent the composition of complex eating activities, based on theoretical background and domain knowledge; and (iii) uses the Bayesian network (BN) for probabilistic reasoning, with a tree-structured and modular design approach to increase the scalability and reduce the cost for inference and management. Our contributions are as follows: (i) obtain and describe the complexity of real activities and the limitations of typical learning algorithms using real complex data; (ii) recognize the activity using only low-power and easily-accessible sensors; (iii) propose the formal descriptive model based on the theoretical background and show its usefulness; and (iv) provide the various experiments and analyses using a large amount of data from 25 different volunteers with 10 activities and various features.
3. Related Works
Approaches for human activity recognition can be classified as two categories in terms of the location of sensors: external sensors and internal sensors [
5]. Using external sensors, such as surveillance cameras for intrusion detection, a set of thermometers, hygrometers, or motion detectors for a smart home, is a primary approach. However, the internal sensor approach is more suitable for eating activity recognition because (i) the external sensor approach cannot track the user as sensors are generally fixed at a specific location; (ii) a user-centered sensor environment is better than a location-centered sensor environment for personalized context-aware services; and (iii) personal sensor data could be abused for intruding privacy. For these reasons, we have chosen the internal sensor approach using a mobile and wearable device that can be widely used in daily life.
Table 3 shows recent studies of the internal sensor approach for human activity recognition using various sensors and methods. Three-axis accelerometers are most widely used for the activities deeply related with a user’s motion. However, accelerometers may not enough for the source of information when a recognizer attempts to recognize a complex activity. Bao et al. tried to recognize 20 daily activities using accelerometers attached to five locations [
6]. In his experiment, accuracies of complex activities, such as stretching (41.42%), riding an elevator (43.58%), or riding an escalator (70.58%), were far lower than other simple activities, and showed larger deviations between people, or even in one person. This implies that complex activities with a great variety of different patterns may need more sensors, such as hygrometers or illuminometers, for environmental information. Cheng et al. recognized daily activities including food/water swallowing, using electrodes attached to the neck, chest, leg, and wrist [
7]. Although it seems fairly reasonable using electrodes attached to the neck or chest for eating activity recognition, and they recognized various complex activities with better than 70% accuracy, their sensor environment might be uncomfortable in daily life. Obtrusiveness of the user should be concerned for the daily activity recognizer to be practical [
8]. If the construction cost of the sensor environment is very high, or a user feels very uncomfortable wearing those devices, the recognizer is difficult to be used, generally. Thus, the composition and location of sensors must be acceptable for daily life. In addition, the energy consumption for sensor data collection should also be reasonable: if a smartphone will be run out of power after recognizing for just a few hours, not many people will want to use it. For this reason, it is difficult to use non low-power sensors, like the Global Positioning System (GPS) or gyroscopes.
There are also many issues for feature extraction and classification. A large number of studies used statistical indices directly calculated from the sensor data value, such as the mean, standard deviation, energy, entropy, and so on. For complex activities, like eating or drinking, manual observation for patterns has also been conducted [
7]. As shown in
Figure 1, and studies in
Table 3, sensor values could have a large deviation between people with various ages, genders, cultures, or even in one person. We attempted to find and construct the general context model for activity recognition based on the “Five Ws” (who, what, when, where, and why) and activity theory. The Five Ws are a publicly well-known and self-explanatory method to analyze and explain a situation for humans, so it can give a more understandable result [
11]. Marchiori attempted to classify a very large amount of data on the World Wide Web based on Five Ws, and Jang used the Five Ws to define a dynamic status of a resident in a smart home [
11,
12]. Although the Five Ws give us a systematic and widely-agreed method of describing a situation, it is too abstract to apply directly to low-level sensor data. For example, eating a lunch at a restaurant cannot be directly recognized by acceleration or temperature. It should be embodied in a measurable level like ‘correspondence of the space illumination’. Activity theory gives more specific evidence on how an activity should be composed. Nardi compared an activity theory with situated action models and a distributed cognition approach to systemically understand a structure of human activity and situation [
13]. According to activity theory, a human activity consists of a subject, which includes human(s) in that activity, an object as a target object of the subject, which induces a subject to a special aim, an action that subject must perform in order to achieve the intended activity, and an unconsciously and repetitively occurring operation while doing an activity [
14]. While action theory is primarily to examine the individual’s own behavior as an analysis unit, situated action theory focuses on the relevance of actors and environmental factors at the moment of occurrence of the activity [
15,
16]. According to this theory, defining a human activity systemically should sufficiently consider environmental factors which can fluctuate dynamically [
13]. In our proposed model, subject properties represent emergent properties of an eating person, which can be subclassified as an action and an operation. To deal with environmental factors, we use spatial and temporal properties independently.
For the classifiers for human activity recognition, learning approaches, such as decision trees, hidden Markov models, naïve Bayes, and nearest neighbor, are dominant. A large number of studies show a high accuracy for many daily activities (
Table 1). However, as an activity becomes complex, or the number of subjects increases, many deterministic classifiers may not give good accuracy: Tapia et al. recognized various exercising activities and obtained over 90% accuracy for one subject, but 50–60% for many subjects. Vinh et al. used a probabilistic approach, a semi-Markov conditional random field, and showed good accuracy for complex activities, including dinner, lunch, and so on [
10]. In this paper, we propose the Bayesian network that learns its conditional probability table for the probabilistic approach.
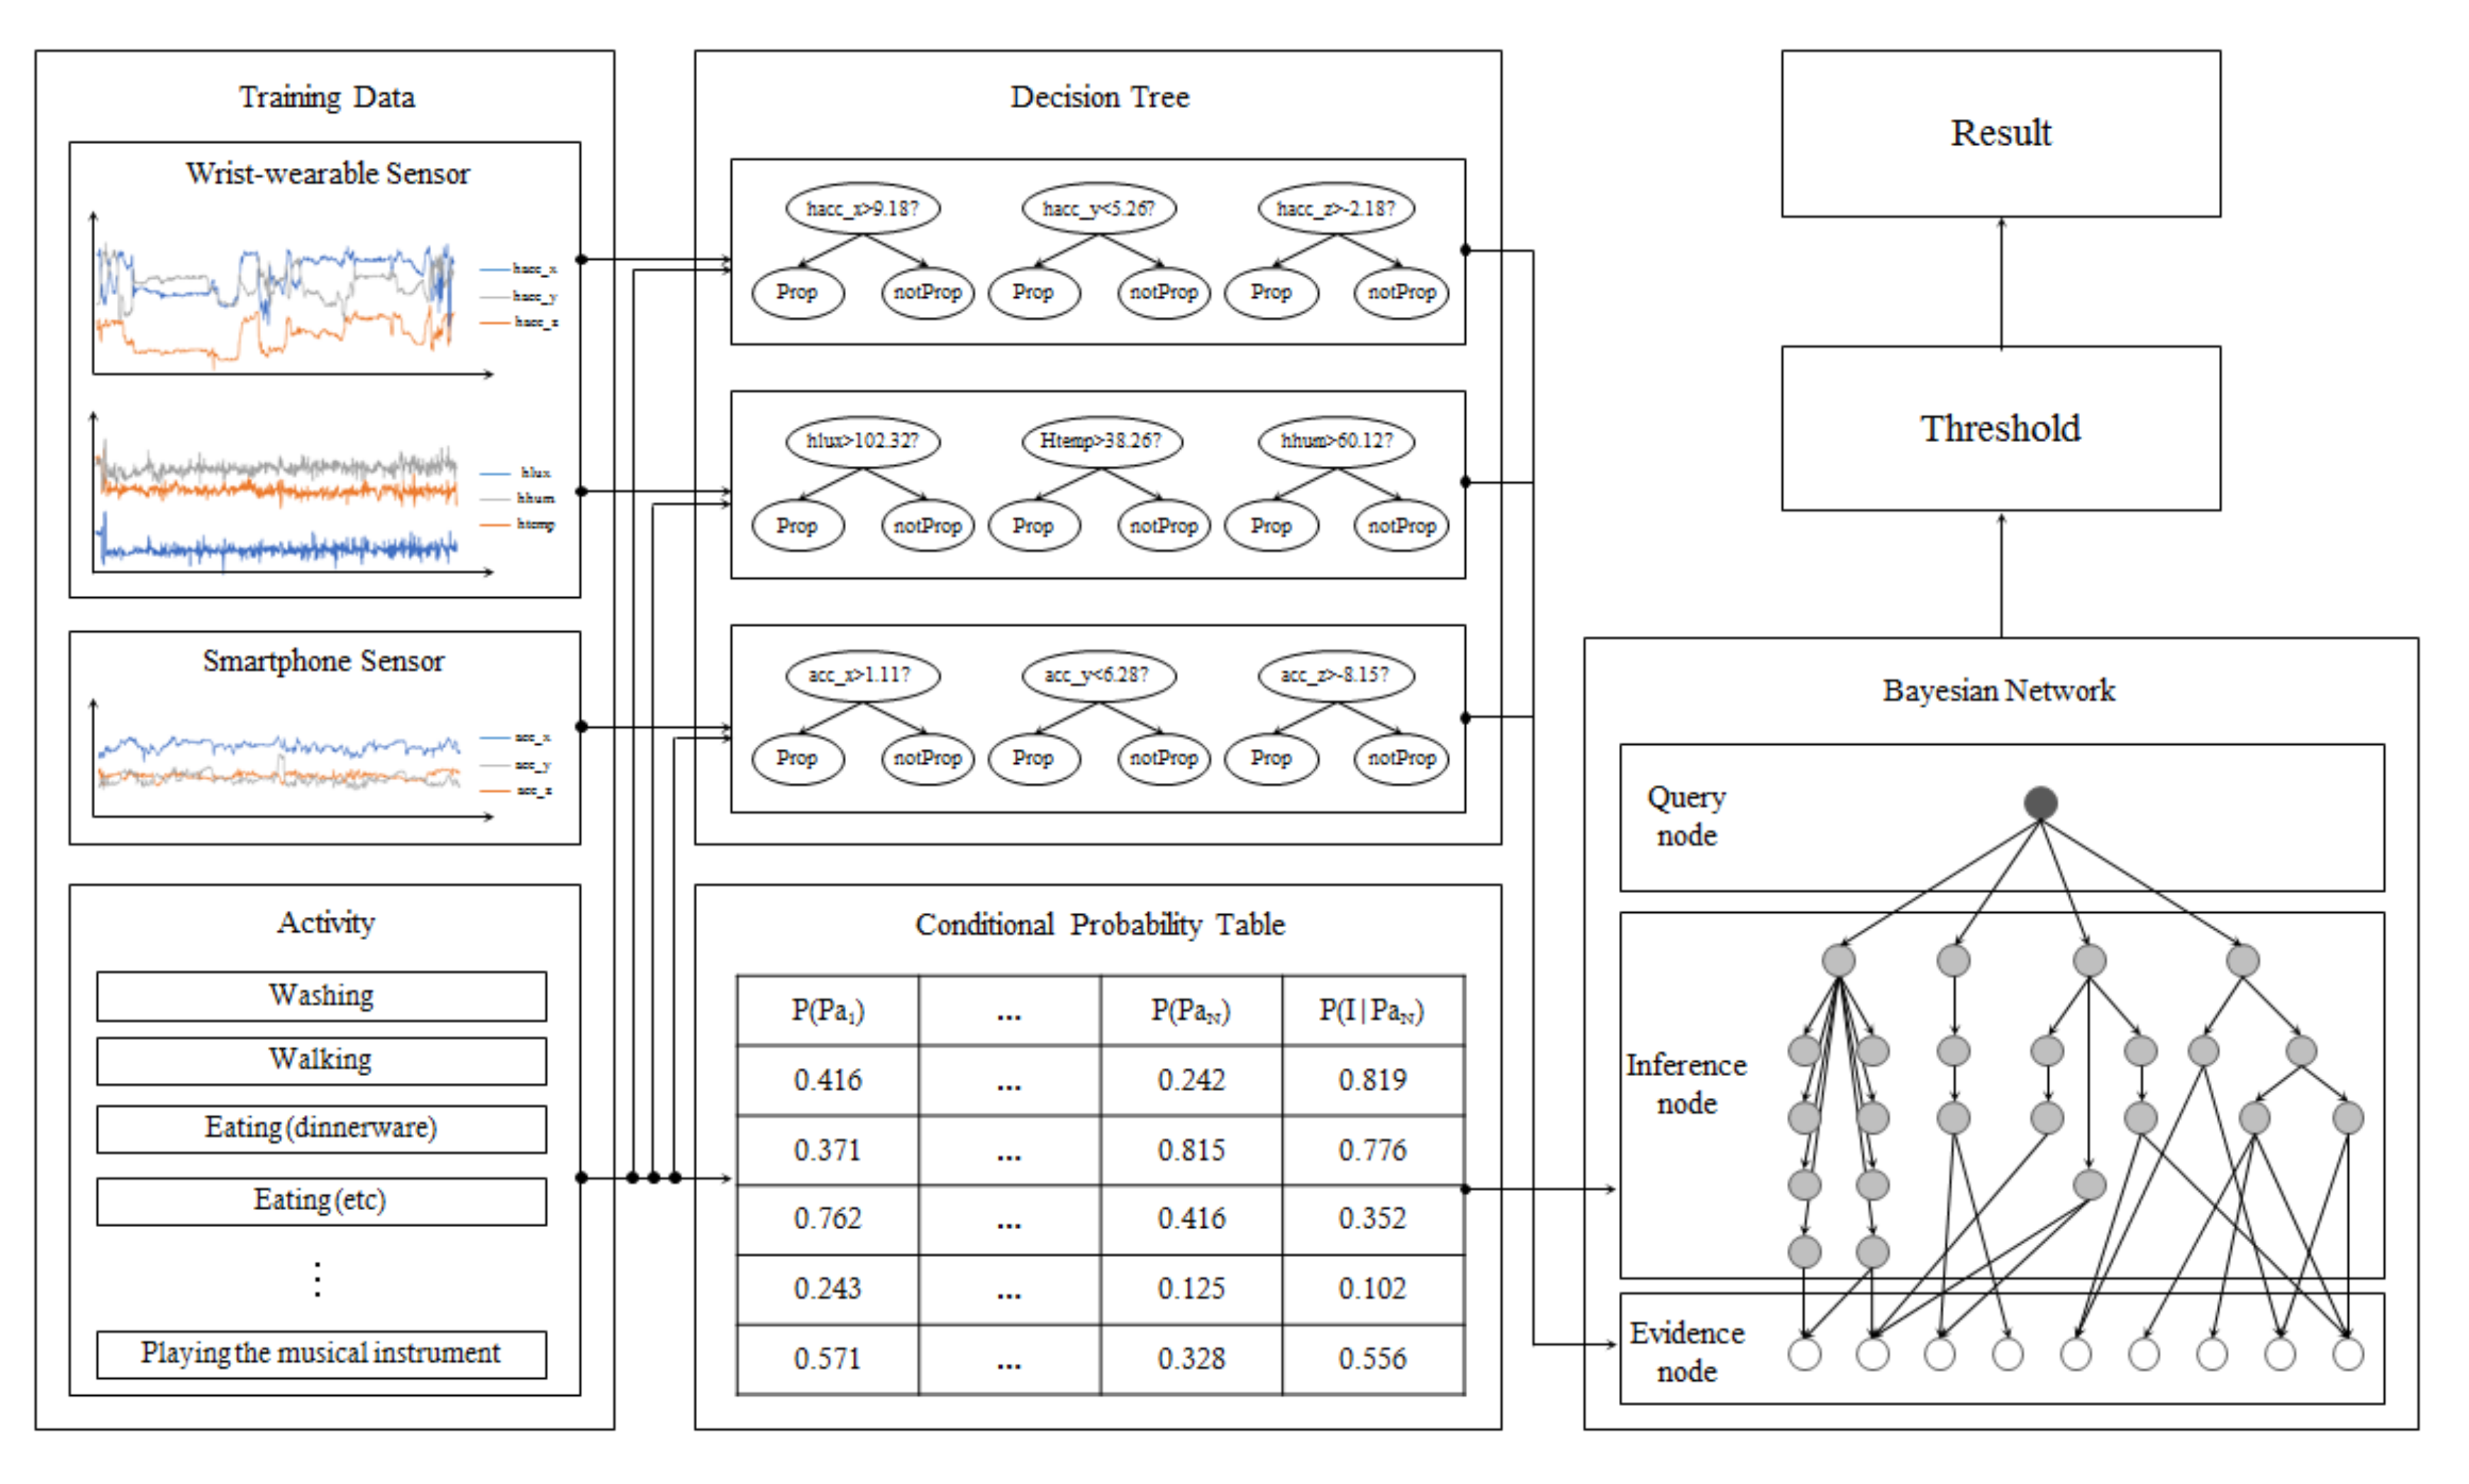
4. Proposed Method
Figure 3 shows the overall system architecture of the proposed method. It has a modular BN that infers the target activity node from a child node, which infers the low-level context, and simple decision trees that infer evidence nodes of the modular BN (see
Section 4.2 and
Section 4.3). When the training process starts and the raw sensor data from nine channels and its class information are entered, the system learns and constructs its decision tree and conditional probability table, as described in the
Section 4.3. For the recognition, the trained decision trees obtain raw sensor data continuously and make an inference of the probability of their evidence node, and the modular BN infers gradually from the evidence nodes to the query node, the eating activity. If the probability of the query node is larger than the predefined threshold, the recognition result becomes ‘eating’.
4.1. Sensors
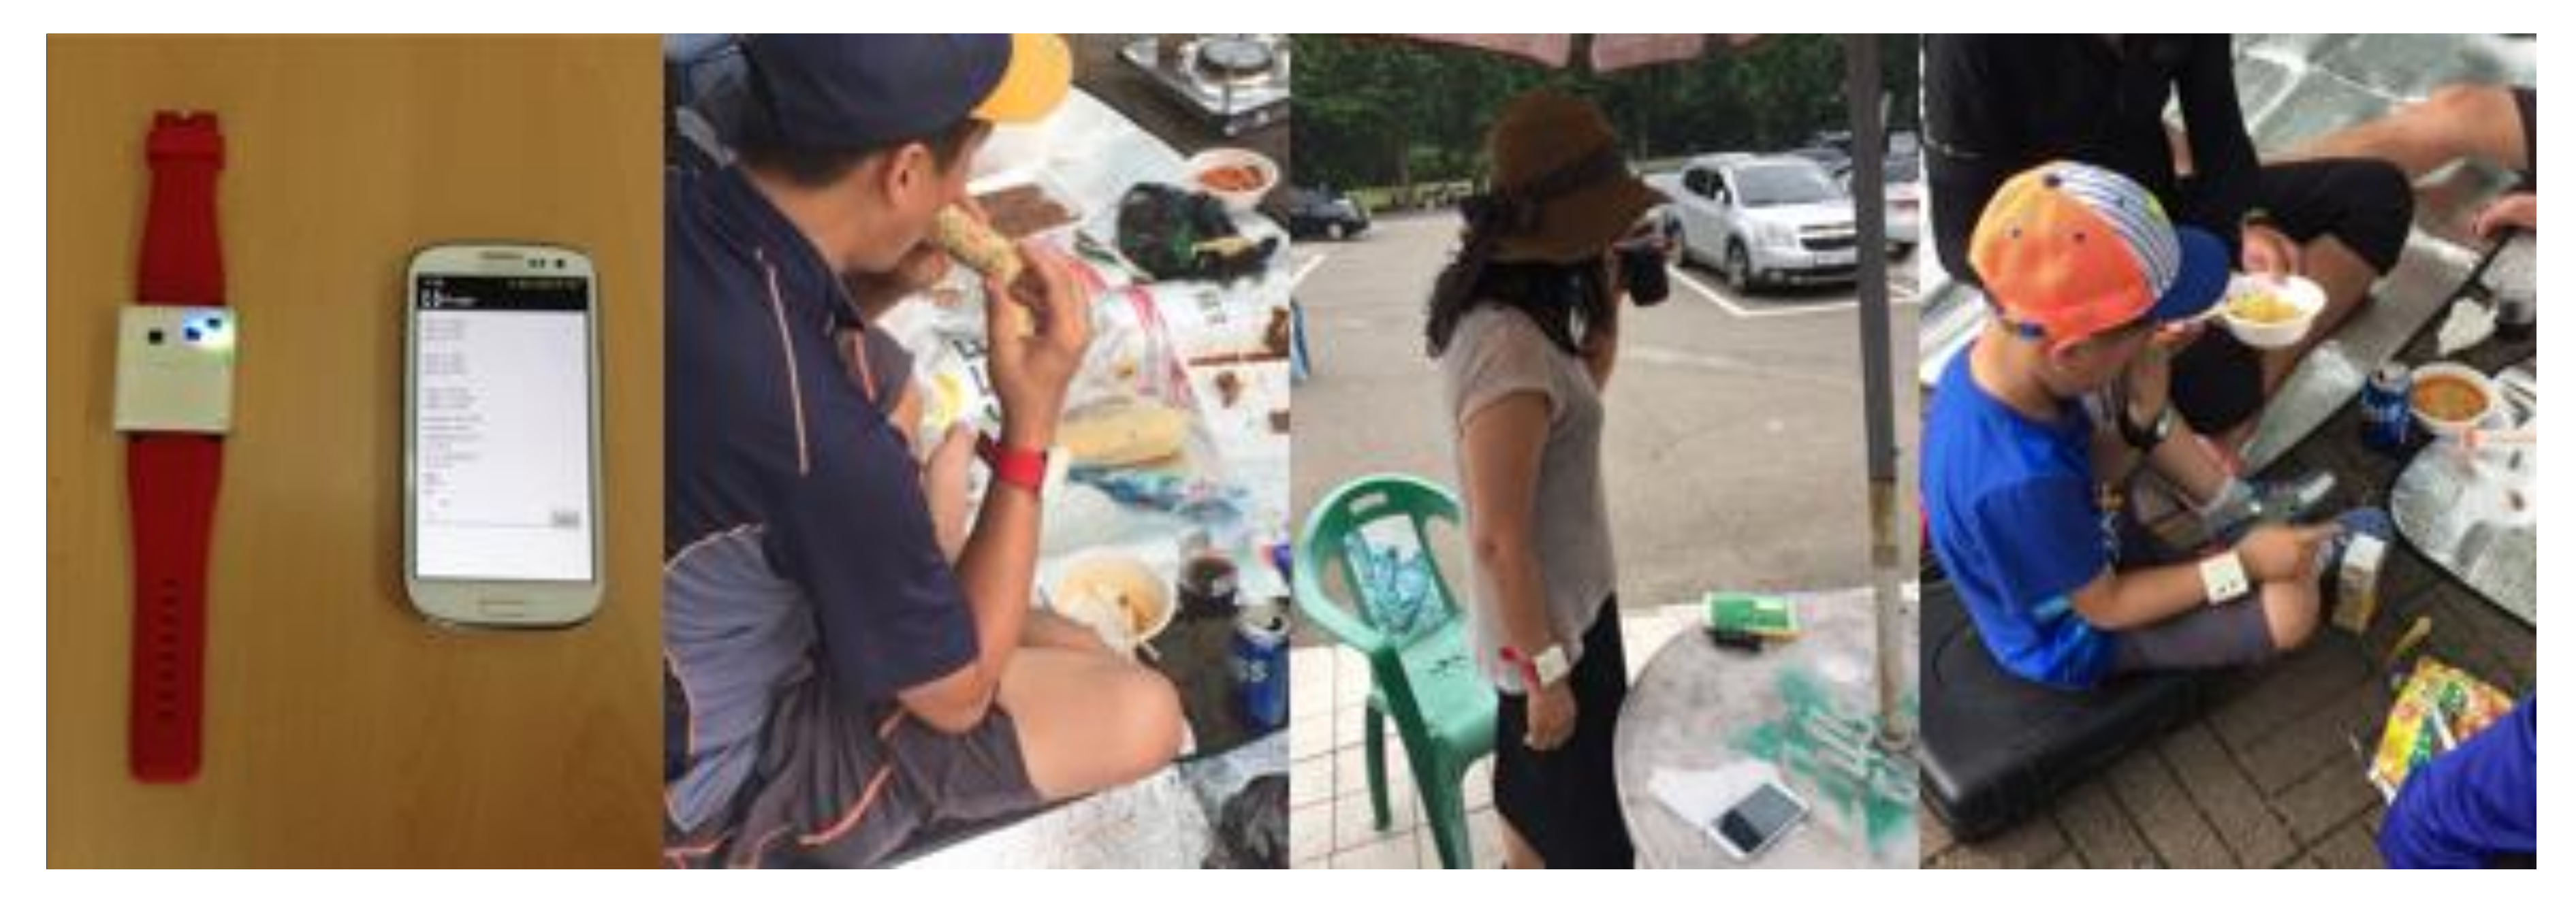
As mentioned in
Section 1, we only used low-power sensors attached to the smartphone and a wrist-wearable device to consider constraints of power consumption and obtrusiveness of the user. The distribution rate of the wrist-wearable device is much higher than other forms of wearable devices and is in a natural position to collect daily life data consistently. Moreover, as we use our hands to eat something, the wrist is an appropriate position to collect food intake-related movement and the position of hands, and parametric temperature or humidity. We combined the four kinds of sensors for the wrist-wearable device (
Figure 2), which are composed of MPU-9250 motion sensor of InvenSense (Seoul, republic of Korea), BME280 environment sensor of Bosch (Seoul, republic of Korea), and APDS-9900 illumination sensor of Avago Technologies (Seoul, republic of Korea).
Table 4 shows the type of sensors with their power consumption and collecting frequency. The device can collect data continuously for about 6 h without charging.
4.2. Context Model of Activity
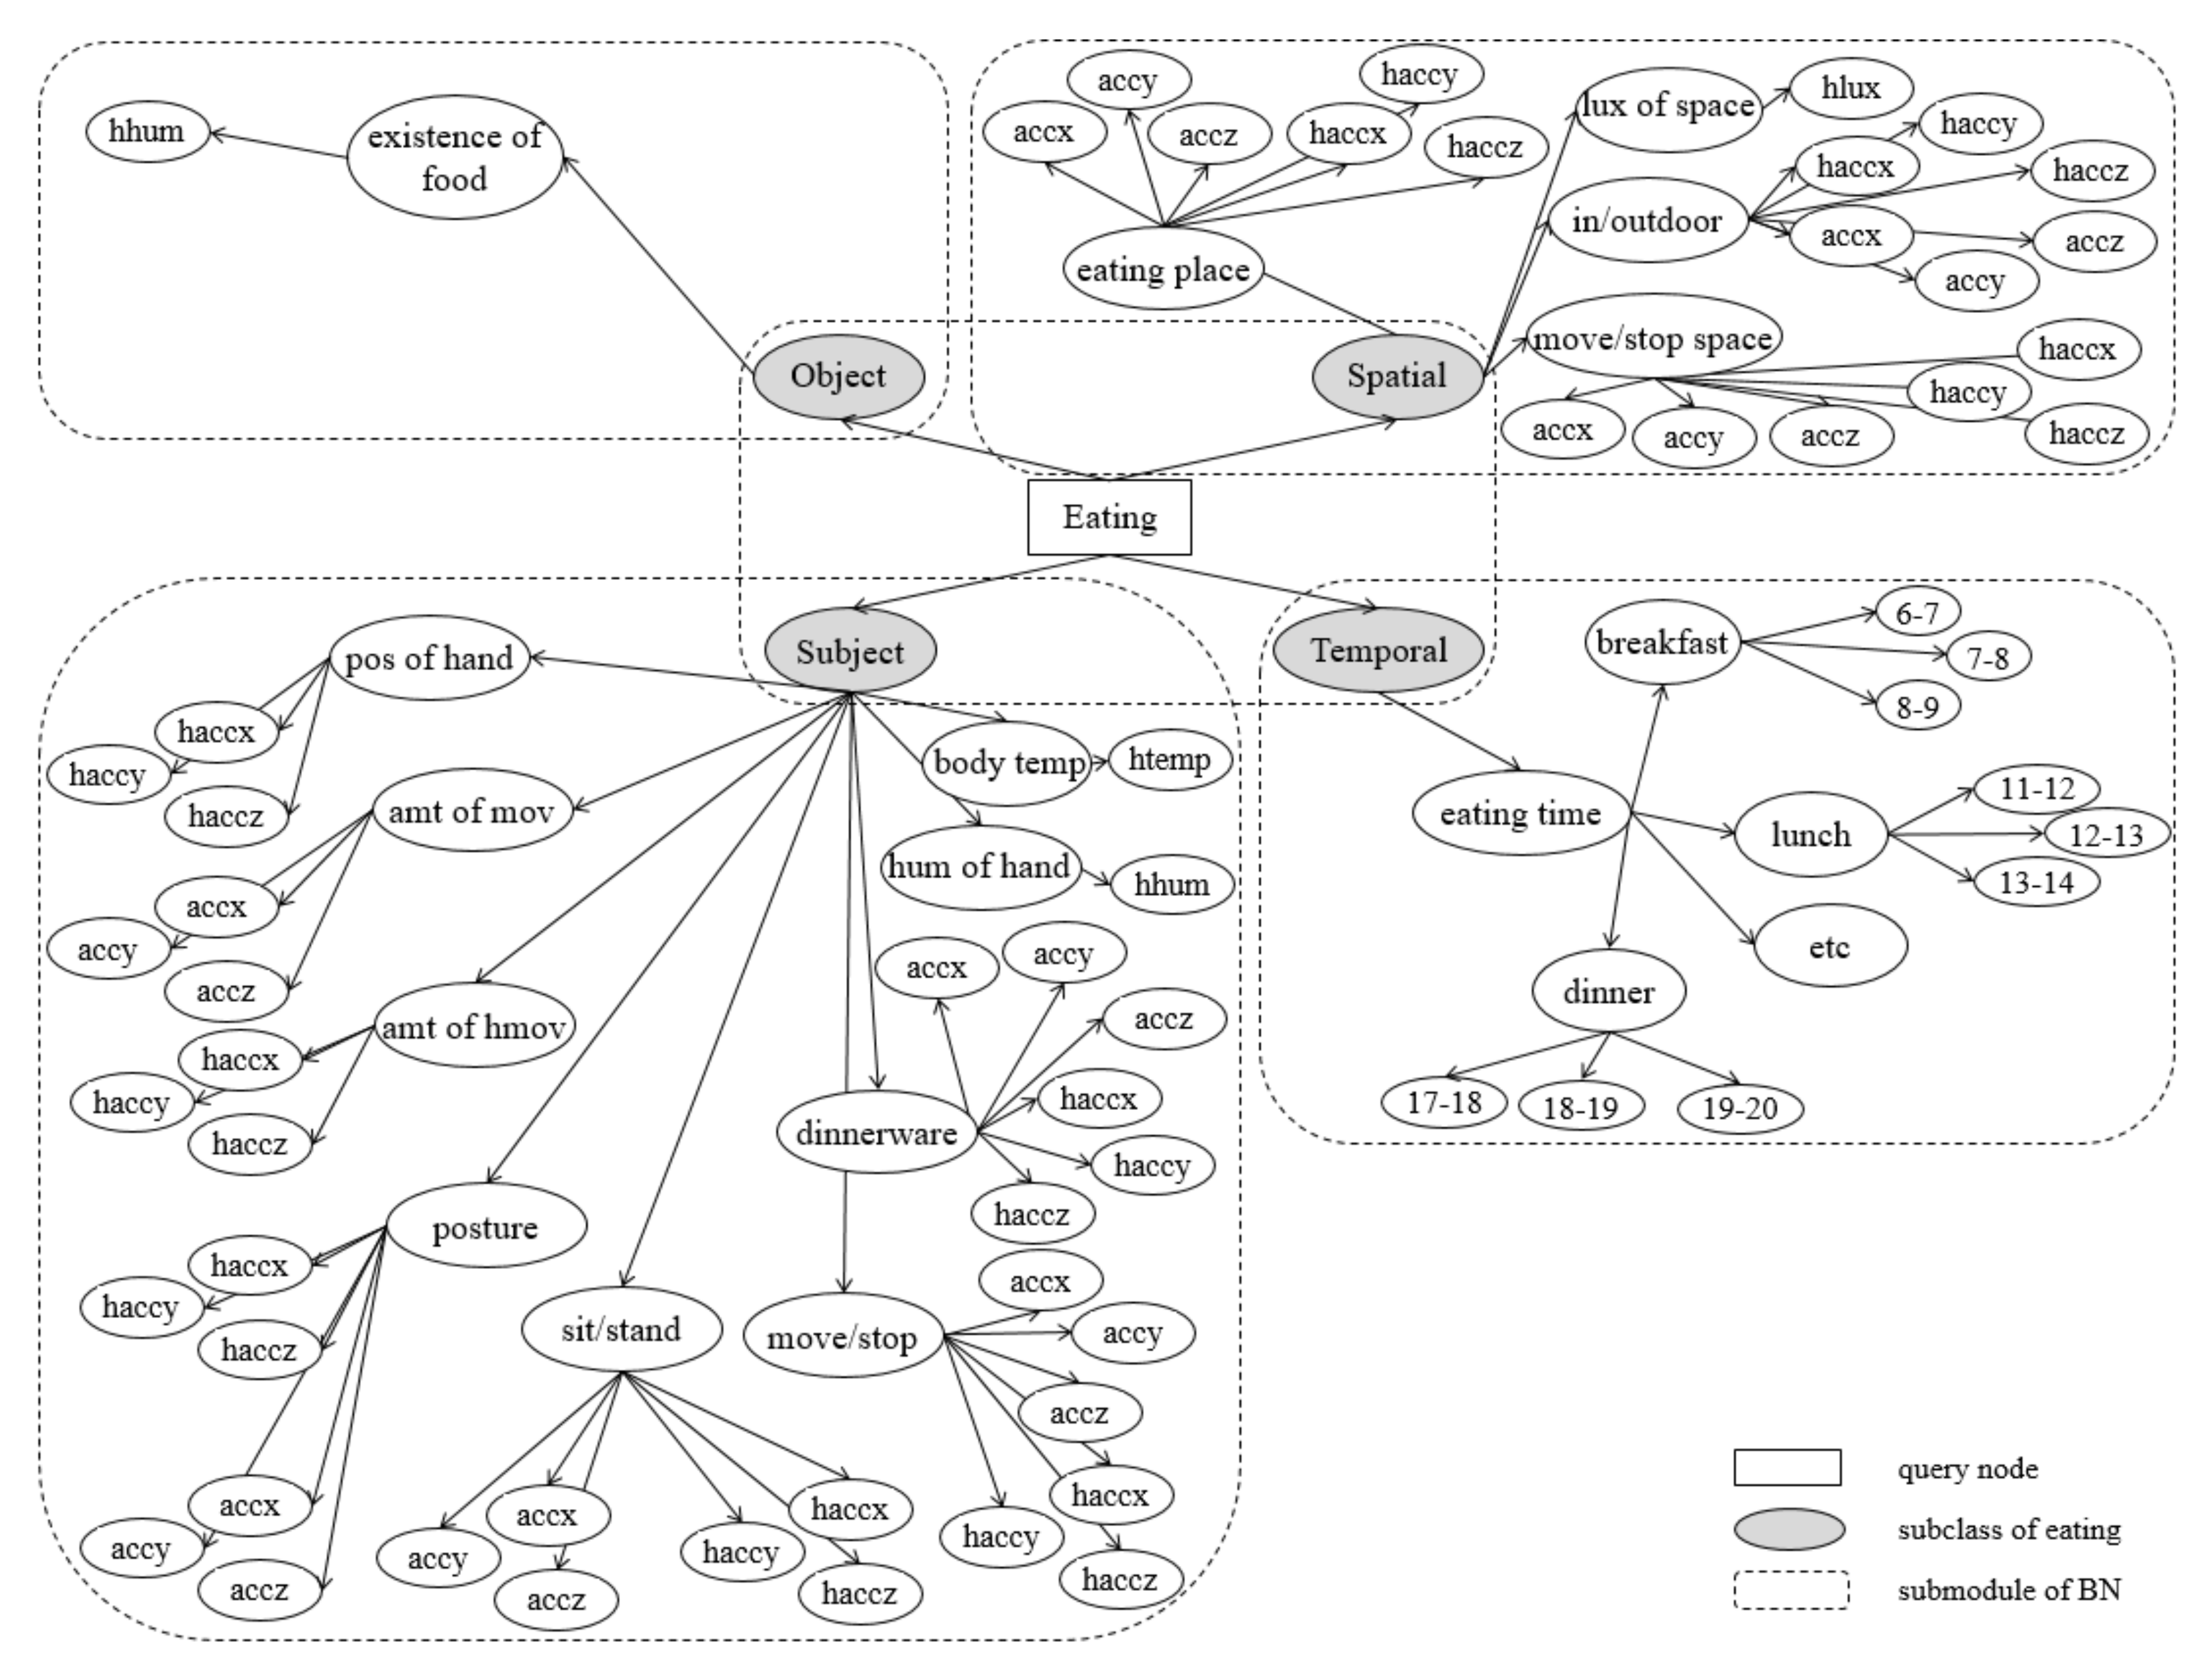
An eating activity is a complex activity which consists of many low-level contexts, such as the spatial and temporal background, movement of the wrist, and temperature.
Table 5 shows the web ontology language (OWL) representation of the proposed context model based on the activity theory and the “Five W’s”, for systemic analysis on an eating activity. Four subclasses represent the components of the Five W’s, except ‘Why”, as this context is considered difficult to measure with the limited sensor environment. A subject property consists of goal-directed processes (actions) and the unconsciously appearing status of the body (body temperature, posture, and so on; operations). Nine properties describe the low-level context of the eating activity. Each intermediate node is linked to leaf nodes, namely, sensors, which are considered as related. Although the movement of the user is the main feature to recognize activities, used for most intermediate nodes, environmental features could also contribute, especially when the movement patterns are diverse. The proposed context model has three other subclasses (object, spatial, and temporal properties) to consider those environmental factors. A temporal property uses the system time for judging one property, whether the current time is appropriate for eating. A spatial property has four properties, such as whether the user is indoors or outdoors, changes of space, and whether the intensity of illumination of the space is appropriate for eating.
4.3. The Proposed Bayesian Network
A formal definition of the BN and its nodes are as follows.
Definition 1. A BN is a directed acyclic graph (DAG) with a set of nodes N, a set of edges
, and a conditional probability table (CPT) which represents a causal relationship between connected nodes. Each node represents a specific event on the sample space Ω, and each edge and the value of the CPT represent a conditional relationship between a child node and parent nodes, . Given the BN and evidence e, the posterior probability can be calculated by chain rule, where is the set of parent nodes of N [17]: Definition 2. A set of nodes N consists of the set of query nodes Q, which represents the event user wants to know from the BN a set of evidence nodes V, which observes the sensor data and classifies the properness, and a set of inference nodes I, which infers the probability of related contexts based on a CPT.
Figure 4 shows the proposed BN. The proposed BN consists of
V,
I, and
Q, where
and
. Full names of sensors are described in
Table 4. Nodes in
V are set by nine types of low-level sensor data, the query node in Q represents the recognition result, eating or not, and each intermediate node in
I represents the sublevel context of the target activity. By using intermediate nodes, the proposed model is more resistant to overfitting than typical learning models which mainly depend on automatically calculated statistics, such as the mean, deviation, or Fourier coefficients. For example, even if the model is trained only with the eating data using a fork, it could approximately recognize the eating activity using chopsticks if the user eats while sitting and shows the similar pattern of the movement of the hand, and so on. Moreover, in addition to the complex composition of the eating activity itself, there could be many unexpected or omitted sensor values: user may eat while lying down or eat at midnight, or take off the wrist-wearable device or smartphone, where the accelerometer value is omitted. A BN could deal with these issues as it provides the probabilistic approach for recognizing each context, so it can give an approximate answer even if some data are uncertain or missing, compared to other deterministic classifiers which give a wrong answer or cannot give any answer at all.
For a structure of the proposed BN, we construct the modular BN with a tree-structured design.
Definition 3. Modular Bayesian network [18]. A Modular BN (MBN) consists of a set of submodular BNs M and the conditional probability between submodules R. Given BN submodules and , the link is created. Two submodules are connected and communicate only by shared nodes. The proposed MBN has one main module containing a query node and four submodules where each leaf node in a main module (object/spatial/subject/temporal) becomes the root node of each submodule. All submodules are designed by a tree-structured approach, where each module has only one root node, which is also a shared node, and all child nodes have exactly one parent node. By following these design approaches, the proposed model is more explainable as the probability of each shared node could easily be calculated and explain the probability of each context to an individual. Moreover, these design approaches substantially reduce the complexity of the BN to
; by limiting
k to 2 and minimizing the
w, where
n is the number of nodes,
k is the maximum number of parents,
r is the maximum number of values for each node, and
w is the maximum clique.
| Algorithm 1. Learning algorithm for the CPT. |
| // D is the input data |
| |
|
| (I) do |
| |
| |
| |
|
| |
| |
To calculate the value of the CPT, the proposed BN learns the data using simple learning algorithm. In the training process, the training data enters into E and I. For evidence nodes in E, there is a simple binary decision tree for each evidence node and it learns a criterion for classification. For inference nodes in I, BN counts the number of occurrences that and update the element of the CPT, as shown in Algorithm 1. For example, if , increment, and so on. For this algorithm, the proposed BN needs time complexity for learning, where ND is the amount of data, and when either the number of nodes or data is fixed, the time complexity becomes linear.


