Abstract
Demand for online and real-time measurements techniques to meet environmental regulation and treatment compliance are increasing. However the conventional techniques, which involve scheduled sampling and chemical analysis can be expensive and time consuming. Therefore cheaper and faster alternatives to monitor wastewater characteristics are required as alternatives to conventional methods. This paper reviews existing conventional techniques and optical and fibre optic sensors to determine selected wastewater characteristics which are colour, Chemical Oxygen Demand (COD) and Biological Oxygen Demand (BOD). The review confirms that with appropriate configuration, calibration and fibre features the parameters can be determined with accuracy comparable to conventional method. With more research in this area, the potential for using FOS for online and real-time measurement of more wastewater parameters for various types of industrial effluent are promising.1. Introduction
One of the challenges of industrialization is the effects of wastes by-products on the environment, of which wastewater from industrial activities is a major contributors to water pollution in Malaysia due to the copious amount of chemicals used in the processes. According to a Malaysian Department of Environmental (DOE) report, the amount of industrial effluents from various municipalities had inevitably increased from 1,103,457.06 metric tons in 2006 to1,622,031 metric tons in 2011 [1,2]. Such wastewaters are abundant with chemical residue containing heavy metal and colouring.
Wastewater effluent quality can change rapidly in the event of treatment plant performance failure. Unconstrained continuous water quality monitoring is difficult to achieve due to limited space within the sewer system and its separation from the laboratory [3]. In order to mitigate the effects of the compromised environment and comply with stringent government legislation, close performance monitoring of each of the treatment plant needs to be done on a regular basis. Spectroscopic techniques have been acknowledged as the most compelling spectrum analysis techniques since the 1990s. They have the advantages of being relatively inexpensive, having short test times and not requiring reagents or sample preparation. In addition, their ability to measure directly makes them suitable for on-site determination. A breakthrough in optical fibre spectroscopy research from Kao and Hockham [4] reveled that light which is guided through a thin flexible dielectric fibre has low loss in its waveguides. Technology has since taken optical fibre sensors to new heights of innovation and proffered an outstanding solution to certain challenges [5]. There have been more studies on the accuracy, reliability, portability and cost effectiveness of optical fibre sensors, and it can be become a competitive alternative to the conventional sensors. A previous experiment has reported that optical fibre spectroscopy is a well-suited technique for online monitoring in food quality and safety assessment [6]. When combined with multivariate calibration methods, higher accuracy and precision can be achieved for monitoring purposes, especially of wastewater treatment plant [7].
2. Conventional Detection Method for Parameters of Colour, COD, and BOD
Conventional methods of colour, COD and BOD detection in a laboratory (off-line) are often applied to measure the parameters that measures pollutant levels in industrial wastewater [8,9]. These methods have been summarized in Table 1. However, results obtained through these methods only provide snapshots of moments in time, which are insufficient for sampling the highly changeable quality of effluent. Rapid, continuous monitoring in real time and record keeping by the industry has to be prioritized.

2.1. Colour
Colour in wastewater is normally caused by dissolved matters after the removal of turbidity [9]. The majority of industrial wastes are high in colour intensity, especially those of the textile industries. Dyes contained in wastewater that are not completely removed by treatment and are later discharged into drains are potentially carcinogenic due to their benzidine content and high compositional variability [21]. Off-line monitoring test (sample handling needed) is not suitable for use in this kind of monitoring unit operation at the wastewater treatment plant. The concentration of dyestuffs found in the environment can cause environmental risks due to its inherent eco-toxicology. Thus, reliable analytical methods are needed to detect critical concentrations of dye compounds in the environmental compartment [22].
2.2. Chemical Oxygen Demand
Chemical Oxygen Demand (COD) is used as a measure of oxygen required to oxidize organic matter of a sample by a strong chemical oxidant. Potassium dichromate, for instance has been widely used for oxidizing a variety of organic substances completely. When the reaction is complete, colourimetric quantification of the residual oxidant is performed [9]. The residue becomes an important parameter and it is used extensively to determine the quality of wastewater quickly (around 2 h), compared with 5 days for a Biological Oxygen Demand test. A number of improvements have been carried out on the digestion process as shown in Table 1. However, most industrial wastewater sample contains chloride ions, aromatic hydrocarbons and pyridine, which are not oxidized unless a catalyst like silver sulphate (Ag2SO4) of used [23]. Consequently, secondary hazardous waste is produced and need special disposal.
2.3. Biochemical Oxygen Demand
Biochemical Oxygen Demand (BOD) is one of the widely used parameters to determine the relative oxygen requirements to oxidize the organic matter which present in industrial effluent when seeded with a microbial system [9]. A quantitative relationship for oxygen demand of microorganism to oxidized wastewater sample to carbon dioxide, water and ammonia is shown as an equation [23] below:
Variations of oxygen demand requirement exist, which include using shorter and longer incubation duration, when using respirometric method for measurement of oxygen uptake (units mg O2/L) [9]. There are a few methods for the determination of BOD, including microbial sensor demonstrated by Riedel et al. [17]. The authorized method for BOD adopted by the American Public Health Association Standard Methods Committee [9] requires time and the use of careful laboratory quality control practices to complete the test, in which cumbersome procedures are involved. As such, it is inadequate for on-line monitoring wastewater treatment unit operations.
3. Online Measurements
Continuous water quality monitoring at the plant does not just provide hydrological data; it also provides a true picture and real time recognition of changes in order to alert the plant operators if the quality of effluents matches up with the established criteria. The alternative methods of colour, COD and BOD detection which are introduced in this review are based on optical working principles, for instance, optical sensors and optical fibre sensors.
3.1. Optical Sensor
Dissolved organic compound in wastewater contains aromatic structures, which have absorption peaks within the UV region [24,25]. Due to these characteristics, some linear relationships are established within them, which include water total organic carbon (TOC), nitrate, suspended solids (SS), COD, BOD and dissolved organic carbon (DOC). The extent of water pollution can be judged directly via the absorbance value after a water sample is irradiated with 254 nm UV light [26]. According to research [27,28], the UV light absorbance at 254 nm has been utilized to directly estimate the aggregate organic content of a water sample. Rapid and versatile monitoring of colour, BOD and COD using optical techniques such as UV-visible spectroscopy and fluorescence measurements was suggested in the research of Bourgeois et al. [29]. Optical properties such as absorption, scattering, re-emission and reflection can be used to rapidly identify the characteristic of wastewater, even in large batches of samples [25].
3.2. Optical Fibre Sensor
Essentially, fibre optic sensors (FOS) work like other electrical sensors except that the FOS uses a glass fibre instead of copper wire and light instead of electricity. A FOS modulates the properties of light including intensity, phase, polarization, or wavelength shift [30]. To date, much of the instrumentation improvements in this particular application have been recorded. Different sensor applications require different types of transducers (optical fibres) to manipulate the incident radiation. Thus, instrumentation for optical fibre sensor requires an overview.
Fibre Sensor System Configuration
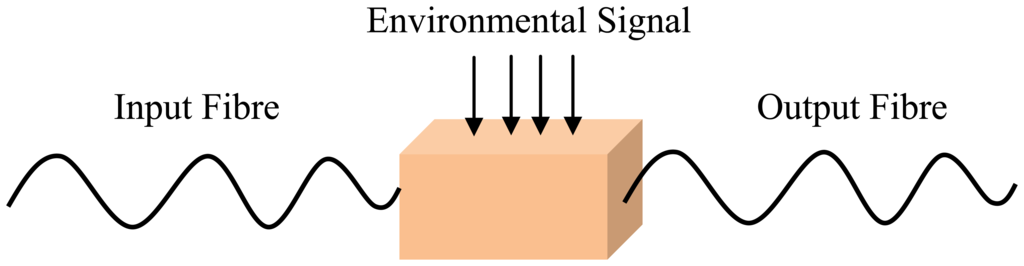
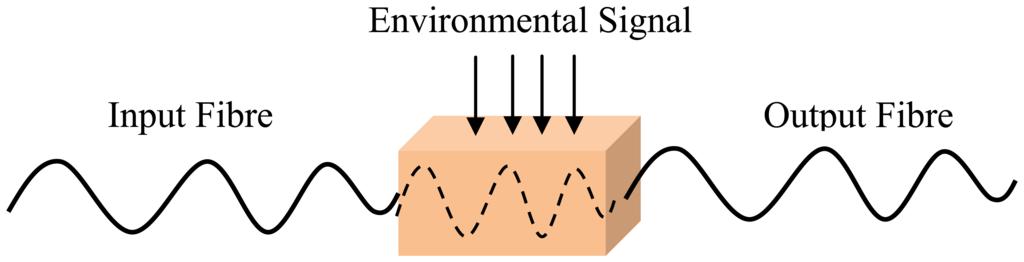
An optical fibre sensing system is basically composed of a light source, optical fibre, a sensing element or transducer, and a detector. Brief descriptions of FOS components are given in Table 2. The basic optical fibre structure consists of a core surrounded by some cladding material of a lower refractive index and both are transparent dielectric cylindrical. The requirement for FOS is to have a low optical and mechanical attenuation under all anticipated operational conditions without performance degradation [5]. FOS can be categorized into two groups: intrinsic and extrinsic [31]. Figures 1 and 2 show a basic construction of extrinsic FOS and intrinsic FOS, respectively. So-called intrinsic devices rely on a light beam propagating through the fibre and interaction occurs within the environmental effect and the optical fibre itself. Extrinsic fibre optic devices are where the optical fibre is used to couple light. The light beam transmits and passes out of fibre to the exposed environment effect. Then the light doubles back to the fibre again. Consequently, the light beam to and from the fibre region are influenced by the measurand [32].
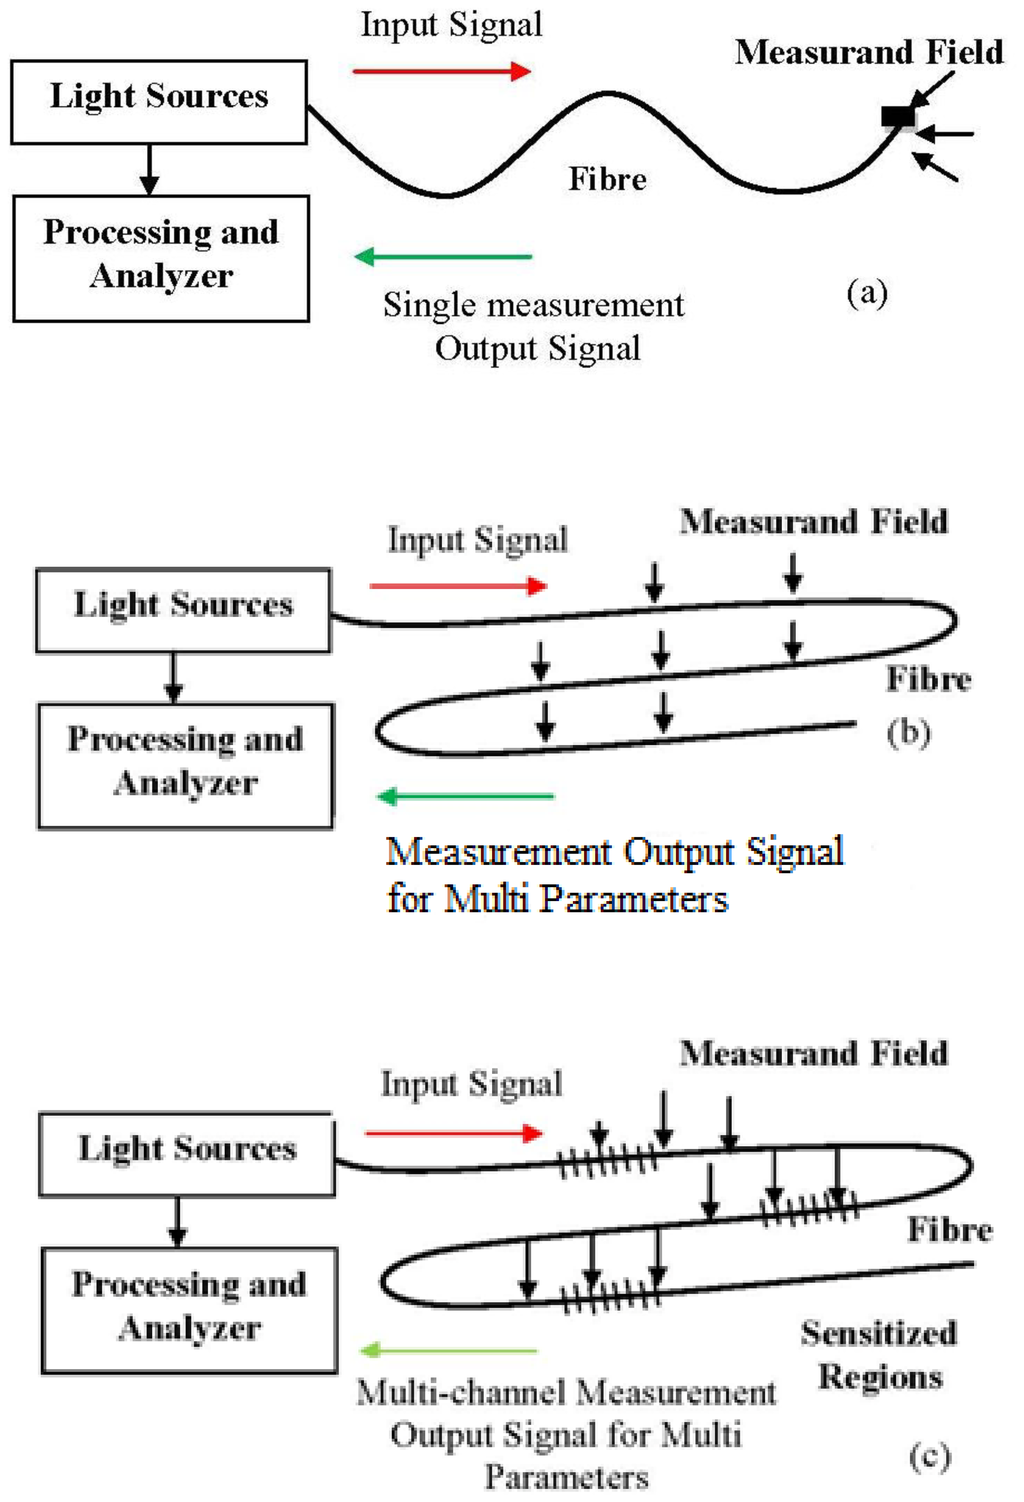
Optical fibres take advantage of their unique characteristics, which are susceptibility to linear and non-linear environmental effects to enable distributed sensing. So, to achieve optimum performance to a given measurand, a detailed system design which matches the system to the environment is necessary [32]. A majority of FOS have the propensity to operate in the way that is depicted in Figures 3(a–c). Figure 3(a) depicts a sensor tip sensitized to respond to the measurand parameter which then detects the amount of light reflected at the tip. The sensor element can provide an extended sensing response with a long length of fibre [36]. This sensitivity can be enhanced by wrapping the fibre in a compact form to act as the transducer head. Fibre optic sensing practices can offer other interesting sensing options as well, including the ability to spatially discriminate the measurand at diverse locations along an identical fibre length, as illustrated in Figure 3(b). FOS is compact and lightweight, thus allowing the possibility of having distributed or quasi-distributed sensing geometries [37]. That means FOS can be multiplexed and be capable of measurement over a continuous region or in some region (multi-channel) with a large number of discrete points of the sensing geometries, as shown in Figure 3(c). This would otherwise be cost consuming or intricate to do using conventional sensors. Using FOS, it is possible to measure many external parameters such as pressure [38], acoustics [39], strain [40], pH [41], temperature [42], heavy metal [43] with greater precision and speed.
4. Characteristics of FOS Development
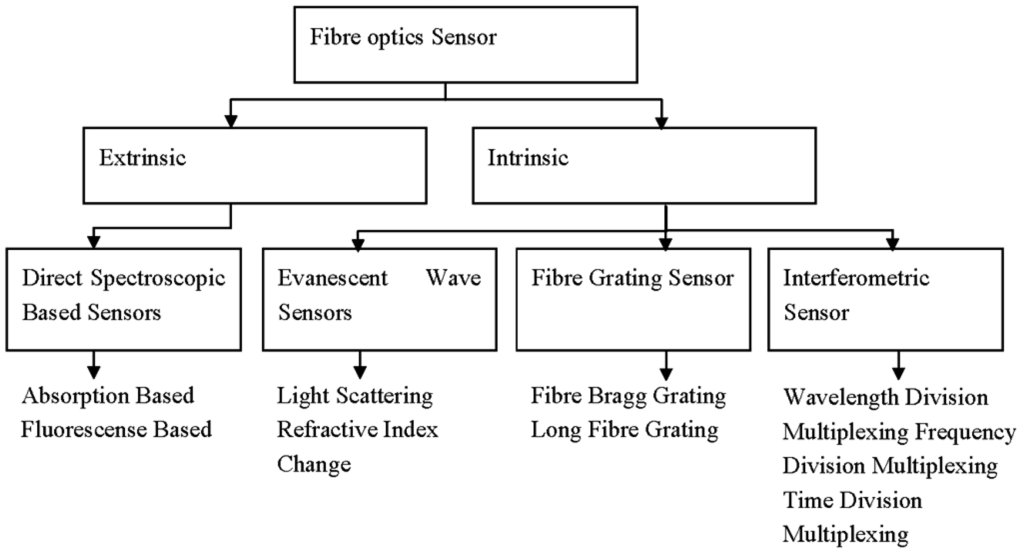
FOS possesses several advantages over conventional devices, mainly due to the characteristics of the optical fibre itself. FOS can be made very small and thin, resistant to harsh (chemical) environments and impervious to electromagnetic interference. They can be used in remote areas that are tackling difficult measurement situations. The devices are also inherently safe because of the low optical power and the absence of electric current at the sensing point [33]. They always relate absorption and fluorescence based measurements to the target analyte [44] due to every atom, ion or molecule with its unique characteristic relationship with electromagnetic radiation. Thus, the study of optical sensors is a study of colours, concentrations, sensitivity and selectivity which leads to the analysis of the chemical species, and is specially designed to meet the requirements of many demanding applications [5]. Design of extrinsic and intrinsic sensor types with various fibre optic based on optical transduction mechanisms can be further classified as shown in Figure 4, and as discussed below. They include direct spectroscopy, evanescent wave, fibre grating and interferometric sensors.
4.1. Direct Spectroscopic Based Sensors
4.1.1. Absorption Based
Molecular absorption spectroscopy is a common detection technique in laboratories due to its flexible adaptation to a wide variety of analytical problems [45]. Attenuation will occur when there is absorption of optical energy, which only occurs when there are a transition atoms or molecules in energetic states. However, the absorption process will only take place when the difference in the energy states involved matches with the energy of the excited photons. Specifically, the attenuation will only occur for the energy at a particular corresponding frequency. The Beer-Lambert equation shows the relationship between input and output light intensity of the incident radiation. The equation can be expressed as below:
Io is incident intensity, in unit radiant power per wavelength (W·m−1).
I is transmitted intensity, in unit radiant power per wavelength (W·m−1).
α is attenuation coefficient, in unit reciprocal length (m−1).
L is length of fibre, in unit metre (m).
The equation shows that there is linear relationship between intensity variation and attenuation of propagating of light. According George et al. [46], the strong absorption of inorganic salt compounds is located within the wavelength range from 550 nm to 750 nm. The detailed description of Nataraja et al. [26] about organic samples reports good absorbance in the 250 nm to 300 nm range that correlates with the concentration of the compound(s) of interest.
4.1.2. Fluorescence Based
Especially in fluorescence based fibres, FOS that require short wavelength light sources (e.g., in the ultraviolet, visible or near-visible regions) are important for monitoring the chemical properties of materials. Fluorescent- based techniques are a complement to absorption based techniques for FOS [36]. In fluorescence, the electrons of the species undergoing the transition do not change their spin. The fluorescence spectrums approximately mirror the absorption spectrum. The intensity of the fluorescence spectrum depends upon the excitation wavelength. The intensity of fluorescence, F [47,48], can be readily related to the concentration of fluoresces, C, by the relationship:
K is the quantum efficiency (unitless).
ε is the molar absorptivity (L/mol/cm).
I is the intensity of the incident light.
C is the concentration of fluoresces (mol/L).
Any fluorescence response is highly affected by a few factors which include temperature, concentration, pH and salinity of the solution [49]. Quenching properties can be enhanced by increasing the temperature. This study had been demonstrated by research [50], which apparently showed fluorescence intensities of dissolved organic matter increase by around 48% when the temperature increases from 10 °C to 45 °C. These results are in accordance with comparisons between the fluorophore tryptophan and fulvic acid.
There is limited information about quenching effect induced by metal ions. Keltona et al. set up an experiment where the metal quenching effects of dissolved organic matter from different streams were investigated. However, metals as well as irradiation diminish the capability of the optical properties to discriminate organic matter. Thus, the quenching effect also increases from 12% to 38% [51].
4.2. Evanescent Wave Based
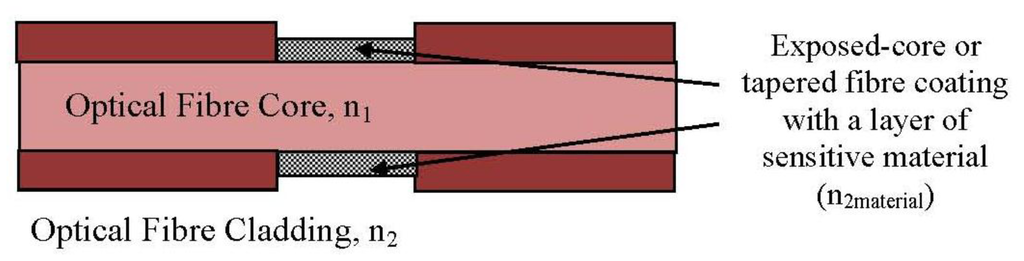
A common notation evanescent wave (EW)-based method replaces a portion of the original fibre cladding with a modified cladding material (sensitive material) called taper fibre [52]. This taper fibre creates the evanescent field, resulting a light scattering phenomenon on the optical fibre structure. When radiation losses increase, the transmitted light decreases along the fibre [53]. One popular intensity modulation technique involves bending the fibre to induce radiation losses [36]. Thus, with interaction within fibre and target analyte, the optical absorption result, refractive index change or scattering information can be obtained.
A basic structure of an intrinsic fibre optic sensing part is shown in Figure 5. The total internal reflection (TIR) effect is observed in the resulting attenuation when the condition for critical angle criterion is achieved [54]. Interference between the incident and reflected signals at each point of TIR then generates a wave which extends beyond the optical fibre core. Light propagating along a tapered fibre is not confined to the core region but penetrates into the surrounding cladding region, the so-called penetration depth. The penetration depth can also be derived by Equation (4) [55]:
dp is the penetration depth.
λ is the wavelength of the propagating signal in the optical fibre.
θ is the angle of incidence normal at the interface. ncore and nclad are the refractive indices of the fibre core and cladding respectively.
Refractive Index
Refractive index changes are frequently demonstrated in EW sensing approaches. Any change in the optical or structural characteristic of the chemical provokes a change in the effective index of the optical fibre, thus changing its transmission properties [56]. There is great interest in these types of sensor since they offer high sensitivity, absolute detection and broad measuring ranges [57].
The refractive index of the modified cladding material can be considered in two situations: (a) having a lower refractive index than the core and (b) having a higher refractive index than the core. If the modified cladding, n2 has a lower refractive index than core n1 (n2 < n1), the incident ray bends away from normal and greater than the critical angle. Then the total reflection condition is met [33]. Moreover, if the modified cladding, n2 has a higher refractive index than the core n1 (n2 > n1), the incident ray bends towards to normal and less than the critical angle. A portion of the propagated light is refracted into the cladding, and another portion is reflected back into the core [53]. The partial leaky to mode sensor is constructed based on the intensity modulation induced by the absorption of the refracted rays and the evanescent field in the modified cladding [52].
4.3. Fibre Gratings
Fibre gratings have widespread application in telecommunications. Its shares common advantages with many other FOS relative to electrical sensor technology. Fibre gratings also have their own unique characteristics which include compatibility with multiplexing and distributed sensing capabilities [36]. There are two commonly used techniques associated with the fabrication of fibre gratings, namely, Fibre Bragg Grating (FBG) and Long Period Grating (LPG). A basic Bragg grating based sensor system working principle is shown in Figure 6.
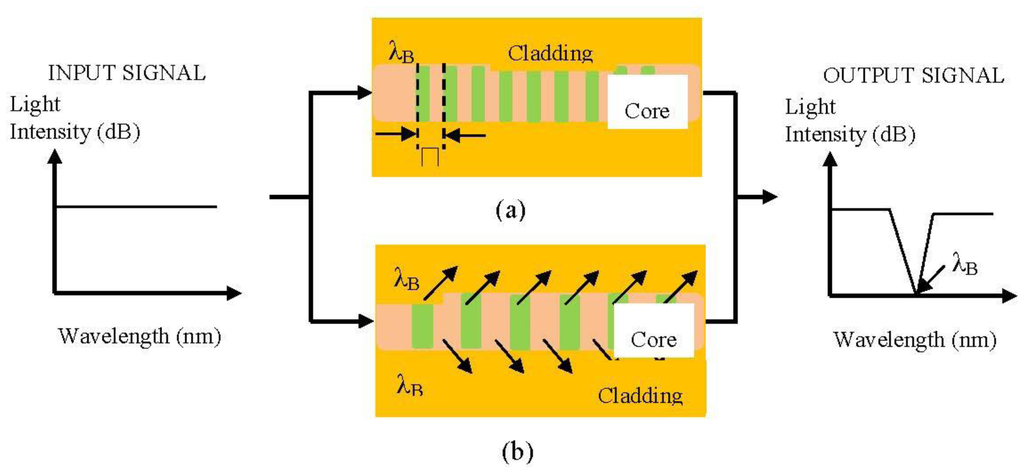
FBG is known to be very susceptible to minute changes in refractive index. The fundamental principle of operation of an FBG sensor system lies in the monitoring of the wavelength shift of the reflected back Bragg signal [58]. These characteristics of fibre grating-based sensor systems are applied in conjunction with chemical sensor applications due to their ability to operate over a broad spectral range (LPG) and even individual gratings [59]. A simple formula for as grating is represented by Equation (5) [60]:
λB is the Bragg wavelength.
neff is the effective refractive index of the material.
Λ is the grating pitch (shorter than lower than the working wavelength.
4.4. Interferometric Techniques
The length and index of refraction of an optical fibre will change when it is subjected to an environmental perturbation. Interferometric techniques may be used to sense these changes with a high level of measurement sensitivity that matches those achieved with conventional sensor technology [61]. Various types of fibre optic implementation of the two beam interferometer sensor such as the Mach– Zehnder, Michelson; multi beam interferometer sensors such as Sagnac and Fabry–Perot, can be used to perform the detection [36]. Generally, interferometric sensors can provide a sophisticated of sensitivity to the measurement parameters if the technique used is appropriate. There are three major multiplexing arrangements characteristically used, namely Wavelength Division (WDM), Frequency Division (FDM), and Time Division (TDM) multiplexing [32].
5. Enhancement for FOS Sensing
The fibre optics industry still has high development potential. However, there is a wide variation in package designs and configurations because there are no existing standards for FOS. The choice of proper sensors and the configuration depend on the types of wastewater. A simple scheme for FOS is shown in Figure 7.
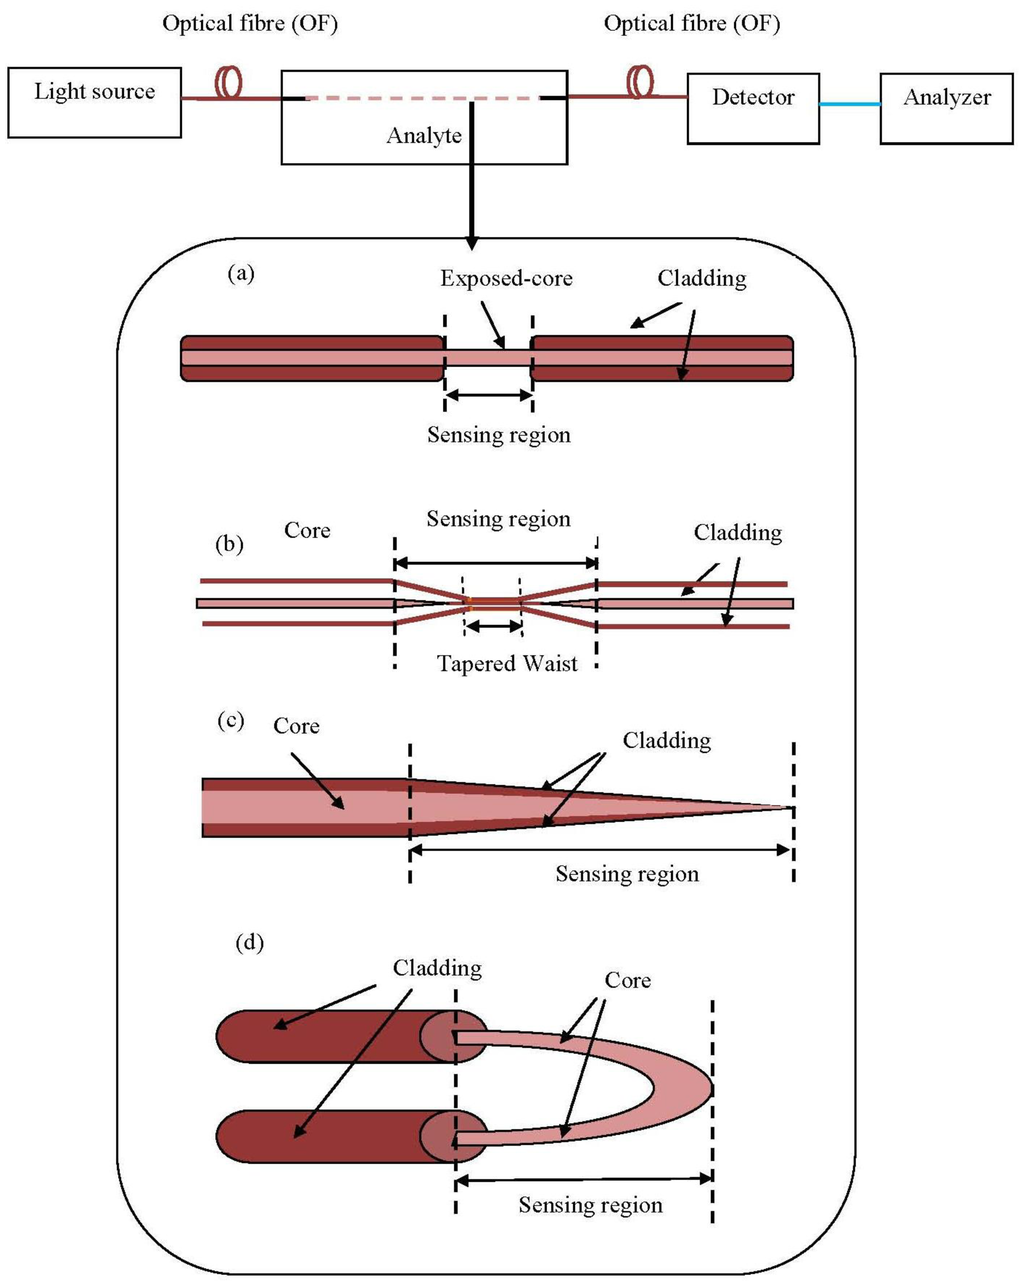
The advent of microstructure optical fibres has attracted the interest of researchers and opened up a variety of uses for photonic sensing [63]. Different portions of the optic fibre tapered for evanescent sensing purposes can be etched using chemical [64], chemical cum heat supply [65] or flame brushing [66]. Several regular fibre geometries for evanescent sensing based on optical principles are illustrated in Figure 7. Besides, U bent mode can be considered as a category of evanescent sensor too [67].
The main point of a tapered fibre is the fact that it can enhance the power fraction in the cladding, and this increases its sensitivity to environmental changes. However, after the removal of the cladding or tapered glass fibre, the device becomes very fragile and thus requires cumbersome handling procedures. As a substitution for silica fibre, plastic optical fibres (POF) have attracted increasing interest because of their robust physical and mechanical behavior. POF high break down strain is around 30% [68], whereas the silica-based fibres are fragile and will fail under a strain of 5%. The ease of use, related to simple end preparation and achieving low cost implementations, makes POF a suitable alternative material to replace silica fibres [69,70].
Besides, in order to improve on the sensitivity of FOS for chemical parameter detection, as reported in [71], no special coating is needed. Some researchers have employed a coating on a tapered or core-exposed fibre to enhance the selectivity of the device for detection. Few examples of this are found in the literature, which goes beyond the three parameters mentioned in the title; they include UV [72], ammonia vapor [73], hydrogen [63], pH [74] sensing and so on.
6. Loss in Optical Fibres
The attenuation, α, of an optical beam power is typically measured in unit decibels (dB). If an input power, P1, give rise to an output power, P2, then the loss in decibels, α is specified by [75]:
The losses are due to absorption, which occur because of impurities introduced to the fibre during the fabrication process. The presence of transition metal ions could result in attenuation that would lead to losses even when present in a very small amount (1 ppm), see Table 3. Meanwhile, Table 4 shows the representative wavelength dependence of attenuation for a silica fibre. Notice that the lowest attenuation is attained at 1,550 nm. For wavelengths longer than 1,550 nm, the attenuation increases as a consequence of the absorption of infrared light by the silica molecules themselves [33,75].
An overview of the major work referenced in this review, together with method and analysis for the sensor to allow comparison and evaluation where possible are presented in Table 5.
7. Applications
The use of FOS is leading to the construction of reagentless methods for chemical or pollutant monitoring has rapidly gained attention. Recent reports offer some potential incorporation solutions including trace cobalt in seawater [90]; in-situ monitoring of aromatic hydrocarbons in contaminated groundwater was also investigated by Bureck et al. [91]. It is encouraging that FOS is used this way for contaminant water on-site measurement and process analysis. The following literature will focus on colour, COD and BOD detection.
7.1. Colour Detection
Natural and synthetic dyes are extensively used in the food processing, pharmaceutical, textile industries and so on [92]. The wastewater that they generate is a common environmental problem, especially textile waste, which contains high level of dyes. Typically, such wastewaters contain organic compounds with complex structures that are highly soluble and easily hydrolyzed [79]. Approximately 20% to 40% of these dyes remain in the effluent and some are known to be toxic and carcinogenic [93]. Indeed, colour can be characterized by using visible region light source for absorption spectrum analysis. The strong absorption band can be tailored by ring substitution. In fact, in azo groups, structural geometrical changes occur upon absorption of light [72,94]. Colour can be fully characterized by the analysis of the absorption or transmission spectrum by means of optical fibre spectroscopy [77,95].
Spectrophotometry methods with a broad wavelength range have been chosen due to the fact the colour absorption band is highly correlated with the dye concentration in the substrate. This allows the synchronized and expeditious determination of the dyes studied [77]. A single spectral value (635 nm) for monitoring the dyebath was discussed by Sahin and Ulgen [78], and was used for the continuous monitoring system of denim yarns. Thus, choosing the suitable optical source for the specified application is very important. FOS requires data processing of the output signal to extract the desired measurement from the overwhelming amount of data. First stage information based on absorption spectra shape can be used for further classification by using optical spectral analysis. For example, optical spectral analysis accomplished through mathematical methods, such as principal component analysis (PCA) using partial least squares (PLS) algorithm to analyse interferences, usually exhibit overlapped spectra in dye mixtures [77]; or optical spectral analysis using multiple linear regression model to evaluate transmission and absorption spectra of dyes, and automated correction, have been applied in this research to get highly precise values for dye samples [79].
7.2. COD Detection
Oxygen demand is an important index for assessing the concentration of organic matter. Concentration of organic compounds can be estimated based on the amount of oxygen used for its complete degradation. Prediction of COD due to actual COD is related to oxidizeable minerals, carbohydrates, biodegradable organic matters and humic substances [28]. Due to the characteristics of aromatic substances and double bonds that exist in their molecular structures, most organic matters have absorption peaks, particularly in the UV region and absorbance at 254–280 nm [96,97].
Wastewater contains turbidity and suspended solid (SS) which can strongly affect the transmitted optical signals [98]. Measurement corrections have to be made using different wavelengths simultaneously. Research by Matsche and Stumwohrer in 1996 [27] showed that by using two different light source wavelengths, 254 nm and 350 nm, in wastewater, biological treatment plants can reduce the effect of light absorption from turbidity and suspended solids. This important finding in ultraviolet spectroscopy for rapid determination COD was then applied in research [80,82].
An alternate approach would be the use of optical techniques to monitor the quality of wastewater. According to investigation by Dornbush and Ryckman [99], 250 nm is a useful wavelength for absorbance measurements which can be applied in analysing organic contaminants.
In addition, according to [100], oxygen demand can be evaluated by using the 280 nm wavelength as absorbance value. Studies have illustrated the high correlation between UV absorption and organic matter in wastewater, Zhao et al. [81] have recently demonstrated a COD monitoring system that uses the UV-Vis spectrometry absorption method. With a wide optical range of 200 to 720 nm, a wider range of COD concentration can be covered, thus, COD concentration can be calculated from 30 to 1,000 mg/L via UV absorbance within an interval of 5 min. The main role of this research is to determine the capability of monitoring COD continuously and its potential use in on-line monitoring for surface waters.
Wu et al. [24] then proposed a similar sensor but with the addition of near infrared (IR) transmission for comparisons to UV absorbance as a method to quantify COD. Hydrocarbons in water can be determined by absorption spectroscopy in the infrared region [101]. In the ultraviolet and visible region, particular organic contaminants can be measured quantitatively, but no qualitative information can be provided. Near infrared (NIR) spectra are capable of providing quantitative as well as some qualitative information. Meanwhile infrared (IR) spectra can grant sufficient information for a distinct identification of the analyte [102]. The NIR method is appropriate for short paths because the light scattering coefficient is larger than that of the UV method in water. NIR transmission illustrates the technical advantages of rapid, highly selective, in situ monitoring [103].
A fluorescence approach for COD sensing was discussed by Hur et al. [3]. In their work, synchronous fluorescence spectra have been studied to estimate the COD concentration of sewer samples. In order to achieve a more sensitive fluorescence-based COD sensor, Hur et al. [82] used a fluorescence excitation-emission matrix with PARAFAC, combined with UV absorption indices, for real time BOD, COD and Total Nitrogen concentration evaluation of urban river waters using 220 nm and 254 nm optical sources. Optical techniques can be advanced by using fibre optics. This advanced technique had been introduced by Fang and Dai [83] for predicting the COD value of waste water. It only took 62 seconds of response time and the detection range from 0 to 350 mg/L was covered.
7.3. BOD Detection
Contemporary study reviews are more focused on absorption-based and fluorescent-based techniques for BOD fibre sensor application [28]. The absorption of excited and emitted wavelength by the sample can result in a fluorescence intensity attenuation known as the inner filtering effect. Inner filter effects are caused by the existence of other chromophores in the solution, which absorb in the same wavelength as water samples [104]. The common solution to minimize the effect is to apply some form of mathematical correction during the calculations for the diluted samples [88], most often based on the measured absorbance of the sample [105] or fluorescence intensity multiplied by a correction factor [106].
Larsson et al. [107] and Ahmad et al. [84] suggested using Raman scatter peaks to compensate for the attenuation of the incident excitation radiation. Henderson et al. [104] utilized the relationship between concentration and fluorescent intensity to relate a non-linear effect with wavelength and left the data uncorrected. Special attention and correction should be paid towards the fluorescence spectra, even though altering the pH of the original sample is not recommended [108]. As observed in the research by Reynolds et al. [109], fluorescence intensities increase with pH until 10 for raw sewage samples. According to the research of Patel-Sorentino et al. [110], similar results were obtained for fluorescence intensity, which increased to 10 due to the structure of humic substances that changed with the modifications in their environment. Most problems arise at highly concentrations of contaminant samples, in such case, filtration, dilution and absorption tests out for inner filter effect are suggested.
Despite this usefulness as a monitoring tool, however, fluorescence studies have simply relied on “sing e peak i king” to quantify the desired fluorescent components. Synchronous fluorescence can be used by fixing the excitation and emission wavelengths uniformly to get the spectra from a scan of the entire section of the excitation wavelength. This is an advanced way to obtain a better resolution of fluorescence spectra. This is because it can capture all fluorophores contained in the samples [111].
Fluorescence-based techniques with biosensors can be dividing into two general types: sandwich assays and direct methods. For the sandwich assay method, a primary immobilized cell is bonded to the surface of the fibre. The presence of target bio-molecule that bind (fluoresce) with the immobilized cell can then be excited by incident light and emission fluorescent [62]. Relations between fluorescence properties and natural waters were reported as early as 1910 by Dienart [112]. Preliminary results on the fluorescence and scattering properties of sewage have been established as well in 1993 [113]. In addition, the total integrated fluorescence intensity contributed by suspended material, the dissolved biodegradable or non-biodegradable organic matter can be correlated to the changes in BOD of water samples [84]. This technique used in BOD detection was demonstrated by Ahmad et al. [90] and Hur et al. [82]. A scheme of BOD biosensor is shown in Figure 8.
A BOD optical biosensor is generally designed with a respirometric and microbial type probe. Karube et al. [114] used Pseudomonas putida, and Riedel et al. [17] used Trichosporon cutaneum cells as the isolated bacterium for BOD detection. However, this probe has its limitations; oxygen consumption during the detection process will degrade the electrode. Electrochemical sensors based on the Clark-type oxygen electrode have been widely developed as the transducer of BOD sensors. Conceivably, the electrode used for oxygen measurement can be replaced by an optical (fluorescent) sensor. The major benefit of optical fibres over electrodes in the case of BOD measurements is that there is no oxygen consumption during measurement. Thus, no depletion of oxygen can occur [85] and it also does not require the frequent replacement of electrodes.
In addition, the direct method uses a fluorescent dye directly to measure the fluorescence quenching, where the reactive dye can react with specific compounds [62]. When used with an external fibre optic probe, the method takes advantage of ruthenium complexes. Ruthenium complexes are an attractive class of compounds for oxygen-stimulated fluorescence quenching in sensing applications. This is due to their high photochemical stability, high extinction coefficients, and absorption spectra the matches with the emission spectrum, for example, blue LED [115]. As a result, this fluorophore was immobilized in a photopolymerized hydrogel made from poly(ethylene glycol) diacrylate (PEGDA), [116] and was investigated for luminescence based tests suing fibre optic oxygen sensors [87].
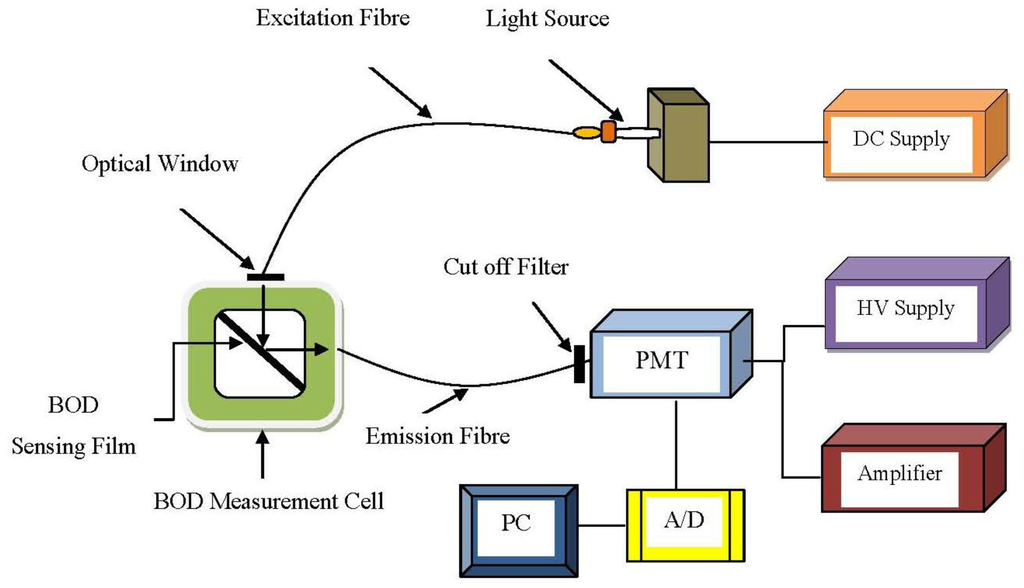
A microbial system should offer low selectivity, high assimilability and high bio-oxidation activity for a broad range of organic compounds [114]. Due to the fact each microbial species has its metabolic deficiencies, the universality of BOD sensor is restricted. As a result, it is essential to select an appropriate microorganism for a biosensor [117]. The first fibre optic microbial sensor for determination of BOD was demonstrated by Wolfbels et al. [85] with a fluorescence-based technique. A simple description had been shown as Figure 9 below.
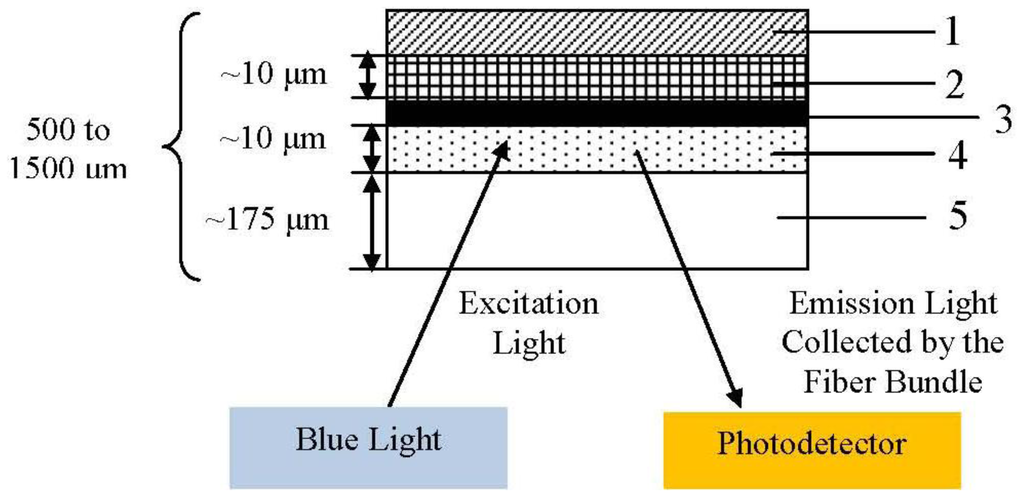
Trichosporon cutaneum cells immobilized in poly(vinyl alcohol) offer a biocompatible microenvironment for microorganisms and allow prompt response (diffusion) of organic compounds. Besides, tris(4,7-diphenyl-l,l-O-phenanthroline) ruthenium(II) perchlorate is used as the oxygen indicator. Excitation light (from the bottom) passes through the polyester support and excites fluorescence in the oxygen sensitive layer. Then, the emitted light is collected and guided by the fibre bundle to the photo detector. This research showed that estimation of BOD can be made rapidly, in about 5 to 10 min. It is possible to use this probe in situ for sewage plant effluents and municipal sewage monitoring, however, the short lifespan of the microbes and the thickness of cells are limitations that have to be overcome.
The strains were also studied by Karube et al. [86] using a conventional microorganism, Pseudomonas putida. This research demonstrates that there is a requirement for a maintenance-free microbial BOD sensor that has long term stability and is not affected by heavy metals. Nevertheless, the reproducibility of BOD sensors based on particular cells or activated sludge is often poor. Consequently, mixed strains on microorganisms immobilized within a single sensor were developed [117]. Kwok et al. [88] modified this sensor by immobilizing activated sludge cum Bacillus subtilis on oxygen sensing films and placing it underneath the sample vials. In an extensive study, Chen et al. [89] applied multiple microorganisms—B.licheniformis, D. maris and M. marinus—into a single microbial BOD biosensor.
8. Future Perspectives
Many researchers have studied the biochemical and genetically modified bacteria bio-luminescence. The microorganisms genetically modified to emit luminescence which are immobilized onto an exposed-core of a fibre optic, provide a convenient method to multiply the possibilities for rapid, simple and sensitive screening of the environmental conditions [118]. This application was presented by Belkin et al. [119] for pollution monitoring in soil and water. These discoveries have revolutionized the use of luminescent genes as fibre optics biosensors for environmental studies [120].
9. Challenges
In spite of the progress in the optical sensors, there are still some limitations that need to be addressed. For example, optical instruments are affected by susceptibility to surrounding variations, e.g., pH, turbidity, temperature, flow rate and so on. Optical fibres are susceptible to physical perturbations, such as bending, kinking and crushing. In addition, the assembly of optical components for the sensor also requires tremendously high precision and accuracy, especially for placement of optical components, which normally has a tolerance of less than a micrometer. This tolerance is vital to guarantee the reliability of the resulting device. This is where the real challenge lies in the case of FOS and control schemes [121]. Thus, fibre optics chemical sensors continue to attract strong research and development interest.
10. Conclusions
Some of the latest developments in colour, COD and BOD sensing using bulk optic and fibre optic approaches have been thoroughly reviewed. The design of FOS has evolved from the use of simple techniques based on intensity modulation to advanced techniques based on absorption and fluorescence analysis. In terms of applicability, although both the absorption and fluorescence-based sensors produce better performance, they are not widely used in the detection of COD and BOD. Perhaps this is due the large number of components in wastewater that cannot be differentiated by these methods alone. Further study to improve the effectiveness of these methods can be initiated especially on improving the selectivity, sensitivity, and robustness of FOS.
Acknowledgments
The authors are grateful to the University of Malaya High Impact Research Grant (HIR-MOHE-D000037-16001) from the Ministry of Higher Education Malaysia which financially supported this work.
Conflict of Interest
The authors declare no conflict of interest.
References
- Department of Environmental (DOE). Malaysia Environmental Quality Report. In Strategic Communications Division; ISSN 0127-6433; DOE: Petaling Jaya, Malaysia, 2006; p. 72. [Google Scholar]
- Department of Environmental (DOE). Malaysia Environmental Quality Report. In Strategic Communications Division; ISSN 0127-6433; DOE: Petaling Jaya, Malaysia, 2011; p. 87. [Google Scholar]
- Hur, J.; Lee, B.-M.; Lee, T.-H.; Park, D.-H. Estimation of biological oxygen demand and chemical oxygen demand for combined sewer systems using synchronous fluorescence spectra. Sensors 2010, 10, 2460–2471. [Google Scholar]
- Kao, K.C.; Hockham, G.A. Dielectric-fibre surface waveguides for optical frequencies. IEEE Proc. 1986, 133, 191–198. [Google Scholar]
- Ahmad, A.B.H. Development of a Portable Optical Fibre Chemica Sensor Measuring Instrument. Ph.D. Thesis, University of Manchester, Manchester, UK, 1994. [Google Scholar]
- Mignani, A.G.; Ciaccheri, L.; Cucci, C.; Mencaglia, A.A.; Cimato, A.; Attilio, C.; Ottevaere, H.; Thienpont, H.; Paolesse, R.; Mastroianni, M.; et al. EAT-by-LIGHT: Fiber-Optic and micro-optic devices for food quality and safety assessment. IEEE Sens. J. 2008, 8, 1342–1354. [Google Scholar]
- Burns, D.A.; Ciurczak, W. Handbook of Near-Infrared Analysis, 3rd ed.; CRC Press: Boca Raton, FL, USA, 2007. [Google Scholar]
- Guwy, A.J.; Farley, L.A.; Cunnah, P.; Hawkes, F.R.; Hawkes, D.L.; Chase, M.; Buckland, H. An automated instrument for monitoring oxygen demand in polluted waters. Water Res. 1999, 33, 3142–3148. [Google Scholar]
- American Public Health Association, A. Standard Methods for the Examination of Water and Wastewater, 18th ed.; American Water Works Association and Water Environment Federation: Washington, DC, USA, 1992. [Google Scholar]
- Ohno, Y.; Hardis, J.E. Four-Color Matrix Method for Correction of Tristimulus Colorimeters. In Color and Imaging, 5th ed.; Society for Imaging Science and Technology: Scottsdale, AZ, USA, 1997; pp. 301–305. [Google Scholar]
- Kao, C.M.; Chou, M.S.; Fang, W.L.; Liu, B.W.; Huang, B.R. Regulating colored textile wastewater By 3/31 wavelength ADMI methods in Taiwan. Chemosphere 2001, 44, 1055–1063. [Google Scholar]
- Kim, H.; Lim, H.; Colosimo, M.F. Determination of chemical oxygen demand (COD) using ultrasound digestion and oxidation-reduction potential-based titration. Environ. Sci. Health A 2007, 42, 1665–1670. [Google Scholar]
- Slatter, N.P.; Alborough, H. Chemical oxygen demand using microwave digestion: A tentative new method. Water SA 1992, 18, 145–147. [Google Scholar]
- Han, S.; Gan, W.; Jiang, X.; Zi, H.; Su, Q. Introduction of electromagnetic induction heating technique into on-line chemical oxygen demand determination. Int. J. Environ. Anal. Chem. 2010, 90, 137–147. [Google Scholar]
- Hou, X.; Su, Y.; Li, X.; Chen, H.; Lv, Y. Rapid, sensitive and on-line measurement of chemical oxygen demand by novel optical method based on UV photolysis and chemiluminescence. Microchem. J. 2007, 87, 56–61. [Google Scholar]
- Roppola, K.; Kuokkanen, T.; Ramo, J.; Prokkola, H.; Heiska, E. Comparison study of different BOD tests in the determination of BOD7 evaluated in a model domestic sewage. Autom. Methods Manag. Chem. 2007, 2007, 1–4. [Google Scholar]
- Riedel, K.; Lange, K.P.; Stein, H.J.; Kuhn, M.; Ott, P.; Scheiler, F. A Microbial sensor for BOD. Water Res. 1990, 24, 883–887. [Google Scholar]
- Anjum, M.; Shekhar, H.; Hyun, S.H.; Hong, S.; Cho, H.J. A Disposable BOD Microsensor Using a Polymer Substrate. Proceeding of the IEEE Sensors Conference, Vienna, Austria, 24–27 October 2004; pp. 1202–1205.
- Fayyad, M.; Tutunji, M.; Ramakrishna, R.S.; Taha, Z. Dissolved oxygen: Method comparison with potentiometric stripping analysis. Anal. Lett. 1987, 20, 529–535. [Google Scholar]
- Maidment, C.; Mitchell, P.; Westlake, A. Measuring aquatic organic pollution by the permanganate value method. Biol. Educ. 1997, 31, 126–130. [Google Scholar]
- Lima, R.O.A.A.D.; Bazo, A.P.; Salvadori, D.M.F.A.; Rech, C.E.M.; Oliveira, D.D.P.; Umbuzeiro, G.d.A.A. Mutagenic and carcinogenic potential of a textile azo dye processing plant effluent that impacts a drinking water source. Mutat. Res. 2007, 626, 53–60. [Google Scholar]
- Pelàez-Cid, A.-A.; Blasco-Sancho, S.; Matysik, F.-M. Determination of textile dyes by means of non-aqueous capillary electrophoresis with electrochemical detection. Talanta 2008, 75, 1362–1368. [Google Scholar]
- Sawyer, C.N.; McCarty, P.L.; Parkin, G.F. Chemistry For Environmental Engineering, 4th ed.; McGraw-Hill, Inc: Singapore, 1994. [Google Scholar]
- Wu, G.; Bi, W.; Lau, J.; Fu, G. Determination of chemical oxygen demand in water using near-infrared transmission and UV absorbance method. Chin. Opt. Lett. 2011, 6, 1486–1489. [Google Scholar]
- Brookman, S.K.E. Estimation of biochemical oxygen demand in slurry and effluents using ultra-violet spectrophotometry. Water Res. 1997, 31, 372–374. [Google Scholar]
- Nataraja, M.; Qin, Y.; Seagren, E.A. Ultraviolet spectrophotometry as an index parameter for estimating the biochemical oxygen demand of domestic wastewater. Environ. Technol. 2006, 27, 789–800. [Google Scholar]
- Matsche, N.; Stumwohrer, K. UV absorption as control-parameter for biological treatment plants. Water Sci. Technol. 1996, 33, 211–218. [Google Scholar]
- Kim, H.; Kwak, J.Y.; Khang, B.; Kim, E. Estimation of biochemical oxygen demand based on dissolved organic carbon, UV absorption and fluorescence measurement. Chemistry 2013, 2013, 9 pages. [Google Scholar]
- Bourgeois, W.; Burgess, J.E.; Stuetz, R.M. On-line monitoring of wastewater quality: A review. Chem. Technol. Biotechnol. 2001, 76, 337–348. [Google Scholar]
- Weber, A. Meeting the Fiber Optics Challenge. Assembly 2001. [Google Scholar]
- Udd, E. An overview of fiber-optic sensors. Rev. Sci. Instrum. 1995, 66, 4015–4030. [Google Scholar]
- Grattan, K.T.V.; Sun, T. Fiber optic sensor technology: An overview. Sens. Actuators A Phys. 2000, 82, 40–61. [Google Scholar]
- Thyagarajan, K.; Ghatak, A. Fiber Optic Essentials; John Wiley & Sons Inc: Hoboken, NJ, USA, 2007. [Google Scholar]
- Vahala, K.J. Optical microcavities. Nature 2003, 424, 839–846. [Google Scholar]
- Ahmed, S.F. Preparation and Characterization of Hollow Fiber Nanofiltration Membranes. M.Sc. Thesis, University of Technology, Baghdad, Iraq, 2005. [Google Scholar]
- Udd, E.; William, B.S., Jr. Fiber Optic Sensors: An Introduction For Engineers and Scientists, 2nd ed.; John Wiley & Sons, Inc: Singapore, 2011; p. 498. [Google Scholar]
- Kersey, A.D. A review of recent developments in fiber optic sensor technology. Opt. Fiber Technol. 1996, 2, 291–317. [Google Scholar]
- Zhu, Y.; Wang, A. Miniature fiber-optic pressure sensor. IEEE Photonic Technol. Lett. 2005, 17, 447–449. [Google Scholar]
- Xu, J.; Wang, X.; Cooper, K.L.; Wang, A. Miniature all-silica fiber optic pressure and acoustic sensors. Opt. Lett. 2005, 30, 3269–3271. [Google Scholar]
- Murphy, K.A.; Gunther, M.F.; Vengsarkar, A.M.; Claus, R. Quadrature phase-shifted, extrinsic fabry-perot optical fiber sensors. Opt. Lett. 1991, 16, 273–275. [Google Scholar]
- Lin, J. Recent development and applications of optical and fiber-optic pH sensors. Trac-Trend Anal. Chem. 2000, 19, 541–552. [Google Scholar]
- Bhatia, V. Applications of long-period gratings to single and multi-parameter sensing. Opt. Express 1999, 4, 457–466. [Google Scholar]
- Narayanaswamy, R.; Vaughan, A.A. Optical fibre reflectance sensors for the detection of heavy metal ions based on immobilised Br-PADAP. Sens. Actuators B Chem. 1998, 51, 368–376. [Google Scholar]
- Yeo, T.L.; Sun, T.; Grattan, K.T.V. Review: Fibre-optic sensor technologies for humidity and moisture measurement. Sens. Actuat. A Phys. 2008, 144, 280–295. [Google Scholar]
- Ojeda, C.B.; Rojas, F.S. Recent development in optical chemical sensors coupling with flow injection analysis. Sensors 2006, 6, 1245–1307. [Google Scholar]
- George, H.S., Jr.; Zhou, Q.; Shahriari, M.R.; Kritz, D. Porous fiber optic sensor for high-sensitivity humidity measurements. Anal. Chem. 1988, 60, 2317–2320. [Google Scholar]
- Wolfbeis, O.S. Analytical chemistry with optical sensors. Anal. Bioanal. Chem. 1986, 325, 387–392. [Google Scholar]
- Gaigalas, A.K.; Li, L.; Henderson, O.; Vogt, R.; Barr, J.; Marti, G.; Weaver, J.; Schwartz, A. The development of fluorescence intensity standards. Res. Natl. Inst. Stand. Technol. 2001, 106, 381–389. [Google Scholar]
- Carstea, E.M. Fluorescence Spectroscopy as a Potential Tool for in-situ Monitoring of Dissolved Organic Matter in Surface Water Systems. In Water Pollution; Balkis, P.N., Ed.; InTech: Rijeka, Croatia, 2012; Volume 1. [Google Scholar]
- Baker, A. Thermal fluorescence quenching properties of dissolved organic matter. Water Res. 2005, 39, 4405–4412. [Google Scholar]
- Keltona, N.; Molotb, L.A.; Dillonc, P.J. Spectrofluorometry properties of dissolved organic matter from central and southern ontario streams and the influence of iron and irradiation. Water Res. 2007, 41, 638–646. [Google Scholar]
- Yuan, J.; El-Sherif, A.M. Fiber-Optic chemical sensor using polyaniline as modified cladding material. IEEE Sens. J. 2003, 3, 5–12. [Google Scholar]
- Elosua, C.; Matias, I.R.; Bariain, C.; Arregui, F.J. Volatile organic compound optical fiber sensors: A review. Sensors 2006, 6, 1440–1465. [Google Scholar]
- Palais, J.C. Fiber Optic Communications, 5th ed.; Prentice Hall: New Jersey, United State, 2005. [Google Scholar]
- Ahmad, M.; Hench, L.L. Effect of taper geometries and launch angle on evanescent wave penetration depth in optical fibers. Biosens. Bioelectron. 2005, 20, 1312–1319. [Google Scholar]
- Khalil, S.; Bansal, L.; El-Sherif, M. Intrinsic fiber optic chemical sensor for the detection of dimethyl methylphosphonate. Opt. Eng. 2004, 43, 2683–2688. [Google Scholar]
- Jha, R.; Villatoro, J.; Badenes, G. Ultrastable in reflection photonic crystal fiber modal interferometer for accurate refractive index sensing. Appl. Phys. Lett. 2008, 93, 191106:1–191106:3. [Google Scholar]
- Shinomiya, N.; Goh, L.S.; Onodera, K.; Kanetsuna, M.; Watanabe, K. Constructing an Optical Fiber Sensor Network for Natural Environment Remote Monitoring. Proceedings of the IEEE Asia-Pacific Conference on Communications (APCC), Kota Kinabalu, Malaysia, 2–5 October 2011; Volume 17, pp. 208–212.
- James, S.W.; Tatam, R.P. Optical fibre long-period grating sensors: Characteristics and application. Meas. Sci. Technol. 2003, 14, 49–61. [Google Scholar]
- Arregui, F.J.; Claus, R.O.; Cooper, K.L.; Fernandez-Valdivielso, C.; Matias, I.R. Optical fiber gas sensor based on self-assembled gratings. Lightwave Technol. 2001, 19, 1932–1937. [Google Scholar]
- Nolan, D.A.; Blaszyk, P.E.; Udd, E. Optical Fibers. In Fiber Optic Sensors: An Introduction for Engineers and Scientists; Udd, E., Ed.; John Wiley & Sons, Inc: United States, 1991; p. 33. [Google Scholar]
- Leung, A.; Shankar, P.M.; Mutharasan, R. A review of fiber-optic biosensors. Sens. Actuators B Chem. 2007, 125, 688–703. [Google Scholar]
- Minkovich, V.P.; Monzón-Hernández, D. Microstructured optical fiber coated with thin films for gas and chemical sensing. Opt. Express 2006, 14, 8413–8418. [Google Scholar]
- Dawson, P.; Puygranier, B.A.F. Chemical etching of optical fibre tips-experiment and model. Ultramicroscopy 2000, 85, 235–248. [Google Scholar]
- Kurkjian, C.R.; Matthewson, M.J.; Rooney, J.M. Effects of Heat Treatment and HF Etching On The Strength of Silica Lightguides. In Reliability of Optical Fiber Components, Devices, Systems, and Networks II; Limberger, H.G., Matthewson, M.J., Eds.; SPIE: Bellingham, WA, USA, 2004; Volume 5465, pp. 223–229. [Google Scholar]
- Lim, K.-S.; Chiam, Y.-S.; Phang, S.-W.; Chong, W.-Y.; Pua, C.-H.; Zulkifli, A. Z.; Ganesan, I.; Harun, S.W.; Ahmad, H. A Polyaniline-Coated integrated microfiber resonator for UV detection. IEEE Sens. J. 2013, 13, 2020–2025. [Google Scholar]
- Renqiang, L.; Zhuang, F.; Yanzheng, Z.; Qixin, C.; Shuguo, W. In Operation Principle of a Bend Enhanced Curvature Optical Fiber Sensor. Proceedings of the 2006 IEEE/RSJ International Conference on Intelligent Robots and Systems, Beijing, China, 9–15 October 2006; pp. 1966–1971.
- Peters, K. Polymer optical fiber sensors-A review. Smart Mater. Struct. 2011, 20, 1–17. [Google Scholar]
- Bernini, R.; Gravina, R.; Testa, G. Perfluorinated plastic optical fiber tapers for evanescent wave sensing. Sensors 2009, 9, 10423–10433. [Google Scholar]
- Guo, L.; Ni, Q.; Li, J.; Zhang, L.; Lin, X.; Xie, Z.; Chen, G. A novel sensor based on the porous plastic probe for determination of dissolved oxygen in seawater. Talanta 2008, 74, 1032–1037. [Google Scholar]
- Villatoro, J.; Monzón-Hernández, D. Low-cost optical fiber refractive-index sensor based on core diameter mismatch. Lightwave Technol. 2006, 24, 1409–1413. [Google Scholar]
- Kima, K.T.; Moona, N.I.; Kimb, H.-K. A fiber optic UV sensor based on a side-polished single mode fiber covered with azobenzene dye-doped polycarbonate. Sens. Actuators A Phys. 2010, 160, 19–21. [Google Scholar]
- MacCraith, E.D.; Malins, C.; Landl, M.; Simon, P. Fibre optic ammonia sensing employing novel near infrared dyes. Sens. Actuators B Chem. 1998, 51, 359–367. [Google Scholar]
- Lee, S.T.; Gin, J.; Nampoori, V.P.N.; Vallabhan, C.P.G.; Unnikrishnan, N.V.; Radhakrishnan, P. A sensitive fibre optic ph sensor using multiple sol-gel coatings. J. Opt. A Pure Appl. Opt. 2001, 3, 355–359. [Google Scholar]
- Ghatak, A.; Thyagarajan, K. Introduction to Fiber Optics; Cambridge University Press: Cambridge, UK, 2004; p. 565. [Google Scholar]
- Moore, J.N.; Abbott, L.C.; Batchelor, S.N.; Smith, J.R.L. Resonance Raman and UV–visible spectroscopy of black dyes on textiles. Forensic Sci. Int. 2010, 202, 54–63. [Google Scholar]
- Gene, J.; Blanco, M.; Canals, T.; Coello, J.; Iturriaga, H.; Maspocha, S. Direct determination of leather dyes by visible reflectance spectroscopy using partial least-squares regression. Anal. Chim. Acta 2000, 419, 209–214. [Google Scholar]
- Sahin, U.; Ulgen, A. Real-Time monitoring of indigo concentrations in the dyebath with a laser diode spectrometer. Text. Res. J. 2004, 74, 193–197. [Google Scholar]
- Conde, O.M.; Cubillas, A.M.; Anuarbe, P.; Lopez-Higuera, J.M. Fiber-Optic Spectroscopic Sensor for Reactive Dye Mixture Spectrum Synthesis in Textile Industry. Proceedings of IEEE Sensors 2009 Conference, Christchurch, New Zealand, 25–28 October 2009; Volume 8, pp. 136–139.
- Huoliang, K.; Huifang, W. A rapid determination method of chemical oxygen demand in printing and dyeing wastewater using ultraviolet spectroscopy. Water Environ. Res. 2009, 81, 2381–2386. [Google Scholar]
- Zhao, Y.; Li, Y.; Zhen, Y.; Fang, Y. A novel monitoring system for COD using optical ultraviolet absorption method. Procedia Environ. Sci. 2011, 10, 2348–2353. [Google Scholar]
- Hur, J.; Cho, J. Prediction of BOD, COD, and total nitrogen concentrations in a typical urban river using a fluorescence excitation-emission matrix with PARAFAC and UV absorption indices. Sensors 2012, 12, 972–986. [Google Scholar]
- Fang, J.; Dai, L. Rapid Detection of Chemical Oxygen Demand Using Least Square Support Vector Machines. Proceedings of the Fifth World Congress on Intelligent Control and Automation (WCICA 2004), Hangzhou, China, 15–19 June 2004; pp. 3810–3813.
- Ahmad, S.R.; Reynolds, D.M. Rapid and direct determination of wastewater BOD values using a fluorescence technique. Water Res. 1997, 31, 2012–2018. [Google Scholar]
- Wolfbels, O.S.; Preinlnger, C.; Kllmant, I. Optical fiber sensor for biological oxygen demand. Anal. Chem. 1994, 66, 1841–1846. [Google Scholar]
- Karube, I.; Chee, G.J.; Nomura, Y.; Ikebukuro, K. Optical fiber biosensor for the determination of low biochemical oxygen demand. Biosens. Bioelectron. 2000, 15, 371–376. [Google Scholar]
- Bondi, M.C.M.; Orellana, G. From Molecular Engineering of Luminescent Indicators to Environmental Analytical Chemistry in the Field with Fiber-optic (Bio)sensors. Proceedings of the 15th Optical Fiber Sensors Conference Technical Digest (OFS 2002), Portland, OR, USA,, 10 May 2002; Volume 1, pp. 115–118.
- Kwok, Y.W.; Kwok, N.Y.; Dong, S.; Lo, W. An optical biosensor for multi-sample determination of biochemical oxygen demand (BOD). Sens. Actuators B Chem. 2005, 110, 289–298. [Google Scholar]
- Chen, X.; Lin, L.; Xiao, L.L.; Huang, S.; Zhao, L.; Cui, J.S.; Wang, X.H. Novel BOD optical fiber biosensor based on co-immobilized microorganisms in ormosils matrix. Biosens. Bioelectron. 2006, 21, 1703–1709. [Google Scholar]
- Karayannis, M.I.; Paleologos, E.K.; Prodromidis, M.I.; Giokas, D.L.; Pappas, A.C. Highly selective spectrophotometric determination of trace cobalt and development of a reagentless fiber-optic sensor. Anal. Chim. Acta 2002, 467, 205–215. [Google Scholar]
- Buerck, J.; Roth, S.; Kraemer, K.; Scholz, M.; Klaas, N. Application of A Fiber-optic NIR-EFA sensor system for in-situ monitoring of aromatic hydrocarbons in contaminated groundwater. J. Hazard. Mater. 2001, 83, 11–28. [Google Scholar]
- Wei, Y.; Hao, X. Decolorization of Azo Dyes Wastewater By Electrochemical Oxidation. Proceedings of the 3rd International Conference on Bioinformatics and Biomedical Engineering (ICBBE 2009), Beijing, China, 11–13 June 2009; pp. 1–4.
- Inaloo, K.D.; Naddafi, K.; Mesdaghinia, R.; Nasseri, S.; Nodehi, N.; Rahimi, A. Optimization of operational parameters for decolorization and degradation of C.I. Reactive Blue 29 By Ozone. Iran. J. Environ. Health. Sci. Eng. 2011, 8, 227–234. [Google Scholar]
- Mahimwalla, Z.; Yager, K.G.; Mamiya, J.; Shishido, A.; Priimagi, A.; Barrett, C.J. Azobenzene photomechanics: Prospects and potential applications. Polym. Bull. 2012, 69, 967–1006. [Google Scholar]
- Grattan, K.T.V. Principles of optical fibre sensing for water industry applications. Measurement 1997, 20, 109–119. [Google Scholar]
- Liu, J.; Mattiasson, B. Microbial BOD sensors for wastewater analysis. Water Res. 2002, 36, 3786–3802. [Google Scholar]
- Dobbs, R.A.; Wise, R.H.; Dean, R.B. The use of ultra-violet absorbance for monitoring the total organic carbon content of water and wastewater. Water Res. 1972, 6, 1173–1180. [Google Scholar]
- Aiestaran, P.; Arrue, J.; Zubia, J. Design of a sensor based on plastic optical fibre (POF) to measure fluid flow and turbidity. Sensors 2009, 9, 3790–3800. [Google Scholar]
- Dornbush, J.N.; Ryckman, D.W. The effects of physiochemical processes in removing organic contaminants. Water Pollut. Control Fed. 1963, 35, 1325–1338. [Google Scholar]
- Mrkva, M. Investigation of organic pollution of surface waters by ultraviolet spectrophotometry. Water Pollut. Control Fed. 1969, 41, 1923–1931. [Google Scholar]
- Sensfelder, E.; Bürck, J.; Ache, H.J. Determination of hydrocarbons in water by evanescent wave absorption spectroscopy in the near-infrared region. Fresen. J. Anal. Chem. 1996, 354, 848–851. [Google Scholar]
- Russo, R.E.; Klunder, G.L. Core-Based intrinsic fiber-optic absorption sensor for the detection of volatile organic compounds. Appl. Spectrosc. 1995, 49, 379–385. [Google Scholar]
- Martin, P.A. Near-infrared diode laser spectroscopy in chemical process and environmental air monitoring. Chem. Soc. Rev. 2002, 31, 201–210. [Google Scholar]
- Henderson, R.K.; Bakera, A.; Murphya, K.R.; Hamblya, A.; Stuetza, R.M.; Khana, S.J. Fluorescence as a potential monitoring tool for recycled water systems: A review. Water Res. 2009, 43, 863–881. [Google Scholar]
- Lakowicz, J.R. Principles of Fluorescence Spectroscopy, 3rd ed.; Springer: London, UK, 2006. [Google Scholar]
- Valeur, B. Molecular Fluorescence: Principles and Applications; Wiley-VCH: Weinheim, Germany, 2001. [Google Scholar]
- Larsson, T.; Wedborg, M.; Turner, D. Correction of inner-filter effect in fluorescence excitation-emission matrix spectrometry using raman scatter. Anal. Chim. Acta 2007, 583, 357–363. [Google Scholar]
- Baker, A.; Elliott, S.; Lead, J.R. Effects of filtration and ph perturbation on freshwater organic matter fluorescence. Chemosphere 2007, 67, 2035–2043. [Google Scholar]
- Reynolds, D.M.; Ahmad, S.R. The effect of metal ions on the fluorescence of sewage wastewater. Water Res. 1995, 29, 2214–2216. [Google Scholar]
- Entino, N.P.S.; Mounier, S.; Lucas, Y.; Benaim, J.Y. Effects of UV-visible irradiation on natural organic matter from the amazon basin. Sci. Total Environ. 2004, 321, 231–239. [Google Scholar]
- Pavasant, P.; Janhom, T.; Wattanachira, S. Characterization of brewery wastewater with spectrofluorometry analysis. J. Environ. Manag. 2009, 90, 1184–1190. [Google Scholar]
- Dienert, F. Research on fluorescent substances in the control of disinfection of water. Compt. Rend. Acad. Sci. 1910, 150, 487–488. [Google Scholar]
- Ahmad, S.R.; Foster, V.G.; Reynolds, D.M. Laser Scattering Technique For The Non-Invasive Analysis of Wastewater. Proceedings of the Substance Detection Systems Conference, Innsbruck, Austria, 28 March 1993; pp. 353–359.
- Chee, G.J.; Nomura, Y.; Ikebukuro, K.; Karube, I. Development of highly sensitive BOD sensor and its evaluation using preozonation. Anal. Chim. Acta 1999, 394, 65–71. [Google Scholar]
- Murtagh, M.T.; Shahriari, M.R. A study of the effects of organic modification and processing technique on the luminescence quenching behavior of sol-gel oxygen sensors based on a Ru(II) complex. Chem. Mater. 1998, 10, 3862–3869. [Google Scholar]
- Neal, D.P.O.; Meledeo, M.A.; Davis, J.R.; Ibey, B.L.; Gant, V.A.; Pishko, M.V.; Coté, G.L. Oxygen sensor based on the fluorescence quenching of a ruthenium complex immobilized in a biocompatible Poly(Ethylene glycol) hydrogel. IEEE Sens. J. 2004, 4, 728–734. [Google Scholar]
- Dong, S.; Jia, J.; Tang, M.; Chen, X.; Qi, L. Co-Immobilized microbial biosensor for BOD estimation based on Sol/Gel derived composite material. Biosens. Bioelectron. 2003, 18, 1023–1029. [Google Scholar]
- Girotti, S.; Ferri, E.N.; Fumo, M.G.; Maiolini, E. Monitoring of environmental pollutants by bioluminescent bacteria. Anal. Chim. Acta 2008, 608, 2–29. [Google Scholar]
- Belkin, S. Genetically Engineered Microorganism for Pollution Monitoring. In Soil and Water Pollution Monitoring, Protection and Remediation; Twardowska, I., Allen, H.E., Haggblom, M.H., Eds.; Springer: Krakow, Poland, 2005. [Google Scholar]
- Polyak, B.; Bassis, E.; Novodvorets, A.; Belkin, S.; Marks, R.S. Bioluminescent whole cell optical fiber sensor to genotoxicants: system optimization. Sens. Actuators B Chem. 2001, 76, 18–26. [Google Scholar]
- Selvarajan, A.; Asundi, A. Photonics, fiber optic sensors and their applications in smart structures. Non-Destruct. Eval. 1995, 15, 41–56. [Google Scholar]
| Nomenclature | |
|---|---|
| COD | Chemical Oxygen Demand |
| BOD | Biological Oxygen Demand |
| TOC | Total Organic Carbon |
| SS | Suspended Solid |
| DOC | Dissolved Organic Carbon |
| FOS | Fibre Optics Sensor |
| POF | Plastic Optics Sensor |
| n1 or ncore | Refractive Index Core Fibre |
| n2 or nclad | Refractive Index Cladding Fibre |
| n2 material | Refractive Index Modified Cladding Fibre |
| Io | Incident Intensity |
| I | Transmitted Intensity |
| α | Attenuation Coefficient |
| L | Length of Fibre |
| K | Quantum Efficiency |
| ε | Molar Absorptivity |
| I | Intensity of the Incident Light |
| C | Concentration of Fluoresces |
| TIR | Total Internal Reflection |
| dp | Penetration Depth |
| λ | Wavelength of the Propagating Signal in the Optical Fibre |
| θ | Angle of Incidence Normal at the Interface |
| EW | Evanescent Wave |
| DOE | Department of Environmental, Malaysia |
| FBG | Fibre Bragg Grating |
| LPG | Long Period Grating |
| PVA | polyvinyl alcohol |
| PEGDA | poly(ethylene glycol) diacrylate |
© 2013 by the authors; licensee MDPI, Basel, Switzerland. This article is an open access article distributed under the terms and conditions of the Creative Commons Attribution license (http://creativecommons.org/licenses/by/3.0/).