Abstract
This study analyzes the provisioning strategy of the European Scops Owl (Otus scops) via continuous video monitoring of a breeding pair in a peri-urban Mediterranean forest in NE Spain (n = 724 deliveries). Invertebrates dominated numerically, with Orthoptera constituting 64.6%. Although vertebrates were scarce (1.8%), they contributed disproportionately to total biomass (20.8%), with rodents alone accounting for 20.3% of delivered energy. Parental effort followed a bimodal nocturnal rhythm, peaking at darkness onset (22:00 h) and before dawn. Crucially, we found a significant predation bias towards female orthopterans (65.6% vs. 34.3%; p < 0.001). While driven by Meconema thalassinum, selection in larger species like Tettigonia viridissima evidences a strategy focused on biomass profitability. Since Ensifera biomass scales allometrically (W ), selecting females yields disproportionate energetic gains. We also report the systematic removal of ovipositors prior to delivery, a behavior that optimizes intake but renders high-value females undetectable in traditional pellet analyses. These results suggest O. scops exploits artificial light sources (“streetlight traps”) to maximize foraging efficiency.
1. Introduction
The Eurasian Scops Owl (Otus scops, Linnaeus, 1758) is a predominantly nocturnal owl belonging to the western Palaearctic faunal zone [1]. As one of Europe’s smallest raptors, the species is ecologically characterized by its high degree of specialization on insectivorous prey [2]. This specialization dictates both its habitat selection and its migratory life history. The species is largely an Afro-Palaearctic long-distance migrant, with the majority of individuals moving to sub-Saharan Africa during the winter months [1]. For the Scops Owl specifically, quantitative data on density and breeding performance remains scarce relative to other European owl species [3,4]. Despite being considered as Least Concern [5], reports of declines in countries at the edge of its distribution [6,7] and within traditional strongholds (e.g., Italy, Greece, Spain) [2,8,9] reflect an overall population decline for the European and Mediterranean populations (<20% in the Spanish breeding population) [5]. The owl’s dependence on invertebrates is profound, with diet analysis in some breeding season studies demonstrating that insect material can comprise up to 90% of the prey items consumed, numerically [2,7]. This exceptional degree of specialization, particularly on Orthoptera, makes O. scops highly vulnerable to the systemic decline in insect populations [10,11] and to changes in insect communities [12] observed across Europe. This perspective firmly establishes the Eurasian Scops Owl as an indicator of the ecological health and invertebrate biomass availability in European agro-ecosystems [7,13]. While the analysis of pellets and nest remains has long corroborated this specialization [2,7,8,14], these methods inherently underestimate the intake of soft-bodied prey due to thorough digestion, a methodological limitation [15]. Direct observation and nestbox cameras effectively overcome bias by allowing researchers to accurately record every prey item delivered to the nest, regardless of digestibility. This technique has been used in combination with pellets [2], demonstrating that traditional pellet analysis systematically under-represents the total prey items consumed. Several studies on small owls, such as Aegolius funereus (Linnaeus, 1758) and Athene noctua (Scopoli, 1769), confirmed the precise evaluation of representation of individual prey when using cameras, without biasing the proportion of soft-bodied prey such as earthworms [16,17]. But while its diet is well-documented as primarily insectivorous, focusing on Orthoptera and Lepidoptera, the fine-scale mechanisms of prey selection remain poorly understood.
The primary objective of this study is to characterize the provisioning strategy of Otus scops, evaluating whether the observed patterns align with an energy-maximization principle. To this end, we employed high-resolution continuous video monitoring to sequentially address four key research tasks: first, to quantify the actual taxonomic composition of the diet, thereby overcoming the underestimation of soft-bodied prey inherent in pellet analysis; second, to assess the energetic return of prey items, specifically analyzing whether predation on sexually dimorphic orthopterans is skewed towards the larger, more profitable sex; third, to determine the temporal organization of parental effort by analyzing circadian provisioning rhythms; and finally, to document prey handling behaviors, such as ovipositor removal, to identify specific adaptations designed to optimize the nestlings’ energy intake rate.
2. Materials and Methods
2.1. Study Site and Data Collection
Data collection was conducted from 30 June to 10 July 2025, comprising a total of 11 nights of motion-triggered video monitoring (approximately 90 h of active surveillance). The study site was located in the garden of a private residence on the outskirts of the Can Canyamars residential area (Dosrius, Barcelona province, Spain). The immediate surroundings are forested, dominated by Stone Pine (Pinus pinea), mature Holm Oaks (Quercus ilex), and scattered Cork Oaks (Quercus suber), with a one-hectare grass-dominated open field located approximately 100 m from the nest.
The study originated from an emergency rescue intervention following the collapse of the natural nest on 28 June, which consisted of an unstable accumulation of pine needles located in a large pine. The collapse resulted in the fall of the entire clutch to the ground, causing the death of two nestlings. The remaining survivors were immediately collected and protected in a cardboard box indoors to prevent predation and environmental stress while a replacement nest box was built. To ensure their survival, a wooden nest box was constructed and installed on the same day on the nearest suitable support—a Cork Oak (Quercus suber) located approximately 10 m from the original site. The chicks were transferred to the new box on the same day. Monitoring began immediately to verify parental acceptance, which occurred that same night without delay. Unfortunately, videos from de 28 and 29 June were lost, so the period of video monitoring started 30 June. The box featured a frontal perch and a transparent methacrylate side panel to allow for the recording of internal activity without interfering with the animals’ behavior (Figure 1). It was equipped with a solar-powered camera with night vision capabilities placed at 50 cm of the box, and with a resolution of 1080 p (model Tzziel 3G/4G LTE, Tzziel, Shenzhen, China).
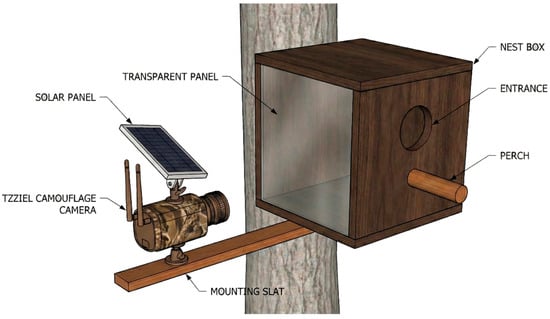
Figure 1.
Schematic diagram of the video monitoring setup installed at the nest site. The wooden nest box was modified with a 20 cm cylindrical perch to facilitate adult access and prey delivery observations, and a transparent methacrylate side panel to allow recording of internal nesting activity. An external arm—made of wood—mounted on the tree trunk holds a camouflage-patterned video camera, powered by an integrated solar panel, oriented to cover both the entrance hole and the transparent panel.
Brood size varied during the study period. Initially consisting of four displaced nestlings, the brood was reduced to two individuals by natural mortality. On 3 July, following the recommendation of the Torreferrussa Wildlife Recovery Center, two additional nestlings were fostered into the brood. During this introduction, one adult exhibited intense defensive behavior, physically striking the operator. However, acceptance of the foster chicks was confirmed the same night. Subsequently, the larger of the introduced nestlings left the nest prematurely, and its fate could not be determined, leaving a final brood size of three for the remainder of the study.
2.2. Prey Determination and Biomass Estimation
Taxonomic identification was performed to the lowest possible level by our co-author J.M. Olmo-Vidal (specialist in Orthoptera and author of the Atlas of Orthoptera of Catalonia [18]). The determination of the species and the sex of Orthoptera (Ensifera) delivered by adults was made from the external genitalia: cerci in the males and ovipositor in the females. Other external characters served to complement these determinations, for example the shape of the tegmen [18]. When this was not possible, the specimens were grouped as indeterminate.
To assess the nutritional contribution of prey beyond numerical frequency, we estimated the fresh biomass (wet weight) of captured items based on their body length. We prioritized allometric equations derived from Mediterranean arthropod populations to minimize biogeographical bias.
For invertebrate prey, dry mass Wdry was first calculated using the power equation derived by [19] for Mediterranean arthropods. The equation used was:
where Wdry is the dry mass (in mg), L is the body length (in mm), and a and b are the regression parameters specific to the Arthropoda Orders provided in [19]. We selected the specific regression parameters for the suborder Ensifera (a = 0.0285, b = 2.797), as this group encompasses the vast majority of the prey items identified (e.g., Tettigonia, Uromenus, Meconema).
Wdry = a · Lb
Since nestling provisioning requires an estimation of fresh biomass intake, we converted the dry mass to fresh mass Wfresh. Based on specific nutritional analyses of orthopterans, we assumed a mean water content of 72%. This value is consistent with data for crickets (Acheta domesticus) [20] and for migratory locusts (Locusta migratoria) [21], who found moisture contents ranging between 66% and 74% depending on the insect’s diet and developmental stage. Given that the diet was dominated by orthopterans and soft-bodied insects (e.g., Lepidoptera), and lacking specific allometric data for the smaller prey items, we considered this conversion factor to be a robust and conservative approximation for the entire invertebrate dataset [22]. The conversion was applied as follows:
Wfresh = Wdry/0.28
Body length was visually estimated from video frames using the adult owl’s bill as a scale reference, to the nearest 0.5 cm. Biomass for vertebrate prey was estimated using standard mean body mass values after the SEMICE database [23], and 4.0 g for Tarentola mauritanica.
2.3. Calculation of Sexual Size Dimorphism (SSD)
To quantify the degree of size difference between sexes, we calculated the Sexual Size Dimorphism (SSD) index for each orthopteran species with available biometric data for both sexes. Following standard conventions for insect studies [24], the SSD index was defined as the ratio of mean female size to mean male size (SSD = Meanfemale/Meanmale). This dimensionless index indicates female-biased dimorphism when values exceed 1. We calculated SSD separately for two variables: body length (SSDL) and estimated fresh biomass (SSDW). Furthermore, we examined the allometric relationship between these two indices to test the hypothesis of profitability amplification in females.
2.4. Data Analysis and Statistics
To statistically assess temporal variations in orthopteran provisioning, hourly delivery rates (numerical frequency and biomass) were calculated for the dominant prey group. Based on the observed activity distribution, nighttime hours were categorized into two biological periods: “Peak Hours,” associated with maximum activity intensity (post-dusk at 22:00 h and pre-dawn at 05:00 h), and “Valley Hours,” representing the nocturnal maintenance phase (23:00 h–04:00 h). The twilight transition hour (21:00 h) was excluded from the comparative analysis to avoid ambient light bias. To analyze the effect of parental strategy on provisioning, data were categorized into two biological periods based on the female’s location within the nest box: Male-Only Provisioning: Periods when the female remained inside the nest (brooding or resting), implying the male was the sole provider. Mixed/Female Active Provisioning: Periods when the female was absent from the nest box and actively foraging outside alongside the male. Differences in provisioning intensity between parents and Peak and Valley periods were evaluated using a one-sided Mann-Whitney U test.
To assess whether prey sex selection varied across prey species, we analyzed the subset of sexually identified orthopterans, excluding indeterminate items and non-target taxa. A contingency table was constructed to test the interaction between Species and Sex using Pearson’s Chi-square test of independence. Furthermore, to determine if the sex ratio of individual species deviated from the expected natural parity (1:1) [25], exact Binomial tests were performed for each taxon, alongside a Chi-square Goodness-of-Fit test to evaluate the overall sexual bias in the diet. Statistical differences in predation between male and female orthopterans were assessed using the Mann-Whitney U test, implemented in the SciPy library (scipy.stats, v1.10.1). This non-parametric test was selected due to the non-normal distribution of the daily count and biomass data and the relatively small sample size (n = 11 nights). Statistical significance was set at alpha < 0.05. Results are reported as the test statistic (U) and p-value (p).
All data manipulation, statistical analyses, and graphical visualizations were performed using the Python programming language (version 3.10.12). Dataset processing and cleaning were conducted using the pandas (v. 1.5.3) and NumPy (v. 1.23.5) libraries. For descriptive and inferential statistical analyses (including Mann-Whitney U tests, Chi-square tests, and linear regressions), the SciPy (v. 1.10.1) package was employed. Figures and charts were generated using Matplotlib (v. 3.7.1) as the base engine and Seaborn (v. 0.12.2) for advanced statistical visualization (e.g., KDE density plots and allometric regressions). The programming code was generated and debugged with the assistance of the artificial intelligence model Gemini (Google, https://gemini.google.com, accessed on 15 July 2025) and subsequently validated by the authors. The graphical abstract and the schematic diagram of the video monitoring setup installed at the nest site were prepared with the aid of NanobananaPro (Gemini, https://deepmind.google/models/gemini-image/pro, accessed on 15 July 2025).
3. Results
3.1. General Diet Composition
During the study period, a total of 729 events were recorded, resulting in 724 valid prey delivery items after excluding empty nest visits (Table 1). A substantial portion of prey (29.2%, n = 212) was classified as Unidentified/Indeterminate; this category includes diverse arthropods (mainly small Orthopterans) that could not be identified to a specific taxon due to video quality or prey condition (Figure 2). The estimated total biomass for the identified prey items was 758.6 g. Items classified as ‘Undetermined’ (n = 212) were excluded from biomass calculations to avoid introducing error due to size uncertainty; therefore, this value represents a conservative estimate of the total intake. Invertebrates remained the primary group, accounting for 68.7% of all deliveries (n = 499) that could be identified to at least the Order level. Vertebrates were rare, representing only 1.8% of captures (n = 13), but they were crucial for energy intake, contributing 20.3% of the total biomass. Nevertheless, in four out of the 12 mice deliveries (41.6%) preys were not immediately eaten, and their fate was undetermined. They could be eaten by chicks or by the female. Furthermore, two deliveries at the end of the breeding period remained in the nest uneaten. So, mice contribution in terms of biomass could be well overestimated. When considering identified items, Orthoptera was the dominant order, comprising 64.6% of the total diet numerically and providing 73.8% of the biomass (Figure 3 and Figure 4). Biometric analysis of body length (Figure 5a) identifies Locusta migratoria as the longest prey species captured among the Orthoptera, although this represents a single isolated event (n = 1). Among the frequently hunted species, the large bush-crickets Decticus albifrons and Tettigonia viridissima exhibited similar large dimensions, with mean lengths of 3.67 cm and 3.65 cm, respectively. Uromenus rugosicollis occupied an intermediate position (3.17 cm), while Meconema thalassinum was the smallest orthopteran recorded, with a mean length of only 1.79 cm.

Table 1.
Composition of the diet delivered to Otus scops nestlings during the study period. The table displays the taxonomic classification of prey items, their absolute abundance (N), numerical frequency (%N), total estimated biomass (g), and relative biomass contribution (% Biomass). Note that biomass could not be estimated for items in the general “Undetermined” category.
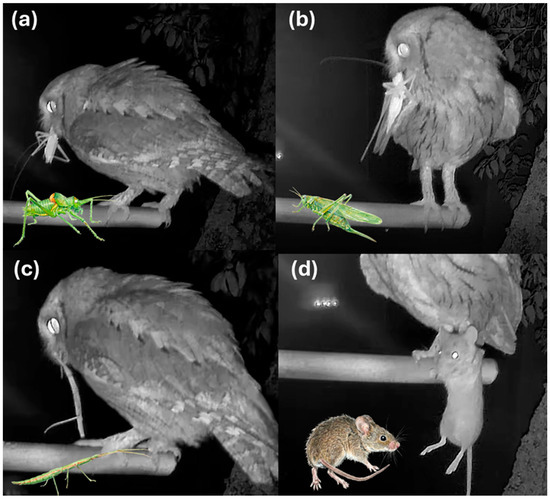
Figure 2.
Videoframes extracted after nest prey provisioning records in the Scops Owl nest. (a) Uromenus rugosicollis, (b) Tettigonia viridissima, (c) Bacillus rossius, (d) Mus spretus.
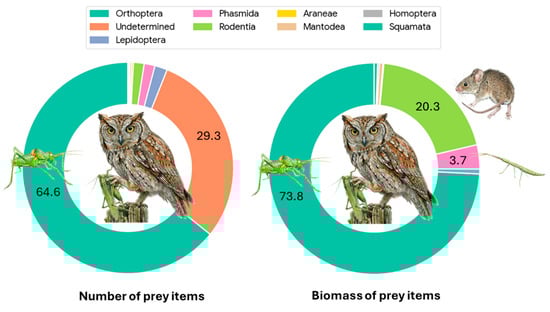
Figure 3.
Composition of the diet delivered to Otus scops nestlings. The left chart illustrates the provisioning composition based on numerical frequency (%N), showing a massive dominance of Orthoptera (64.5%). The right chart displays the composition based on estimated fresh biomass (%g), highlighting the significant energetic contribution of vertebrates (Rodentia, 19.9%) to the chicks’ intake, despite their low numerical abundance. Percentages are displayed only for categories contributing more than 2% to the total. “Undetermined” items were assigned zero biomass. Colors correspond to the prey categories listed in the legend.
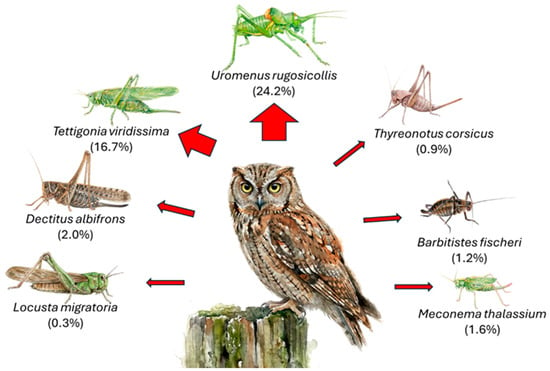
Figure 4.
Biomass contribution of Orthopteran species to the Scops Owl’s diet. Percentages represent the proportion of the total biomass (weight) provided by each identified species. The thickness of the red arrows corresponds to importance of each prey item, highlighting Uromenus rugosicollis and Tettigonia viridissima as the primary energy sources.
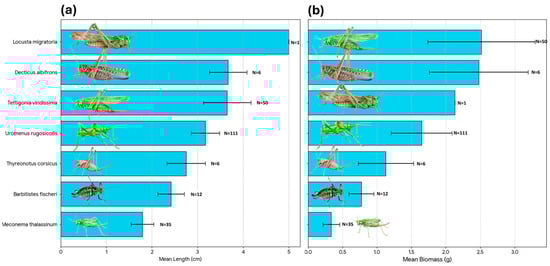
Figure 5.
Biometric characteristics of the main Orthopteran prey species delivered by adult Scops owls to the nest. (a) Mean body length (cm) of the identified species. (b) Mean biomass (fresh weight in g) per individual. In both panels, bars represent the mean value, error bars indicate the standard deviation (SD), and N denotes the sample size for each species. Species are ranked by size/mass to illustrate the range of prey dimensions, from smaller species like Meconema thalassinum to large Tettigoniids like Tettigonia viridissima.
When analyzing the energetic contribution per individual (Figure 5b), the hierarchy shifts slightly, highlighting the “profitability” of specific prey items: Tettigonia viridissima provided the highest mean biomass per individual (~2.52 g), slightly surpassing Decticus albifrons (~2.48 g), despite their similar body lengths. This suggests that T. viridissima offers a greater mass-to-length ratio. Locusta migratoria ranked third in biomass (2.13 g), indicating that while it is the longest insect, it is comparatively lighter than the robust Tettigoniids. Uromenus rugosicollis contributed a substantial 1.65 g per capture. A significant energetic gap is evident when comparing this large prey to smaller species: Meconema thalassinum provided a negligible mean biomass of 0.34 g.
3.2. Circadian Provisioning Rhythms
To evaluate the plasticity of parental effort in response to increased energetic demands, we compared daily provisioning rates before and after the brood enlargement event observed on 3 July increasing from 2 to a brood of 4 nestlings (subsequently reduced to 3). During the initial phase with fewer chicks (30 June–2 July), the mean nightly delivery rate was 61.3 prey items/night, corresponding to a total nightly biomass of 71.1 g. Following the increase in brood size (3 July–10 July), the mean numerical delivery rate rose slightly to 68.1 items/night, while the mean biomass remained remarkably stable at 67.7 g/night. However, statistical analysis revealed no significant differences between these two periods for either prey capture frequency (Mann-Whitney U test, p = 0.474) or total nightly biomass delivery (p = 1.00). Therefore, the brood enlargement experiment did not apparently affect the adults’ provisioning rates.
The highest intensity of parental effort occurs during the first hour of complete darkness (22:00 h, Figure 6). At this peak, the pair delivers an average of 14.50 ± 8.44 prey items per hour, corresponding to a biomass intake of 11.94 ± 8.73 g/h. A second, smaller peak in numerical delivery is observed just before dawn (05:00 h; 11.10 ± 6.52 items/h). Following the initial peak, the provisioning rate dropped to a ‘nocturnal valley’ (23:00–04:00 h) with a mean delivery rate of 7.6 ± 4.8 items/h, reaching its minimum intensity around midnight (00:00 h; 6.6 items/h). Analysis of hourly provisioning rates for Orthoptera revealed a significant variation throughout the night. Numerically, the delivery rate was significantly higher during both peak activity periods (22:00 and 05:00 h) compared to the middle of the night (Mann-Whitney U test, U = 954.5, p = 0.027). However, this difference was not significant regarding orthopteran biomass delivery (p = 0.247), suggesting that while capture frequency drops during valley hours, the energetic value of individual captures remains relatively stable or that peak hours include a higher proportion of smaller prey items.
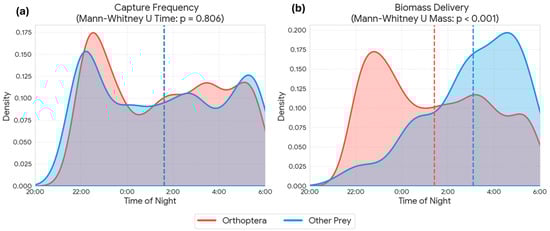
Figure 6.
Temporal patterns of Otus scops provisioning activity, comparing Orthoptera (red) with other prey types (blue). Kernel density estimates illustrate the daily distribution of (a) capture frequency (number of items) and (b) biomass delivery (fresh weight). Dashed vertical lines indicate the mean time for each category. Statistical comparisons (Mann-Whitney U test) show no significant difference in the temporal distribution of captures (p = 0.806), while the biomass per prey item differs significantly between groups (p < 0.001), driving the distinct patterns observed in biomass delivery.
The analysis of temporal patterns of provisioning activity revealed a remarkable synchrony between the capture of the main prey (Orthoptera) and other prey categories. Kernel density estimates (KDE) showed overlapping daily distributions for both groups (Figure 6a). Indeed, no statistically significant differences were found in capture time between Orthoptera and alternative prey (Mann-Whitney U test, p = 0.806), indicating that both resources are exploited within the same nocturnal temporal window. However, when analyzing energetic contribution, a highly significant divergence was detected in the biomass delivered per event (Mann-Whitney U test, p < 0.001, Figure 6b). While capture frequency is sustained mainly by Orthoptera throughout the night, biomass peaks in the diet are driven by the capture of alternative prey (e.g., rodents) which, although captured during the same schedule, provide a significantly higher energetic load per unit. The analysis of inter-visit intervals revealed a significant trade-off between prey size and search time (Spearman’s rho = 0.143, p = 0.001). The capture of high-biomass prey (vertebrates) required significantly longer foraging bouts compared to invertebrates. The mean return time for vertebrate prey was 17.8 ± 14.0 min, whereas invertebrate captures involved much shorter intervals, averaging 6.7 ± 9.0 min (Figure 7). Despite the nearly threefold increase in handling/search time, the capture of a rodent (mean ~13 g) yielded approximately 10–15 times more biomass than an average orthopteran (~1 g), confirming the high profitability of these sporadic captures.
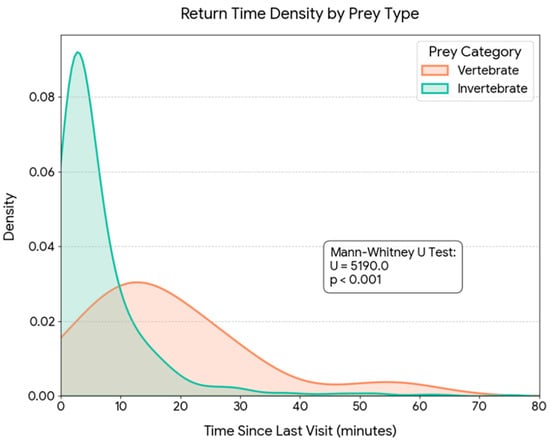
Figure 7.
Kernel Density Estimation (KDE) of parental provisioning return times categorized by prey type (n = 724). The graph illustrates the probability distribution of the time elapsed since the previous visit for Invertebrate prey (green) versus Vertebrate prey (orange). While invertebrate captures are associated with short return intervals (mean ~6.7 min), vertebrate predation involves significantly longer and more variable foraging bouts (mean ~17.8 min), reflecting the higher search costs associated with high-profitability prey. The difference between groups is statistically significant (Mann-Whitney U test, U = 5108.0, p < 0.001).
3.3. Parental Roles and Prey Size Selection
To assess potential differences in provisioning strategies between sexes, valid identified invertebrate prey items (n = 499) were analyzed according to the parental categories defined in the Methods section (Male-Only vs. Mixed/Female Active). We compared provisioning rates between nights of exclusive male provisioning (when the female was at nest) and nights where both parents were active. Regarding provisioning effort, the recruitment of the female did not result in a significant increase in the total food delivered to the nest. The male alone achieved a biomass delivery (Mean: 75.0 g/night) comparable to, and numerically even higher than, the combined effort of the pair (67.2 g/night). Statistical analysis confirmed no significant differences in either capture frequency (Mann-Whitney U test, p = 0.408) or total daily biomass (p = 0.727) between the two phases. These results suggest that the male is capable of independently sustaining the brood’s energetic requirements during this stage, and the female’s participation may serve to distribute parental effort rather than to additively increase the total provisioning rate.
However, while the overall rate remained stable, quantitative analysis revealed a significant shift in prey size between these periods. During the Male-Only phase (n = 90), the mean prey length was 2.57 ± 0.93 cm (Median: 2.50 cm). In contrast, during the Mixed/Female Active phase (n = 407), the mean prey length increased significantly to 2.90 ± 1.03 cm (Median: 3.00 cm). The difference in size distribution between the two phases was statistically significant (Mann-Whitney U test, p < 0.001, Figure 8).
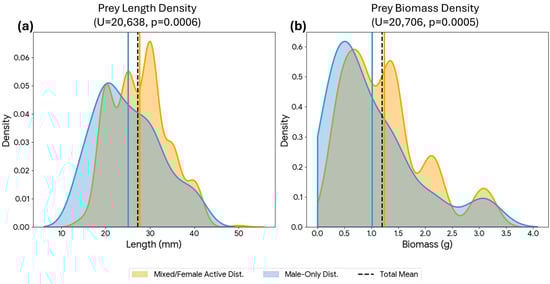
Figure 8.
Density distributions of invertebrate prey size and biomass according to parental provisioning strategy. Panels show Kernel Density Estimates (KDE) for (a) Body length (mm) and (b) Fresh biomass (g). Blue curves represent deliveries during the “Male-Only Provisioning” phase (female at nest), while orange curves represent the “Mixed/Female Active Provisioning” phase (biparental foraging). Statistical analysis (Mann-Whitney U test) confirms that prey items delivered during the mixed foraging phase were significantly larger and heavier than those delivered by the male alone. Vertical lines indicate the mean for each phase and for the total (black dashed line).
3.4. Prey Sex Selection and Biometry
Sexual identification of Orthoptera prey was possible for 166 items (33.7% of the total dataset). Within this subsample, predation appeared heavily skewed towards females (Figure 9a). Female prey constituted 65.6% (n = 109) of the sexually identified items, compared to 34.3% (n = 57) for males, resulting in an overall female-to-male capture ratio of approximately 2:1 (chi2 = 16.29, p < 0.001). A log-linear analysis of the contingency table (Species × Sex) revealed a significant interaction (chi2 = 18.97, df = 5, p = 0.002), indicating that the sex ratio of prey varies across species. Analysis of standardized residuals identified Meconema thalassinum as the main driver of this deviation compared to other species like Uromenus rugosicollis or Tettigonia viridissima, which followed the general deviation trend. But when tested individually against a balanced 1:1 sex ratio, only Meconema thalassinum exhibited a statistically significant deviation (Binomial test, p < 0.001), being almost exclusively represented by females (96.6%). In contrast, the larger species, Tettigonia viridissima and Uromenus rugosicollis, showed a moderate female bias (~60%) that did not reach statistical significance in terms of numerical frequency. However, this pattern shifts when considering the energetic contribution. For T. viridissima, the analysis of daily biomass revealed a statistically significant difference (U = 52, p = 0.037), with females providing substantially more food per night than males, and a similar trend was observed for U. rugosicollis (p = 0.087).
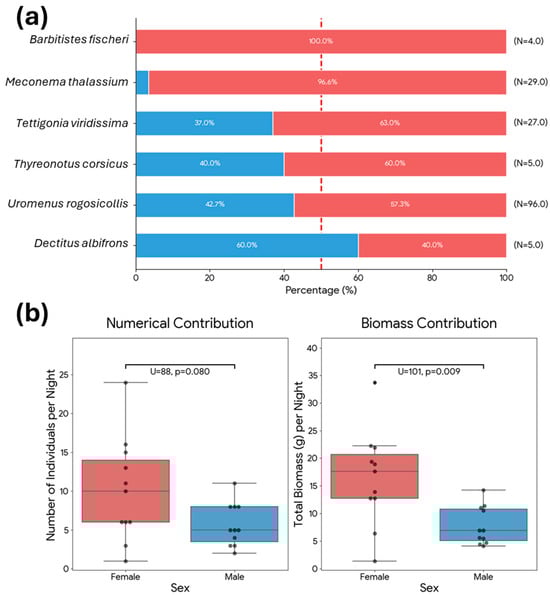
Figure 9.
(a) Sex ratio of the main Orthopteran prey species. Stacked bars display the relative frequency (%) of females (red) and males (blue) for each species identified in the diet of Otus scops. The vertical dashed line indicates a balanced 1:1 sex ratio (50%); (b) Comparison of the daily contribution of female and male orthopterans to the diet of Otus scops in terms of numerical abundance (left) and total biomass (right). Boxplots show the median (line), interquartile range (box), and full range (whiskers), with individual data points overlaid (n = 11 nights). Statistical differences were tested using the Mann-Whitney U test.
Regarding biometric differences, female prey items were larger on average (Mean: 3.02 ± 0.83 cm; Median: 3.5 cm) compared to male prey items (Mean: 2.96 ± 0.42 cm; Median: 3.0 cm), though this difference in body length was marginally non-significant (Mann-Whitney U test, U = 4036, p = 0.051). However, the analysis of individual body mass revealed a significant difference (Mann-Whitney U test, U = 4060, p = 0.043): female prey items were heavier (Mean: 1.63 ± 0.96 g; Median: 2.12 g) than males (Mean: 1.38 ± 0.50 g; Median: 1.38 g). These differences were even greater when considering the daily contribution of both sexes in the Orthoptera (Figure 9b) This finding highlights an allometric amplification of profitability: since biomass in Ensifera scales as a power function of length [19], even the moderate, marginally significant difference in linear size observed here translates into a statistically significant gain in energetic value (Figure 10).
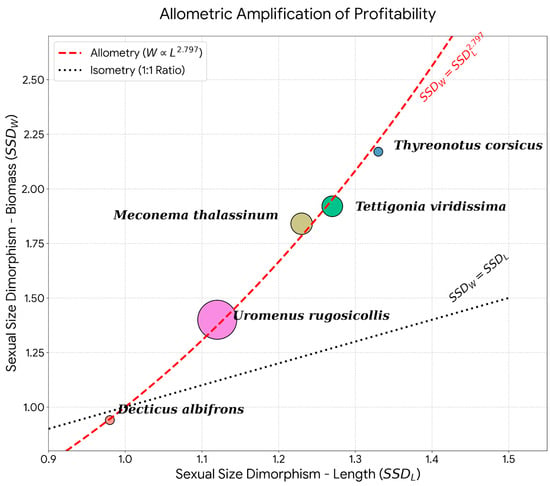
Figure 10.
Bivariate plot of Sexual Size Dimorphism in weight (SSDW) against dimorphism in length (SSDL) for Orthoptera prey species. The distribution of species relative to the isometric line (black dotted, y = x) and the allometric regression curve (red dashed, y = x2.797) highlights the exponential increase in female biomass relative to their linear size increase. Point size scales with total number of measured specimens per species.
4. Discussion
Our study provides a high-resolution insight into the trophic ecology of Otus scops, revealing that behind its apparent generalist insectivorous diet lies a highly sophisticated and energy-maximizing provisioning strategy. By employing continuous video monitoring, we were able to detect prey items and behavioral nuances—such as specific prey processing and sex-biased selection—that are typically obscured in traditional studies based on indirect sampling techniques, such as pellet analysis [15]. We acknowledge that these findings stem from the intensive monitoring of a single breeding pair. Regarding the potential influence of the rescue intervention, we consider the observed diet and behavior to be representative of natural conditions for three reasons: first, the nest was relocated only 10 m, ensuring the parents foraged within their original established territory; second, the final brood size of four nestlings lies within the natural range for the species, implying a standard energetic demand; and third, the parents were wild, unprovisioned individuals whose prey selection reflected local availability rather than artificial constraints. Therefore, while broader research is required to confirm the generalizability of these strategies at the population level, this case study offers a detailed mechanistic understanding of provisioning decisions.
Scops owl foraging activity was strictly nocturnal, commencing on average at 21:58 (earliest record 21:15), approximately 30 min after sunset, and ceasing at 05:40 (latest record 05:55), approximately 40 min before sunrise. This pattern aligns with the described circadian rhythm of the species [1] and matches the phenology of their main prey [26]. Most Orthoptera identified species, including Uromenus rugosicollis, Thyreonotus corsicus, Barbitistes fischeri, and Meconema thalassinum, are strictly nocturnal or evening-active, while Tettigonia viridissima exhibits crepuscular habits, in contrast to the diurnal Locusta migratoria and Decticus albifrons which are associated with hot, sunny weather and are unlikely to be available during the owl’s foraging window [26]. Provisioning rhythms were not uniform, with a peak of activity recorded during the first hour of darkness (22:00 h Local Time) [27], reaching rates of ~14.5 items/hour, a decline between 23:00 and 4:00, and a secondary peak before dawn (05:00 h). This pattern of prey delivery was different from the one found in Hungary, where the first period of the night showed higher provisioning rates and then declined until dawn [27].
Our results confirmed the strong preference for Orthoptera in the study area, which were considered the staple prey during the breeding period, both in frequency and biomass, as in other European countries [2,7,8,14,27,28]. Quantitative analysis showed that males delivered smaller prey (2.57 ± 0.93 cm) compared to the joint (male + female) hunting period (2.90 ± 1.03 cm). Due to allometric scaling [19], this moderate 12.8% length increase translates into a disproportionate 40.2% biomass gain (0.89 g vs. 1.25 g), illustrating an ‘allometric amplification’ of profitability. While this size divergence suggests niche partitioning (intersexual-competition hypothesis), the fact that the male alone matched the pair’s daily biomass delivery (75.0 vs. 67.2 g) strongly supports the small-male hypothesis [29], linking smaller size to superior foraging agility and efficiency. These differences can arise because females forage in the immediate vicinity of the nest selecting accessible prey, and males exploit larger territories to capture high-profitability vertebrates, assuming higher search costs [16]. Our data supports this specialization: we confirmed vertebrate captures (Mus spretus) during the ‘Male-Only’ provisioning phase. Consequently, it is likely that the male remains the primary provider of these high-biomass items throughout the breeding cycle, while the female focuses on maximizing the delivery rate of arthropods.
An interesting finding is the significant predation bias towards female orthopterans, particularly Meconema thalassinum. This small species is ecologically rare and cryptic; its unique drumming call is virtually inaudible to the human ear [18,26]. The unexpectedly high prevalence of elusive species such as M. thalassinum and Tettigonia viridissima [14,30] is likely explained by their strong positive phototaxis, which drives them to congregate around artificial light sources [26]. O. scops appear to exploit this ‘streetlight trap’ mechanism, foraging in areas where prey are unnaturally concentrated. This behavior is facilitated by the owl’s synanthropic habit of nesting in villages [2], where they can directly benefit from artificial illumination, and light pollution is known to disrupt insect behavior [31], triggering positive phototaxis in many nocturnal species [32]. This phenomenon can create ‘ecological traps’ or, conversely, ‘foraging hotspots’ [33,34] where phototactic prey congregate, potentially altering the predator’s natural diet composition and foraging efficiency. The pervasive impact of artificial light at night is well-documented, affecting critical aspects of survival and behavior across taxa, ranging from foraging and colonization to migration and seasonal reproduction [35]. Consequently, the diet composition observed here can be biased by urban lighting and may not fully represent the species’ foraging ecology in pristine, unlit environments.
Orthoptera females dominated the diet numerically (2:1 ratio) and, crucially, contributed significantly more biomass than males. These results contradict the ‘passive acoustic detection’ hypothesis, which posits that owls should capture more males due to the conspicuousness of their mating calls [25]. Instead, our findings align with the ‘mobility hypothesis’ proposed by [25], which suggests that females are rendered vulnerable not by acoustic signaling, but by their increased mobility during phonotaxis or oviposition. Furthermore, we propose that O. scops engage in active selection based on profitability. As confirmed by our biometric data, female-biased Sexual Size Dimorphism (SSD) acts as a powerful multiplier of energetic value. This is driven by the specific allometric relationship between length and biomass in Ensifera [19]. Due to this power law, even moderate differences in body length translate into disproportionate gains in biomass. For instance, while T. viridissima females in our study were only 27% longer than males (SSDL = 1.27), this allometric amplification results in them providing nearly double the biomass (SSDW = 1.92). Therefore, by actively selecting the larger sex, the predator capitalizes on this non-linear profitability, prioritizing the exponentially larger ‘energy package’ of the female over the acoustic detectability of the smaller singing male. However, it must be noted that without concurrent data on prey availability in the foraging range, strict positive selection cannot be statistically confirmed, despite the balanced sex-ratio [25].
An interesting observation is the systematic removal of the sclerotized ovipositor from female T. viridissima. To our knowledge, this is the first documented observation of systematic ovipositor removal in Otus scops. Rather than solely optimizing energy density, this behavior likely serves a critical safety function: by discarding this rigid, sharp, and indigestible appendage, parents mitigate the risk of physical injury (e.g., esophageal perforation) and facilitate swallowing for nestlings with limited gut capacity [36]. But also reveals a critical bias in traditional diet analyses: the removal of the primary diagnostic feature of female katydids [25] likely leads to a significant underestimation of female predation in pellet-based studies.
A key finding is the marked discrepancy between numerical frequency (>98% insects) and biomass contribution. While the diet appears numerically insectivorous during the breeding period [7,8,14], the energetic foundation relies heavily on vertebrates and large orthopterans. This suggests the Scops Owl operates under a mixed foraging strategy consistent with the principles of Central Place Foraging [37]: the owl maintains a high-frequency inflow of low-cost prey (maintenance) while relying on stochastic, high-value captures (investment) for bulk calories. It should be noted that daily biomass rates are conservative estimates, as they exclude the contribution of undetermined prey items (29.2% of captures). Assuming these items were small orthopterans (mean ~0.5 g), the actual daily intake could be roughly 10–15% higher than reported. Conversely, we believe that biomass delivered by mice could be well overestimated, since in almost half of the videos we were unable to determine which individual ate the prey (nestling, female, or none). This mice influx coincided with an exceptional demographic peak recorded by the SEMICE small mammals monitoring program in 2025 (www.semice.org, accessed on 15 July 2025). Such superabundance reduced search costs to negligible levels, triggering an opportunistic surplus provisioning response [38] where delivered biomass exceeded the brood’s consumption capacity. The fact that provisioning rates remained constant, despite the combined pressure of increased brood size and the natural growth of the nestlings, suggests a ceiling in parental delivery capacity or a superabundance of food. This phenomenon underscores the critical distinction between delivered biomass and effective consumption. Furthermore, this finding challenges the reliability of biomass estimates derived solely from nest remains, as the presence of uneaten prey suggests that delivery does not always equate to intake, potentially leading to overestimations of the nestlings’ actual energy consumption [39]. Indeed, our findings mirror observations in other generalist raptors in the study area like Buteo buteo, where large prey often go uneaten while smaller staples drive actual intake [40]. In our study, the accumulation of uneaten rodents could be explained by several non-mutually exclusive hypotheses. First, rodents may have functioned as a redundant ‘insurance’ resource, intended to be consumed later if insect availability dropped. Second, the surplus may simply reflect chick satiation or handling constraints, where the large size of the prey prevented immediate ingestion by the nestlings. Third, the superabundance of rodents (confirmed by SEMICE data) likely reduced foraging costs to negligible levels; under these conditions, parents may continue to exploit this high-profitability resource opportunistically, regardless of immediate nest consumption feedback. Whatever the driver, the easier-to-process female orthopterans acted as the immediate energetic staple, while rodents often went unconsumed. This underscores that assessing diet solely based on deliveries—without verifying consumption—can lead to biased conclusions regarding the functional value of prey [17].
5. Conclusions
Our study demonstrates that high-resolution video monitoring provides critical ecological insights often missed by traditional pellet analysis, most notably the “surgical” removal of ovipositors, a behavior that optimizes intake but masks sex-biased predation in osteological samples. Biologically, Otus scops adheres to a strict energy-maximization strategy; while numerically dependent on orthopterans, the species capitalizes on the allometric profitability of selecting larger females and the sporadic but high-yield capture of rodents, which alone contributed one-fifth of the total biomass. This foraging efficiency, supported by a plastic bimodal provisioning rhythm, likely exploits artificial light sources (“streetlight traps”) to facilitate the capture of phototactic prey. Ultimately, while these findings underscore the owl’s adaptability to peri-urban interfaces, they also emphasize its critical vulnerability to the systemic decline of insect populations in human-altered landscapes.
Supplementary Materials
The following supporting information can be downloaded at https://www.mdpi.com/article/10.3390/d18010034/s1.
Author Contributions
Conceptualization, I.T. and J.G.; methodology, I.T., J.G. and J.M.O.-V.; software, I.T.; validation, I.T., J.G. and J.M.O.-V.; formal analysis, I.T. and J.M.O.-V.; investigation, I.T., J.G. and J.M.O.-V.; resources, J.G.; data curation, I.T., J.G. and J.M.O.-V.; writing—original draft preparation, I.T.; writing—review and editing, I.T., J.G. and J.M.O.-V. All authors have read and agreed to the published version of the manuscript.
Funding
This research received no external funding.
Institutional Review Board Statement
Ethical review and approval were waived for this study due to the non-invasive nature of video monitoring (remote observation).
Data Availability Statement
The original contributions presented in this study are included in the article/Supplementary Materials. Further inquiries can be directed to the corresponding author.
Acknowledgments
We are grateful to the Arcarons Moraleda family, the Torreferrussa Wildlife Recovery Centre, and especially to Mònica Alonso for her unconditional commitment.
Conflicts of Interest
The authors declare no conflict of interest.
References
- Del Hoyo, J.; Elliott, A.; Sargatal, J. (Eds.) Handbook of the Birds of the World. Volume 5: Barn-Owls to Hummingbirds; Lynx Edicions: Barcelona, Spain, 1999. [Google Scholar]
- Marchesi, L.; Sergio, F. Distribution, Density, Diet and Productivity of the Scops Owl Otus Scops in the Italian Alps. IBIS 2005, 147, 176–187. [Google Scholar] [CrossRef]
- Barbraud, C.; Bavoux, C.; Burneleau, G.U.Y.; Umr, C.; Bois, V. The Demography of an Increasing Insular Eurasian Scops Owl (Otus Scops) Population in Western France Farmland. IBIS 2021, 164, 202–216. [Google Scholar] [CrossRef]
- Martínez, J.A.; Zuberogoitia, I.; Martínez, J.E.; Zabala, J.; Calvo, J.F. Patterns of Territory Settlement by Eurasian Scops-Owls (Otus Scops) in Altered Semi-Arid Landscapes. J. Arid Environ. 2007, 69, 400–409. [Google Scholar] [CrossRef]
- Bird Life International List of Owl Species. Available online: http://www.birdlife.org (accessed on 15 November 2025).
- Theux, C.; Klein, N.; Garibaldi, E.; Jacot, A.; Eichhorn, S.; Guisan, A.; Pradervand, J.N. Food and Habitats Requirements of the Eurasian Scops Owl (Otus Scops) in Switzerland Revealed by Very High-Resolution Multi-Scale Models. IBIS 2022, 164, 240–254. [Google Scholar] [CrossRef]
- Latková, H.; Sándor, A.K.; Krištín, A. Diet Composition of the Scops Owl (Otus Scops) in Central Romania. Slovak Raptor J. 2012, 6, 17–26. [Google Scholar] [CrossRef]
- Panzeri, M.; Menchetti, M.; Mori, E. Habitat Use and Diet of the Eurasian Scops Owl Otus Scops in the Breeding and Wintering Periods in Central Italy. Ardeola 2014, 61, 393–399. [Google Scholar] [CrossRef]
- Mori, E.; Mazzetto, F.; Menchetti, M.; Bodino, N.; Grasso, E.; Sposimo, P. Feeding Ecology of the Scops Owl, Otus Scops (Aves: Strigiformes), in the Island of Pianosa (Tuscan Archipelago, Central Italy) Outside the Breeding Period. Ital. J. Zool. 2016, 83, 417–422. [Google Scholar] [CrossRef]
- Artmann-Graf, G.; Korner, P. Strong Decline in Grasshopper Abundance over 20 Years without Major Land-Use Changes: Is Soil Drying One of the Drivers? Biol. Conserv. 2024, 299, 110816. [Google Scholar] [CrossRef]
- Hallmann, C.A.; Sorg, M.; Jongejans, E.; Siepel, H.; Hofland, N.; Schwan, H.; Stenmans, W.; Müller, A.; Sumser, H.; Hörren, T.; et al. More than 75 Percent Decline over 27 Years in Total Flying Insect Biomass in Protected Areas. PLoS ONE 2017, 12, e0185809. [Google Scholar] [CrossRef]
- Ogan, S.; Paulus, C.; Froehlich, C.; Renker, C.; Kolwelter, C.; Schendzielorz, M.; Danielczak, A.; Müller, K.; Eulering, H.; Hochkirch, A. Re-Surveys Reveal Biotic Homogenization of Orthoptera Assemblages as a Consequence of Environmental Change. Divers. Distrib. 2022, 28, 1795–1809. [Google Scholar] [CrossRef]
- Denac, K.; Kmecl, P.; Koce, U. Habitat Use of Eurasian Scops Owls Otus Scops in an Agricultural Mosaic Landscape. Ardea 2019, 107, 119. [Google Scholar] [CrossRef]
- Šotnár, K.; Krištín, A.; Sárossy, M.; Harvančík, S. On Foraging Ecology of the Scops Owl (Otus Scops) at the Northern Limit of Its Area. Tichodroma 2008, 20, 1–6. [Google Scholar]
- Simmons, R.E.; Avery, D.M.; Avery, G. Biases in Diets Determined from Pellets and Remains: Correction Factors for a Mammal and Bird-Eating Raptor. J. Raptor Res. 1991, 25, 63–67. [Google Scholar]
- Sailas, S.S.; van Harxen, R.; Stroeken, P.; Stýblová, I.; Reipricht, F.; Šálek, M. Nestbox Cameras Reveal Geographic, Temporal and Sex-Specific Variations in the Composition of Provisioned Prey for a Declining Farmland Raptor. J. Vertebr. Biol. 2024, 73, 24071.1–24071.13. [Google Scholar] [CrossRef]
- Zárybnická, M.; Riegert, J.; Stastný, K. Diet Composition in the Tengmalm’s Owl Aegolius Funereus: A Comparison of Camera Surveillance and Pellet Analysis. Ornis Fenn. 2011, 88, 147–153. [Google Scholar] [CrossRef]
- Olmo-Vidal, J.M. Atles dels Ortòpters de Catalunya i Llibre Vermell, 2nd ed.; Generalitat de Catalunya. Departament de Mediambient i Habitatge: Barcelona, Spain, 2006.
- Hódar, J.A. The Use of Regression Equations for Estimation of Arthropod Biomass in Ecological Studies. Acta Oecol. 1996, 17, 421–433. [Google Scholar]
- Finke, M.D. Complete Nutrient Composition of Commercially Raised Invertebrates Used as Food for Insectivores. Zoo Biol. 2002, 21, 269–285. [Google Scholar] [CrossRef]
- Oonincx, D.G.A.B.; Poel, A.F.B. Van Der Effects of Diet on the Chemical Composition of Migratory Locusts (Locusta Migratoria). Zoo Biol. 2011, 30, 9–16. [Google Scholar] [CrossRef] [PubMed]
- Bell, P. Birds and Mammals on an Insect Diet: A Primer on Diet Composition Analysis Relation to Ecological Energetics. Stud. Avian Biol. 1990, 13, 416–422. [Google Scholar]
- Torre, I.; López-Baucells, A.; Stefanescu, C.; Freixas, L.; Flaquer, C.; Bartrina, C.; Coronado, A.; López-Bosch, D.; Mas, M.; Míguez, S.; et al. Concurrent Butterfly, Bat and Small Mammal Monitoring Programmes Using Citizen Science in Catalonia (NE Spain): A Historical Review and Future Directions. Diversity 2021, 13, 454. [Google Scholar] [CrossRef]
- Teder, T.; Tammaru, T. Sexual Size Dimorphism within Species Increases with Body Size in Insects. Oikos 2005, 108, 321–334. [Google Scholar] [CrossRef]
- Heller, K.; Arlettaz, R. Is There a Sex Ratio Bias in the Bushcricket Prey of the Scops Owl Otus Scops Due to Predation on Calling Males? J. Orthoptera Res. 1994, 2, 41–42. [Google Scholar] [CrossRef]
- Ragge, D.; Reynolds, W. The Song of the Grassoppers and Crickets of Western Europe; Colchester, E.H.B., Ed.; Harley Books: Colchester, UK, 1998. [Google Scholar]
- Streit, B.; Kalotás, Z. Reproductive Performance of the Scops Owl (Otus scops L., 1758). Aquila 1991, 98, 97–105. [Google Scholar]
- Bavoux, C.; Burneleau, G.; Juillard, M.; Nicolau-Guillaumet, P. Le Hibou Petit-Duc, Otus Scops, Sur l’île d’Oleron (France). Régime Alimentaire des Poussins. Nos Oiseaux 1993, 42, 159–170. [Google Scholar]
- Krüger, O. The Evolution of Reversed Sexual Size Dimorphism in Hawks, Falcons and Owls: A Comparative Study. Evol. Ecol. 2005, 19, 467–486. [Google Scholar] [CrossRef]
- Krištín, A.; Latková, H.; Sándor, A.K. Orthoptera and Mantodea in Foraging Territories of the Scops Owl Otus Scops in Central Romania. Linzer biol. Beitr. 2011, 43, 1483–1491. [Google Scholar]
- Longcore, T.; Rich, C. Ecological Light Pollution. Front. Ecol. Environ. 2004, 2, 191–198. [Google Scholar] [CrossRef]
- Eisenbeis, G. Artificial Night Lighting and Insects: Attraction of Insects to Streetlamps. In Ecological Consequences of Artificial Night Lighting; Rich, C., Longcore, T., Eds.; Island Press: Washington, DC, USA, 2006; pp. 281–304. [Google Scholar]
- Rydell, J. Exploitation of Insects around Streetlamps by Bats in Sweden. Funct. Ecol. 1992, 6, 744–750. [Google Scholar] [CrossRef]
- Owens, A.C.S.; Cochard, P.; Durrant, J.; Farnworth, B.; Perkin, E.K.; Seymoure, B. Light Pollution Is a Driver of Insect Declines. Biol. Conserv. 2020, 241, 108259. [Google Scholar] [CrossRef]
- Falcón, J.; Torriglia, A.; Attia, D.; Viénot, F.; Gronfier, C.; Behar-Cohen, F.; Martinsons, C.; Hicks, D. Exposure to Artificial Light at Night and the Consequences for Flora, Fauna, and Ecosystems. Front. Neurosci. 2020, 14, 602796. [Google Scholar] [CrossRef]
- Kaspari, M. Prey Preparation as a Way That Grasshopper Sparrows (Ammodramus savannarum) Increase the Nutrient Concentration of Their Prey. Behav. Ecol. 1991, 2, 234–241. [Google Scholar] [CrossRef]
- Stephens, D.W.; Krebs, J.R. Foraging Theory; Princeton University Press: Princeton, NJ, USA, 1986. [Google Scholar]
- Korpimäki, E. Dietary Shifts, Niche Relationships and Reproductive Output of Coexisting Kestrels and Long-Eared Owls. Oecologia 1987, 74, 277–285. [Google Scholar] [CrossRef] [PubMed]
- Tornberg, R.; Reif, V. Assessing the Diet of Birds of Prey: A Comparison of Prey Items Found in Nests and Images. Ornis Fenn. 2007, 84, 21–31. [Google Scholar]
- Torre, I.; Grajera, J.; Amat, F.; Oro, D.; Mañosa, S. Prey Dynamics and Breeding Performance in a Generalist Predator: The Differential Role of Prey Density, Biomass, and Effective Consumption Rates. Acta Oecologica 2024, 123, 103999. [Google Scholar] [CrossRef]
Disclaimer/Publisher’s Note: The statements, opinions and data contained in all publications are solely those of the individual author(s) and contributor(s) and not of MDPI and/or the editor(s). MDPI and/or the editor(s) disclaim responsibility for any injury to people or property resulting from any ideas, methods, instructions or products referred to in the content. |
© 2026 by the authors. Licensee MDPI, Basel, Switzerland. This article is an open access article distributed under the terms and conditions of the Creative Commons Attribution (CC BY) license.