Article

Complex Evolutionary History of the South American Fox Genus Lycalopex (Mammalia, Carnivora, Canidae) Inferred from Multiple Mitochondrial and Nuclear Markers

by
Marina O. Favarini
1,
Taiz L. L. Simão
1,
Gabriel S. Macedo
1,2,
Fabrício S. Garcez
1,
Larissa R. Oliveira
3,
Susana Cárdenas-Alayza
4,
Marco Cardeña Mormontoy
4,
Fernando Angulo
5,
Carlos Benhur Kasper
6,
Warren E. Johnson
7 and
Eduardo Eizirik
1,8,*
1
Escola de Ciências da Saúde e da Vida, Pontifícia Universidade Católica do Rio Grande d Sul (PUCRS), Avenida Ipiranga 6681, Prédio 12, Porto Alegre 90619-900, RS, Brazil
2
Programa de Medicina Personalizada, HCPA, Rua Ramiro Barcelos 2350, Porto Alegre 90035-903, RS, Brazil
3
Programa de Pós-Graduação em Biologia, Universidade do Vale do Rio dos Sinos (UNISINOS), Avenida Unisinos, 950, São Leopoldo 93022-000, RS, Brazil
4
Centro para la Sostenibilidad Ambiental, Universidad Peruana Cayetano Heredia, Av. Armendáriz 445, Lima 15074, Peru
5
Centro de Ornitología y Biodiversidad—CORBIDI, Calle Santa Rita Of. 202, Urb. Huertos de San Antonio, Surco, Lima 15023, Peru
6
Laboratório de Biologia de Mamíferos e Aves (LABIMAVE), Universidade Federal do Pampa (UNIPAMPA), São Gabriel 97300-970, RS, Brazil
7
Smithsonian Institution, Smithsonian Conservation Biology Institute, National Zoological Park, 1500 Remount Road, Front Royal, VA 22630, USA
8
Instituto Pró-Carnívoros, Atibaia 12945-010, SP, Brazil
*
Author to whom correspondence should be addressed.
Diversity 2022, 14(8), 642; https://doi.org/10.3390/d14080642
Submission received: 17 May 2022 / Revised: 18 July 2022 / Accepted: 27 July 2022 / Published: 11 August 2022
(This article belongs to the Special Issue Molecular Evolution and Conservation of Tropical Biodiversity)

Abstract

:
The canid genus Lycalopex comprises six recently diversified South American species whose evolutionary relationships have been remarkably challenging to resolve. We analyzed 6000 bp of mitochondrial DNA (mtDNA) from 55 Lycalopex individuals (L. sechurae = 4, L. culpaeus = 7, L. griseus = 8, L. gymnocercus = 17, L. vetulus = 13 and L. fulvipes = 6), and nine specimens from the closely related species Cerdocyon thous, Chrysocyon brachyurus and Speothos venaticus, to reconstruct their phylogenetic relationships, estimate the support for species-level monophyly, and date their divergences. In addition, we also sequenced seven nuclear segments from the same taxa. Three different phylogenetic approaches converged on the same mitochondrial topology with strong support for most nodes. All species were confirmed to be monophyletic for mtDNA, except for one intriguing case in which two L. vetulus individuals carried L. gymnocercus haplotypes, potentially implying a case of interspecies admixture. L. vetulus was the first species to diverge (ca. 1.2 Mya), followed by L. sechurae and then L. gymnocercus. The most internal group comprised L. griseus and the sister-species L. culpaeus and L. fulvipes, which diverged around 430,000 years ago in southern Argentina or Chile. The analysis of nuclear markers revealed several examples of intra-specific variation coupled with lack of species monophyly, consistent with pervasive incomplete lineage sorting and/or hybridization in this recent radiation. Our results provide robust mitochondrial resolution of this challenging radiation, and illustrate the difficulty of attaining similar success with traditional nuclear markers.

1. Introduction

The reconstruction of phylogenetic relationships in groups that have undergone rapid radiations is a major challenge, since there has often been insufficient time for lineages to accumulate enough informative characters prior to the next round of cladogenesis [1]. In addition, processes such as incomplete lineage sorting (ILS) and post-speciation hybridization further complicate the effectiveness of phylogenetic resolution in rapidly and recently diversified clades [2]. Therefore, it is desirable to investigate these problems by surveying multiple loci and multiple individuals per species, as this allows estimates that incorporate intra-specific variation, incomplete lineage sorting and/or assessments of hybridization [3].
In spite of its evolution as a single genetic locus, which precludes internal independent replication, mitochondrial DNA (mtDNA) remains an informative system to investigate phylogenetic relationships in recent radiations, given its high substitution rates and smaller effective population size relative to nuclear markers [4], which expedites lineage sorting and thus facilitates assessments of genetic differentiation among recently diverged populations [5]. In addition, given their lack of recombination, mtDNA sequences can be easily concatenated without the need to account for genealogical discordance, allowing the construction of large sequence supermatrices with the same phylogenetic history that facilitate resolution of relationships in recent radiations. These features are useful to provide well-resolved phylogenetic hypotheses that can be further tested with nuclear markers, as well to allow additional analyses such as molecular dating of recent divergences [1,4].
The mammalian order Carnivora includes several examples of rapid evolutionary radiations, which have been inferred from the fossil record and from molecular phylogenies e.g., [6,7,8,9]. Within the family Canidae, the South American genus Lycalopex experienced a particularly rapid and recent radiation, likely beginning 1.3–1.2 million years ago (Mya) [10,11]. It comprises six currently recognized extant species: pampas fox (L. gymnocercus), hoary fox (L. vetulus), South American gray fox (L. griseus), culpeo (L. culpaeus), Darwin’s fox (L. fulvipes) and sechuran fox (L. sechurae) [11,12]. They are widespread in South America (Figure 1) and generally occur in grasslands, with the exception of Darwin’s fox, which occurs in temperate rainforests in a restricted distribution including Chiloé Island and Nahuelbuta National Park in Chile [13,14]. The sechuran fox is the smallest species of the genus and is restricted to the Pacific coast of Peru and southwestern Ecuador. The hoary fox is associated with the Brazilian Cerrado biome, while the pampas fox occurs in southern Brazil, eastern Bolivia, western Paraguay and eastern Argentina. The culpeo fox is the largest of these species, and occurs along the Andes from southern Colombia to southern Chile. Finally, the South American (SA) gray fox presents considerable range overlap with the culpeo, and occurs on both sides of the Andes, from northern Chile to Tierra del Fuego [15].
The taxonomic validity of these six species, based on morphological and ecological differences, has been mostly consensual in the scientific literature e.g., [12,16].The only exception has been the separation between L. gymnocercus and L. griseus, whose morphological distinctiveness has not been corroborated by recent in-depth studies [17,18].
The difficulty in resolving the evolutionary relationships among these fox species has been remarkable e.g., [6,10,11,19,20,21,22]. Up to now their phylogenetic relationships remain mostly unresolved, and even species-level monophyly has not been fully assessed. The main exceptions have been the studies by [13,14], which analyzed multiple individuals of the SA gray fox, culpeo and Darwin’s fox. Interestingly, these studies did not support the reciprocal monophyly of the SA gray fox and culpeo, but confirmed the monophyly of Darwin’s fox. A more recent study based on mtDNA control region sequences of several individuals of each species (except L. sechurae) supported their monophyly, although inter-specific relationships could not be resolved robustly [11]. Subsequently, a study employing three mtDNA segments [22] included two L. sechurae individuals and supported their monophyly, in addition to reconstructing topological relationships that were mostly congruent with those reported by [11], but again not achieving high support for supra-specific nodes. Interestingly, these two latter studies demonstrated that individuals identified as L. gymnocercus and L. griseus did not form clear-cut, reciprocally monophyletic groups (although two distinct mtDNA clades are formed with these samples), indicating that their geographic distributions must be revised and/or that hybridization occurs between them.
To further investigate the phylogeny of this group, in this study we have generated and analyzed a mtDNA supermatrix including multiple individuals for each of the currently recognized Lycalopex species. Several phylogenetic analyses have converged onto a robustly supported mitochondrial topology for the genus, which has allowed an improved assessment of its evolutionary history. To complement the mtDNA analyses, we also sequenced seven nuclear markers to assess their power to resolve phylogenetic relationships in this recent radiation.

2. Materials and Methods

2.1. Sample Collection and Laboratory Procedures

Biological samples (blood and tissue) were collected from 55 Lycalopex individuals (L. sechurae = 4, L. culpaeus = 7, L. griseus = 8, L. gymnocercus = 17, L. vetulus = 13 and L. fulvipes = 6), and nine specimens from the closely related species Cerdocyon thous, Chrysocyon brachyurus and Speothos venaticus (Table S1). Blood samples previously collected from wild animals that had been captured for ecological studies and from captive individuals with known geographic origin were preserved in a salt-saturated solution (100 mM Tris, 100 mM EDTA, 2% SDS). Tissue samples were obtained from road-killed specimens and maintained in 96% ethanol.
DNA extraction was conducted using a standard phenol/chloroform protocol [23], followed by verification of integrity and concentration on 1% agarose gels stained with GelRed (Biotium). We amplified via the Polymerase Chain Reaction (PCR) six different mitochondrial DNA segments (Table S2): (i) the 5′ portion of the control region; (ii) the 5′ portion of the cytocrome oxidase c subunit I (COI) gene; (iii) the complete cytochrome b (cyt-b) gene; and (iv-vi) three overlapping fragments (named ‘7 mt’, ‘8 mt’ and ‘9 mt’) proposed by [24] as part of a strategy to amplify and sequence whole mitochondrial genomes of carnivore species. The contiguous segment produced when joining these three fragments includes complete or partial sequences of the genes COIII, ND3, ND4L, ND4 and ND5, as well as tRNAs Gly, Arg, His, Ser and Leu.
Initial mtDNA PCR reactions employed previously available primer sets that amplified medium to large fragments, except for the cytochrome b gene, for which we used a novel set developed here to span its entire coding region (Tables S2 and S3). Subsequent cyt-b reactions also used the primer sets reported by [25], which amplify the gene in two overlapping sub-fragments. In the case of segments 7 mt and 8 mt, we used initial Lycalopex sequences to design four additional primers for each of them (Table S3), which served as internal sequencing primers as well as to directly amplify sub-fragments spanning approximately 700 bp each. For segment 9 mt, we designed one internal primer (see Table S3), and also utilized primer ND5-DR1 [26] for amplification and sequencing within this region. Since our ND5 fragment was contained within the 9 mt segment, and that the original primer set ND5-DF1/DR1 often amplified nuclear mtDNA copies (numts) in several of these canid species (as inferred from consistent patterns of ‘dirty’ sequence peaks at the same sites), we mostly used sequences derived from the 9 mt segment to cover this gene.
To generate complementary datasets with nuclear markers, we targeted segments of seven genes (ATP7A, CHRNA1, CYP1A1, FES, GHR, TCP1, VTN) that had exhibited variation at recent timescales in previous carnivoran phylogenetic studies e.g., [7,8], or that had shown potential for intra-specific diversity in preliminary surveys (not shown). These segments were amplified via PCR using available primer sets or oligonucleotides designed specifically for this study (Table S4).
For both mtDNA and nuclear markers, PCR reactions were performed in a 20 μL final volume containing 0.2 u Taq Platinum (Invitrogen), 1× Buffer (Invitrogen) and 0.2 μM each of the forward and reverse primers, 0.1 mM dNTPs and 1.5 mM MgCl2. These conditions were maintained for all segments except for COI (for which we changed the concentrations of dNTP and MgCl2 to 0.2 mM and 2.5 mM, respectively). The thermocycling conditions followed those described by [27] i.e., a touchdown PCR that begins with 10 cycles (touchdown) decreasing the annealing temperature from 60 °C to 51 °C (45 s per cycle), followed by 30 cycles with 50 °C annealing temperature for 30 s. In every case, the denaturing step was 45 s at 94 °C, and the extension step was 1.5 min at 72 °C. PCR products were verified on a 1% agarose gel stained with GelRed (Biotium, Fremont, CA, USA), and subsequently purified using either (i) for mtDNA segments, a protocol based on precipitation with ammonium acetate and isopropanol, or (ii) for nuclear segments, a standard treatment with shrimp alkaline phosphatase and exonuclease I. We sequenced both strands of each purified PCR product using the DYEnamic ET Dye Terminator Sequencing Kit (GE Healthcare, Chicago, IL, USA) and analyzed them in a MegaBACE 1000 automated sequencer (GE Healthcare).

2.2. Data Analyses

2.2.1. Mitochondrial Dataset

Sequence electropherograms were verified and manually corrected using the software FinchTV (Geospiza). Consensus sequences of forward and reverse strands, as well as contigs derived from multiple overlapping reads, were constructed using Phred/Phrap/Consed [28,29,30]. Resulting sequences were aligned using the ClustalW algorithm [31] implemented in Mega 4.1 [32]. In the case of segment 7 mt, only the 3′ end (bound by primers 7mti-F3 and mtDNA7L) was incorporated into the final dataset, as the remainder of the fragment could not be fully covered with high quality sequences for all taxa. Final alignments incorporated one sequence each of Canis lupus and Canis latrans, downloaded from GenBank (accession numbers AB499824.1 and DQ480510.1, respectively), to be used for calibration purposes in divergence dating analyses (see below). Alignments for each segment were checked by eye and edited, if necessary, with MEGA. In the case of the control region, we observed that a 40 bp long segment presented ambiguous alignment, and thus we excluded it from further analyses (see Table S4).
Exploratory analyses assessing levels of diversity and phylogenetic information content within each segment were performed with MEGA and PAUP 4.0b10 [33]. These included an assessment of the number of variable and phylogenetically-informative sites per segment, presence of potentially informative indels, and also preliminary phylogenetic analyses employing Maximum Parsimony (MP) and distance-based approaches, the latter using the Neighbor-Joining (NJ) algorithm [34]. Based on these initial analyses, we assessed whether there was any strongly supported phylogenetic conflict among segments, thus bearing upon the decision of concatenating them into a single supermatrix. Since no supported conflict was observed, we concatenated all segments and performed all subsequent analyses with this joint dataset.
We first removed any identical joint haplotypes of the sampled segments from the supermatrix, so that a single representative of each sequence was used for phylogenetic inference. Final phylogenetic analyses were performed using three different optimality criteria: Maximum-likelihood (ML), Maximum Parsimony (MP) and Bayesian Inference (BI).
ML phylogenies were inferred with two different approaches, both of which employed the best-fit evolutionary model estimated using ModelTest3.7 [35] under the Akaike Information Criterion (AIC). One of the approaches used the full dataset and the software GARLI [36], which generated a starting tree with stepwise taxon addition, and subsequently performed branch-swapping with the nearest-neighbor interchange (NNI) and subtree pruning regrafting (SPR) algorithms. Nodal support was assessed with 1000 nonparametric bootstrap replications. The second ML approach was that implemented in PAUP *, and used a pruned dataset containing all of the ingroup and only Cerdocyon thous sequences as the outgroup (in order to reduce computational time and given that this species is clearly the most immediate relative (sister taxa of the ingroup—see Results). In this case, we initially estimated a starting tree with NJ, and then conducted extensive branch-swapping with the TBR algorithm. We then verified that an identical result could be achieved with the less computationally-intensive NNI branch-swapping approach and then estimated branch support for the PAUP * ML run using 100 replications with NNI branch-swapping upon the starting NJ topology.
MP trees were also obtained using two approaches. First, we used PAUP *, with a heuristic search employing 50 replicates with random taxon addition followed by tree-bisection reconnection (TBR) branch-swapping. To assess nodal support, we performed 100 bootstrap replications, each of which included 10 replicates of random taxon addition, TBR branch-swapping, and a maximum of 1000 trees kept per replicate. The second MP approach used the software TNT [37], which employed the new technology search methods of sectorial search and tree fusion, with 100 replicates, holding 10,000 trees, and saving 100 trees per replication. Nodal support was assessed with 1000 bootstrap replications.
BI was performed with Beast 1.6.0 [38] with a partitioned dataset, in which every segment was treated as an independent partition, except for the five tRNA genes, that were concatenated into a single partition, and the COI and COIII genes, which were also joined into another partition (Table S4). Independent substitution and clock models were allowed for each partition, but their tree topology was constrained to be identical, as it is expected that all mtDNA segments should bear the same phylogenetic history. For each partition, we implemented the best-fit evolutionary model as estimated under the AIC with MrModelTest2.3 [39]. We ran the Markov chain Monte Carlo (MCMC) process for 100 million generations, with data sampled every 10,000 steps, and excluded the first 10% of each run by considering it the burn-in phase.
We estimated divergence dates using the relaxed molecular clock approach implemented in Beast. We modeled the relaxed molecular clock using the uncorrelated lognormal option, allowing each partition to have its own rate. We used two calibration points, and the priors were set as follows: (i) divergence between Canis and the south American canids, using a uniform prior with a conservative minimum time of 5.3 Mya based on the first fossil appearance of Canis [40] and a maximum time of 11.5 Mya [8]; (ii) divergence between Canis lupus and C. latrans, using a uniform prior with a minimum, fossil-based age of 1 Mya [41] and a conservative maximum of 3 Mya.

2.2.2. Nuclear Dataset

For each nuclear segment, a final contig (integrating two or more reads) was constructed for each individual using the software package containing PHRED, PHRAP, and CONSED (http://www.phrap.org/phredphrapconsed.html, accessed on 16 May 2022). We aligned final contigs with the CLUSTALW algorithm implemented in MEGA 4.1 [32]. The program Phase [42] was used to identify the gametic phase of segments bearing complex patterns of heterozygosity. Haplotype networks depicting the evolutionary relationships among sequences were built using the median-joining approach [43] implemented in Network 4.2.0 (www.fluxus-engineering.com, accessed on 16 May 2022). To determine the appropriate model of nucleotide sequence evolution, we used the Akaike information criterion as implemented in MrModeltest. We then constructed species trees incorporating the data from all nuclear segments and allowing for ILS using the program * BEAST [44] (see Supplementary Table S9 for parameters of the * BEAST run).

3. Results

We initially analyzed 6000 bp of mtDNA sequences, including 7 protein coding genes (portions of the COI, COIII and ND5 genes, and the complete ND3, ND4L, ND4 and Cytb genes), 5 tRNAs and the control region from 17 Lycalopex gymnocercus individuals, 8 L. griseus, 7 L. culpaeus, 6 L. fulvipes, 4 L. sechurae and 13 L. vetulus, as well as equivalent sequences from three outgroups: 3 Cerdocyon thous, 3 Chrysocyon brachyurus and 3 Speothos venaticus. The full dataset contained 1671 variable sites, 1399 of which were parsimony-informative (Supplementary Table S4).
Our preliminary analyses revealed no incongruence among segments. In most cases, individual mtDNA segments did not resolve the relationships among species with substantial or consistent support. Moreover, they did not always support the monophyly of all species (especially L. gymnocercus and L. culpaeus, which presented a deeper intra-specific phylogenetic structure—see below). Nevertheless, some features of the Lycalopex topology, such as a basal position for L. vetulus, were apparent with most of the individual-segment phylogenies (not shown).
Final mtDNA analyses, based on the concatenated dataset, led to robust support for species-level monophyly and consistent resolution of the Lycalopex inter-specific mitochondrial topology (Figure 2, Supplementary Figures S1 and S2). The best-fit model of sequence evolution estimated with the concatenated dataset was GTR + I + G, which was implemented in the ML analyses. The reconstruction performed with GARLI retrieved a single ML tree (lnL: −22,131.06802), while PAUP * found two trees with identical scores (lnL: −15,559.20359). Both approaches led to the same resolution of the Lycalopex topology, with considerably high bootstrap support for species-level and supra-specific nodes (Figure 2 and Table 1).
The MP reconstruction in PAUP * found 270 equally parsimonious trees (length: 2889 steps), while the TNT analysis retrieved five trees that were slightly longer (2908 steps). The strict consensus trees generated from both analyses were quite well resolved (i.e., almost all the differences among the original trees pertained to intra-specific tips), and highly congruent with each other. Bootstrap support was considerably high for most nodes, including the majority of those defining species-level monophyly as well inter-specific relationships (Supplementary Figure S1).
For the Bayesian inference, the algorithm implemented in MrModeltest identified the following models as providing the best fit to each of the segments: HKI + G for COI + COIII and ND3; HKY + I for ND4L; HKI + I + G for ND4, Control Region and tRNAs; GTR + G for ND5 and GTR + I for Cytb (see Table S4). These models were implemented in the partitioned Beast run, which produced a well-supported phylogeny congruent with those retrieved by other methods (Supplementary Figure S2).
Overall, Lycalopex was supported as a monophyletic group with high branch support with all methods. Each of the six species of the genus was also found to be monophyletic: L. vetulus, L. sechurae and L. fulvipes received 100% support with all methods, while L. gymnocercus and L. griseus varied between 99% and 100%. Interestingly, L. culpaeus received the least consistent support, varying between 75 and 98%. This was due to the relatively deep partition between two divergent L. culpaeus phylogeographic lineages (see below).
The inter-specific topology supported the hypothesis that L. vetulus is the most basal species in the genus (see Figure 2, Figures S1 and S2). Interestingly, our results indicated that the next divergence led to the little-known Pacific species L. sechurae, followed by L. gymnocercus. The most internal clade was composed by L. griseus, L. fulvipes and L. culpaeus, with the latter two being sister-species. Most of these nodes received high support, especially with the model-based methods ML and BI (see Figure 2, Figures S1 and S2, and Table 1).
The separation between genus Lycalopex and the closest outgroup Cerdocyon thous was estimated to have occurred ca. 3 Mya (Figure 3). The coalescence age (as estimated by the time to the most recent common ancestor—TMRCA) of genus Lycalopex as a whole was estimated to be ca. 1.2 Mya, when L. vetulus diverged from the other lineages. The next divergence (that of L. sechurae) occurred ca. 0.8 Mya, followed by a very rapid succession of speciation events between 0.53 Mya and 0.39 Mya, which led to the formation of L. gymnocercus, L. griseus, L. culpaeus and L. fulvipes (see Figure 3).
In addition to the reconstruction of inter-specific relationships, some patterns of within-species variation could also be observed. Species-level coalescence age was somewhat variable, ranging from 60,000 years ago for L. fulvipes to 390,000 years ago for L. gymnocercus (Figure 3, Supplementary Table S5). The species presenting the deepest coalescence (L. gymnocercus and L. culpaeus) were also found to exhibit considerable intra-specific phylogenetic structure. L. gymnocercus contains at least three well-supported clades, identified here as Lgy-I to Lgy-III (see Figure 2 and Table 1). There was no precise geographic signal in this structure, although it can be noted that clade Lgy-II was restricted to the northeastern portion of the species’ range, by including haplotypes sampled in the mountainous grasslands of Rio Grande do Sul state, Brazil (‘Campos de Cima da Serra’ region), and the only currently available sample from Paraná state (Brazil), almost at the northernmost limit for this species in Brazil. Interestingly, two additional haplotypes allocated in this clade were sampled in individuals that were phenotypically identified as L. vetulus (bPve328 and bPve353), and wild-caught in São Paulo state, north of Paraná, where this species has until recently not been known to occur (see Figure 1 and Figure 2).
In addition, with respect to intra-specific structure, there was a clear phylogeographic pattern in L. culpaeus, with samples collected in Argentina and Chile forming one well-supported cluster (Lcu-I) and those collected in Peru forming another (Lcu-II) (Figure 2). There was also a possible phylogeographic pattern in L. griseus, with one well-supported clade (Lgr-I) containing samples from western Argentina (see Figure 1 and Supplementary Table S1), and another (Lgr-II) including samples from central-eastern Argentina and Chile. Finally, L. vetulus also contained one sub-clade (Lve-I) that was rather well-supported (see Table 1) and geographically restricted, as its contained haplotypes were found only in samples collected in the northeastern Brazilian states of Maranhão and Piauí.
To complement the mtDNA dataset, we generated sequences from seven different nuclear fragments, which were analyzed both separately and jointly, using a species tree approach. All genes showed interspecific and intraspecific variation, which could be clearly observed in haplotype networks (Figure 4). We also observed considerable sharing of haplotypes between two or more species in all genes, and several cases in which species were not monophyletic. The species tree jointly incorporating the gene trees from all seven segments did recover strong support for most internal nodes (Figure 5). The only clade that received high support (0.91 BPP) united L. gymnocercus + L. griseus, a relationship that was distinct from the mtDNA reconstruction.

4. Discussion

When the mtDNA concatenation was analyzed, all phylogenetic methods retrieved the same inter-specific tree topology of Lycalopex with considerably high support. This indicates that our mitochondrial dataset was very consistent, providing a robust resolution of the relationships among these six fox species. The monophyly of the genus was highly supported, which is consistent with previous studies e.g., [6,21,45]. Within Lycalopex, the taxonomic status of several species has been controversial for many years e.g., [13,17,22,46,47]. Our results strongly supported the mitochondrial monophyly of each species, corroborating the view that this genus includes six extant species, as proposed by [11,19,21]. In particular, the monophyly of the sechuran fox was supported for the first time using multiple individuals of this species, corroborating the previous results recovered by [22]. It is also noteworthy that this dataset did not include the individuals identified as L. gymnocercus that [11] reported to bear L. griseus mtDNA.
The position of L. vetulus as the most basal species of the group was strongly supported, and corroborates the studies of [6,11]. L. sechurae was found to be the second most divergent lineage in the mtDNA phylogeny of this genus, which is congruent with the results reported by [11,22]. The position of L. gymnocercus and the internal clade formed by L. griseus as sister group to L. culpaeus + L. fulvipes were variably retrieved in previous studies, with no consistent resolution observed in the literature. A common arrangement is the placement of L. culpaeus as a sister-group to L. griseus, as observed by [11] and in the total evidence analyses reported by [45], albeit with low support for this clade. [13], using multiple individuals each from L. fulvipes, L. culpaeus and L. griseus, found this same cluster, but L. culpaeus and L. griseus were not reciprocally monophyletic. [22] also found a sister-group relationship between L. culpaeus and the clade that likely represents L. griseus, with the L. fulvipes sample placed externally to this sister-pair. Our finding that L. culpaeus is the sister-group of L. fulvipes was also reported by [14], although in their analyses L. culpaeus was not completely monophyletic, with some individuals clustering with L. fulvipes and others with L. griseus. It is therefore noteworthy that in this study all of these species were retrieved as monophyletic entities, and their mitochondrial phylogenetic relationships clarified.
Our mtDNA results indicate that the speciation of Lycalopex began during the Pleistocene ca. 1.2 Mya, in agreement with the time frame inferred by [10] (1.3 Mya) and [11] (1.2 Mya). In less than 1 million years, all six species were formed (see Figure 1), which helps explain the difficulty in resolving their evolutionary relationships. The speciation of the most internal cluster (L. griseus (L. fulvipes + L. culpaeus)) was particularly recent (ca. 0.43 Mya), and corroborates the estimate reported by [13], who dated the divergence among these species as ca. 0.27 to 0.66 Mya.
The resolution of the mtDNA phylogeny of this Pleistocene radiation provides an opportunity to assess its biogeographic history. It has often been hypothesized that Pleistocene climatic changes have had important impacts on the phylogeographic structure of mammals e.g., [48], because glacial cycles likely affected plant communities, habitat composition and, as a consequence, the geographic distribution of mammalian species [49]. During this time, South America went through cycles that included times when vast regions were covered by savanna, open-country environments, which allowed the expansion of their associated fauna [50,51]. In contrast, there were periods when grasslands contracted and forests expanded [52,53], which may have induced isolation among populations of open-habitat species, possibly fostering allopatric speciation. Such a system, when applied cyclically to medium-sized carnivores that are mostly adapted to open habitat formations, may have led to periods of range expansion followed by geographic isolation, thus inducing repeated episodes of speciation.
The position of the hoary fox as the most divergent species of Lycalopex indicates that the emergence of this genus may have occurred in central South America, which is dominated by savanna formations such as the Brazilian Cerrado. This view agrees with that of [46], who proposed central Brazil as the center of radiation for Lycalopex, but contrasts with that of [19], who proposed that their first center of speciation was Argentina. Both areas could have played important roles in the sequence of speciations that produced the present Lycalopex diversity [11]. Interestingly, similar biogeographic patterns can be observed in other mammalian groups, including extinct Pleistocene megafauna taxa which contained closely related Brazilian and Argentinean fossil representatives [54]. In contrast to these classical views, an intriguing result was the basal position of L. sechurae, which was the second lineage to diverge in this genus (see Figure 2). This poorly known species occurs in open habitats near the Pacific coast of Peru and Ecuador, and its phylogenetic position suggests that it may have become isolated after a trans-Andean colonization process. Given the evidence of extensive genealogical discordance in this group (see below), this result may have been induced by ILS affecting the mitogenome, and needs to be further scrutinized with sufficiently informative nuclear data. The current geographic distributions of the remaining species (see Figure 1), along with our reconstructed mtDNA topology, suggest that their ancestors remained east of the Andes, and that the next round of speciation (leading to the separation of L. gymnocercus from the others) may have occurred in Argentina. Given the present distribution of L. griseus (and the paucity of fossils from this group as a whole), it is difficult to infer whether its divergence took place in Argentina or Chile, but it is possible that Andes-associated environments have also acted as barriers in this case. Finally, the event separating L. culpaeus from L. fulvipes likely occurred west of the Andes, and may have been a case of parapatric speciation, with adaptive divergence driving the differentiation between the two species.
In addition to resolving the mtDNA phylogeny among the extant Lycalopex species, our dataset also revealed some interesting cases of intra-specific phylogeographic structure in this group (see Figure 2). [11] had already observed two well-supported clades of pampas foxes, which were mostly (but not completely) restricted to the southern and northern grassland regions of Rio Grande do Sul (RS) state, Brazil. In this study, we also observed a similar pattern, but found a more complex phylogeographic structure for this species (Figure 2). Individuals from cluster Lgy-I were sampled in Argentina and also in both the southern and northern regions of RS state, as well as in the adjacent Brazilian state of Santa Catarina (SC). Its internal phylogenetic pattern suggests that further structure may exist here (as the Argentinean sample was divergent from a Brazilian sub-cluster) and should be investigated with additional sampling.
Cluster Lgy-II was found to be restricted to northern RS, PR and São Paulo (SP) states, possibly representing a lineage endemic to the altitude grasslands that were once surrounded by Atlantic Forest. The presence in this cluster of two individuals morphologically identified as L. vetulus is quite remarkable, and suggests that they could be hybrids between these species, bearing L. vetulus morphology and an introgressed L. gymnocercus mtDNA haplotype. This hypothesis should be tested with more extensive sampling of foxes in SP state. If affirmed by additional analyses, this case of hybridization may imply an anthropogenic process, as L. gymnocercus and L. vetulus are both open-habitat species that were likely isolated from each other by a broad swath of Atlantic Forest. Given the extreme deforestation process that has affected SP state and adjacent regions in the last few centuries, we can postulate that there could now be continuous open habitat joining their historical ranges, which may allow contact between them. Therefore, investigating this problem with expanded sampling and additional markers would be a priority from a conservation perspective.
In contrast to the well-resolved topology obtained with the mtDNA dataset, our nuclear results revealed rampant genealogical discordance (Figure 4), leading to poor resolution of the species tree (Figure 5). We observed widely different genealogies among the independent gene loci, along with lack of species monophyly and inter-specific haplotype sharing. Part of this problem may be due to poor resolution of the genealogy at the level of individual loci, given the recent divergence of these species and the slower substitution rates of nuclear segments relative to mtDNA. At the same time, some loci (e.g., CHRNA1, FES) did exhibit relatively high levels of diversity in this group, and reasonable resolution of their haplotype networks (e.g., by showing the outgroup Cerdocyon as a distinct lineage and several mutational steps within Lycalopex). Still, even with these markers there was very poor resolution of Lycalopex relationships, with extensive sharing of haplotypes among species. It was notable that, for almost all segments, there was a common, central haplotype, shared by most species, and either connected to the outgroup or shared by it as well. This implies that it likely represents the ancestral Lycalopex haplotype for these segments, which is still segregating in present-day populations.
Such a situation provides extensive opportunity for incomplete lineage sorting (ILS) in this group, which can be compensated by the use of coalescent-based species tree approaches, as implemented in this study. In spite of the potential power of these approaches, our resulting species tree was poorly resolved, with the only well-supported node (L. gymnocercus + L. griseus) differing from the mtDNA resolution. This indicates that ILS is indeed rampant in this group, and that a larger amount of nuclear data will be required to conclusively resolve these relationships. Interestingly, our consensus nuclear topology was very similar to the maximum parsimony tree of [6]. However, in our analysis, L. vetulus grouped with L. fulvipes (weakly supported) instead of being placed at a basal position in the genus, as was the case in that study (and in our mtDNA results). In addition to pervasive ILS, inter-species hybridization may also lead to genealogical discordance in Lycalopex, as suggested by [11] for the pair L. gymnocercus vs. L. griseus, and again hypothesized here for two L. vetulus individuals bearing L. gymnocercus mtDNA. This hypothesis should be further scrutinized with expanded nuclear datasets and approaches that incorporate both ILS and admixture. Moreover, the phylogeographic patterns observed here with mtDNA data for several species should be further investigated with additional sampling across these species’ ranges, so as to better characterize their population structure and demographic history. Integrating these approaches in the future should provide a complete picture of the evolutionary history of this rapid radiation, and provide a clearer phylogenetic foundation for in-depth biological studies focusing on this group.

Supplementary Materials

The following are available online at https://www.mdpi.com/article/10.3390/d14080642/s1, Figure S1: Maximum parsimony phylogeny of genus Lycalopex. Figure S2: Bayesian phylogeny of South American foxes of genus Lycalopex. Table S1: Samples of Lycalopex individuals analyzed in this study. Table S2: Mitochondrial DNA segments amplified and sequenced from the genus Lycalopex in this study. Table S3: Mitochondrial PCR/sequencing primers generated from the genus Lycalopex in this study. Table S4: Lycalopex mitochondrial DNA dataset features. Table S5: Estimation of the times of origin (time to the most recent common ancestor–TMRCA) for genus Lycalopex, as well as each of the analyzed species, with the mtDNA dataset. Table S6: Number of sequences generated here per species of Lycalopex for each nuclear gene segment. Table S7: Accession numbers for nuclear sequences downloaded from GenBank for genus Lycalopex. Table S8: List of the nuclear segments and primers used in this study for genus Lycalopex [55,56,57]. Table S9: Parameters employed for the * BEAST analyses of nuclear sequences.

Author Contributions

Conceptualization, E.E.; methodology, M.O.F., T.L.L.S. and G.S.M.; validation, M.O.F., T.L.L.S. and F.S.G.; formal analysis, M.O.F. and T.L.L.S.; investigation, M.O.F., T.L.L.S., G.S.M. and F.S.G.; resources, L.R.O., S.C.-A., M.C.M., F.A., C.B.K. and W.E.J.; data curation, M.O.F., T.L.L.S. and F.S.G.; writing—original draft preparation, M.O.F., T.L.L.S. and E.E.; writing—review and editing, W.E.J., L.R.O., S.C.-A., M.C.M., F.A. and C.B.K.; visualization, M.O.F., T.L.L.S. and F.S.G.; supervision, E.E. and L.R.O.; project administration, E.E.; funding acquisition, E.E. All authors have read and agreed to the published version of the manuscript.

Funding

This research was funded by FAPERGS/Brazil (grant number PqG-1014211) and CNPq/Brazil (grant number 311327/2011-7). This study was also financed in part by the Coordenação de Aperfeiçoamento de Pessoal de Nível Superior—Brazil (CAPES)—Finance Code 001.

Institutional Review Board Statement

Ethical review and approval were waived for this study, due to the use of biological samples that were either collected from road-killed individuals or received from collaborators based on previous collections; therefore, this study did not entail the capture or handling of live animals.

Informed Consent Statement

Not applicable.

Data Availability Statement

Novel nucleotide data reported here have been submitted to GenBank (NCBI, Bethesda, MD, USA).

Acknowledgments

We thank C. R. Sarturi, M. L. Fontoura-Rodrigues and P. M. Zamberlan for technical assistance.

Conflicts of Interest

The authors declare no conflict of interest.

References

  1. Lemey, P.; Salemi, M.; Vandamme, A.M. (Eds.) The Phylogenetic Handbook: A Practical Approach to Phylogenetic Analysis and Hypothesis Testing; Cambridge University Press: Cambridge, UK, 2009. [Google Scholar]
  2. Avise, J.C. Molecular Markers, Natural History and Evolution; Chapman & Hall: New York, NY, USA, 1994. [Google Scholar]
  3. Kapli, P.; Yang, Z.; Telford, M.J. Phylogenetic tree building in the genomic age. Nat. Rev. Genet. 2020, 21, 428–444. [Google Scholar] [CrossRef] [PubMed]
  4. Avise, J.C.; Arnold, J.; Ball, R.M.; Bermingham, E.; Lamb, T.; Neigel, J.E.; Reeb, C.A.; Saunders, N.C. Intraspecific Phylogeography: The Mitochondrial DNA Bridge Between Population Genetics and Systematics. Annu. Rev. Ecol. Syst. 1987, 18, 489–522. [Google Scholar] [CrossRef]
  5. Moritz, C. Defining ‘Evolutionarily Significant Units’ for conservation. Trends Ecol. Evol. 1994, 9, 373–375. [Google Scholar] [CrossRef]
  6. Lindblad-Toh, K.; Wade, C.M.; Mikkelsen, T.S.; Karlsson, E.K.; Jaffe, D.B.; Kamal, M.; Clamp, M.; Chang, J.L.; Kulbokas, E.J., III; Zody, M.C.; et al. Genome sequence, comparative analysis and haplotype structure of the domestic dog. Nature 2005, 438, 803–819. [Google Scholar] [CrossRef]
  7. Johnson, W.E.; Eizirik, E.; Pecon-Slattery, J.; Murphy, W.J.; Antunes, A.; Teeling, E.; O’Brien, S.J. The late Miocene radiation of modern Felidae: A genetic assessment. Science 2006, 311, 73–77. [Google Scholar] [CrossRef]
  8. Eizirik, E.; Murphy, W.J.; Koepfli, K.P.; Johnson, W.E.; Dragoo, J.W.; Wayne, R.K.; O’Brien, S.J. Pattern and timing of diversification of the mammalian order Carnivora inferred from multiple nuclear gene sequences. Mol. Phylogenet. Evol. 2010, 56, 49–63. [Google Scholar] [CrossRef]
  9. Li, G.; Davis, B.W.; Eizirik, E.; Murphy, W.J. Phylogenomic evidence for ancient hybridization in the genomes of living cats (Felidae). Genome Res. 2016, 26, 1–11. [Google Scholar] [CrossRef]
  10. Perini, F.A.; Russo, C.A.M.; Schrago, C.G. The evolution of South American endemic canids: A history of rapid diversification and morphological parallelism. J. Evol. Biol. 2010, 23, 311–322. [Google Scholar] [CrossRef]
  11. Tchaicka, L.; de Freitas, T.R.O.; Bager, A.; Vidal, S.L.; Lucherini, M.; Iriarte, A.; Novaro, A.; Geffen, E.; Garcez, F.S.; Johnson, W.E.; et al. Molecular assessment of the phylogeny and biogeography of a recently diversified endemic group of South American canids (Mammalia: Carnivora: Canidae). Genet. Mol. Biol. 2016, 39, 442–451. [Google Scholar] [CrossRef]
  12. Wozencraft, W.C. Carnivora. In Mammal Species of the World: A Taxonomic and Geographic Reference, 3rd ed.; Wilson, D.E., Reeder, D.M., Eds.; Johns Hopkins University Press: Baltimore, MD, USA, 2005; pp. 532–628. [Google Scholar]
  13. Yahnke, C.J.; Johnson, W.E.; Geffen ESmith, D.; Hertel, F.; Roy, M.S.; Bonacic, C.F.; Fuller, T.K.; Valkenburgh, B.V.; Wayne, R.K. Darwin’s Fox: A Distinct Endangered Species in a Vanishing Habitat. Conserv. Biol. 1996, 10, 366–375. [Google Scholar] [CrossRef]
  14. Vilà, C.; Leonard, J.A.; Iriarte, A.; O’Brien, S.J.; Johnson, W.E.; Wayne, R.K. Detecting the vanishing populations of the highly endangered Darwin’s fox, Pseudalopex fulvipes. Anim. Conserv. 2004, 7, 147–153. [Google Scholar] [CrossRef]
  15. Eisenberg, J.F.; Redford, K.H. Mammals of the Neotropics. Ecuador, Peru, Bolivia, Brazil; University of Chicago Press: Chicago, IL, USA, 1999; Volume 3, pp. 13–18, 279–286, 339–348. [Google Scholar]
  16. MacDonald, D.W.; Zubiri, C.S. Biology and Conservation of Wild Canids; Oxford University Press: Oxford, UK, 2004. [Google Scholar]
  17. Zunino, G.; Vaccaro, O.; Canevari, M.; Gardner, A. Taxonomy of the Genus Lycalopex (Carnivora, Canidae) in Argentina. Proc Biol. Soc. 1995, 108, 729–747. [Google Scholar]
  18. Prevosti, F.J.; Segura, V.; Cassini, G.; Martin, G.M. Revision of the systematic status of Patagonian and Pampean gray foxes (Canidae: Lycalopex griseus and L. gymnocercus) using 3D geometric morphometrics. Mastozool. Neotrop. 2013, 20, 289–300. [Google Scholar]
  19. Berta, A. Origin, diversification, and zoogeography of the South American Canidae. Fieldiana Zool. 1987, 39, 455–471. [Google Scholar]
  20. Wayne, R.K.; Geffen, E.; Girman, D.J.; Koepfli, K.P.; Lau, L.M.; Marshall, C.R. Molecular systematics of the Canidae. Syst. Biol. 1997, 46, 622–653. [Google Scholar] [CrossRef]
  21. Zrzavy, J.; Ricánková, V. Phylogeny of Recent Canidae (Mammalia, Carnivora): Relative reliability and utility of morphological and molecular datasets. Zool. Scr. 2004, 33, 311–333. [Google Scholar] [CrossRef]
  22. Chemisquy, M.A.; Prevosti, F.J.; Martínez, P.; Raimondi, V.; Stom, J.E.C.; Acosta-Jamett, G.; Montoya-Burgos, J.I. How many species of grey foxes (Canidae, Carnivora) are there in southern South America? Mastozool. Neotrop. 2019, 26, 81–97. [Google Scholar]
  23. Sambrook, J.; Fritsch, E.F.; Maniatis, T. Molecular Cloning: A Laboratory Manual, 2nd ed.; Cold Spring Harbor Laboratory Press: New York, NY, USA, 1989. [Google Scholar]
  24. Delisle, I.; Strobeck, C. Conserved Primers for Rapid Sequencing of the Complete Mitochondrial Genome from Carnivores, Applied to Three Species of Bears. Mol. Biol. Evol. 2002, 19, 357–361. [Google Scholar] [CrossRef]
  25. Irwin, D.M.; Kocher, T.D.; Wilson, A.C. Evolution of the cytochrome b gene of mammals. J. Mol. Evol. 1991, 32, 128–144. [Google Scholar] [CrossRef]
  26. Trigo, T.C.; Freitas, T.R.O.; Kunzler, G.; Cardoso, L.; Silva, J.C.R.; Johnson, W.E.; O’Brien, S.J.; Bonatto, S.L.; Eizirik, E. Interspecies hybridization among Neotropical cats of the genus Leopardus, and evidence for an introgressive hybrid zone between L. geoffroyi and L. tigrinus in southern Brazil. Mol. Ecol. 2008, 17, 4317–4333. [Google Scholar]
  27. Tchaicka, L.; Eizirik, E.; Oliveira, T.G.; Cândido, J.F., Jr.; Freitas, T.R.O. Phylogeography and population history of the crab-eating fox (Cerdocyon thous). Mol. Ecol. 2007, 16, 819–838. [Google Scholar] [CrossRef]
  28. Ewing, B.; Hillier, L.; Wendl, M.C.; Green, P. Base-calling of automated sequencer traces using phred I. Accuracy assessment. Genome Res. 1998, 8, 175–185. [Google Scholar] [CrossRef] [PubMed]
  29. Ewing, B.; Green, P. Base-calling of automated sequencer traces using phred II. Error probabilities. Genome Res. 1998, 8, 186–194. [Google Scholar] [CrossRef] [PubMed]
  30. Gordon, D.; Abajian, C.; Green, P. Consed: A Graphical Tool for Sequence Finishing. Genome Res. 1998, 8, 195–202. [Google Scholar] [CrossRef]
  31. Thompson, J.D.; Higgins, D.G.; Gibson, T.J. CLUSTAL W: Improving the sensitivity of progressive multiple sequence alignment through sequence weighting, position-specific gap penalties and weight matrix choice. Nucleic Acids Res. 1994, 11, 4673–4680. [Google Scholar] [CrossRef] [PubMed]
  32. Tamura, K.; Dudley, J.; Nei, M.; Kumar, S. MEGA4: Molecular Evolutionary Genetics Analysis (MEGA) Software Version 4.0. Mol. Biol. Evol. 2007, 24, 1596–1599. [Google Scholar] [CrossRef]
  33. Swofford, D.L. PAUP*. Phylogenetic Analysis Using Parsimony (*and Other Methods). Version 4; Sinauer Associates: Suderland, MA, USA, 2000. [Google Scholar]
  34. Saitou, N.; Nei, M. The neighbor-joining method: A new method for reconstructing phylogenetic trees. Mol. Biol. Evol. 1987, 4, 406–425. [Google Scholar] [CrossRef] [PubMed]
  35. Posada, D.; Crandall, K. Modeltest: Testing the model of DNA substitution. Bioinformatics 1998, 14, 817–818. [Google Scholar] [CrossRef]
  36. Zwickl, D.J. Genetic Algorithm Approaches for the Phylogenetic Analysis of Large Biological Sequence Datasets under the Maximum Likelihood Criterion. Ph.D. Thesis, The University of Texas at Austin, Austin, TX, USA, 2006. [Google Scholar]
  37. Goloboff, P.A.; Farris, J.S.; Nixon, K.C. TNT, a free program for phylogenetic analysis. Cladistics 2008, 24, 774–786. [Google Scholar] [CrossRef]
  38. Drummond, A.J.; Rambaut, A. BEAST: Bayesian evolutionary analysis by sampling trees. BMC Evol. Biol. 2007, 7, 214. [Google Scholar] [CrossRef] [PubMed]
  39. Nylander, J.A.A. MrModeltest v2—Program Distributed by the Author; Evolutionary Biology Centre, Uppsala University: Uppsala, Sweden, 2004. [Google Scholar]
  40. McKenna, M.C.; Bell, S.K. Classification of Mammals above the Species Level; Columbia University Press: New York, NY, USA, 1997. [Google Scholar]
  41. Kurtén, B.; Anderson, E. Pleistocene Mammals of North America; Columbia University Press: New York, NY, USA, 1980. [Google Scholar]
  42. Stephens, M.; Smith, N.J.; Donnelly, P. A New Statistical Method for Haplotype Reconstruction from Population Data. Am. J. Hum. Genet. 2001, 68, 978–989. [Google Scholar] [CrossRef] [PubMed]
  43. Bandelt, H.J.; Forster, P.; Röhl, A. Median-joining networks for inferring intraspecific phylogenies. Mol. Biol. Evol. 1999, 16, 37–48. [Google Scholar] [CrossRef] [PubMed]
  44. Heled, J.; Drummond, A.J. Bayesian Inference of Species Trees from Multilocus Data. Mol. Biol. Evol. 2009, 27, 570–580. [Google Scholar] [CrossRef] [PubMed]
  45. Prevosti, F. Phylogeny of the large extinct South American Canids (Mammalia, Carnivora, Canidae) using a “total evidence” approach. Cladistics 2010, 26, 456–481. [Google Scholar] [CrossRef]
  46. Langguth, A. Ecology and evolution in the South American canids. In The Wild Canids; Fox, M.W., Ed.; Litton Educational Publishing: New York, NY, USA, 1975; pp. 92–206. [Google Scholar]
  47. Medel, R.G.; Jiménez, J.E.; Jaksic, F.M.; Yáñez, J.L.; Armesto, J.J. Discovery of a continental population of the rare Darwin’s fox, Dusicyon fulvipes (Martin, 1837) in Chile. Biol. Cons. 1990, 51, 71–77. [Google Scholar] [CrossRef]
  48. Avise, J.C.; Walker, D.; Johns, G.C. Speciation durations and Pleistocene effects on vertebrate phylogeography. Proc. R. Soc. B 1998, 265, 1707–1712. [Google Scholar] [CrossRef]
  49. MacFadden, B.J. Extinct mammalian biodiversity of the ancient New World tropics. Trends Ecol. Evol. 2006, 21, 157–165. [Google Scholar] [CrossRef]
  50. Webb, S.D. A History of Savanna Vertebrates in The New World. Part I: South America and the Great Interchange. Ann. Rev. Ecol. Syst. 1977, 8, 355–380. [Google Scholar] [CrossRef]
  51. Cartelle, C. Pleistocene Mammals of the Cerrado and Caatinga of Brazil. Mammals of the Neotropics, the Central Neotropics: Volume 3, Ecuador, Peru, Bolivia, Brazil; Eisenberg, J.F., Redford, K.H., Eds.; The University of Chicago Press: Chicago, IL, USA, 1999; pp. 27–46. [Google Scholar]
  52. Webb, S.D. A History of Savanna Vertebrates in the New World. Part II: South America and the Great Interchange. Annu. Rev. Ecol. Syst. 1978, 9, 393–426. [Google Scholar] [CrossRef]
  53. Vivo, M.; Carmignotto, A.P. Holocene vegetation change and the mammal faunas of South America and Africa. J. Biogeogr. 2004, 31, 943–957. [Google Scholar] [CrossRef]
  54. Fariña, R.A.; Vizcaíno, S.F.; de Iuliis, G. Megafauna: Giant Beasts of Pleistocene South America; Indiana University Press: Bloomington, IN, USA, 2013. [Google Scholar]
  55. Jiang, Z.; Priat, C.; Galibert, F. Traced orthologous amplified sequence tags (TOASTs) and mammalian comparative maps. Mamm. Genome 1988, 9, 577–587. [Google Scholar] [CrossRef] [PubMed]
  56. Lyons, L.A.; Laughlin, T.F.; Copeland, N.G.; Jenkins, N.A.; Womack, J.E.; O’Brien, S.J. Comparative anchor tagged sequences (CATS) for Integrative mapping of mammalian genomes. Nat. Genet. 1997, 15, 47–56. [Google Scholar] [CrossRef] [PubMed]
  57. Venta, P.J.; Brouillette, J.A.; Yuzbasiyan-Gurkan, V.; Brewer, G.J. Gene-specific universal mammalian sequence-tagged sites: Application to the canine genome. Biochem. Genet. 1996, 34, 321–341. [Google Scholar] [CrossRef] [PubMed]
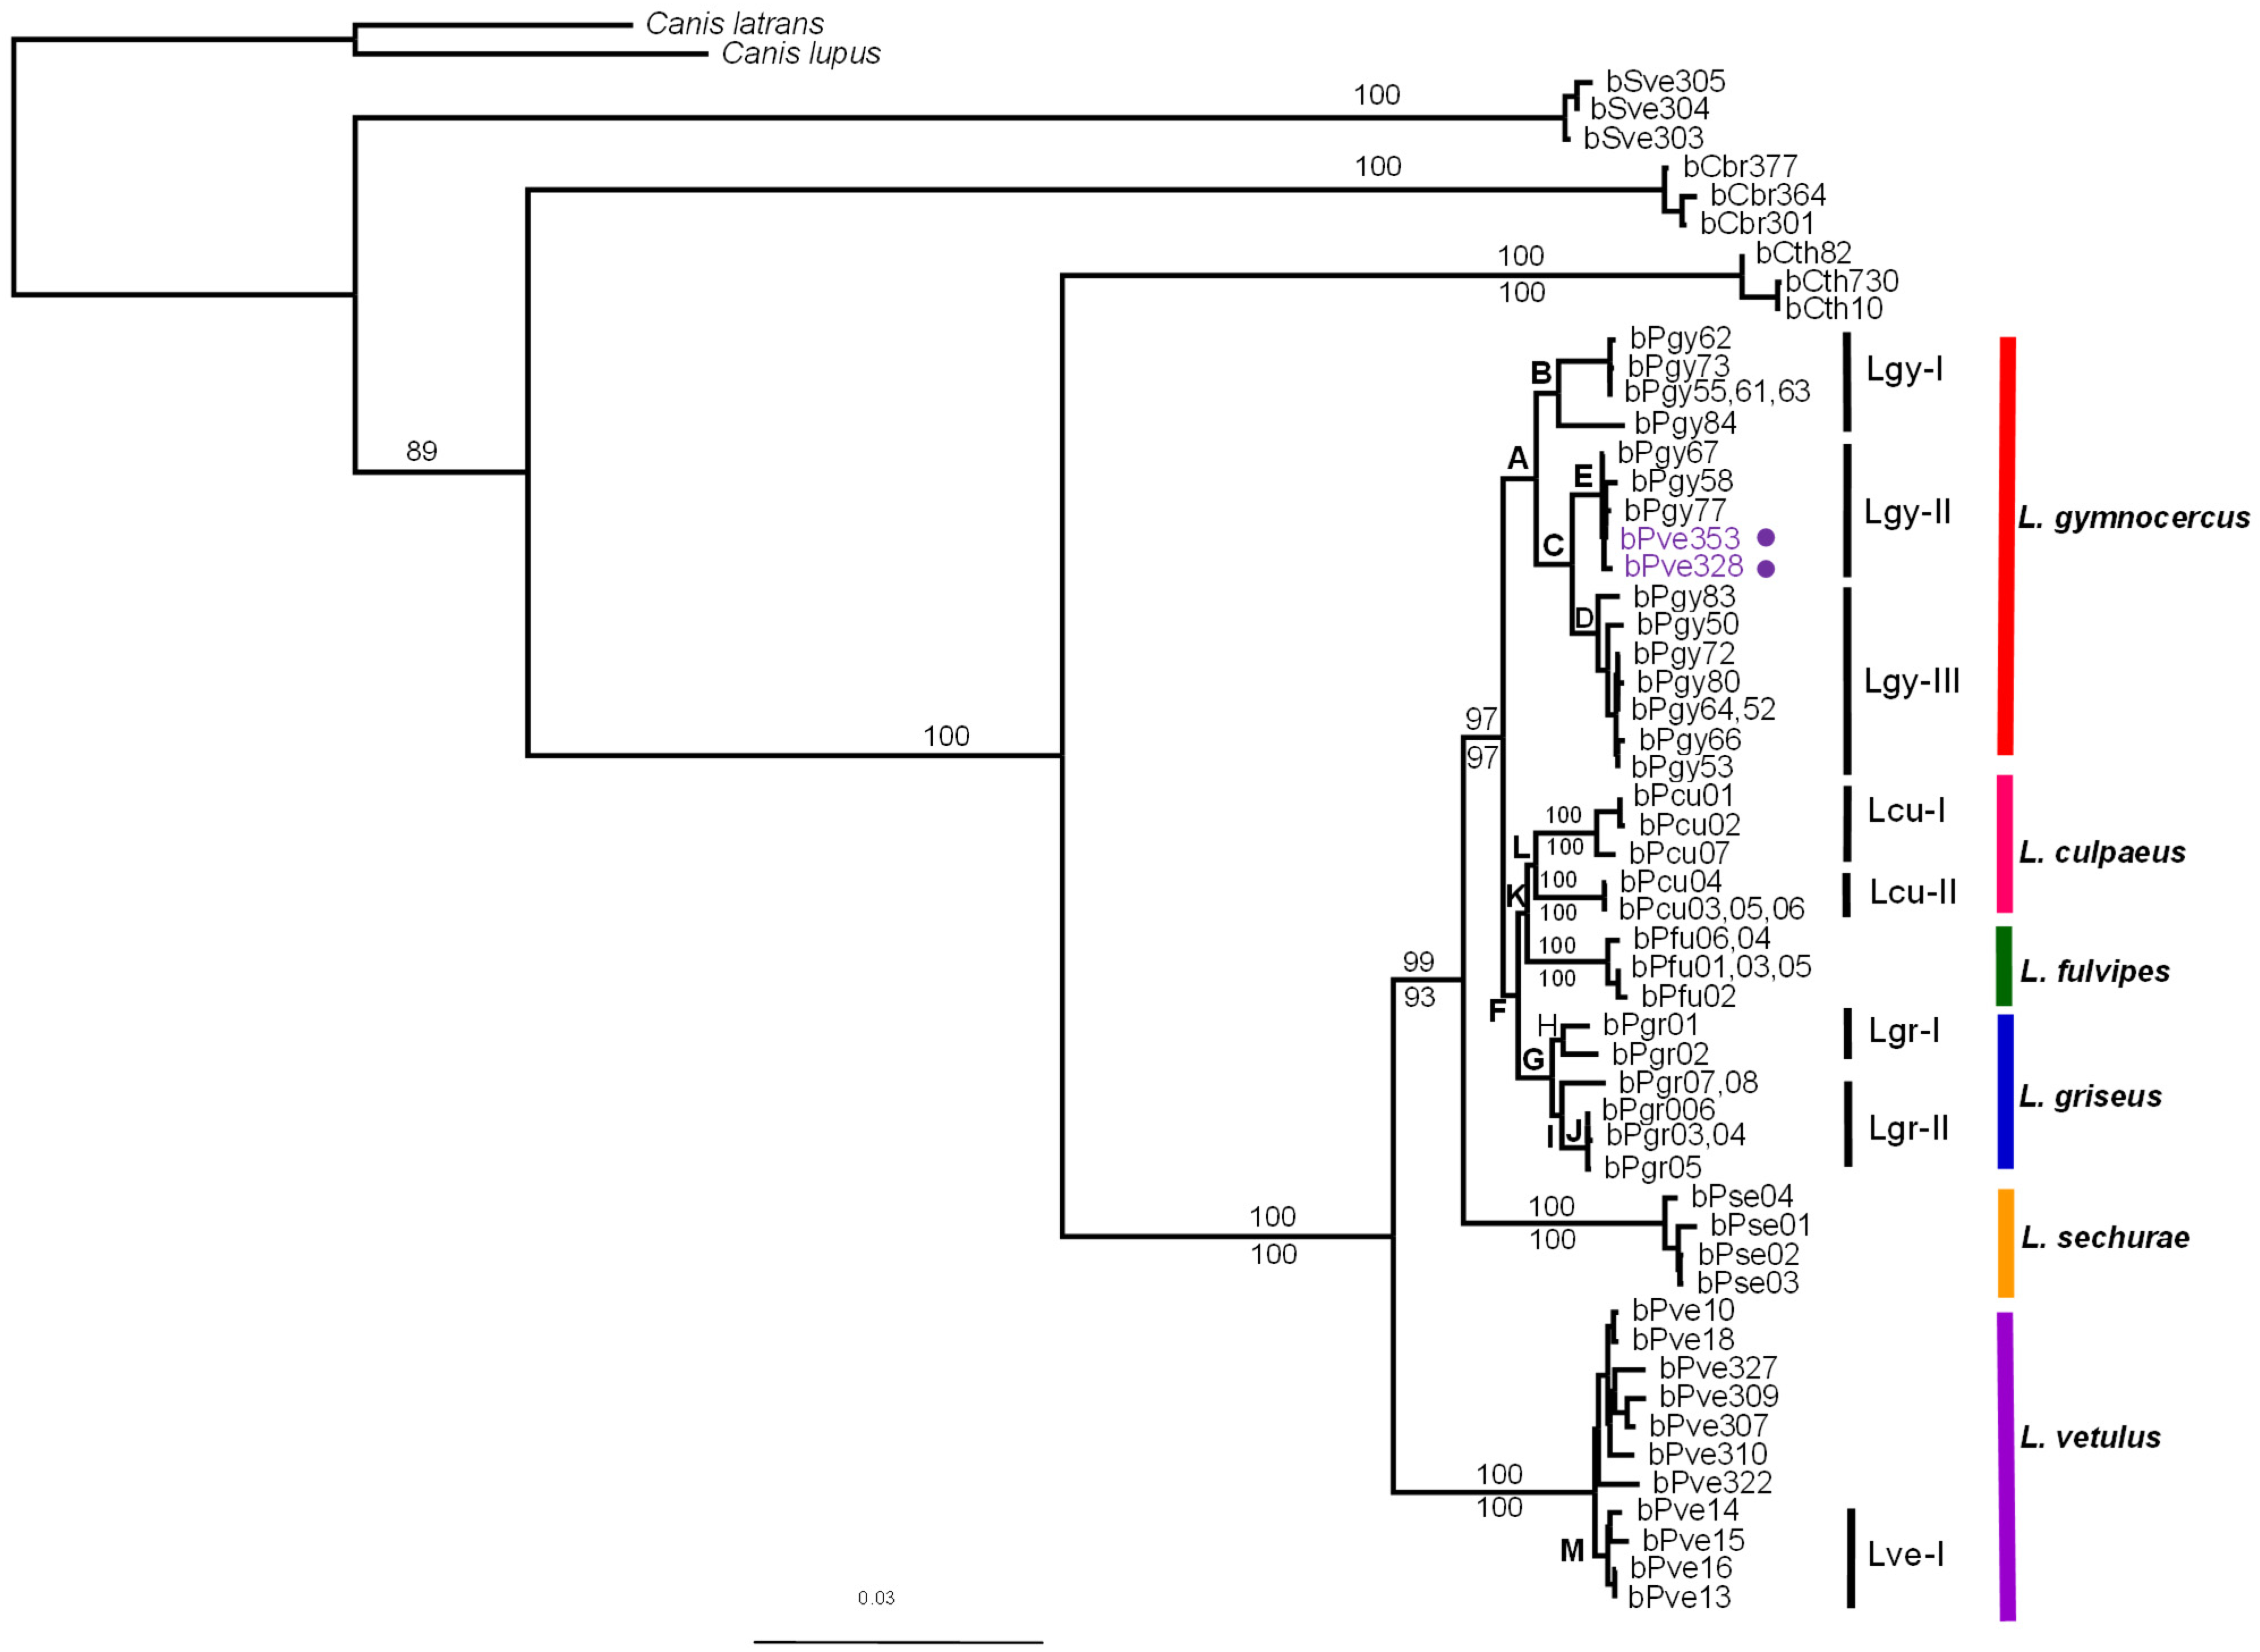
Figure 1. Maps depicting the currently recognized ranges for Lycalopex species (based on IUCN data). For clarity, three species are shown on panel (A) and three species on panel B (see internal legends for details). On panel (B) the geographic origins of the two L. vetulus individuals with L. gymnocercus mtDNA haplotypes are shown in red.
Diversity 14 00642 g001
Figure 2. Maximum likelihood phylogram of genus Lycalopex estimated with GARLI. Bootstrap values shown above and below branches were calculated with GARLI and PAUP, respectively. Support values for lettered nodes are given in Table 1. Sample identification numbers for Lycalopex species correspond to those listed in Supplementary Table S1. Outgroup species are identified by the following sample codes: ‘bSve’ for Speothos venaticus individuals, ‘bCbr’ for Chrysocyon brachyurus, and ‘bCth’ for Cerdocyon thous. Colored bars indicate species-level clades, whose names are indicated on the right. Supported intra-specific mtDNA clades are also indicated (e.g., Lgy-I within L. gymnocercus). Individuals phenotypically identified as L. vetulus but bearing L. gymnocercus mtDNA haplotypes are indicated by purple circles.
Diversity 14 00642 g002
Figure 3. Bayesian chronogram for South American foxes. Values above branches indicate the age of the adjacent node, while those below branches are the respective 95% credibility interval (based on the 95% Highest Posterior Density (HPD) range). Letters indicate nodes whose age is listed in the inset box. Species-level branches are colored as in Figure 2.
Diversity 14 00642 g003
Figure 4. Median-joining networks estimated for nuclear markers in genus Lycalopex. Gene names are indicated on the top right of each box. Each haplotype is represented by a circle, whose area is proportional to its frequency. The colors represent different species, described in the internal legend. Haplotypes shared between two or more species are represented by pie charts with mixed colors.
Diversity 14 00642 g004
Figure 5. Species trees inferred with * BEAST for genus Lycalopex. The Bayesian posterior probability of each clade is indicated next to the defining node.
Diversity 14 00642 g005
Table 1. Support values obtained with different phylogenetic methods for nodes marked with letters A–M in Figure 2 and Supplementary Figures S1 and S2.
NodePhylogeny
MPML
PAUPTNTPAUPGarliBeast
A1009999100100
B91839697100
C1009999100100
D100999999100
E100100100100100
F70698783100
G10099100100100
H9487939799
I96909094100
J1009910010099
K55557686100
L8181759298
M86818383100
Publisher’s Note: MDPI stays neutral with regard to jurisdictional claims in published maps and institutional affiliations.

