Abstract
Grass pollen is one of the major causes of allergy. Aerobiological monitoring is a necessary element of the complex of anti-allergic measures, but the similar pollen morphology of Poaceae species makes it challenging to discriminate species in airborne pollen mixes, which impairs the quality of aerobiological monitoring. One of the solutions to this problem is the metabarcoding approach employing DNA barcodes for taxonomical identification of species in a mix by high-throughput sequencing of the pollen DNA. A diverse set of 14 grass species of different genera were selected to create a local reference database of nuclear ITS1, ITS2, 5′-ETS, and plastome trnL-F DNA barcodes. Sequences for the database were Sanger sequenced from live field and herbarium specimens and collected from GenBank. New Poaceae-specific primers for 5′-ETS were designed and tested to obtain a 5′-ETS region less than 600 bp long, suitable for high-throughput sequencing. The DNA extraction method for single-species pollen samples and mixes was optimized to increase the yield for amplification and sequencing of pollen DNA. Barcode sequences were analyzed and compared by the barcoding gap and intra- and interspecific distances. Their capability to correctly identify grass pollen was tested on artificial pollen mixes of various complexity. Metabarcoding analysis of the artificial pollen mixes showed that nuclear DNA barcodes ITS1, ITS2, and 5′-ETS proved to be more efficient than the plastome barcode in both amplification from pollen DNA and identification of grass species. Although the metabarcoding results were qualitatively congruent with the actual composition of the pollen mixes in most cases, the quantitative results based on read-counts did not match the actual ratio of pollen grains in the mixes.
1. Introduction
Grass pollen is one of the major causes of allergy, affecting 10–30% of the population around the globe [1,2]. There are over 400 species of grass in Europe, and their pollen is recognized as the leading cause of pollinosis [3]. About 100 species of grass could be found in the European part of Russia [4], flowering periods of which often overlap, and their pollen allergenicity is estimated to be from moderate to very high [5]. Aerobiological monitoring is a necessary element of the complex of anti-allergic measures allowing for tracking and predicting the dynamics of the concentration of major allergens in the air and adjusting the therapy and lifestyle of patients with pollinosis. The standard method of pollen identification in the air samples is light microscopy. However, one of the major disadvantages of pollen light microscopy analysis is that similar pollen morphology of Poaceae species makes it challenging to discriminate species in airborne pollen mixes, which impairs the quality of aerobiological monitoring [6,7]. DNA metabarcoding is an alternative approach that has been actively developing recently, allowing qualitative (to the level of species or genus for some taxa) and quantitative (to some extent) composition analysis of complex biological mixes. It employs high-throughput sequencing (HTS) and comparative analysis of specific DNA sequences called “DNA barcodes” to discriminate species present in the mix. DNA barcoding has been widely used in various areas of botanical research; for example, the phylogeny of wild cherry [8], archaeobotany of grapevine [9], authentication and identification of medicinal [10] and poisonous [11] plants, and plant species composition of honey [12,13].
Choosing the correct DNA barcode for the target taxa is one of the main problems of plant barcoding [14,15]. The resolution capacity of each of the primary chloroplast markers (first a combination of matK and rbcL recommended by the CBOL group [16] and later the nuclear ribosomal internal transcribed spacer (ITS) regions and several intergenic spacers) vary significantly between different taxa (for a review, see [17]). Many studies focused on the DNA barcoding of plants; note, that the identification at the high-rank taxa (order, family) is successful in more than 90% of cases, while insufficient data on reference DNA barcode sequences prevents determination to the level of genus or species [13,18]. Therefore, the right choice of DNA barcode and the primers to amplify them is the key to successful species identification.
The regions of the chloroplast genome rbcL, matK, trnL, trnH-psbA, and nuclear ITS2 are most often used as plant DNA barcodes. Some of these barcodes have been used with varying success for metabarcoding pollen (airborne or from food products such as honey). However, only rbcL, matK, ITS2, and trnL barcodes have been studied compared to the palynological analysis for assessing qualitative and quantitative consistency [19]. In particular, a comprehensive study of ITS2 and rbcL has shown their usability in metabarcoding of pollen for the construction of pollinator networks and qualitative analysis of pollen mixes. Though, the quantitative relativity of the metabarcoding results and real pollen abundance of mixture components has been low [20,21]. Another study has assessed trnL and ITS1 for quantitative pollen analysis using metabarcoding and concluded that trnL demonstrates the best sequence-to-pollen prediction [22]. Furthermore, comparative studies have shown a good capability of trnL intron and trnL-trnF (trnL-F) intergenic spacers, ITS region, and their combinations to resolve grass species [23,24,25,26]. Indel and SNP patterns of the trnL-F intergenic spacer and ITS region have been employed for infrageneric classification and phylogeny study of Chascolytrum and Festuca genera [27,28].
External transcribed spacer (ETS) is another nuclear DNA barcode closely related to the ITS region in rDNA, but it is less frequently used than ITS. However, ETS is regarded as a promising DNA barcode as the taxon-specific informativity of the ETS sequence has proved to be the highest among nuclear and plastid barcodes in several studies [29,30,31].
Many published studies report the species identification of different grasses using only some of these barcodes and focusing on a particular plant taxon (e.g., [32,33]). In this study, we have compared the plastome trnL-F and nuclear ITS1 and ITS2 barcodes with the 5′-ETS barcode and assessed their capability to identify the pollen of a diverse set of 14 grass species of different genera from the Poaceae family. New Poaceae-specific primers were designed to amplify the 5′-ETS fragment suitable for the HTS sequencing as its length is less than 600 bp for all species in the study (maximum length for Illumina paired-end sequencing at present). Additionally, we have optimized the protocol for DNA extraction from pollen grains to obtain high-quality DNA for amplification and sequencing. To identify the pollen composition, we have created a local barcode sequence database for the reference Poaceae species using Sanger sequenced trnL-F, ITS1, ITS2, and 5′-ETS sequences of the live field samples, herbarium specimens, and available GenBank records. All four barcode sequences were tested by their capacity to resolve the composition of the grass pollen mixes using artificial pollen mixes of various complexity.
2. Materials and Methods
2.1. Plant Material
To assess the nuclear (ITS1, ITS2, and 5′-ETS) and plastome (trnL-F) barcodes’ capability to identify grass pollen and create a local reference database of barcode sequences, a broad spectrum of Poaceae species widespread in Central Russia were selected: Alopecurus pratensis L., Arrhenatherum elatius (L.) P.Beauv. ex J.Presl & C.Presl., Briza media L., Bromus inermis (Leyss.) Holub (syn. Bromopsis inermis), Calamagrostis epigeios (L.) Roth, Dactylis glomerata L., Elymus repens (L.) Gould (syn. Elytrigia repens), Festuca pratensis Huds., Lolium perenne L., Phleum pratense L., Poa annua L., Poa pratensis L., Poa supina Schrad., and Poa trivialis L. Additionally, Festuca arundinacea Schreb. and Poa palustris L. were collected for the ETS primers’ design. Fresh leaf material of the morphologically identified grass plants was sampled in the field (Moscow region) and from the Moscow State University Herbarium collection specimens.
Pure single-species pollen for a subset of the selected reference species was manually collected to make artificial pollen mixes: Calamagrostis epigeios, Phleum pratense, Bromus inermis, Festuca pratensis, Elymus repens, Alopecurus pratensis, and Lolium perenne. These species pollinate in abundance and are easy to collect in enough quantities to create pollen mixes of various complexity. Therefore, pollen was collected during summer in the active pollination time of these species. The collected pollen was weighed, and a sample of 10 mg of each species was suspended in 100 µL TE-buffer. From each sample, 2 µL of the suspension was analyzed using light microscopy, and pollen grains were counted to estimate the number of pollen grains for each species. Each sample was diluted in TE buffer to achieve an equal pollen count per mL based on the observed number of pollen grains. Then single-species pollen samples were mixed by volume to create a 100 µL pollen mix that contained pollen from different species in equal abundance (approx. 10,000 pollen grains per mix in total). The species composition of each artificial mix is presented in Table 1.
Table 1.
Pollen artificial mixes’ composition.
2.2. DNA Extraction
DNA from herbarium samples and fresh leaf material was extracted using the sorbent-based DiamondDNA Plant kit (ABT, Barnaul, Russia), according to the manufacturer’s protocol with subsequent additional purification by magnetic silica beads, as described elsewhere [34].
Pollen DNA extraction protocol was optimized using pollen grains of Phleum pratense and Bromus inermis. The pollen sample (10 mg) was suspended in 100 µL TE-buffer and homogenized using a Precellys Bacteria lysing kit CK01 (Bertin Technologies, Montigny-le-Bretonneux, France) and MiniLys homogenizer (Bertin Technologies, Montigny-le-Bretonneux, France) at the maximum speed in two runs of 240 s each. Lysis efficiency was tested using three variants of the lysis buffer: (1) only CTAB-lysis buffer (2% CTAB, 0.1 M Tris-HCl pH 8.0, 1.4 M NaCl, 20 mM EDTA pH 8.0, 1% PVP, 0.2% 2-mercaptoethanol, 0.1 mM DTT); (2) CTAB-lysis buffer with 0.04% SDS; and (3) CTAB-lysis buffer with 0.4% SDS. Additionally, two variants of proteinase K concentration (0.2 mg and 0.4 mg per sample) and lysis incubation time (1 and 2 h) at 65 °C were tested for all variants of lysis buffer. DNA from the homogenized and lysed samples were extracted using 1 v/v chloroform: isoamyl alcohol 24: 1. Then, DNA was precipitated at −20 °C for 1 h with 0.1 v/v of 3 M sodium acetate and 1 v/v of isopropanol.
According to our observations with the light microscope, 10 mg of pollen contains ~150,000 pollen grains. Therefore, to check the minimum amount of pollen grains required to extract enough DNA for further analysis and HTS, the pollen DNA extraction efficiency from different amounts of pollen was also tested: 150,000, 37,500, 9375, 2344, 586, and 150 pollen grains. Test samples were created by 4× serial dilution of the initial 10 mg pollen sample.
DNA extraction from these samples was performed using the best extraction protocol determined at the previous step: CTAB-buffer with 0.04% SDS, 0.2 mg per sample proteinase K, lysis incubation for 2 h at 65 °C. DNA from artificial pollen mixes was also extracted according to the optimized protocol.
The purity of the DNA samples was assessed by the A260/280 and A260/230 ratios on a NanoPhotometer N60-Touch (Implen, Munich, Germany), and the concentration was measured by fluorescence intensity using a Qubit dsDNA HS Assay Kit (Invitrogen, Waltham, MA, USA) and Qubit 3.0 fluorometer (Invitrogen, Waltham, MA, USA).
2.3. PCR and Primer Design
Primers for nuclear DNA barcodes ITS1 and ITS2 were designed to anneal to conservative regions of plant rDNA selectively and not fungi (ITS1-F 5′-GGAAGGAGAAGTCGTAACAAGG-3′, ITS1-R 5′-AGATATCCGTTGCCGAGAGT-3′ [35]; ITS2-F 5′-ATCGAGTYTTTGAACGCAAGTTG-3′, ITS2-R 5′-TCCTCCATGCTCTATTG-3′ not published). Primers for the chloroplast intergenic spacer trnL-F barcode were obtained from [36] (trnL_F 5′-GGTTCAAGTCCCTCTATCCC-3′; trnF_R 5′-ATTTGAACTGGTGACACGAG-3′).
Based on the alignment of all available 3′ ends of the 26S and 5′ ends of the 18S rDNA sequences of Poaceae plants from the GenBank database, two pairs of primers were designed for amplification of the complete rDNA intergenic region (IGS) for subsequent Sanger sequencing of 5′-ETS (26S_end_F 5′-GATCCACTGAGATCCAGCCC-3′; 18S_start_R 5′-CTGGCAGGATCAACCAGGTA-3′). Amplification was carried out on DNA from the leaves of the field plants collected during the vegetation season. In addition, the ETS region sequences of the Poaceae species were also collected from GenBank to create a MAFFT alignment of all ETS fragments available. New Poaceae-specific 5′-ETS primers were designed based on this alignment.
A schematic representation of the primer binding sites is presented in Figure 1.
Figure 1.
Primers’ binding sites scheme. IGS—intergenic spacer; NTS—non-transcribed part of rDNA; TIS—transcription initiation site; TTS—transcription termination site.
The PCR for the Sanger sequencing of DNA from the herbarium specimen and field samples and DNA library indexation PCR for HTS were performed using NEBNext Ultra II Q5 Master Mix (NEB, Ipswich, MA, USA) containing high-fidelity Q5 polymerase. The PCR of barcodes from DNA of artificial pollen mixes was performed using the Encyclo Plus PCR Kit (Evrogen, Moscow, Russia) containing a mix of high-fidelity and high-processivity polymerases.
2.4. Library Preparation and Sequencing
A simplified two-step PCR using primers for DNA barcodes fused with Illumina adaptor sequences was performed for DNA library preparation as described elsewhere [35,37]. Products of the first PCR for each barcode were mixed equimolar (or by volume if product concentration was below detection level) for each sample, indexed in the second PCR, and sequenced on the MiSeq platform with the MiSeq Reagent Kit v3 for 600 cycles (2 × 300 nt paired-end) (Illumina, San Diego, CA, USA).
2.5. Local Barcode Reference Database Construction
A local reference database was created using ITS1, ITS2, trnL-F, and 5′-ETS sequences of the reference Poaceae species from herbarium and field samples Sanger sequenced at the Evrogen company (Moscow, Russia). Sanger-sequenced barcode sequences were trimmed from both ends by the quality and aligned using MAFFT v7.490 (FFT-NS-I algorithm). In addition, sequences of the studied DNA barcodes of the reference species have been retrieved from the GenBank database (if available) and added to the alignment if sequences overlapped and showed similarity by more than 90% with our sequences. Detailed information on the corresponding MSU Herbarium voucher numbers, field samples, and the GenBank accessions can be found in Supplementary Table S1. All barcode sequences were used to construct a local reference BLAST database as described elsewhere [37].
2.6. Data Analysis and Taxonomical Identification
Sanger sequencing results were manually reviewed and processed using CLC Genomics Workbench 8.5 software (Qiagen, Hilden, Germany), and all obtained sequences were submitted to the GenBank database.
Intra- and interspecific distances between the barcode sequences were calculated in MEGA v11.0.9 [38]. The best DNA/Protein models (ML) search function determined the best substitution model for each barcode alignment. The selected best substitution model for the alignment was used to calculate the distances. Analyses were conducted using the Tamura 3-parameter model [39] with a gamma distribution (shape parameter = 0.51), and all positions containing gaps and missing data were eliminated (complete deletion parameter) for the trnL-F barcode; and the Kimura 2-parameter model [40] with a gamma distribution and complete deletion for ITS1, ITS2, and 5′-ETS barcode (gamma distribution shape parameter: 0.77, 0.76, and 1.11, respectively).
Raw sequencing reads were trimmed using the trimmomatic software v.0.38 [41] with the parameters “LEADING: 3 TRAILING: 3 SLIDINGWINDOW: 4: 10 MINLEN: 40”. Taxonomic classification of the reads was carried out using the BLAST-based bioinformatic pipeline described elsewhere [37]. Taxons that demonstrated abundance less than 1% for all barcodes in each sample were discarded from the analysis. Spearman’s rank-order correlation was used to calculate the correlation between the mapped reads’ abundance per species and actual pollen abundance in the artificial pollen mixes.
Analysis results were aggregated and plotted using Python with the Pandas [42], Matplotlib [43], and Seaborn [44] packages.
3. Results
3.1. ETS Primers Design
We aimed to design primers to amplify the 5′-ETS fragment up to 600 bp in length so it could be fully sequenced using second-generation high-throughput sequencing (2 × 300 bp maximum length for the Illumina paired-end sequencing). Agarose gel-electrophoresis of the full ETS amplification products showed 1000–5000 bp length bands for most of the reference species, and a 5′-ETS fragment adjacent to 18S rRNA were Sanger sequenced.
We have aligned the 5′-ETS region of the Sanger-sequenced samples and sequences from the GenBank database to find a region suitable for the Poaceae universal ETS primers. Unfortunately, we have not found a consecutive conservative region with a length sufficient to design one universal primer for all Poaceae species. Therefore, we have chosen the least discontinuous conserved region with a degenerate sequence ETS-allF 5′-GCYDTTGGTYYHGGATG-3′ for the 5′-ETS forward primer, with a reasonable Tm range and desired amplicon size less than 600 bp. According to the alignment of the reference Poaceae species, there are seven unique sequences for the forward primer (Table 2). Therefore, only these seven variants were synthesized and then mixed equimolar as a forward primer (ETS-Fmix) for subsequent PCR of the 5′-ETS barcode, to reduce possible nonspecific amplification.
Table 2.
5′-ETS forward primers.
The PCR test with ETS-Fmix and 18S_start_R primer on DNA from herbarium specimens was successful for all species. Gel electrophoresis analysis showed one product band per species (Supplementary Figure S1) with a 200–300 bp length product for most reference species, except Poa supina, Poa annua, and Bromus inermis. Their PCR product length is ~500 bp for Poa supina and Poa annua and ~450 bp for Bromus inermis. Thus, Poaceae-specific primers have been designed to amplify the 5′-ETS fragment that fits into the desired limit of 600 bp, suitable for high-throughput sequencing on the Illumina platform.
3.2. Pollen DNA Extraction Optimization
The largest quantity of DNA extracted from 10 mg of pollen has been achieved using CTAB lysis buffer containing 0.04% SDS and 0.2 mg per sample of proteinase K. The average concentration of the extracted DNA was 16.57 and 13.62 ng ∗ µL−1 for Poa pratense and Bromus inermis pollen, respectively. The purity of the extracted DNA was in the range of 1.883–2.006 OD 260/230 and 2.095–2.142 OD 260/280 regardless of the extraction protocol. An increase in proteinase K concentration in the lysis buffer led to a lower extracted DNA yield, and an increase in lysis time led to a slight increase in the yield in most cases (Table 3). Thus, we have chosen a protocol with a lysis incubation time of 2 h in the CTAB lysis buffer with 0.04% SDS and 0.2 mg per sample proteinase K for all further extractions.
Table 3.
Pollen DNA extraction lysis-buffer optimization results.
The quantity of DNA extracted from 4 × serial dilutions of pollen suspension steadily decreased along with the pollen count and became undetectable (measured by fluorometric method) starting from a sample with 2350 pollen grains (Table 4). Thus, we have chosen 10,000 pollen grains for artificial pollen mixes creation.
Table 4.
Pollen DNA extraction test results.
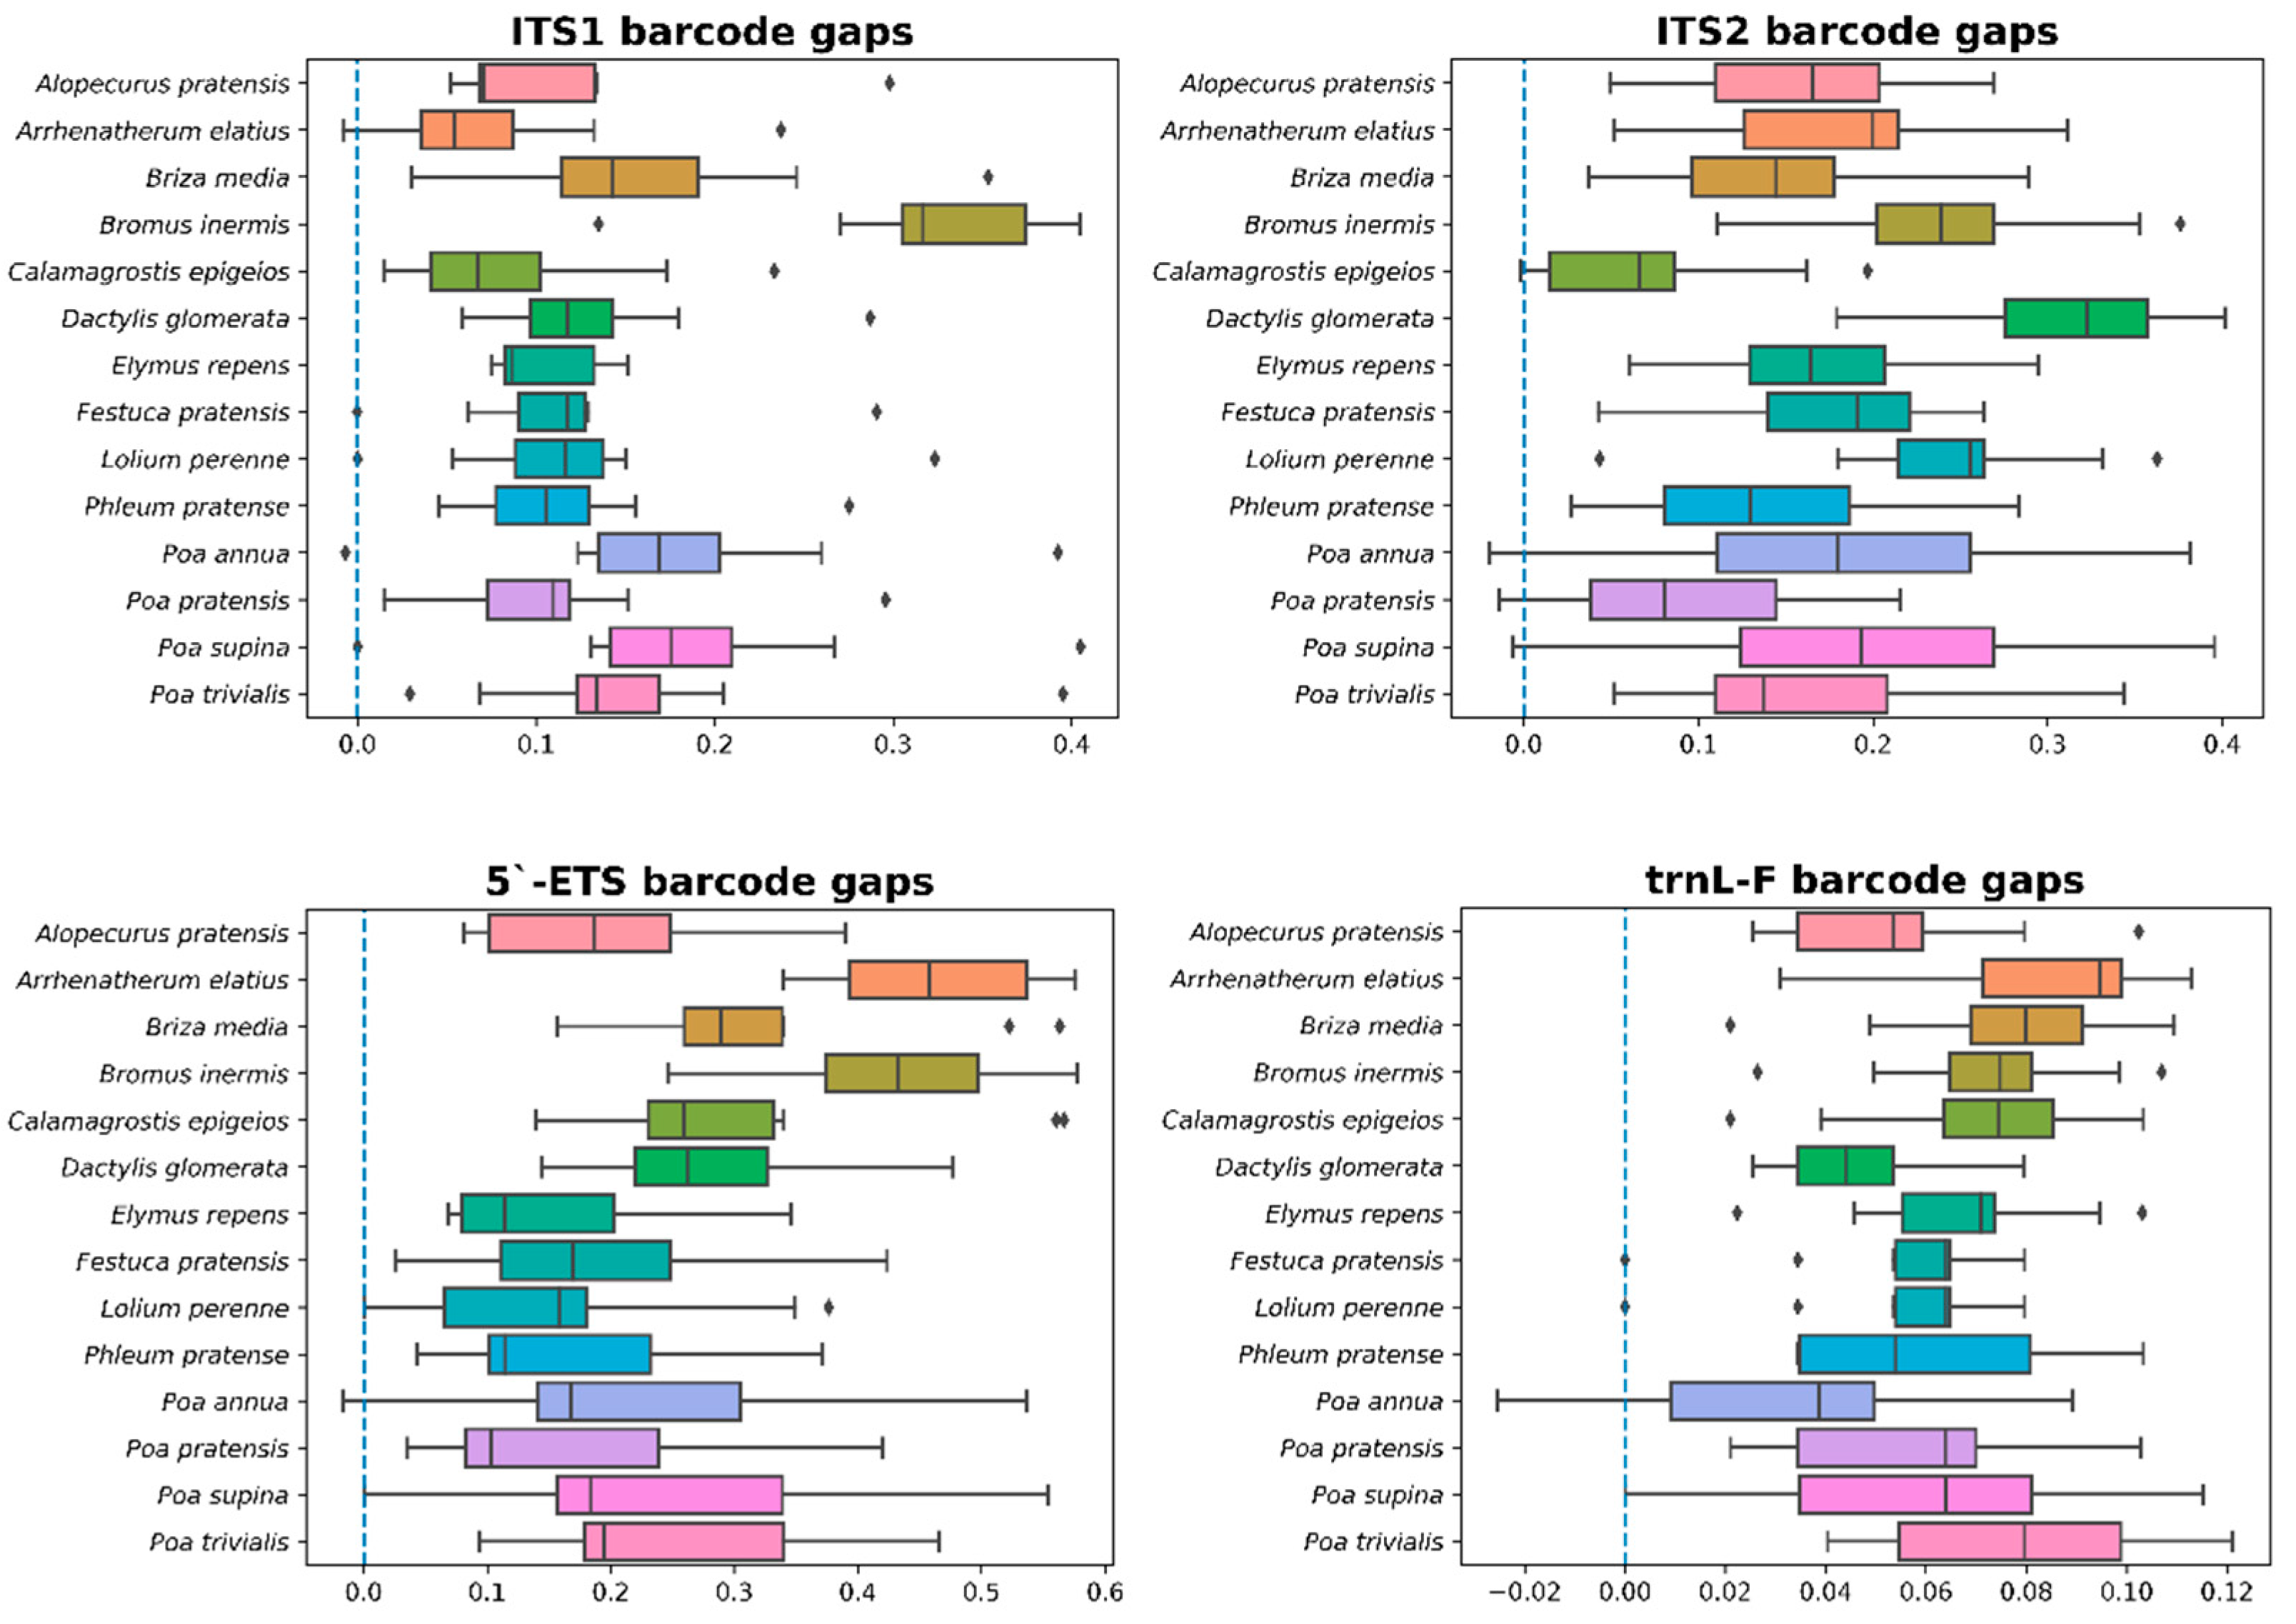
3.3. 5.’-ETS, ITS1, ITS2, and trnL-F Barcodes Comparison
All four barcodes were amplified from DNA of herbarium specimens of 14 reference Poaceae species, Sanger sequenced, and submitted to the GenBank database. The obtained sequences were aligned with the corresponding GenBank sequences of these barcodes and used to construct a local reference database. The length and GC content of the barcode sequences varies slightly within each marker, except for the length of 5′-ETS: 307–363 bp, GC content 29–33% for trnL-F; 175–509 bp, GC content 50–59% for 5′-ETS; 190–204 bp, GC content 55–67% for ITS1; 193–207 bp, GC content 59–68% for ITS2. Evaluation of intra- and interspecific variability showed that while all barcodes have low intraspecific distances, the 5′-ETS barcode has the highest interspecific distance closely followed by ITS2 (Table 5). Plastome barcode trnL-F showed the lowest intra- and interspecific distances compared to the nuclear barcodes.
Table 5.
Intra- and interspecific distance statistics.
However, the difference between the barcode sequences is low for the species of the same genus (Poa in this study). For example, all barcodes of Poa annua and Poa supina have identical sequences, which means that these species will be impossible to distinguish. Other possible misidentification sources with barcoding gap less than 1% could be Arrhenatherum elatius vs. Calamagrostis epigeios and Alopecurus pratensis, Lolium perenne vs. Festuca pratensis (barcoding gap equals −0.008, 0.001, and −0.0001, respectively) for the ITS1 barcode; Poa pratensis vs. Phleum pratense (−0.0142), Calamagrostis epigeios vs. Briza media, Poa pratensis, and Phleum pratense (−0.002, 0.007, and 0.008, respectively) for ITS2; Poa annua vs. Poa pratensis, Alopecurus pratensis, and Phleum pratense, Lolium perenne vs. Festuca pratensis (−0.004, 0.009, 0.009 and 0.0000, respectively) for trnL-F. Barcoding gaps for all four barcodes are present in Figure 2. Additionally, barcode intra- and interspecific distances per species are present in Supplementary Figure S2.
Figure 2.
Barcoding gaps for all four DNA barcodes in the study per species.
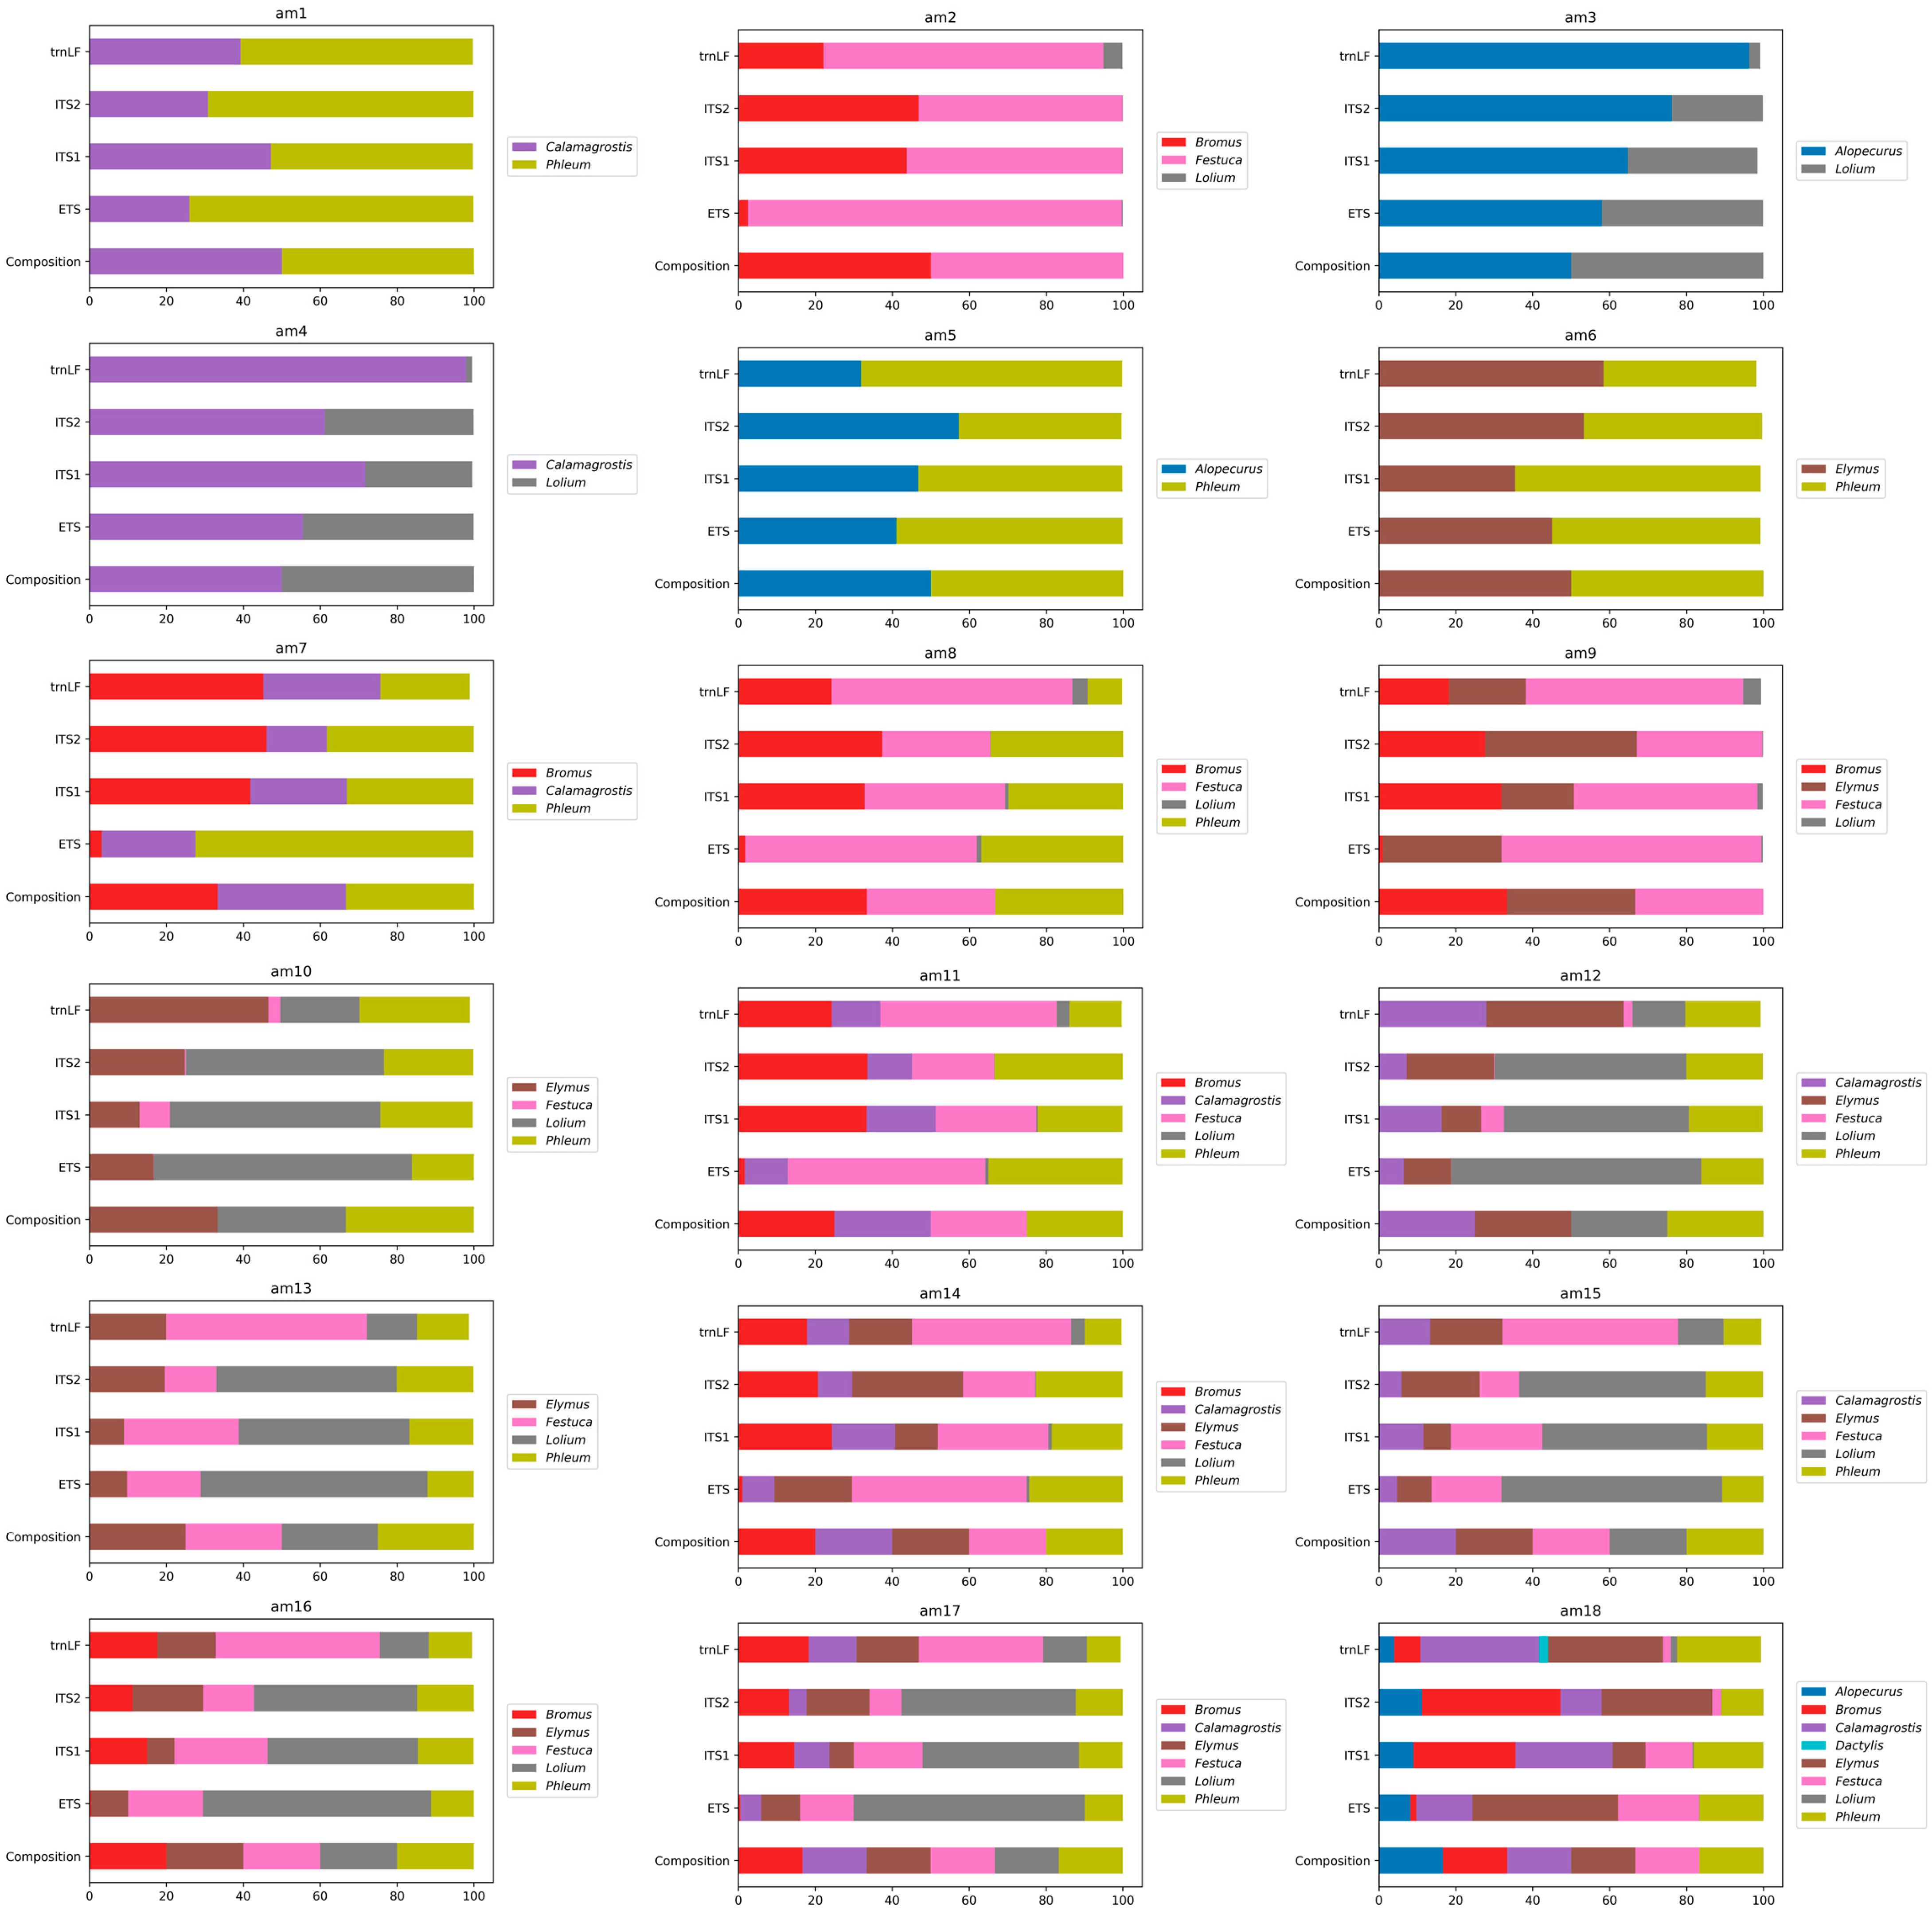
3.4. Metabarcoding Analysis of the Artificial Pollen Mixes
Using the optimized protocol for pollen DNA extraction, we have obtained DNA of 1.2–1.5 ng ∗ µL−1 from artificial pollen mixes (am). The quality of obtained DNA was the same as we have obtained for the Poa pratense and Bromus inermis single-species pollen at the optimization step. Amplification was successful for all barcodes and all samples of artificial pollen mixes, though the amplification efficiency differs significantly between the barcodes and decreases as follows: ITS2 > ITS1 > 5′-ETS > trnL-F (confidence intervals for amplified barcode concentrations are 20.02 ± 4.44, 13.04 ± 3.47, 8.32 ± 1.69, and 0.43 ± 0.07 ng ∗ µL−1, respectively).
The species composition of the artificial pollen mixes determined by HTS analysis is congruent with the actual pollen species content in 10 out of 18 artificial mixes. The most frequent erroneous identification has occurred in mixes containing either Lolium or Festuca pollen. In these mixes, the erroneous presence of Lolium, where only Festuca is present, and vice versa, was detected. However, the abundance of the erroneously identified species is often low (less or close to 1%). This issue is common for all barcodes in the study, especially for the plastome trnL-F barcode (1.7–4.9% Festuca/Lolium errors). Nuclear barcodes show fewer errors of this type, minimal for ITS2, for which abundance of erroneously identified Lolium or Festuca is close to 0 in all cases.
Spearman’s correlation coefficient between HTS determined the abundance and true abundance of each species in the artificial pollen mix decreases as follows: ITS1 > ITS2 > trnL-F > 5′-ETS (0.8, 0.78, 0.63, and 0.59, respectively). For the 5′-ETS barcode, the Bromus inermis abundance in all the mixes is significantly lower than for the other barcodes and actual mix composition (0.41–3.16%). As the complexity of the artificial pollen mix increases, the abundance of the detected 5′-ETS of Bromus inermis decreases. The low representation of the 5′-ETS barcode of Bromus inermis is most likely related to the length of the amplified 5′-ETS fragment (444 bp vs. 220 bp in average for other reference species in the database, except for 509 bp of Poa supina and Poa annua), which could lead to a lower amplification efficiency of the 5′-ETS of Bromus inermis when in the mix with other species.
Overall, the nuclear barcodes proved to be the most effective in the amplification and species classification. The plastome trnL-F barcode has demonstrated a lower amplification efficiency and a higher rate of erroneously identified species than the nuclear barcodes. Though the mix composition could be determined well qualitatively by metabarcoding analysis, quantitative results for each pollen species, determined by read counts, is rarely congruent with the actual abundance of pollen species in the mix. Most of the congruent quantitative results were achieved using ITS1 and ITS2 barcodes (Figure 3).
Figure 3.
Metabarcoding results for the artificial pollen mixes.
4. Discussion
Previously designed primers for ETS amplification for some of the Poaceae genera and species could amplify a fragment of ~500–900 bp [30,45,46], but we aimed to obtain a shorter amplicon for a broad spectrum of Poaceae species of diverse genera that could be sequenced entirely using HTS and is suitable for metabarcoding analysis. Unfortunately, we could not find a region for a universal forward primer for all Poaceae species in the study due to the lack of long consecutive conservative regions. However, we have found a region that allowed us to design 7 primers, an equimolar mix of which proved to be efficient for specific amplification of all species in the study. New Poaceae-specific primers (degenerate 5′-ETS forward and universal 18S reverse) amplify the 5′-ETS fragment less than 600 bp, which is ~300 bp shorter than other published primers could amplify for the same species in this study.
The effectiveness of the protocols for sample preparation for HTS highly depends, among other things, on the quality and quantity of the DNA. Various methods for pollen DNA extraction involve using commercial solutions such as column-based and DNA binding with magnetic beads purification methods after preliminary homogenization of the pollen sample with metal beads [47,48]. We propose a protocol based on a classical CTAB-lysis extraction method [49] with modifications that achieve results similar to commercial kits for pollen DNA extraction. The addition of a small amount of SDS, which helped increase the DNA extraction efficiency from fossil pollen of Abies spp. from Pleistocene peat [42], showed increased extraction efficiency from Poaceae pollen as well. The DNA yield from the samples is associated with the lysis efficiency of the pollen grains. In different plant species, the structure of the shells of the pollen grains can vary greatly. The use of methods of mechanical destruction, such as grinding with metal balls [47] or the use of a bullet blender [24], increases the DNA yield. In this case, the yield becomes comparable with the one we have achieved using tubes with fine sand for grinding pollen.
Festuca and Lolium genera form a phylogenetic complex where Lolium is a subgroup of the Festuca genus according to several phylogenetic studies that employed restriction fragment length polymorphism (RFLP), random amplified polymorphic DNA (RAPD), as well as rDNA (ITS region) and cpDNA sequences data for analysis [50,51]. It was also pointed out that Festuca pratensis is the most closely related to Lolium species in Festuca/Lolium complex, and suggested that the closeness of Festuca pratensis ITS to Lolium ITS sequences could represent a reticulate evolutionary event [50,51]. The closeness of these species is also supported by the fact that Festuca species readily cross with Lolium species in nature or synthetically form Festulolium hybrids (e.g., F. pratensis × L. perenne, or L. multiflorum × F. pratensis) [52]. Furthermore, species of these genera display a high level of sequence similarity for orthologous genes (>91% identity) and conservation of gene family content, as showed by the transcriptome analysis [53]. Several plastome barcodes have been used to untangle the relationships within complex and construct phylogenetic trees [54,55], though nuclear barcode ITS2 showed better results than plastome barcodes [56]. We have found that the 5′-ETS barcode has 6 SNPs, ITS1 has 3 SNPs, and ITS2 has 8 SNPs between Festuca pratensis and Lolium perenne sequences. In contrast, trnL-F 5′-ETS has only 2 short insertions (4 and 5 bp long) and no SNP in Lolium perenne sequences compared to Festuca pratensis. Thus, nuclear barcodes resolve these species better than the trnL-F plastome barcode, and ITS2 shows the least errors in distinguishing these species due to more SNPs than other nuclear barcodes have.
Plant pollen taxon identification using the trnL barcode showed promising results and a pollen-to-read quantitative correlation [22]. However, it was also shown that this barcode could give incorrect taxon predictions, e.g., Lolium/Festuca and Arrenatherum/Poa [24]. In this study, we have assessed the taxon identification capabilities of the adjacent plastome region trnL-F intergenic spacer, but it has also shown a high error rate in resolving Lolium and Festuca species. Moreover, we have observed a low amplification efficiency of this barcode for pollen-extracted DNA. The low efficiency of amplification of the plastome area may be caused by the fact that during the development of the pollen grain, chloroplasts, which can be found in both vegetative and generative cells, are destroyed, and thus cpDNA can be severely damaged [57].
5. Conclusions
ITS1 and ITS2 proved to be the most effective qualitatively and quantitatively, and we recommend using them for Poaceae pollen analysis. Another nuclear barcode, 5′-ETS, showed good qualitative results, but due to variability in fragment length, failed to show good quantitative results. We suggest that 5′-ETS could be successfully used in phylogenetic studies or direct PCR detection of certain species due to the highest genetic distance between species among all barcodes in the study, if not for the metabarcoding of pollen. Plastome trnL-F showed the lowest amplification efficiency, intra- and interspecific distances, and the highest error rate for pollen identification, especially in resolving Lolium and Festuca sequences. In general, we can say that the barcodes used in this study allow efficient amplification and metabarcoding analysis of Poaceae pollen of various genera, and we suggest that nuclear barcodes are better for this task than plastome ones.
Supplementary Materials
The following supporting information can be downloaded at: https://www.mdpi.com/article/10.3390/d14030191/s1, Figure S1: PCR test results with primers ETS-Fmix + 18S_start_R; Figure S2: Barcodes’ intra- and interspecific distances per species; Table S1: Accession numbers and basic characteristics of DNA barcodes used to create local reference database for grass pollen metabarcoding.
Author Contributions
Conceptualization, D.O.O. and A.A.K.; methodology, A.A.K. and A.S.S.; software, A.S.K. and D.O.O.; validation, D.O.O. and A.A.K.; formal analysis, A.S.K. and D.O.O.; investigation, A.A.K., D.O.O., O.V.C., S.V.P. and E.E.S.; resources, A.A.K. and E.E.S.; data curation, A.S.K., A.A.K. and D.O.O.; writing—original draft preparation, D.O.O. and A.A.K.; writing—review and editing, D.O.O., A.A.K. and E.E.S.; visualization, D.O.O.; supervision, E.E.S.; project administration, E.E.S.; funding acquisition, E.E.S. All authors have read and agreed to the published version of the manuscript.
Funding
This research was funded by Russian Foundation for Basic Research, project 19-05-50035.
Institutional Review Board Statement
Not applicable.
Informed Consent Statement
Not applicable.
Data Availability Statement
All the sequenced data are deposited in the public GenBank database. Accession numbers are present in Supplementary Table S1.
Acknowledgments
The authors would like to thank Maria D. Logacheva (Skolkovo Institute of Science and Technology, Moscow, Russia) for valuable advice on the high-throughput sequencing procedures and access to the Illumina MiSeq platform to perform the sequencing for this study. The authors would also like to thank Margarita V. Remizowa and Dmitry D. Sokoloff (Lomonosov Moscow State University, Moscow, Russia) for help with the morphological identification of the collected plants.
Conflicts of Interest
The authors declare no conflict of interest.
References
- García-Mozo, H. Poaceae Pollen as the Leading Aeroallergen Worldwide: A Review. Allergy 2017, 72, 1849–1858. [Google Scholar] [CrossRef] [PubMed]
- Damialis, A.; Traidl-Hoffmann, C.; Treudler, R. Climate Change and Pollen Allergies. In Biodiversity and Health in the Face of Climate Change; Marselle, M.R., Stadler, J., Korn, H., Irvine, K.N., Bonn, A., Eds.; Springer International Publishing: Cham, Switzerland, 2019; pp. 47–66. ISBN 978-3-030-02318-8. [Google Scholar]
- D’Amato, G.; Cecchi, L.; Bonini, S.; Nunes, C.; Annesi-Maesano, I.; Behrendt, H.; Liccardi, G.; Popov, T.; Cauwenberge, P.V. Allergenic Pollen and Pollen Allergy in Europe. Allergy 2007, 62, 976–990. [Google Scholar] [CrossRef]
- Mayevsky, P.F. Flora of the Middle Zone of the European Part of Russia; KMK Scientific Press Ltd.: Moscow, Russia, 2014. [Google Scholar]
- Tree and Plant Allergy Info for Research—Allergen and Botanic Reference Library. Available online: http://www.pollenlibrary.com/ (accessed on 16 March 2020).
- Erdtman, G. Pollen Morphology and Plant Taxonomy: Angiosperms; E.J. Brill: Leiden, The Netherlands, 1986; ISBN 978-90-04-08122-2. [Google Scholar]
- Joly, C.; Barillé, L.; Barreau, M.; Mancheron, A.; Visset, L. Grain and Annulus Diameter as Criteria for Distinguishing Pollen Grains of Cereals from Wild Grasses. Rev. Palaeobot. Palynol. 2007, 146, 221–233. [Google Scholar] [CrossRef]
- Ünsal, S.G.; Çiftçi, Y.Ö.; Eken, B.U.; Velioğlu, E.; Di Marco, G.; Gismondi, A.; Canini, A. Intraspecific Discrimination Study of Wild Cherry Populations from North-Western Turkey by DNA Barcoding Approach. Tree Genet. Genomes 2019, 15, 16. [Google Scholar] [CrossRef]
- Gismondi, A.; Di Marco, G.; Martini, F.; Sarti, L.; Crespan, M.; Martínez-Labarga, C.; Rickards, O.; Canini, A. Grapevine Carpological Remains Revealed the Existence of a Neolithic Domesticated Vitis Vinifera L. Specimen Containing Ancient DNA Partially Preserved in Modern Ecotypes. J. Archaeol. Sci. 2016, 69, 75–84. [Google Scholar] [CrossRef]
- Techen, N.; Parveen, I.; Pan, Z.; Khan, I.A. DNA Barcoding of Medicinal Plant Material for Identification. Curr. Opin. Biotechnol. 2014, 25, 103–110. [Google Scholar] [CrossRef] [PubMed]
- Bruni, I.; De Mattia, F.; Galimberti, A.; Galasso, G.; Banfi, E.; Casiraghi, M.; Labra, M. Identification of Poisonous Plants by DNA Barcoding Approach. Int. J. Leg. Med. 2010, 124, 595–603. [Google Scholar] [CrossRef]
- Bruni, I.; Galimberti, A.; Caridi, L.; Scaccabarozzi, D.; De Mattia, F.; Casiraghi, M.; Labra, M. A DNA Barcoding Approach to Identify Plant Species in Multiflower Honey. Food Chem. 2015, 170, 308–315. [Google Scholar] [CrossRef]
- Prosser, S.W.J.; Hebert, P.D.N. Rapid Identification of the Botanical and Entomological Sources of Honey Using DNA Metabarcoding. Food Chem. 2017, 214, 183–191. [Google Scholar] [CrossRef]
- Taylor, H.R.; Harris, W.E. An Emergent Science on the Brink of Irrelevance: A Review of the Past 8 Years of DNA Barcoding. Mol. Ecol. Resour. 2012, 12, 377–388. [Google Scholar] [CrossRef]
- Coissac, E.; Riaz, T.; Puillandre, N. Bioinformatic Challenges for DNA Metabarcoding of Plants and Animals. Mol. Ecol. 2012, 21, 1834–1847. [Google Scholar] [CrossRef]
- CBOL Plant Working Group A DNA Barcode for Land Plants. Proc. Natl. Acad. Sci. USA 2009, 106, 12794–12797. [CrossRef] [PubMed]
- Shneyer, V.S.; Rodionov, A.V. Plant DNA Barcodes. Biol. Bull Rev. 2019, 9, 295–300. [Google Scholar] [CrossRef]
- Beng, K.C.; Tomlinson, K.W.; Shen, X.H.; Surget-Groba, Y.; Hughes, A.C.; Corlett, R.T.; Slik, J.W.F. The Utility of DNA Metabarcoding for Studying the Response of Arthropod Diversity and Composition to Land-Use Change in the Tropics. Sci. Rep. 2016, 6, 24965. [Google Scholar] [CrossRef] [PubMed]
- Bell, K.L.; de Vere, N.; Keller, A.; Richardson, R.T.; Gous, A.; Burgess, K.S.; Brosi, B.J. Pollen DNA Barcoding: Current Applications and Future Prospects. Genome 2016, 59, 629–640. [Google Scholar] [CrossRef]
- Bell, K.L.; Fowler, J.; Burgess, K.S.; Dobbs, E.K.; Gruenewald, D.; Lawley, B.; Morozumi, C.; Brosi, B.J. Applying Pollen DNA Metabarcoding to the Study of Plant–Pollinator Interactions. Appl. Plant Sci. 2017, 5, 1600124. [Google Scholar] [CrossRef]
- Bell, K.L.; Burgess, K.S.; Botsch, J.C.; Dobbs, E.K.; Read, T.D.; Brosi, B.J. Quantitative and Qualitative Assessment of Pollen DNA Metabarcoding Using Constructed Species Mixtures. Mol. Ecol. 2019, 28, 431–455. [Google Scholar] [CrossRef]
- Baksay, S.; Pornon, A.; Burrus, M.; Mariette, J.; Andalo, C.; Escaravage, N. Experimental Quantification of Pollen with DNA Metabarcoding Using ITS1 and TrnL. Sci. Rep. 2020, 10, 1–9. [Google Scholar] [CrossRef]
- Peterson, P.M.; Romaschenko, K.; Soreng, R.J. A Laboratory Guide for Generating DNA Barcodes in Grasses: A Case Study of Leptochloa s.l. (Poaceae: Chloridoideae). Webbia 2014, 69, 1–12. [Google Scholar] [CrossRef]
- Kraaijeveld, K.; de Weger, L.A.; García, M.V.; Buermans, H.; Frank, J.; Hiemstra, P.S.; Dunnen, J.T. den Efficient and Sensitive Identification and Quantification of Airborne Pollen Using Next-Generation DNA Sequencing. Mol. Ecol. Resour. 2015, 15, 8–16. [Google Scholar] [CrossRef]
- Naciri, Y.; Caetano, S.; Salamin, N. Plant DNA Barcodes and the Influence of Gene Flow. Mol. Ecol. Resour. 2012, 12, 575–580. [Google Scholar] [CrossRef] [PubMed]
- Columbus, J.; Cerros-Tlatilpa, R.; Kinney, M.; Siqueiros-Delgado, M.E.; Bell, H.; Griffith, M.; Refulio-Rodriguez, N. Phylogenetics of Chloridoideae (Gramineae): A Preliminary Study Based on Nuclear Ribosomal Internal Transcribed Spacer and Chloroplast TrnL–F Sequences. Aliso J. Syst. Evol. Bot. 2007, 23, 565–579. [Google Scholar] [CrossRef][Green Version]
- Lloyd, K.; Hunter, A.; Orlovich, D.; Draffin, S.; Stewart, A.; Lee, W. Phylogeny and Biogeography of Endemic Festuca (Poaceae) from New Zealand Based on Nuclear (ITS) and Chloroplast (TrnL–TrnF) Nucleotide Sequences. Aliso J. Syst. Evol. Bot. 2007, 23, 406–419. [Google Scholar] [CrossRef][Green Version]
- Da Silva, L.N.; Essi, L.; Iganci, J.R.V.; Souza-Chies, T.T.D. Advances in the Phylogeny of the South American Cool-Season Grass Genus Chascolytrum (Poaceae, Pooideae): A New Infrageneric Classification. Bot. J. Linn. Soc. 2019, 192, 97–120. [Google Scholar] [CrossRef]
- Wang, A.; Gopurenko, D.; Wu, H.; Lepschi, B. Evaluation of Six Candidate DNA Barcode Loci for Identification of Five Important Invasive Grasses in Eastern Australia. PLoS ONE 2017, 12, e0175338. [Google Scholar] [CrossRef][Green Version]
- Alonso, A.; Bull, R.D.; Acedo, C.; Gillespie, L.J. Design of Plant-Specific PCR Primers for the ETS Region with Enhanced Specificity for Tribe Bromeae and Their Application to Other Grasses (Poaceae). Botany 2014, 92, 693–699. [Google Scholar] [CrossRef]
- Logacheva, M.D.; Valiejo-Roman, C.M.; Degtjareva, G.V.; Stratton, J.M.; Downie, S.R.; Samigullin, T.H.; Pimenov, M.G. A Comparison of NrDNA ITS and ETS Loci for Phylogenetic Inference in the Umbelliferae: An Example from Tribe Tordylieae. Mol. Phylogenetics Evol. 2010, 57, 471–476. [Google Scholar] [CrossRef]
- Cai, Z.-M.; Zhang, Y.-X.; Zhang, L.-N.; Gao, L.-M.; Li, D.-Z. Testing Four Candidate Barcoding Markers in Temperate Woody Bamboos (Poaceae: Bambusoideae). J. Syst. Evol. 2012, 50, 527–539. [Google Scholar] [CrossRef]
- Su, X.; Liu, Y.P.; Chen, Z.; Chen, K.L. Evaluation of Candidate Barcoding Markers in Orinus (Poaceae). Genet. Mol. Res. GMR 2016, 15. [Google Scholar] [CrossRef]
- Krinitsina, A.A.; Sizova, T.V.; Zaika, M.A.; Speranskaya, A.S.; Sukhorukov, A.P. A Rapid and Cost-Effective Method for DNA Extraction from Archival Herbarium Specimens. Biochemistry 2015, 80, 1478–1484. [Google Scholar] [CrossRef]
- Omelchenko, D.O.; Speranskaya, A.S.; Ayginin, A.A.; Khafizov, K.; Krinitsina, A.A.; Fedotova, A.V.; Pozdyshev, D.V.; Shtratnikova, V.Y.; Kupriyanova, E.V.; Shipulin, G.A.; et al. Improved Protocols of ITS1-Based Metabarcoding and Their Application in the Analysis of Plant-Containing Products. Genes 2019, 10, 122. [Google Scholar] [CrossRef] [PubMed]
- Taberlet, P.; Gielly, L.; Pautou, G.; Bouvet, J. Universal Primers for Amplification of Three Non-Coding Regions of Chloroplast DNA. Plant Mol. Biol. 1991, 17, 1105–1109. [Google Scholar] [CrossRef] [PubMed]
- Speranskaya, A.S.; Khafizov, K.; Ayginin, A.A.; Krinitsina, A.A.; Omelchenko, D.O.; Nilova, M.V.; Severova, E.E.; Samokhina, E.N.; Shipulin, G.A.; Logacheva, M.D. Comparative Analysis of Illumina and Ion Torrent High-Throughput Sequencing Platforms for Identification of Plant Components in Herbal Teas. Food Control 2018, 93, 315–324. [Google Scholar] [CrossRef]
- Tamura, K.; Stecher, G.; Kumar, S. MEGA11: Molecular Evolutionary Genetics Analysis Version 11. Mol. Biol. Evol. 2021, 38, 3022–3027. [Google Scholar] [CrossRef] [PubMed]
- Tamura, K. Estimation of the Number of Nucleotide Substitutions When There Are Strong Transition-Transversion and G+C-Content Biases. Mol. Biol. Evol. 1992, 9, 678–687. [Google Scholar] [CrossRef] [PubMed]
- Kimura, M. A Simple Method for Estimating Evolutionary Rates of Base Substitutions through Comparative Studies of Nucleotide Sequences. J. Mol. Evol. 1980, 16, 111–120. [Google Scholar] [CrossRef]
- Bolger, A.M.; Lohse, M.; Usadel, B. Trimmomatic: A Flexible Trimmer for Illumina Sequence Data. Bioinformatics 2014, 30, 2114–2120. [Google Scholar] [CrossRef]
- McKinney, W. Data Structures for Statistical Computing in Python. In Proceedings of the 9th Python in Science Conference, Austin, TX, USA, 28 June–3 July 2010; Volume 445, pp. 56–61. [Google Scholar]
- Hunter, J.D. Matplotlib: A 2D Graphics Environment. Comput. Sci. Eng. 2007, 9, 90–95. [Google Scholar] [CrossRef]
- Waskom, M.L. Seaborn: Statistical Data Visualization. J. Open Source Softw. 2021, 6, 3021. [Google Scholar] [CrossRef]
- Gillespie, L.J.; Soreng, R.J.; Paradis, M.; Bull, R.D. Phylogeny and Reticulation in Subtribe Poinae and Related Subtribes (Poaceae) Based on NrITS, ETS, and TrnTLF Data. Diversity, Phylogeny, and Evolution in the Monocotyledons; Aarhus University Press: Aarhus, Denmark, 2010; p. 29. [Google Scholar]
- Consaul, L.L.; Gillespie, L.J.; Waterway, M.J. Evolution and Polyploid Origins in North American Arctic Puccinellia (Poaceae) Based on Nuclear Ribosomal Spacer and Chloroplast DNA Sequences. Am. J. Bot. 2010, 97, 324–336. [Google Scholar] [CrossRef]
- Leontidou, K.; Vernesi, C.; De Groeve, J.; Cristofolini, F.; Vokou, D.; Cristofori, A. DNA Metabarcoding of Airborne Pollen: New Protocols for Improved Taxonomic Identification of Environmental Samples. Aerobiologia 2018, 34, 63–74. [Google Scholar] [CrossRef]
- Ghitarrini, S.; Pierboni, E.; Rondini, C.; Tedeschini, E.; Tovo, G.R.; Frenguelli, G.; Albertini, E. New Biomolecular Tools for Aerobiological Monitoring: Identification of Major Allergenic Poaceae Species through Fast Real-Time PCR. Ecol. Evol. 2018, 8, 3996–4010. [Google Scholar] [CrossRef] [PubMed]
- Doyle, J.J.; Doyle, J.L. A Rapid DNA Isolation Procedure for Small Quantities of Fresh Leaf Tissue. Phytochem. Bull. 1987, 19, 11–15. [Google Scholar]
- Charmet, G.; Ravel, C.; Balfourier, F. Phylogenetic Analysis in the Festuca-Lolium Complex Using Molecular Markers and ITS RDNA. Theor. Appl. Genet. 1997, 94, 1038–1046. [Google Scholar] [CrossRef]
- Gaut, B.S.; Tredway, L.P.; Kubik, C.; Gaut, R.L.; Meyer, W. Phylogenetic Relationships and Genetic Diversity among Members of TheFestuca-Lolium Complex (Poaceae) Based on ITS Sequence Data. Pl. Syst. Evol. 2000, 224, 33–53. [Google Scholar] [CrossRef]
- Ghesquière, M.; Humphreys, M.W.; Zwierzykowski, Z. Festulolium. In Fodder Crops and Amenity Grasses; Boller, B., Posselt, U.K., Veronesi, F., Eds.; Handbook of Plant Breeding; Springer: New York, NY, USA, 2010; pp. 288–311. ISBN 978-1-4419-0760-8. [Google Scholar]
- Czaban, A.; Sharma, S.; Byrne, S.L.; Spannagl, M.; Mayer, K.F.; Asp, T. Comparative Transcriptome Analysis within the Lolium/Festuca Species Complex Reveals High Sequence Conservation. BMC Genom. 2015, 16, 249. [Google Scholar] [CrossRef]
- Loera-Sánchez, M.; Studer, B.; Kölliker, R. DNA Barcode TrnH-PsbA Is a Promising Candidate for Efficient Identification of Forage Legumes and Grasses. BMC Res. Notes 2020, 13, 35. [Google Scholar] [CrossRef]
- Cheng, Y.; Zhou, K.; Humphreys, M.W.; Harper, J.A.; Ma, X.; Zhang, X.; Yan, H.; Huang, L. Phylogenetic Relationships in the Festuca-Lolium Complex (Loliinae; Poaceae): New Insights from Chloroplast Sequences. Front. Ecol. Evol. 2016, 4, 89. [Google Scholar] [CrossRef]
- Wu, S.; Yin, L.; Deng, Z.; Chen, Q.; Fu, Y.; Xue, H. Using DNA Barcoding to Identify the Genus Lolium. Not. Bot. Horti Agrobot. Cluj-Napoca 2015, 43, 536–541. [Google Scholar] [CrossRef]
- Sodmergen; Suzuki, T.; Kawano, S.; Nakamura, S.; Tano, S.; Kuroiwa, T. Behavior of Organelle Nuclei (Nucleoids) in Generative and Vegetative Cells during Maturation of Pollen InLilium Longiflorum AndPelargonium Zonale. Protoplasma 1992, 168, 73–81. [Google Scholar] [CrossRef]
Publisher’s Note: MDPI stays neutral with regard to jurisdictional claims in published maps and institutional affiliations. |
© 2022 by the authors. Licensee MDPI, Basel, Switzerland. This article is an open access article distributed under the terms and conditions of the Creative Commons Attribution (CC BY) license (https://creativecommons.org/licenses/by/4.0/).