Abstract
In the present work, we analysed time series data on the introduction of new non-indigenous species (NIS) in the Mediterranean between 1970 and 2017, aiming to arrive at recommendations concerning the reference period and provisional threshold values for the NIS trend indicator. We employed regression analysis and breakpoint structural analysis. Our results confirm earlier findings that the reference conditions differ for the four Mediterranean subregions, and support a shortening of the reporting cycle from six to three years, with a two-year time lag for the ensuing assessment. Excluding Lessepsian fishes and parasites, the reference period, defined as the most recent time segment with stable mean new NIS values, was estimated as 1997–2017 for the eastern Mediterranean, 2012–2017 for the central Mediterranean, 2000–2017 for the Adriatic and 1970–2017 for the western Mediterranean. These findings are interpreted primarily on the basis of a basin scale temperature regime shift in the late 1990s, shifts in driving forces such as shellfish culture, and as a result of intensified research efforts and citizen scientist initiatives targeting NIS in the last decade. The threshold values, i.e., the three-year average new NIS values during the reference period, are indicative and will ultimately depend on the choice of species and pathways to be used in the calculations. This is discussed through the prism of target setting in alignment with specific management objectives.
1. Introduction
The role of biological invasions as a pressure that threatens ecosystems is investigated in the framework of numerous policies and strategies worldwide. Recognizing the urgent need to address the impacts of non-indigenous species (NIS) in the marine environment, the European Union has included NIS as a descriptor in the Marine Strategy Framework Directive (MSFD) (D2: Non-indigenous species introduced by human activities are at levels that do not adversely alter the ecosystem) as a means of assessing ecological quality status in order to achieve Good Environmental Status (GES). On the other hand, the Water Framework Directive (WFD), while not explicitly referring to alien NIS at the European Union (EU) level, clearly considers NIS as a pressure on WFD water bodies [1]. In the Mediterranean Sea, besides the MSFD and the WFD, which apply only to EU countries, the issue is included in the Integrated Monitoring and Assessment Programme (IMAP) of the Mediterranean Action Plan at the pan-Mediterranean level (Ecological Objective 2: Trends in abundance, temporal occurrence, and spatial distribution of non-indigenous species).
Within these descriptors, different aspects of species introductions are addressed with different “criteria”, aiming to break down policy implementation into manageable steps. In the latest MSFD update [2], among the criteria/indicators for assessing descriptor D2, criterion D2C1 concerning new NIS introductions states that: “The number of non-indigenous species which are newly introduced via human activity into the wild, per assessment period (6 years), measured from the reference year (2011) as reported for the initial assessment under Article 8(1) of Directive 2008/56/EC, is minimised and where possible reduced to zero.” While this is not, in itself, a quantitative target that allows for a GES assessment, the regulation further asks Member States to establish a threshold value for the number of new introductions of non-indigenous species, through regional or subregional cooperation. Even then, the definition of what Good Environmental Status is in the context of NIS management, as well as a number of methodological issues, are still pending [3].
Despite the continuous progress being made in defining and elaborating the D2C1 indicator that will allow the full incorporation of NIS into GES assessments, the latest reports at both the MSFD and the Mediterranean level acknowledged that significant gaps still remain, in relation to both standardised data collection and making indicators operational [4,5]. A concerted effort to address these gaps and uncertainties is currently under way, focusing primarily on two directions: (a) improving and standardising NIS monitoring; and (b) establishing clear and uniform criteria for the baseline data against which an evaluation of progress will be made [6,7]. The above notwithstanding, one of the biggest challenges in making NIS indicators fit-for-purpose is setting threshold values or targets for GES, and significant work remains to be carried out on this front [8]. The Helsinki Commission (HELCOM) for the Baltic Sea has set the threshold value for D2C1 to zero new NIS in the assessment period, which is six years [9]. The OSPAR Commission for the North-East Atlantic Ocean highlights that the relative change in the number of new NIS introductions seen over subsequent assessment periods (e.g., six years) can facilitate the specification of threshold values; however, OSPAR has not yet concluded on these specific values [3].
At the EU level, Tsiamis et al. [6] suggest that the most suitable approach for setting thresholds and defining GES is the percentage reduction in new NIS for a specific assessment period compared to the average number of new NIS introductions in previous six-year cycles, and that the number of previous cycles should be ideally long, e.g., starting from the 1970s. This, however, will also depend on the historical monitoring efforts in each region/subregion, as well as on pathway pressures. For example, a recent surge in NIS-related research and citizen science (SC) projects has resulted in the first national records in certain Mediterranean countries of many otherwise widespread and well-known marine NIS in the basin [7,10]. At the same time, the evolution and spatial characteristics of the human activities that are typically responsible for marine NIS introductions, such as shipping and aquaculture, will inevitably affect not only the NIS trends, but also our efforts to combat them at distinct spatial scales.
The frequency of the assessments is also under consideration. For consistency and harmonization purposes, it has been recommended that reporting and assessment should be carried out in the same time frame for all EU and non-EU Mediterranean countries, and this should follow the six-year reporting cycles of the MSFD [6]. Nevertheless, this time span is based on administrative considerations and may not necessarily be the most ecologically relevant assessment period [9]. On the other hand, an indicator assessment exercise conducted by an expert panel suggested that a three-year assessment period is likely to be too short, but this was not supported by explicit data analysis [11].
With regards to the Mediterranean Sea, preliminary analysis of the available data between 1970 and 2017 for the purposes of IMAP has demonstrated that there was a significant increase in the rate of new NIS entering all MSFD subregions after 2000, and that this relationship is significantly different between subregions [7]. Consequently, the initial conclusions were that: (i) the threshold values for NIS trend indicators in the Mediterranean need to be set at a subregional level and not at a regional level; and (ii) we need to consider data only after the 2000s in order to establish today’s threshold values. That work, however, stopped short of making any more specific recommendations for identifying reference conditions.
There are three broad approaches to determining reference conditions and setting targets for indicators: (a) against a known reference state, representing pristine or desirable conditions in space or time; (b) using functional relationships between pressures and state to identify tipping points; and (c) trend-based approaches, where time series data are used to provide an internal standard against which future assessments can be made [12,13]. When it comes to indicators intended to measure progress towards a specific policy goal in particular, such as the NIS trend indicator, trend-based approaches provide an appropriate solution, as the achievement of good status does not require meeting a specific endpoint, but is rather based on relative progress [14].
In the present work, we take the work of UNEP/MED [7] one step further and employ a time series approach to re-analyse the available data on temporal trends in Mediterranean NIS at a regional and subregional level, aiming to arrive at recommendations concerning the reference period and provisional threshold values that can be used by Mediterranean countries as they progress towards the operationalisation of the NIS trend indicator.
2. Methods
2.1. Data and Definitions
Distribution data on marine NIS in the Mediterranean Sea were retrieved from the European Environment Agency/Hellenic Centre for Marine Research (EEA/HCMR) offline database stored in the European Alien Species Information Network (EASIN) (https://easin.jrc.ec.europa.eu/easin (accessed on 17 November 2021)), which is continuously updated based on emerging literature regarding new occurrence/records, nomenclatural or taxonomic changes, and updates in the establishment success and alien status of species. For the purposes of this work, we took into account species records detected from 1970 until the end of 2020, and published until November 2021. Notable changes since the last major update on the Mediterranean NIS [15], in addition to new records, include the addition of Foraminifera following Stulpinaite et al. [16], the revision of Isopoda following Castelló et al. [17], the revision of Polychaeta following Langeneck et al. [18] and the revision of Mollusca based on Albano et al. [19]. Furthermore, molluscan records based exclusively on empty shells, as well as species records not in the wild, were excluded.
All data was compiled at the pan-Mediterranean level as well as at the level of MSFD-defined marine subregions [20], i.e., the Western Mediterranean Sea (WMED), the Adriatic Sea (ADRIA), the Ionian Sea and the Central Mediterranean Sea (CMED) and the Aegean-Levantine Sea (EMED), and data analysis was performed on these separate datasets.
Only validated NIS [21] are included in our analyses accompanied by the date (year) of first discovery at the regional/subregional level and the most probable pathway(s) of introduction in regional/subregional waters, according to the Convention on Biological Diversity (CBD) Pathway Classification framework [22]. More than one pathway can be assigned to a species when, for example, there are known separate introduction events via different routes (e.g., for Goniobranchus annulatus: “transport-stowaway” in the Saronikos Gulf, “corridor” in the Levantine Sea [21]). This is also the case with a number of Indo-Pacific species which are commonly assumed to be Lessepsian migrants, freely dispersing through the Suez Canal, but their transportation via shipping is also plausible [23]. The pathway of introduction may differ from one subregion to another (e.g., Lessepsian immigrants in the EMED (pathway = corridor) are assigned to the pathway “unaided” in the CMED, ADRIA and WMED, where they have naturally spread to).
2.2. Assessment Criteria for Trend Analyses towards Defining GES
Assessment criteria for the implementation of NIS trend indicators relate to: (a) broad taxonomic/eco-functional groups; (b) the alien status of the species to be considered when assessing GES (extinct species, cryptogenic species, crypto-expanding, questionable species); and (c) the pathways to be considered (all pathways or excluding unaided expanding species, e.g., Lessepsian immigrants). Extensive consultations with national and regional NIS experts from the whole Mediterranean via workshops and distributed questionnaires (for full details, see [6,7]) have produced a list of recommendations on how to treat different NIS species groups, both when reporting NIS inventories and when determining thresholds against which to assess environmental status. These are summarised in Table 1. The most conflicting species group with regards to the Mediterranean Sea is that of NIS introduced with natural dispersal through the Suez Canal, or Lessepsian migrants. Even though at pan-European level it was agreed to report them but only consider them on a case-by-case basis based on pathway certainty and severity of impacts, most Levantine countries suggested that they be considered for GES assessment, arguing that they are NIS and require management as such. In the current work, we created two datasets: the first one includes all alien species (called “full” dataset for brevity); and the second one excludes the Osteichthyes fish species, for which we have the lowest uncertainty for unaided entry into the study area (true Lessepsian immigrants), which we refer to as the “reduced” dataset. By exception, in the reduced dataset, we included those species listed or proposed for listing under the EU’s Invasive Alien Species Regulation 1143/2014, such as the striped eel catfish Plotosus lineatus (Thunberg, 1787), the pufferfish Lagocephalus sceleratus (Gmelin, 1789) and the lionfish Pterois miles (Bennett, 1828) (candidates for inclusion in the EU’s list of invasive alien species (IAS)). In addition, NIS related to fisheries (proposed to be included in the Data Collection Reference Framework (DCRF) of the General Fisheries Commission for the Mediterranean (GFCM) (UNEP(DEPI)/MED WG.445/3, Annex I), such as the blue-spotted cornetfish (Fistularia commersonii) (Rüppell, 1838), and the rabbitfishes Siganus luridus (Rüppell, 1829) and Siganus rivulatus (Forsskål and Niebuhr, 1775) were included in all analyses.

Table 1.
Recommendations by non-indigenous species (NIS) experts on elements to be included in the trend indicator (adapted from [6,7]).
We also excluded from the reduced dataset unicellular marine algae and parasites carried by Lessepsian fish.
2.3. Data Analysis
All analyses were carried out for both the full and the reduced datasets.
Data from January 1970 to December 2017 (48 years) were grouped in six-year periods, per current MSFD practices, and a linear regression analysis of new NIS introductions with time was performed for each subregion separately. A linear fit was deemed statistically acceptable based on a number of diagnostics (residual errors were normally distributed according to the Anderson–Darling test and independent according to the Durbin–Watson test); however, there was still the indication of a non-linear pattern, both in the data used for the regression and in the residuals’ plots. Subsequently, a linear model with time as a continuous variable and subregion as a factor was applied to all subregions together, in order to compare the regression slopes and intercepts of the four relationships.
2.4. Breakpoint Analysis
We defined the baseline period as the years 1970–2017, in accordance with the most recent guidelines for the implementation of D2C1 [5,7]. We consider as a reference period the most recent segment of this time series, which has stationary statistical properties and, in particular, a stable mean value, following Östman et al. [13].
In order to investigate the occurrence of breakpoints that signify structural changes in the dataset, we employed breakpoint analysis, as implemented in the strucchange R package of Zeileis et al. [24,25]. In this procedure, a time series is randomly split in two or more subsets and the mean levels are compared through a modified F test (“structural change” or sctest [26]). The procedure is repeated iteratively until all significant breakpoints (if any) are identified. The breakpoints function estimates breakpoints by finding the optimal model with m breakpoints and m + 1 segments that minimise the Bayesian Information Criterion (BIC); with the same function, we can extract the associated breakdates with their corresponding 95% confidence intervals (CI).
Breakpoint analysis was performed on the full and reduced datasets for each subregion separately, and for the whole Mediterranean at one-, three- and six-year intervals, aiming to explore which reporting timespan better represents the underlying data structure, as revealed by the yearly datasets. We refer to the different temporal aggregations of the data as the one-year, three-year and six-year datasets. The maximum number of breaks to be tested is determined by the trimming parameter h, defined as the minimal segment size given as a fraction relative to the sample size [23]. Due to the small number of datapoints for the six-year dataset (N = 8), h was set to 0.25 so that one segment will include at least two datapoints. For the one- and three-year datasets, h was set to 0.1.
3. Results
Results are presented for the reduced dataset without Lessepsian Osteichthyes or parasites, unless otherwise stated. On a six-year basis, the number of new NIS introductions between 1970 and 2017 displays an upward trend, which is significant in all Mediterranean subregions, with the exception of the western Mediterranean (p = 0.1) (Figure 1). Interestingly, the regression slope of the WMED when Lessepsian species are included in the analysis (Supplementary Materials, Figure S1) is statistically significant (p = 0.04), even though less steep compared to the other subregions. This different pattern in the introduction of NIS species in the western part of the basin is also apparent in further analyses, as will be shown in the following sections.
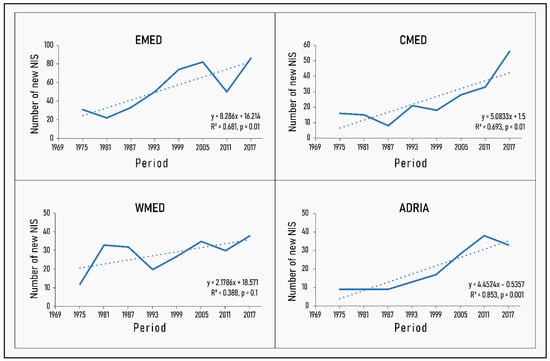
Figure 1.
Trends in non-indigenous species (NIS) introductions per six-year cycle at the Marine Strategy Framework Directive (MSFD) subregion level with fitted linear regression lines superimposed. The R2 and p-values of the linear fit are also given.
The ANOVA of the linear model (Supplementary Materials, Table S1) returned significant p-values, both for the time coefficient (df = 1, F = 44.1, p < 0.001) and the intercepts (df = 3, F = 19.3, p < 0.005), but not for the interaction term (df = 3, F = 2.8, p = 0.06), revealing a significant increase in new NIS with time, and significant differences in the intercept by subregion, but not significant differences in the rate of increase by subregion, which translates into similar slope coefficients. Due to the marginal p-value for the interaction term, pairwise comparisons with Tukey’s test were performed and showed that the WMED in particular has a significantly lower rate of new NIS introductions compared to the EMED (Supplementary Materials, Table S2).
Structural breakpoint analysis produced different breakpoints for each subregion, corresponding to different time segments with stable statistical properties, i.e., mean values (Table 2). The most recent segment is hereby proposed as the reference period to be used for the setting of thresholds and its mean value would be the threshold number.
Table 2.
Results of the breakpoint structural analysis with the reduced dataset: Fsup is the modified F statistic testing the null hypothesis of no breakpoints; * indicates the detection of a statistically significant change (p < 0.05) in the mean values of the time series; ns stands for not significant; and segment yearly means are the fitted mean values of new NIS before and after the breaks (converted from the 3-y and 6-y values by simple division). Dataset reduced.
The results of the analyses performed with the different temporal datasets reveal that the three-year dataset in general reflects quite well the pattern detected in the yearly datasets (Table 2 and Figure S2 in Supplementary Materials). This is particularly true for the EMED, the whole basin and the ADRIA, and is evident both in the year of the breakpoint (breakdate) and in the yearly mean NIS values of the segments. The six-year datasets, because of the small number of data points (N = 8), are less amenable to this type of time series analyses and display a generally coarser pattern, where confidence intervals around the breakpoints are not always possible to compute. Where the breakpoints are calculated, they generally correspond to an earlier point in time, which causes a slight decrease in the corresponding segment means (i.e., threshold values).
At the whole basin level, as well as in the EMED, the results of the analyses were clear and unambiguous, regardless of the time interval. Only one breakpoint was detected, between 1994 and 1996, with the reference period starting in 1997 or, in the case of the six-year dataset, in the 1994–1999 cycle that encompasses this date (Figure 2 and Figure 3). Note also that, due to the overwhelmingly higher number of (new) NIS in the EMED, this is the subregion that largely drives the pattern at the regional level (Figure 2). Indeed, both the breakdate and the temporal trend in introductions in the whole Mediterranean are remarkably similar to that observed in the EMED.
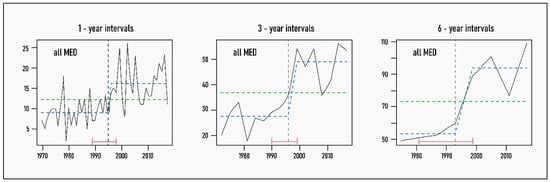
Figure 2.
Trends in new NIS introductions for the reduced dataset at the pan-Mediterranean level by 1-, 3- and 6-year increments (continuous black line) with breakpoints and fitted mean values superimposed: vertical dashed line indicates breakpoint or year of significant change in the mean values of new NIS, with 95% confidence intervals in red brackets; dashed green line shows the null model of no temporal change in new NIS numbers; and dashed blue line represents the fitted mean values before and after the identified breakpoint.
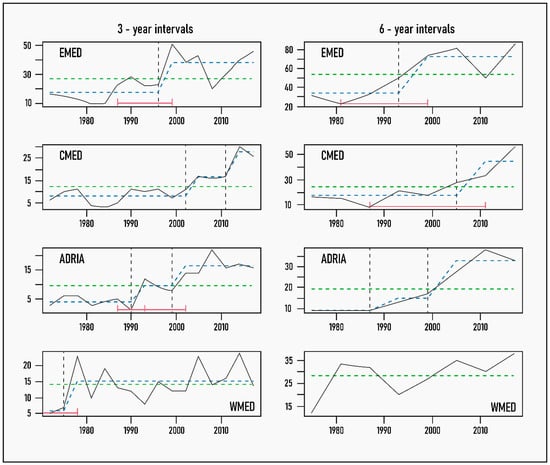
Figure 3.
Trends in new NIS introductions, excluding Lessepsian fishes and parasites, in different Mediterranean subregions by 3- and 6-year increments (continuous black line) with breakpoints and fitted mean values superimposed: vertical dashed line indicates breakpoint or year of significant change in the mean values of new NIS, with 95% confidence intervals (CIs) in red brackets; dashed green line shows the null model of no temporal change in new NIS numbers; and dashed blue line represents fitted mean values before and after the identified breakpoint. The absence of red CI bars indicates that 95% CIs could not be computed as they fell outside the data time interval.
A similar agreement between temporal datasets was displayed in the ADRIA, with only a small shift in the breakdate, accompanied by a slight decline in the threshold value. It is noteworthy that in ADRIA, the analysis detected two breakpoints, one around 1990 and the other a decade later, with the latter one being considered as the beginning of the reference period.
In the WMED, in agreement with the results of the linear regression, breakpoint analysis failed to identify any structural change in the relationship of new NIS introductions with time at three- and six-year intervals. A single break in 1976 was detected with the one-year dataset, but it was marginally significant (Fsup = 10.9, p = 0.02). Thus, we consider that the reference period can extend all the way back to the beginning of the time series (i.e., 1970).
The most inconclusive results were obtained for the CMED, where the three-year dataset produced two breakpoints, the second one as recently as 2011. Even the single breakpoints detected with the one-year and six-year datasets correspond to a shorter reference period for this subregion, starting after 2005 at the earliest. The choice of breakpoint in this case considerably increases the threshold value from 7.5 after 2005 to more than 9 species per year after 2011.
The same set of analyses was repeated with the “full” dataset. Besides the expected increase in threshold values, the comparison revealed that the inclusion of Lessepsian fishes and parasites only affects the determination of the breakpoint in the WMED (Figure 4). In the other three subregions, the temporal evolution of new NIS introductions follows a similar pattern, whether we include the Lessepsians or not. In the WMED, however, taking them into account causes a shift in the structure of the data, evident as a breakpoint after 2002. The three-year average number of new NIS in the 2003–2017 period increases by 60% compared to the 1970–2017 mean due to the arrival of the Lessepsian fishes in this subregion.
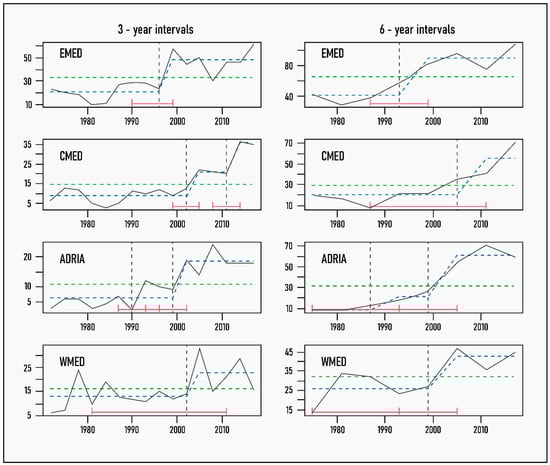
Figure 4.
Trends in new NIS introductions, including Lessepsian fishes and parasites, in different Mediterranean subregions by 3- and 6-year increments (continuous black line) with breakpoints and fitted mean values superimposed: vertical dashed line indicates breakpoint or year of significant change in the mean values of new NIS, with 95% confidence intervals in red brackets; dashed green line shows the null model of no temporal change in new NIS numbers; and dashed blue line represents fitted mean values before and after the identified breakpoint. The absence of red CI bars indicates that 95% CIs could not be computed as they fell outside the data time interval.
The 95% confidence intervals for the subregional thresholds (as three-year segment means) offer the opportunity for some coarse ground truthing against the actual new NIS numbers of the last two three-year periods (Table 3—results only presented for the three-year dataset). While the 2015–2017 period was included in the calculations, introducing a degree of semi-circular reasoning to this comparison, it is only one out of at least six data points included in the reference periods in all subregions except CMED, we thus believe there is value in using it in this context. All these considered, there is remarkable agreement between the reference period thresholds and the 2015–2017 new NIS values, particularly for the reduced dataset. The EMED values appear rather elevated, but are still within or close to the 95% confidence intervals of the thresholds. As expected, due to reporting time lags, the 2018–2020 values are considerably lower, even below the lower 95% CI, with the exception of the EMED values, which are within the lower 95% confidence intervals.
Table 3.
Proposed reference periods and their threshold values (3-y segment means) for the 4 Mediterranean subregions based on the 3-year interval dataset. The 95% confidence intervals serve as a simple basis for comparison with actual new NIS numbers for the last 3-year periods (2015–2017 and 2018–2020). nc: not computed.
4. Discussion
Robust and well-designed indicators constitute important tools to facilitate our efforts to summarize and assess the state of the environment [14]. Their continuous development and refinement are crucial for the effective implementation of environmental policies and the delivery of management targets [8]. When it comes to biological invasions, the trend in species introductions on any geographical scale is one of the most intuitive and commonly used metrics to describe and measure the intensity of the phenomenon, both in research and in policy [27], yet the relevant indicators for Europe and the Mediterranean are still not ready to be fully incorporated into GES assessments. In this work, we endeavoured to take the NIS trend indicator one step closer to being operational by developing a simple and practical methodology to determine reference periods and threshold levels.
As suggested by earlier preliminary analyses [6], and as demonstrated in this work, there is no doubt that NIS introduction/discovery/reporting rates are different across the Mediterranean subregions. Indeed, the rate of introduction has been documented to vary greatly among the Mediterranean subregions [28], with highest being in the EMED, and the lowest in the ADRIA. These variations are also evident when looking at NIS rates within MSFD subregions for the same country. Servello et al. [29] demonstrated such variations among Italian subregions (WMED, CMED, ADRIA), Ounifi-Ben Amor et al. [30] showed the same for Tunisia (WMED, CMED), while the ranges in introduction rates among Greek subregions are also noteworthy. The rate of new introductions was significantly higher in the southern Aegean and Levantine Greek waters (EMED), and lower by a factor of 3 in the Ionian (CMED), even though still positive [31]. Consequently, the elaboration of reference conditions should proceed at this geographical scale.
In the Mediterranean Sea, previous studies have shown that the rate of new NIS introductions is far from saturated, but this is largely due to increasing scientific efforts. Indicatively, Zenetos [10] highlighted the fact that increasing introduction rates in 2012–2017 in Spain, France, Italy, Malta, Greece and Cyprus were mostly the result of an NIS study focused on marinas [32]. This research resulted in a large number of first national records of generally widespread alien species at the regional level, primarily associated with vessel-mediated transport. The same trend is even more evident in non-EU countries, where a burst of new NIS has been attributed to recent research projects, such as the BALMAS and GEF Adriatic Projects for Montenegro and Albania [33,34]. Additionally, recent research in Tripoli harbour (Libya) and the contribution of citizen science (CS) [35] has revealed more than 13 new NIS in the last 3 years (2018–2020), some of which, such as gastropods Cerithium scabridum (Philippi, 1848) and Diodora ruppellii (G.B. Sowerby, 1835), are among the older Mediterranean invaders (known since 1883 and 1939, respectively) that had presumably been undetected [36,37].
Recent developments in CS provide an opportunity to improve data flow and knowledge on NIS, while ensuring not only effective and high quality societal engagement with the issue of invasive NIS [38], but also new knowledge on biodiversity issues. Current CS initiatives in the Mediterranean (see UNEP/MED [7] for an overview) have added a wealth of new NIS in Mediterranean countries in the last 10 years, compensating for the lack of field studies in, for example, Egypt [39], Libya [40], Syria [41] and Albania [42]. Therefore, for many Mediterranean countries, 2011 as the baseline year appears to be premature. This has already been acknowledged at the EU level [5,6] and is clearly reflected in our time series analyses, which confirmed 2017 (i.e., the last year of the analysed datasets) as an appropriate baseline year. At the most extreme, in the CMED, 2011 may even fall outside the recommended reference period for setting thresholds, although more solid recommendations for the CMED require further analysis. Furthermore, the length of the reference period (i.e., the number of previous reporting cycles) needs to be adjusted to a more recent time point than the 1970s.
In a global synthesis of aquatic NIS detection trends across large marine ecosystems (LMEs), Bailey et al. [43] revealed a notable increase in new NIS records for the whole Mediterranean after the mid-1990s, similar to that observed in our analysis. They highlighted two major factors contributing to the overall upward trend in NIS introductions globally, with a peak between 1995 and 2015: one possibly related to increased global trade and the associated shipping traffic [44]; and the second, and most important, factor was the increase in dedicated research efforts. While we cannot comment on the former, having not addressed pathway pressures in this work, our results largely corroborate the latter, as already discussed. Nevertheless, our more fine-grained, subregional approach and focused geographical scope allows for more specific hypotheses to be made regarding the drivers behind the observed spatio-temporal patterns in the Mediterranean. The increase in NIS species entering the EMED in the late 1990s has been identified in the past and was linked to an abrupt regime shift in sea surface temperatures (SST) in the region after 1998 [45]. Between 1998 and 2007, the SST in February increased by 0.8 °C; concurrently, there was a rapid increase in salinity in the region, in the wake of an EMT (East Mediterranean Transient) event [46], which presumably favoured the survival and establishment of warm tropical alien species even more [45]. The structural changes in the EMED dataset detected with breakpoint analysis correspond well with this temporal pattern, whether we include Lessepsian fishes and parasites in the analyses or not. It should be noted here, however, that in the reduced datasets, we only excluded the species for which we had a relatively high confidence that the predominant means of introduction and spread is by natural dispersal. Species of warm, tropical affinity which may be transported via other pathways/vectors, such as ballast water or hull fouling, as well as unaided through the Suez Canal, were retained in the reduced datasets and have likely contributed to the observed response to the warming trend. Similarly, the pattern at the pan-Mediterranean level, besides being numerically driven by the higher values in the EMED, reflects to some extent the gradual secondary spread of these species throughout the basin.
The warming trend observed in the EMED was consistent with global trends and those at the pan-Mediterranean level [47], and was also particularly pronounced in the ADRIA between 1982 and 2018, with the highest warming rate between 1994 and 2005 [48]. This timeline corresponds well with the second breakpoint in the ADRIA, in 1999, and lends credence to the onset of the reference period in 2000. On the other hand, the 1990 breakpoint in the ADRIA is hypothesized to have resulted from a peak in shellfish culture activity in the lagoons of the north-western Adriatic Sea between 1990 and 2000 [49], followed by the introduction of alien species as contaminants in shellfish imports [29,50].
The recent breakpoints in the CMED are attributed, to a large extent, to increased research efforts in Tunisia and Libya [29,51], although this needs to be more formally examined. In addition, the development of CS networks such as the “Spot the Jellyfish” citizen science campaign in Malta, launched in June 2010 [52], has rendered many new NIS records in the region. The WMED is the only subregion where the exclusion of Lessepsian fishes and parasites revealed a relatively stable rate of introductions throughout the study period. The region, and in particular its northern part, has long been studied and many macroalgae NIS, accidentally transported with shellfish culture (transport-contaminant pathway) in the 1970s through to at least the 1990s, have been reported along the French coasts [53]. More recently, Tempesti et al. [54] reported many new NIS introduced by recreational boats in the WMED.
With regards to the time span aspect, our results indicate that triennial datasets reflect quite well the underlying structure of the annual data and offer better temporal resolution for analysis compared to the management-imposed six-year reported data. Whether it is a more ecologically relevant time span remains to be examined. The above notwithstanding, when it comes to the new NIS introductions, it is argued that, due to the time lags observed for reporting new NIS, there may be a need for additional available time between the year of D2 reporting and its assessment period [5]. The reporting time lags in the Mediterranean Sea have significantly decreased in the past decade, and have dropped to less than two years after 2017 [55]. Comparison of the 2018–2020 NIS numbers with the estimated thresholds confirms exactly that, with the 2018 values comprising the highest percentage of the three-year total. Thus, in a hypothetical three-year reporting cycle, it is recommended that the 2018–2020 D2 values are assessed in 2022. As another option, the reporting of time lags in an appropriate time frame can be used to calculate a simple correction factor to be applied to the reported values of the most recent years [56].
There are other methodological considerations that may have a profound effect on the outcome of assessments and need to be taken into account in future steps. The first one is the formal inclusion of some measure of confidence in the estimated thresholds that can be equally applied to the assessment period values. Our use of the 95% confidence intervals around the threshold value is a starting point, but more elaborate methods are available [13]. Another important consideration to make the indicator operational is to standardize NIS numbers by monitoring effort [10,57]. As standardized monitoring methods and protocols are gradually developed and implemented, this standardization will be part of the reporting process, and can either be incorporated in the submitted data or used for pre-processing the regional/subregional scale data [58]. Our results already allude to the effects of intensified research efforts in certain subregions and time periods. It would be interesting to formally include a proxy of research effort into this type of analysis (e.g., see [31,59]). Even when explicitly taking the effects of sampling efforts into account, however, the true rate of introduction may not be accurately inferred from the rate of detection [60], which is essentially measured when using data on the date of collection of species [43], and which depends on a number of factors, such as population growth rate and its effect on abundance or ease of recognition [61]. In this case, a modelling approach can be adopted to correct for detection rate vs. introduction rate, such as the one proposed by McGeoch et al. [27], based on the model developed by Solow and Costello [62].
Last, but not least, perhaps the most critical decision to be made is the definition of “Good Environmental Status”; here, we refer to the exact value of the percentage reduction against the threshold level. In this sense, the threshold values that we estimated using our method at the subregional scale are only provisional and indicative of the general trends throughout the baseline period. Further refinement of these values requires careful consideration by a forum of scientists, alongside managers and policy-makers, regarding what constitutes a realistic threshold in the context of specific conservation goals and management objectives [7,63], as qualitative descriptions turn into quantitative targets. Whereas the last update of the MSFD [2] called for a minimization of new NIS introductions, Target 6 of the first draft of the Convention on Biological Diversity (CBD) Post-2020 Global Biodiversity Framework (GBF) stipulates at least a 50% reduction in the rate of new introductions, and the control of invasive alien species (IAS) in order to eliminate or reduce their impacts [64]. Countries are expected to establish national targets/indicators aligned with this framework and progress will be periodically reviewed.
The need to develop methods by which assessment results can be compared with the effectiveness of management measures undertaken to achieve a desirable status has already been identified, specifically for NIS [9], but also for environmental management objectives at large [65]. In this spirit, NIS assessment approaches in the Baltic Sea countries focus on human-mediated introductions via shipping, which is the predominant pathway for NIS arrivals into the region, while the specific objective of the Baltic Sea Action Plan is “No introductions of alien species from ships” [66]. More generally, McGeoch and Jetz [67] propose indicators measuring trends in the spread of NIS by pathway and in the effectiveness of intervention actions, as they ask for a tighter connection between policy targets and the measurement of appropriate parameters that can result in a decision support system delivering actionable guidance towards conservation goals.
It is possible that species introduced via different pathways may need to be examined separately in relation to quantitative measures of pathway pressure (or suitable proxies) and taking into account the onset of management. Thus, it is likely that an even smaller subset of species will be used to define thresholds and the exact value of percentage reduction, e.g., including only species that are amenable to management and, most importantly, prevention measures, where the measurable effects of management can be defined. In an evaluation of the existing NIS indicators, Vicente et al. [68] concluded that the alien species inventory for the Mediterranean Sea has most of the desirable properties to be policy-relevant and scientifically robust. The inventory is undergoing continuous validation [5], and will soon form the baseline dataset for NIS assessments for the purposes of IMAP [69]. It contains all the necessary data allowing it to be disaggregated by taxonomic group, subregion, country, time period or pathway, as needed, in order to deliver policy-relevant information. This is especially true in the context of existing policies, which are heavily focused on pathway and/or sector management, such as the Ballast Water Management Convention [70], Council Regulation (EC) No. 708/2007 concerning the use of alien and locally absent species in aquaculture [71] and even the EU IAS Regulation [72], to some extent.
Our analysis of this dataset has led us to the following conclusions and recommendations. The reference conditions for the NIS trend indicator differ for the four Mediterranean subregions, and appear to be related to a combination of environmental conditions, intensified research efforts and pathway pressures. Dedicated analyses to elucidate the driving variables at different spatial scales will help countries in their decision-making process regarding which management actions to prioritise in relation to marine NIS. Breakpoint analysis at three-year intervals is recommended as a suitable method to determine the length of the reference periods, which seem to be robust to the choice of species for most of the Mediterranean Sea, except for the WMED. A further refinement of threshold values can be achieved with a number of data processing steps, such as standardisation by sampling/research effort and modelling the true rate of introduction from the collection dates. Most importantly, the definition of GES needs to take pathway-specific policy goals into consideration so that progress against management actions can be measured. This requires the collaboration of scientists with managers and policy-makers at the regional and subregional level.
Supplementary Materials
The following supporting information can be downloaded at: https://www.mdpi.com/article/10.3390/d14010057/s1. Figure S1. Trends in NIS introductions per 6-year cycle at MSFD subregions level with fitted linear regression lines superimposed. The R2 and p-values of the linear fit are also given. Full dataset. Table S1. ANOVA table of the linear regression model with subregion as a factor and time as the continuous variable. Reduced dataset. Table S2. Tukey’s HSD post-hoc multiple comparisons for the interaction term. ad = Adriatic, cm = Central Mediterranean, em = Eastern Mediterranean, wm = Western Mediterranean. Estimate = difference between the regression slopes of the different subregions, SE = standard error of the estimate, df = degrees of freedom. Reduced dataset. Figure S2. Trends in new NIS introductions for the Full and Reduced dataset (excluding Lessepsian fishes and parasites), in different Mediterranean subregions by 1- year increments (continuous black line) with break points and fitted mean values superimposed; vertical dashed line: breakpoint or year of significant change in the mean values of new NIS, with 95% confidence intervals in red brackets; dashed green line: null model of no temporal change in new NIS numbers; dashed blue lines: fitted mean values before and after the identified breakpoint. Supplementary_Data.xlsx: Full and reduced datasets used for the different analyses, i.e. the different temporal aggregations of the data in 1-, 3- and 6-year intervals as sums of new NIS per time period.
Author Contributions
A.Z. and M.G. conceived the study. A.Z. provided the data and M.G. conducted data analysis. Both authors contributed to writing and editing the final manuscript. All authors have read and agreed to the published version of the manuscript.
Funding
This research received no external funding.
Institutional Review Board Statement
Not applicable.
Informed Consent Statement
Not applicable.
Data Availability Statement
Data availability for this manuscript is already described in the methods section and the Supplementary Materials.
Acknowledgments
The work stemmed from a study financed by the UNEP/MAP CONTRACT N°11_2020_SPA/RAC IMAP-MAP PROJECT. The authors thank Nicholas Jason Xentidis for preparing the figures.
Conflicts of Interest
The authors declare no conflict of interest.
References
- Boon, P.J.; Clarke, S.A.; Copp, G.H. Alien species and the EU Water Framework Directive: A comparative assessment of European approaches. Biol. Invasions 2020, 22, 1497–1512. [Google Scholar] [CrossRef]
- European Commission (EC). Commission Decision (EU) 2017/848 of 17 May 2017 laying down criteria and methodological standards on good environmental status of marine waters and specifications and standardized methods for monitoring and assessment, and repealing Decision 2010/477/EU. Off. J. Eur. Union 2017, 125, 43–74. [Google Scholar]
- OSPAR CEMP Guidelines Common Indicator: Changes to non-indigenous species communities (NIS3) (OSPAR Agreement 2018-04)1. Available online: https://www.ospar.org/documents?v=38992 (accessed on 28 October 2021).
- UNEP/MAP. Integrated Monitoring and Assessment Programme of the Mediterranean Sea and Coast and Related Assessment Criteria; UN Environment/MAP: Athens, Greece, 2017; Available online: https://wedocs.unep.org/bitstream/handle/20.500.11822/17012/imap_2017_eng.pdf?sequence=5&isAllowed=y (accessed on 28 October 2021).
- Tsiamis, K.; Boschetti, S.; Palialexis, A.; Somma, F.; Cardoso, A.C. Marine Strategy Framework Directive—Review and analysis of EU Member States’ 2018 Reports—Descriptor 2: Non-Indigenous Species; Publications Office of the European Union: Luxembourg, 2021; ISBN 978-92-76-38014-6. [Google Scholar] [CrossRef]
- Tsiamis, K.; Palialexis, A.; Connor, D.; Antoniadis, S.; Bartilotti, C.; Bartolo, G.A.; Berggreen, U.C.; Boschetti, S.; Buschbaum, C.; Canning-Clode, J.; et al. Marine Strategy Framework Directive-Descriptor 2, Non-Indigenous Species, Delivering Solid Recommendations for Setting Threshold Values for Non-Indigenous Species Pressure on European Seas; Publications Office of the European Union: Luxembourg, 2021. [Google Scholar] [CrossRef]
- UNEP/MED WG.500/7. Monitoring and Assessment Scales, Assessment Criteria and Thresholds Values for the IMAP Common Indicator 6 Related to Non-Indigenous Species. In Proceedings of the 2021 CORMON Meeting, Online, 10–11 June 2021. [Google Scholar]
- Teixeira, H.; Berg, T.; Uusitalo, L.; Fürhaupter, K.; Rodriguez, J.G.; Papadopoulou, N.; Moncheva, S.; Churilova, T. A Catalogue of Marine Biodiversity Indicators. Front. Mar. Sci. 2016, 3, 207. [Google Scholar] [CrossRef]
- HELCOM. Trends in Arrival of New Non-Indigenous Species. HELCOM Core Indicator Report. Online. 2018. Available online: https://helcom.fi/wp-content/uploads/2019/08/Trends-in-arrival-of-new-non-indigenous-species-HELCOM-core-indicator-2018.pdf (accessed on 10 December 2021).
- Zenetos, A. Mediterranean Sea: 30 Years of Biological Invasions (1988–2017). In Proceedings of the 1st Mediterranean Symposium on the Non-Indigenous Species, Antalya, Turkey, 18 January 2019; Langar, H., Ouerghi, A., Eds.; SPA/RAC Publisher: Tunis, Tunisia; p. 116. [Google Scholar]
- ICES Advice. Book 1. OSPAR Special Request on Review of the Technical Specification and Application of Common Indicators under D1, D2, D4, and D6. Available online: http://www.ices.dk/sites/pub/Publication%20Reports/Advice/2013/Special%20requests/OSPAR_3-2013.pdf (accessed on 10 October 2021).
- Samhouri, J.F.; Lester, S.E.; Selig, E.R.; Halpern, B.S.; Fogarty, M.J.; Longo, C.; McLeod, K.L. Sea sick? Setting targets to assess ocean health and ecosystem services. Ecosphere 2012, 3, 1–18. [Google Scholar] [CrossRef]
- Östman, Ö.; Bergström, L.; Leonardsson, K.; Gårdmark, A.; Casini, M.; Sjöblom, Y.; Haas, F.; Olsson, J. Analyses of structural changes in ecological time series (ASCETS). Ecol. Indic. 2020, 116, 106469. [Google Scholar] [CrossRef]
- McQuatters-Gollop, A.; Mitchell, I.; Vina-Herbon, C.; Bedford, J.; Addison, P.F.E.; Lynam, C.P.; Geetha, P.N.; Vermeulan, E.A.; Smit, K.; Bayley, D.T.I.; et al. From Science to Evidence—How Biodiversity Indicators Can Be Used for Effective Marine Conservation Policy and Management. Front. Mar. Sci. 2019, 6, 109. [Google Scholar] [CrossRef]
- Zenetos, A.; Çinar, M.E.; Crocetta, F.; Golani, D.; Rosso, A.; Servello, G.; Shenkar, N.; Turon, X.; Verlaque, M. Uncertainties and validation of alien species catalogues: The Mediterranean as an example. Estuar. Coast. Shelf Sci. 2017, 191, 171–187. [Google Scholar] [CrossRef]
- Stulpinaite, R.; Hyams-Kaphzan, O.; Langer, M.R. Alien and cryptogenic Foraminifera in the Mediterranean Sea: A revision of taxa as part of the EU 2020 Marine Strategy Framework Directive. Mediterr. Mar. Sci. 2020, 21, 719–758. [Google Scholar] [CrossRef]
- Castelló, J.; Bitar, G.; Zibrowius, H. Isopoda (Crustacea) from the Levantine Sea with comments on the biogeography of Mediterranean isopods. Mediterr. Mar. Sci. 2020, 21, 308–339. [Google Scholar] [CrossRef]
- Langeneck, J.; Lezzi, M.; Del Pasqua, M.; Musco, L.; Gambi, M.C.; Castelli, A.; Giangrande, A. Non-indigenous polychaetes along the coasts of Italy: A critical review. Mediterr. Mar. Sci. 2020, 21, 238–275. [Google Scholar] [CrossRef]
- Albano, P.G.; Steger, J.; Bakker, P.A.; Bogi, C.; Bošnjak, M.; Guy-Haim, T.; Huseyinoglu, M.F.; LaFollette, P.I.; Lubinevsky, H.; Mulas, M.; et al. Numerous new records of tropical non-indigenous species in the Eastern Mediterranean highlight the challenges of their recognition and identification. ZooKeys 2021, 1010, 1–95. [Google Scholar] [CrossRef] [PubMed]
- Jensen, H.M.; Panagiotidis, P.; Reker, J. Delineation of the MSFD Article 4 Marine Regions and Subregions. Version 1.0; European Environment Agency: Kopenhagen, Denmark, 2017. Available online: https://data.europa.eu/euodp/data/dataset/data_msfd-regions-and-subregions (accessed on 5 September 2021).
- Zenetos, A.; Corsini-Foka, M.; Crocetta, F.; Gerovasileiou, V.; Karachle, P.K.; Simboura, N.; Tsiamis, K.; Pancucci-Papadopoulou, M.A. Deep cleaning of alien species records in the Greek Seas (2018 update). Manag. Biol. Invasion 2018, 9, 209–226. [Google Scholar] [CrossRef]
- Convention on Biological Diversity (CBD) Pathways of Introduction of Invasive Species, Their Prioritization and Management. 2014. Available online: https://www.cbd.int/doc/meetings/sbstta/sbstta-18/official/sbstta-18-09-add1-en.pdf (accessed on 10 September 2021).
- Katsanevakis, S.; Zenetos, A.; Belchior, C.; Cardoso, A.C. Invading European Seas: Assessing pathways of introduction of marine aliens. Ocean Coast. Manag. 2013, 76, 64–74. [Google Scholar] [CrossRef]
- Zeileis, A.; Leisch, F.; Hornik, K.; Kleiber, C. Strucchange: An R package for testing for structural change in linear regression models. J. Stat. Softw. 2002, 7, 1–38. [Google Scholar] [CrossRef]
- Zeileis, A.; Kleiber, C.; Krämer, W.; Hornik, K. Testing and dating of structural changes in practice. Comput. Stat. Data Anal. 2003, 44, 109–123. [Google Scholar] [CrossRef]
- Zeileis, A.; Shah, A.; Patnaik, I. Testing, monitoring, and dating structural changes in exchange rate regimes. Comput. Stat. Data Anal. 2010, 54, 1696–1706. [Google Scholar] [CrossRef]
- McGeoch, M.A.; Arlé, E.; Belmaker, J.; Buba, Y.; Clarke, D.A.; Essl, F.; García-Berthou, E.; Groom, Q.; Henriksen, M.V.; Jetz, W.; et al. Policy-relevant indicators for invasive alien species assessment and reporting. bioRxiv 2021. [Google Scholar] [CrossRef]
- Zenetos, A.; Gofas, S.; Morri, C.; Rosso, A.; Violanti, D.; Garcia-Raso, J.E.; Cinar, M.E.A. Almogi-Labin, A.; Ates, A.S.; Azzurro, E.; et al. Alien species in the Mediterranean Sea by 2012. A contribution to the application of European Union’s Marine Strategy Framework Directive (MSFD) Part 2 Introduction trends and pathways. Mediterr. Mar. Sci. 2012, 13, 328–352. [Google Scholar] [CrossRef]
- Servello, G.; Andaloro, F.; Azzurro, E.; Castriota, L.; Catra, M.; Chiarore, A.; Crocetta, F.; D’Alessandro, M.; Denitto, F.; Froglia, C.; et al. Marine alien species in Italy: A contribution to the implementation of descriptor D2 of the marine strategy framework directive. Mediterr. Mar. Sci. 2019, 20, 1–48. [Google Scholar] [CrossRef]
- Ounifi-Ben Amor, K.; Rifi, M.; Ghanem, R.; Draief, I.; Zaouali, J.; Ben Souissi, J. Update of alien fauna and new records from Tunisian marine waters. Mediterr. Mar. Sci. 2016, 17, 124–143. [Google Scholar] [CrossRef]
- Zenetos, A.; Karachle, P.K.; Corsini-Foka, M.; Gerovasileiou, V.; Simboura, N.; Xentidis, N.J.; Tsiamis, K. Is the trend in new introductions of marine non-indigenous species a reliable criterion for assessing good environmental status? Τhe case study of Greece. Mediterr. Mar. Sci. 2020, 21, 775–793. [Google Scholar] [CrossRef]
- Ulman, A.; Ferrario, J.; Occhipinti-Ambrogi, A.; Arvanitidis, C.; Bandi, A.; Bertolino, M.; Bogi, C.; Chatzigeorgiou, G.; Çiçek, B.A.; Deidun, A.; et al. A massive update of non-indigenous species records in Mediterranean marinas. PeerJ 2017, 5, 1–59. [Google Scholar] [CrossRef]
- Petović, S.; Marković, O.; Đurović, M. Inventory of non-indigenous and cryptogenic marine benthic species of the south-east Adriatic Sea, Montenegro. Acta Zool. Bulg. 2019, 71, 47–52. [Google Scholar]
- Spagnolo, A.; Auriemma, R.; Bacci, T.; Balković, I.; Bertasi, F.; Bolognini, L.; Cabrini, M.; Cilenti, L.; Cuicchi, C.; Cvitković, I.; et al. Non-indigenous macrozoobenthic species on hard substrata of selected harbours in the Adriatic Sea. Mar. Pollut. Bull. 2019, 147, 150–158. [Google Scholar] [CrossRef] [PubMed]
- Mannino, A.M.; Borfecchia, F.; Micheli, C. Tracking Marine Alien Macroalgae in the Mediterranean Sea: The Contribution of Citizen Science and Remote Sensing. J. Mar. Sci. Eng. 2021, 9, 288. [Google Scholar] [CrossRef]
- Rizgalla, J.; Shinn, A.P.; Crocetta, F. New records of alien and cryptogenic marine bryozoan, mollusc, and tunicate species in Libya. BioInvasions Rec. 2019, 8, 590–597. [Google Scholar] [CrossRef]
- Rizgalla, J.; Shinn, A.P.; Crocetta, F. The alien fissurellid Diodora ruppellii (G.B. Sowerby I, 1835): A first record for Libya from Tripoli Harbour. BioInvasions Rec. 2019, 8, 813–817. [Google Scholar] [CrossRef]
- Roy, H.; Groom, Q.; Adriaens, T.; Agnello, G.; Antic, M.; Archambeau, A.; Bacher, S.; Bonn, A.; Brown, P.; Brundu, G. Increasing understanding of alien species through citizen science (Alien-CSI). Res. Ideas Outcomes 2018, 4, e31412. [Google Scholar] [CrossRef]
- Al Mabruk, S.A.; Abdulghani, A.; Nour, O.M.; Adel, M.; Crocetta, F.; Doumpas, N.; Kleitou, P.; Tiralongo, F. The role of social media in compensating for the lack of field studies: Five new fish species for Mediterranean Egypt. J. Fish Biol. 2021, 99, 673–678. [Google Scholar] [CrossRef]
- Nour, O.M.; Al Mabruk, S.A.; Zava, B.; Deidun, A.; Corsini-Foka, M. Records of new and rare alien fish in North African waters: The burrowing goby Trypauchen vagina (Bloch and Schneider, 1801) and the bartail flathead Platycephalus indicus (Linnaeus, 1758) in Egypt and the cobia Rachycentron canadum (Linnaeus, 1766) in Libya. BioInvasions Rec. 2021, 10, 914–923. [Google Scholar] [CrossRef]
- Saad, A.; Sabour, W.; Masri, M. First Record of Abudefduf vaigiensis (Quoy and Gaimard, 1825) (Teleostei: Pomacentridae) in the Syrian Coasts (Eastern Mediterranean). Syrian J. Agric. Res. 2020, 7, 478–485. [Google Scholar]
- Tanduo, V.; Golemaj, A.; Crocetta, F. Citizen-science detects the arrival and establishment of Branchiomma luctuosum (Grube, 1870) (Annelida: Polychaeta: Sabellidae) in Albania. Biodivers. Data J. 2020, 8, e54790. [Google Scholar] [CrossRef] [PubMed]
- Bailey, S.; Brown, L.; Campbell, M.; Canning-Clode, J.; Carlton, J.; Castro, N.; Chainho, P.; Chan, F.T.; Creed, J.C.; Curd, A.; et al. Trends in the detection of aquatic non-indigenous species across global marine, estuarine and freshwater ecosystems: A 50-year perspective. Divers. Distrib. 2020, 26, 1780–1797. [Google Scholar] [CrossRef]
- Sardain, A.; Sardain, E.; Leung, B. Global forecasts of shipping traffic and biological invasions to 2050. Nat. Sustain. 2019, 2, 274–282. [Google Scholar] [CrossRef]
- Raitsos, D.E.; Beaugrand, G.; Georgopoulos, D.; Zenetos, A.; Pancucci-Papadopoulou, A.M.; Theocharis, A.; Papathanassiou, E. Global climate change amplifies the entry of tropical species into the Eastern Mediterranean Sea. Limnol. Oceanogr. 2010, 55, 1478–1484. [Google Scholar] [CrossRef]
- Theocharis, A.; Nittis, K.; Kontoyiannis, H.; Papageorgiou, E.; Balopoulos, E. Climatic changes in the Aegean Sea influence the Eastern Mediterranean thermohaline circulation (1986–1997). Geophys. Res. Lett. 1999, 26, 1617–1620. [Google Scholar] [CrossRef]
- Nykjaer, L. Mediterranean Sea surface warming 1985–2006. Clim. Res. 2019, 39, 11–17. [Google Scholar] [CrossRef]
- Pisano, A.; Marullo, S.; Artale, V.; Falcini, F.; Yang, C.; Leonelli, F.E.; Santoleri, R.; Nardelli, B.B. New evidence of Mediterranean climate change and variability from Sea Surface Temperature observations. Remote Sens. 2020, 12, 132. [Google Scholar] [CrossRef]
- Orel, G.; Boatto, V.; Sfriso, A.; Pellizzato, M. Piano per la Gestione Delle Risorse Alieutiche Delle Lagune Della Provincia di Venezia; Provincia di Venezia: Sannioprint, Benevento, 2000; 102p. [Google Scholar]
- Sfriso, A.; Marchini, A. Updating of non-indigenous macroalgae in the Italian Coasts. New introductions and cryptic species. Biol. Mar. Mediterr. 2014, 21, 60–69. [Google Scholar]
- Shakman, E.A.; Abdalha, A.B.; Talha, F.; Al-Faturi, A.; Bariche, M. First records of seven marine organisms of different origins from Libya (Mediterranean Sea). BioInvasions Rec. 2017, 6, 377–382. [Google Scholar] [CrossRef]
- Deidun, A.; Sciberras, A. Unearthing marine biodiversity through citizen science: The Spot the Jellyfish and the Spot the Alien Fish campaign case studies from the Maltese Islands (Central Mediterranean). Bull. Entomol. Soc. Malta 2017, 9, 86–88. [Google Scholar]
- Boudouresque, C.F.; Klein, J.; Ruitton, S.; Verlaque, M. Biological invasion: The Thau lagoon, a Japanese biological island in the Mediterranean Sea. In Global Change: Mankind-Marine Environment Interactions; Ceccaldi, H.J., Dekeyser, I., Girault, M., Stora, G., Eds.; Springer Publisher: Dordrecht, The Netherlands, 2011; pp. 151–156. [Google Scholar]
- Tempesti, J.; Mangano, M.C.; Langeneck, J.; Lardicci, C.; Maltagliati, F.; Castelli, A. Nonindigenous species in Mediterranean ports: A knowledge baseline. Mar. Environ. Res. 2020, 161, e105056. [Google Scholar] [CrossRef] [PubMed]
- Zenetos, A.; Gratsia, E.; Cardoso, A.; Tsiamis, K. Time lags in reporting of biological invasions: The case of Mediterranean Sea. Mediterr. Mar. Sci. 2019, 20, 469–475. [Google Scholar] [CrossRef]
- Smith, R.M.; Baker, R.H.A.; Collins, D.W.; Korycinska, A.; Malumphy, C.P.; Ostojá-Starzewski, J.C.; Prior, T.; Pye, D.; Reid, S. Recent trends in non-native, invertebrate, plant pest establishments in Great Britain, accounting for time lags in reporting. Agric. For. Entomol. 2018, 20, 496–504. [Google Scholar] [CrossRef]
- OSPAR 2017. Trends in New Records of Non-Indigenous Species Introduced by Human Activities. 2017. Available online: https://oap.ospar.org/en/ospar-assessments/intermediate-assessment-2017/pressures-human-activities/non-indigenous/ (accessed on 20 November 2021).
- Staehr, P.A.; Jakobsen, H.H.; Hansen, J.L.S.; Andersen, P.; Christensen, J.; Göke, C.; Thomsen, M.S.; Stebbing, P.D. Trends in records and contribution of non-indigenous and cryptogenic species to marine communities in Danish waters: Potential indicators for assessing impact. Aquat. Invasions 2020, 15, 217–244. [Google Scholar] [CrossRef]
- Bonnamour, A.; Gippet, J.M.W.; Bertelsmeier, C. Insect and plant invasions follow two waves of globalisation. Ecol. Lett. 2021, 24, 2418–2426. [Google Scholar] [CrossRef]
- Costello, C.J.; Solow, A.R. On the pattern of discovery of introduced species. Proc. Natl. Acad. Sci. USA 2003, 100, 3321–3323. [Google Scholar] [CrossRef]
- Isaac, N.J.B.; Pocock, M.J.O. Bias and information in biological records. Biol. J. Linn. Soc. 2015, 115, 522–531. [Google Scholar] [CrossRef]
- Solow, A.R.; Costello, C.J. Estimating the rate of species introductions from the discovery record. Ecology 2004, 85, 1822–1825. [Google Scholar] [CrossRef][Green Version]
- Addison, P.F.E.; Collins, D.J.; Trebilco, R.; Howe, S.; Bax, N.; Hedge, P.; Jones, G.; Miloslavich, P.; Roelfsema, C.; Sams, M.; et al. A new wave of marine evidence-based management: Emerging challenges and solutions to transform monitoring, evaluating, and reporting. ICES J. Mar. Sci. 2018, 75, 941–952. [Google Scholar] [CrossRef]
- UNEP First Draft of the Post-2020. Biodiversity Framework. In Proceedings of the Open Ended Working Group on the Post-2020 Global Biodiversity Framework, Online, 23 August–3 September 2021; Convention on Biological Diversity: Montreal, QC, Canada, 2021. [Google Scholar]
- Bal, P.; Tulloch, A.; Addison, P.; Mcdonald-Madden, E.; Rhodes, J.R. Selecting indicator species for biodiversity management. Front. Ecol. Environ. 2018, 16, 589–598. [Google Scholar] [CrossRef]
- HELCOM. Baltic Sea Action Plan—2021 Update; Baltic Marine Environment Protection Commission (Helsinki Commission—HELCOM): Helsinki, Finland, 2021. [Google Scholar]
- McGeoch, M.; Jetz, W. Measure and Reduce the Harm Caused by Biological Invasions. One Earth 2019, 1, 171–174. [Google Scholar] [CrossRef]
- Vicente, J.R.S.; Vaz, A.S.; Roige, M.; Winter, M.; Clarke, D.; Lenzner, B.; McGeoch, M.A. Existing indicators do not adequately monitor progress towards meeting invasive alien species targets. EcoEvoRxiv 2021. [Google Scholar] [CrossRef]
- UNEP/MED WG.500/8. Progress in the Development of the Baseline Values for the IMAP Common Indicator 6 Related to Non-Indigenous Species. In Proceedings of the 2021 SPA RAC CORMON Meeting, Tunis, Tunisia, 10–11 June 2021. [Google Scholar]
- International Maritime Organization (IMO). International Convention for the Control and Management of Ships’ Ballast Water and Sediments; International Maritime Organization: London, UK, 2004. [Google Scholar]
- Council Regulation (EC). No 708/2007 of 11 June 2007 concerning use of alien and locally absent species in aquaculture. Off. J. Eur. Union 2007, 168, 1–17. [Google Scholar]
- Regulation (EU). No 1143/2014 of the European Parliament and of the Council of 22 October 2014 on the prevention and management of the introduction and spread of invasive alien species. Off. J. Eur. Union 2014, 317, 35–55. [Google Scholar]
Publisher’s Note: MDPI stays neutral with regard to jurisdictional claims in published maps and institutional affiliations. |
© 2022 by the authors. Licensee MDPI, Basel, Switzerland. This article is an open access article distributed under the terms and conditions of the Creative Commons Attribution (CC BY) license (https://creativecommons.org/licenses/by/4.0/).