Article

Managing Genetic Diversity and Representation in Banksia marginata (Proteaceae) Seed Production Areas Used for Conservation and Restoration

1
Centre for Australian National Biodiversity Research, CSIRO National Research Collections Australia, G.P.O. Box 1700, Canberra, ACT 2601, Australia
2
Australian Tree Seed Centre, CSIRO National Research Collections Australia, G.P.O. Box 1700, Canberra, ACT 2601, Australia
3
Goulburn Broken Catchment Management Authority, P.O. Box 124, Benalla, VIC 3671, Australia
*
Author to whom correspondence should be addressed.
Diversity 2021, 13(2), 39; https://doi.org/10.3390/d13020039
Submission received: 17 December 2020 / Revised: 14 January 2021 / Accepted: 16 January 2021 / Published: 21 January 2021
(This article belongs to the Special Issue Evolutionary Ecology and Conservation of Native Plants)

Abstract

:
Landscape degradation is a major threat to global biodiversity that is being further exacerbated by climate change. Halting or reversing biodiversity decline using seed-based restoration requires tons of seed, most of which is sourced from wild populations. However, in regions where restoration is most urgent, wild seed sources are often fragmented, declining and producing seed with low genetic diversity. Seed production areas (SPAs) can help to reduce the burden of collecting native seed from remnant vegetation, improve genetic diversity in managed seed crops and contribute to species conservation. Banksia marginata (Proteaceae) is a key restoration species in south-eastern Australia but is highly fragmented and declining across much of its range. We evaluated genetic diversity, population genetic structure and relatedness in two B. marginata SPAs and the wild populations from which the SPA germplasm was sourced. We found high levels of relatedness within most remnants and that the population genetic structure was best described by three groups of trees. We suggest that SPAs are likely to be important to meet future native seed demand but that best practice protocols are required to assist land managers design and manage these resources including genetic analyses to guide the selection of germplasm.

Graphical Abstract

1. Introduction

The Intergovernmental Science-Policy Platform on Biodiversity and Ecosystem Services (IPBES) has highlighted that human-mediated land degradation is negatively impacting on some 3.2 B people, pushing the planet towards a sixth mass species extinction and costing more than 10% of annual global growth product in lost biodiversity and ecosystem services [1]. IPBES also indicates that investments to avoid land degradation and restore degraded land are economically sound and essential for reaching many Sustainable Development Goals [1]. Halting and/or reversing ecosystem decline is a global challenge that will, in part, require tons of seed to be collected from native vegetation. However, in regions where significant vegetation loss has occurred native seed for restoration initiatives is likely to be limited [2,3] while there are also concerns about low genetic diversity and high inbreeding in this seed [4]. In addition, climate change effects including reduced rainfall, changes in rainfall seasonality and increased temperature are likely to negatively influence seed crops in the future [5], further limiting restoration activities.
Seed production areas (seed orchards, seed increase; SPAs), i.e., cultivated stands established specifically for native seed production, can help to reduce the burden of seed collection from remnant vegetation, improve genetic diversity in managed seed crops and contribute to species conservation [6]. However, SPAs established for restoration face many challenges including provision of a broad genetic base to ensure that the adaptive capacity of populations and species is maintained [7,8,9] and to reduce potential inbreeding effects [10,11] in seed crops. Another consideration is that many restoration projects involve planting into novel and/or degraded environments [12] with native seed potentially unable to cope with these conditions. To overcome this situation some US land management agencies are genetically improving key restoration species to maximize plant establishment and growth in greatly modified rangeland habitats [13,14]. A further concern is whether SPAs should be producing seed for local or future conditions. A typical approach to SPA design for future conditions is to include selections from populations that currently experience the likely future climate along with local seed sources. This brings some potential for negative outbreeding effects if divergent genomes are brought together [15,16], although outbreeding depression is generally a minor concern in forest tree species. However, the risk of inbreeding depression caused by asynchronous flowering among divergent populations is a significant risk [17] that requires careful management. These issues can be especially pressing for SPAs of long-lived species which may take several years before a seed crop is produced and even longer to determine if negative genetic issues have arisen.
When selecting germplasm to establish SPAs it is important to ensure that the seed crops produced will support proposed restoration activities. For example, seed collected from small and/or fragmented populations are likely to have low genetic diversity and may also be highly inbred [18]. Genetic bottlenecks can also be created during SPA establishment if germination or clone failure skew the SPA population towards germplasm from particular mothers or sites [6,19]. Though bringing inbred germplasm from divergent remnants together creates the opportunity for outcrossing, it is important to understand the levels of relatedness of selections within the SPA to actively manage inbreeding. Despite SPAs regularly producing seed for restoration, remarkedly few of these crops have been evaluated to determine whether these seed are leading to the long-term persistence of restored populations. Studies of SPA seed have determined problems such as low genetic diversity [20], the use of commercial varieties whose genotypes do not exist in local remnant populations [21], unidirectional genotypic selection [22] and extreme bottlenecks [23]. However, other assessments have found no differences in genetic diversity between SPAs and the germplasm used for establishment [6,19]. Another key component is ensuring that the SPAs are producing seed crops that are genetically compatible with the area to be restored. Generalized patterns of genetic diversity and population structure based on life history traits have been determined [24,25,26] where, due to an ability to disperse pollen and seed both spatially and temporally, long-lived, outcrossing, animal- and wind-pollinated trees have less among-population genetic structure than other species [27,28]. An understanding of both genetic diversity and population genetic structure of wild populations can assist in establishing SPAs to meet the expectations of restoration projects but this level of detail is rarely sought, and therefore is rarely available for restoration species.
The deteriorating state of the Australian environment, vegetation fragmentation and climate change have been recently cited as critical issues for the Australian native seed sector [29]. Native seed production across south-eastern Australia is largely environmentally driven, making supply erratic and leading to inappropriate species substitutions to meet the objectives of restoration projects [30]. Consequently, SPAs are likely to be part of the solution to overcome predicted native seed shortages and to reduce further degradation of wild remnants from seed harvesting. This is especially topical following the Australian Black Summer (2019–2020) wildfires that burnt extremely large tracts of vegetation which will be unable to supply seed for restoration for many years. Some forward-thinking land managers have been establishing SPAs in south-eastern Australia since the late 1990s with various levels of success in meeting their seed demands (Martin Driver, pers. comm.). These restoration-based SPAs are primarily producing grass and wildflower seed with far fewer being established with shrubs and trees [29]. This study focused on two Banksia marginata SPAs established in 2001 at Euroa and 2005 at Benalla within the Goulburn-Broken Catchment (Victoria Australia) to produce seed for local restoration projects. Banksia marginata (Proteaceae) is a highly fragmented long-lived woody tree distributed across south-eastern Australia. We investigated genetic diversity and population genetic structure of remnants close to the SPAs including those from which seed were collected to establish the SPAs. We also determined if the selections included in the SPAs were representative of these remnant populations.
To do this we were firstly interested in understanding how much genetic diversity existed in each remnant and its associated SPA trees. We then investigated differences in genetic diversity among the remnants and the two SPAs. We also assessed population genetic structure to determine whether the SPAs were representative of any structure observed. As the source remnant population could not be determined for all SPA trees, we further determined the probable origin of these unidentifiable trees. As a key determinant of SPA success is ensuring that inbreeding is avoided, we also assessed the relatedness of all trees and those in the SPAs to determine the likelihood of mating among close relatives.

2. Materials and Methods

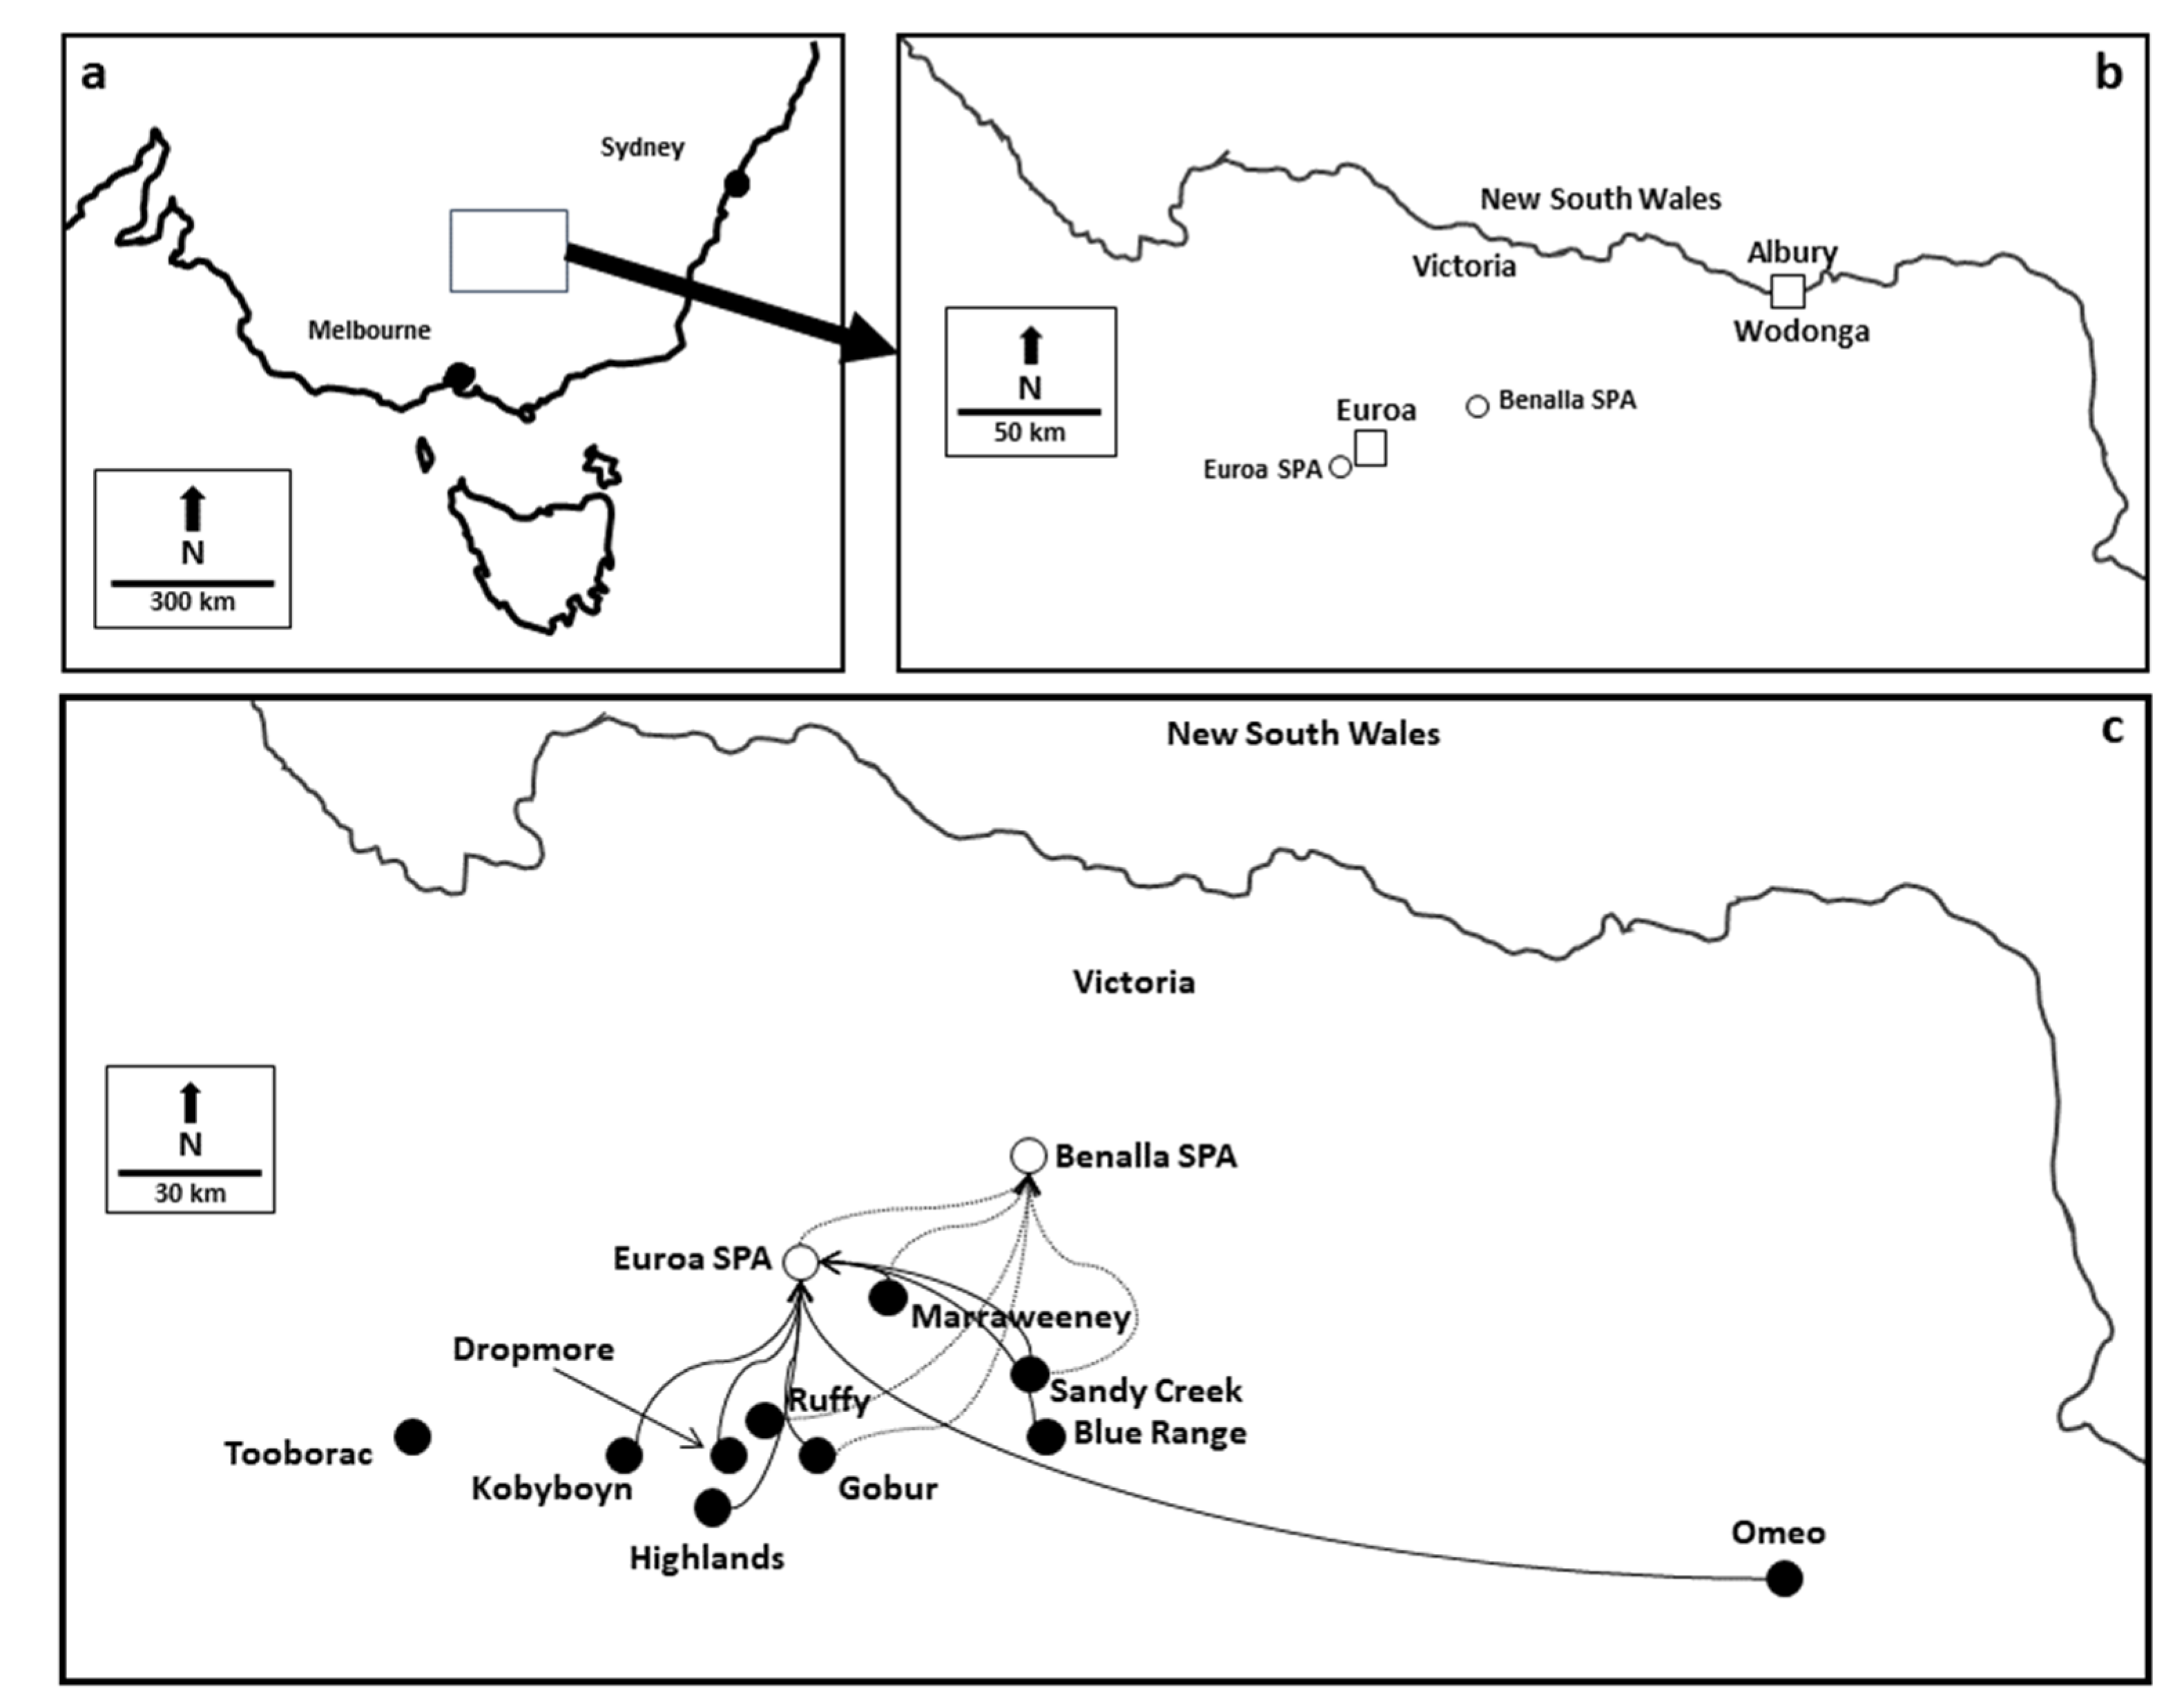
2.1. Species Background, Study Sites and Sampling

Species backgroundBanksia marginata (Proteaceae) is highly variable small shrub (<1 m) to a tall tree (>10 m; [31]) that is broadly distributed across south-eastern Australia from northern New South Wales to Victoria, South Australia and Tasmania [32]. This species occurs across a range of ecological communities (shrubland, woodland forest, swamps and coastal dunes) and a variety of soils (sandy, clay loam, peaty loam, rocky soil, and soils developed on quartz sandstone, limestone and granite) within a 400–1000 mm mean annual rainfall range [33,34]. While B. marginata can self-pollinate, these seed are smaller and less likely to survive [35] suggesting preferential outcrossing and that the species, like most other tree species, is subject to inbreeding depression [36]. Variability in seed mass among individuals, populations and years has been attributed to nutrient availability during seed provisioning [37]. This species can also resprout after fires [38]. B. marginata is important resource for many vertebrates [39,40,41] as well as having invertebrate relationships [42] and fungal associations [43].
Study sites—Seed for the Euroa SPA were collected from wild populations (Figure 1) then germinated, grown and randomly planted at the Euroa Arboretum. Seed for the Benalla SPA were also collected from local wild populations and similar germinated and planted with the addition of 10 cuttings derived from the Ruffy and Marraweeney populations, some of which did not survive planting out (Figure 1). Leaf material was collected from all trees in the Euroa (36.768838° S, 145.548482° E) and Benalla (36.747551° S, 145.743524° E) SPAs as well as the remnants that had been used as seed sources for these SPAs (Figure 1). The material was individually dried on silica gel and transported to CSIRO Black Mountain Science and Innovation Park in Canberra for analyses. Trees at Euroa were originally planted with identification tags but over time some of these tags were lost leaving a small proportion of trees that could not be ascribed to their original remnant populations. In contrast, remnant sources were known for the Benalla SPA but none of the trees could be individually attributed to these remnants. Consequently, all SPA trees whose source populations could not be identified were pooled into a single ‘Unknown’ group.

2.2. DNA Extraction and Genotyping

Each leaf was subsampled and genomic DNA extracted [44]. A subset of 16 samples from several of the remnants were used to test 30 microsatellite (SSR) primer pairs developed for other Banksia species [45,46,47,48,49,50] (Supplementary Table S1). Ten of these primer pairs either amplified poorly or failed to amplify and were eliminated. A further eight primer pairs amplified well but exhibited little to no polymorphism across the 16 samples and were also eliminated. The remaining twelve primer pairs were amplified across all samples but a review of the data generated revealed poor amplification of some loci in a small number of populations leaving eight primer pairs for analysis (BO22, Br3 and Br13 [45], Bint02, Bint07, Bint05 and Bint24 [47] and BH-B8 [46]). PCR (5μL) comprising of 1 X PCR buffer (Invitrogen, Grand Island, NE, USA), 2 mM MgCl2 (Invitrogen), 0.2 mM of combined dNTPs (Sigma, Perth, Australia), 0.25 μM M13 tagged fluorescent primer (tagged with FAM from Thermo Scientific (Scoresby, Victoria, Australia) or NED, PET or VIC from Applied Biosystems (Mulgrave Australia)), 0.05 μM forward primer, 0.25 μM reverse primer, 10% BSA, 10% PVP-360, 5U/μL Platinum Taq (Invitrogen) and 25 ηg template DNA were amplified using an Eppendorf Mastercycler with a step down program as previously outlined [51]. Amplicons were visualized on a 3130XL sequencer (Applied Biosystems Mulgrave Australia) using a LIZ 600 bp internal standard (Applied Biosystems) and scored with GeneMapper Version 4.0 (Applied Biosystems). The eight primer pairs were assessed for null alleles using micro-checker [52] and for significant deviations from Hardy-Weinberg equilibrium (HWE) and linkage disequilibrium (LD) using Genepop on the Web (https://genepop.curtin.edu.au/) [50,51].
We also generated SNP data where each leaf was again subsampled and sent to Diversity Arrays Technology Pty Ltd (DArT) in Canberra Australia for DNA extraction, quantification and DArTseq™ genotyping which uses a combination of complexity reduction with restriction enzymes, implicit fragment size selection and next-generation sequencing [52,53], as outlined by [54].

2.3. Genetic Diversity and Relatedness in Remnant and SPA Populations

We considered SPA trees to be extensions of each remnant and first sought to determine the total genetic diversity ascribed by the SSRs in these remnants and the associated SPA trees. To do this we pooled SPA trees with their source remnant (hereafter called “remnants”) and estimated the mean number of alleles (Na), observed heterozygosity (Ho) and unbiased gene diversity (UHe) as well as the inbreeding coefficient (FIS) using GenAlEx Version 6.51b [55]. To account for bias in Na due to sample size differences, we used FSTAT version 2.9.3.2 [56] to generate allelic richness (Rs); however, it should be noted that these data should be interpreted cautiously as the minimum sample size was two. We then sought to compare the combined genetic diversity from the remnants (hereafter called “wild”) to that in each of the SPAs as previously described. The SNP dataset consisted of 7954 loci. R libraries including adegenet, [57] and dartR [58] were used for SNP data manipulation and filtering. We removed loci with call rates <80%, minor allele frequency (MAF) with threshold of 0.05 and repeatability (RepAvg; threshold = 0.99), thus leaving 3161 loci with a mean call rate of 95.2%. Genetic diversity measures of Rs, Ho, He and FIS were then estimated using the dartR, poppr [59] and hierfstat [60] R libraries.
Relatedness within remnants and within the pooled wild and SPA populations was explored in the SSR dataset using GenAlEx with Lynch and Ritland [61] and Queller and Goodnight [62] measures based on 10,000 permutations and 10,000 bootstraps for each analysis. The Coancestry package [63] was used to estimate relatedness among individual trees from the SNP data. The Wang (2007) [64] maximum likelihood method was selected from several packages available, as it returns values that are within the theoretical space (unlike method of moment estimators that often return negative values) and can account for inbreeding. A figure using the SNP-based genomic relationship matrix (G) was produced by hierarchical cluster analysis so that groups of closely related trees are sorted into blocks, with individual inbreeding estimates (1 + f) on the diagonal.

2.4. Population Genetic Structure

The SSR data were subjected to a principal co-ordinate analysis (PCord) based on genetic distances among plants calculated using the GenAlEx covariance standardized method, followed by visualization of the first two PCord dimensions. For the SNP dataset, we carried out individual-level PCord analyses using adegenet R functions based on Euclidean distance matrices. STRUCTURE v2.3.4 [65] was used for both SSR and SNP datasets to infer the number of genetic clusters (K) across all of the remnants without prior knowledge of remnant affinities using a 25,000 burn-in and 250,000 MCMC for K from 1–11 replicated 10 times for each K. We assumed no gene-flow among remnants (no admixture model), correlated allele frequencies, no location prior and a uniform alpha individually defined for each population. The optimal number of K-clusters was determined with the ad hoc statistic ΔK [66] using Structure Harvester version 0.6.93 [67] and bar charts of mean cluster membership coefficients were generated using CLUMPAK [68] available online at http://clumpak.tau.ac.il/.

3. Results

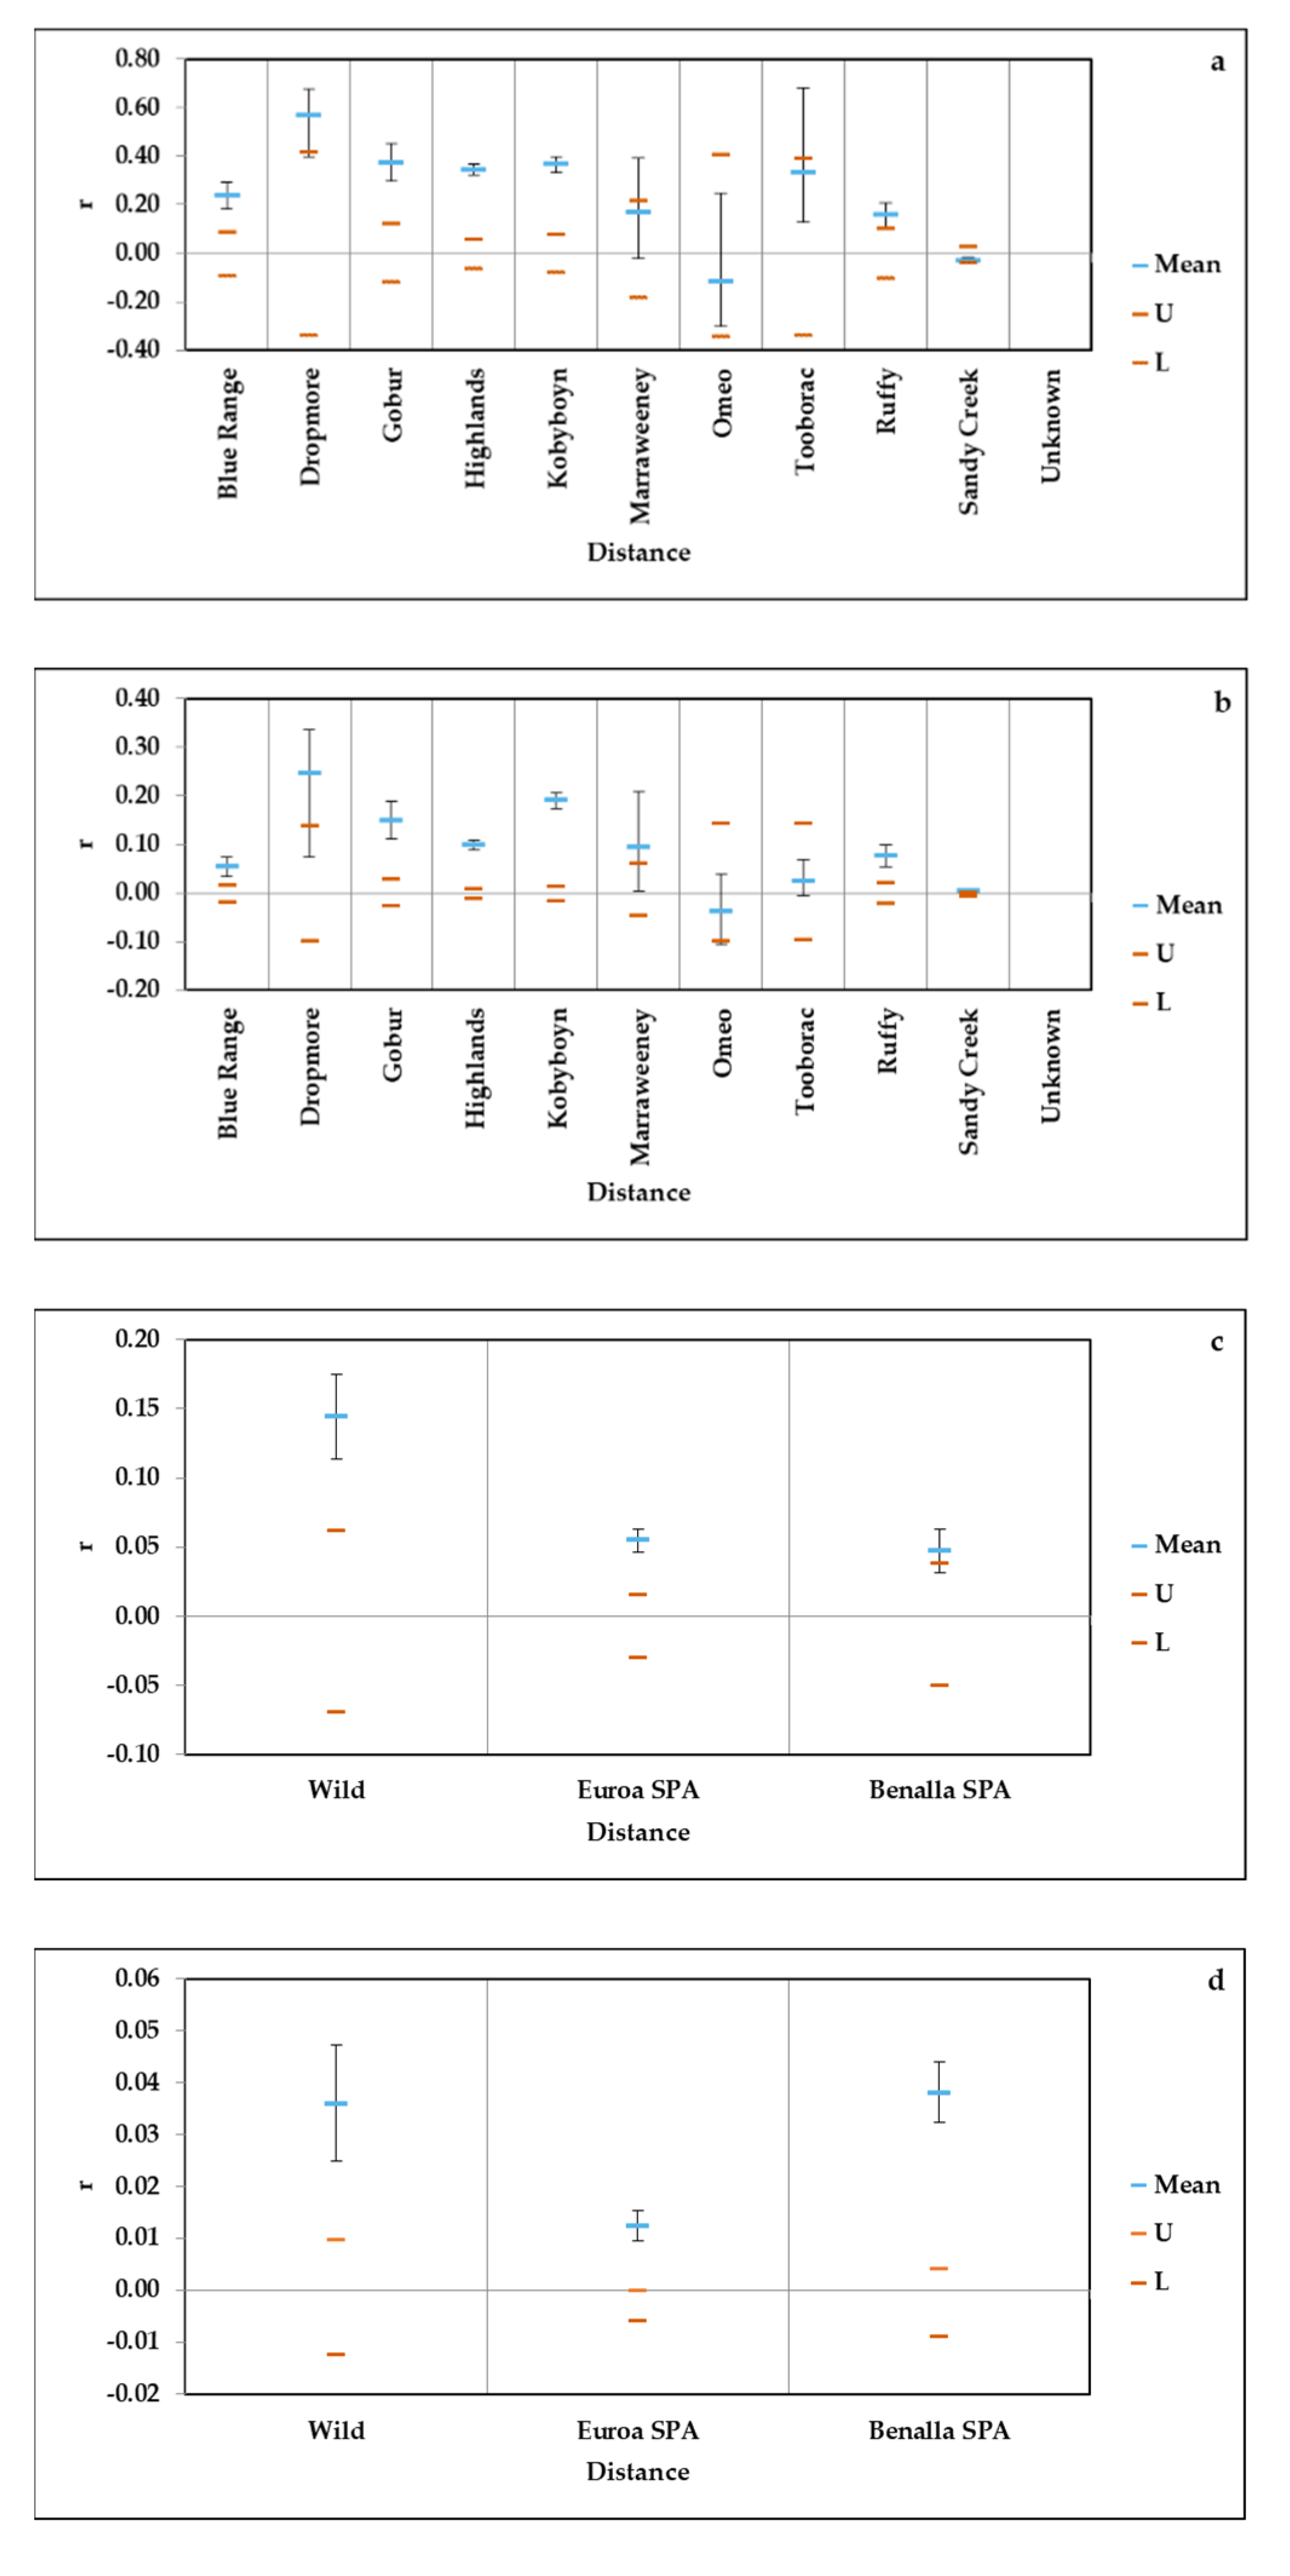
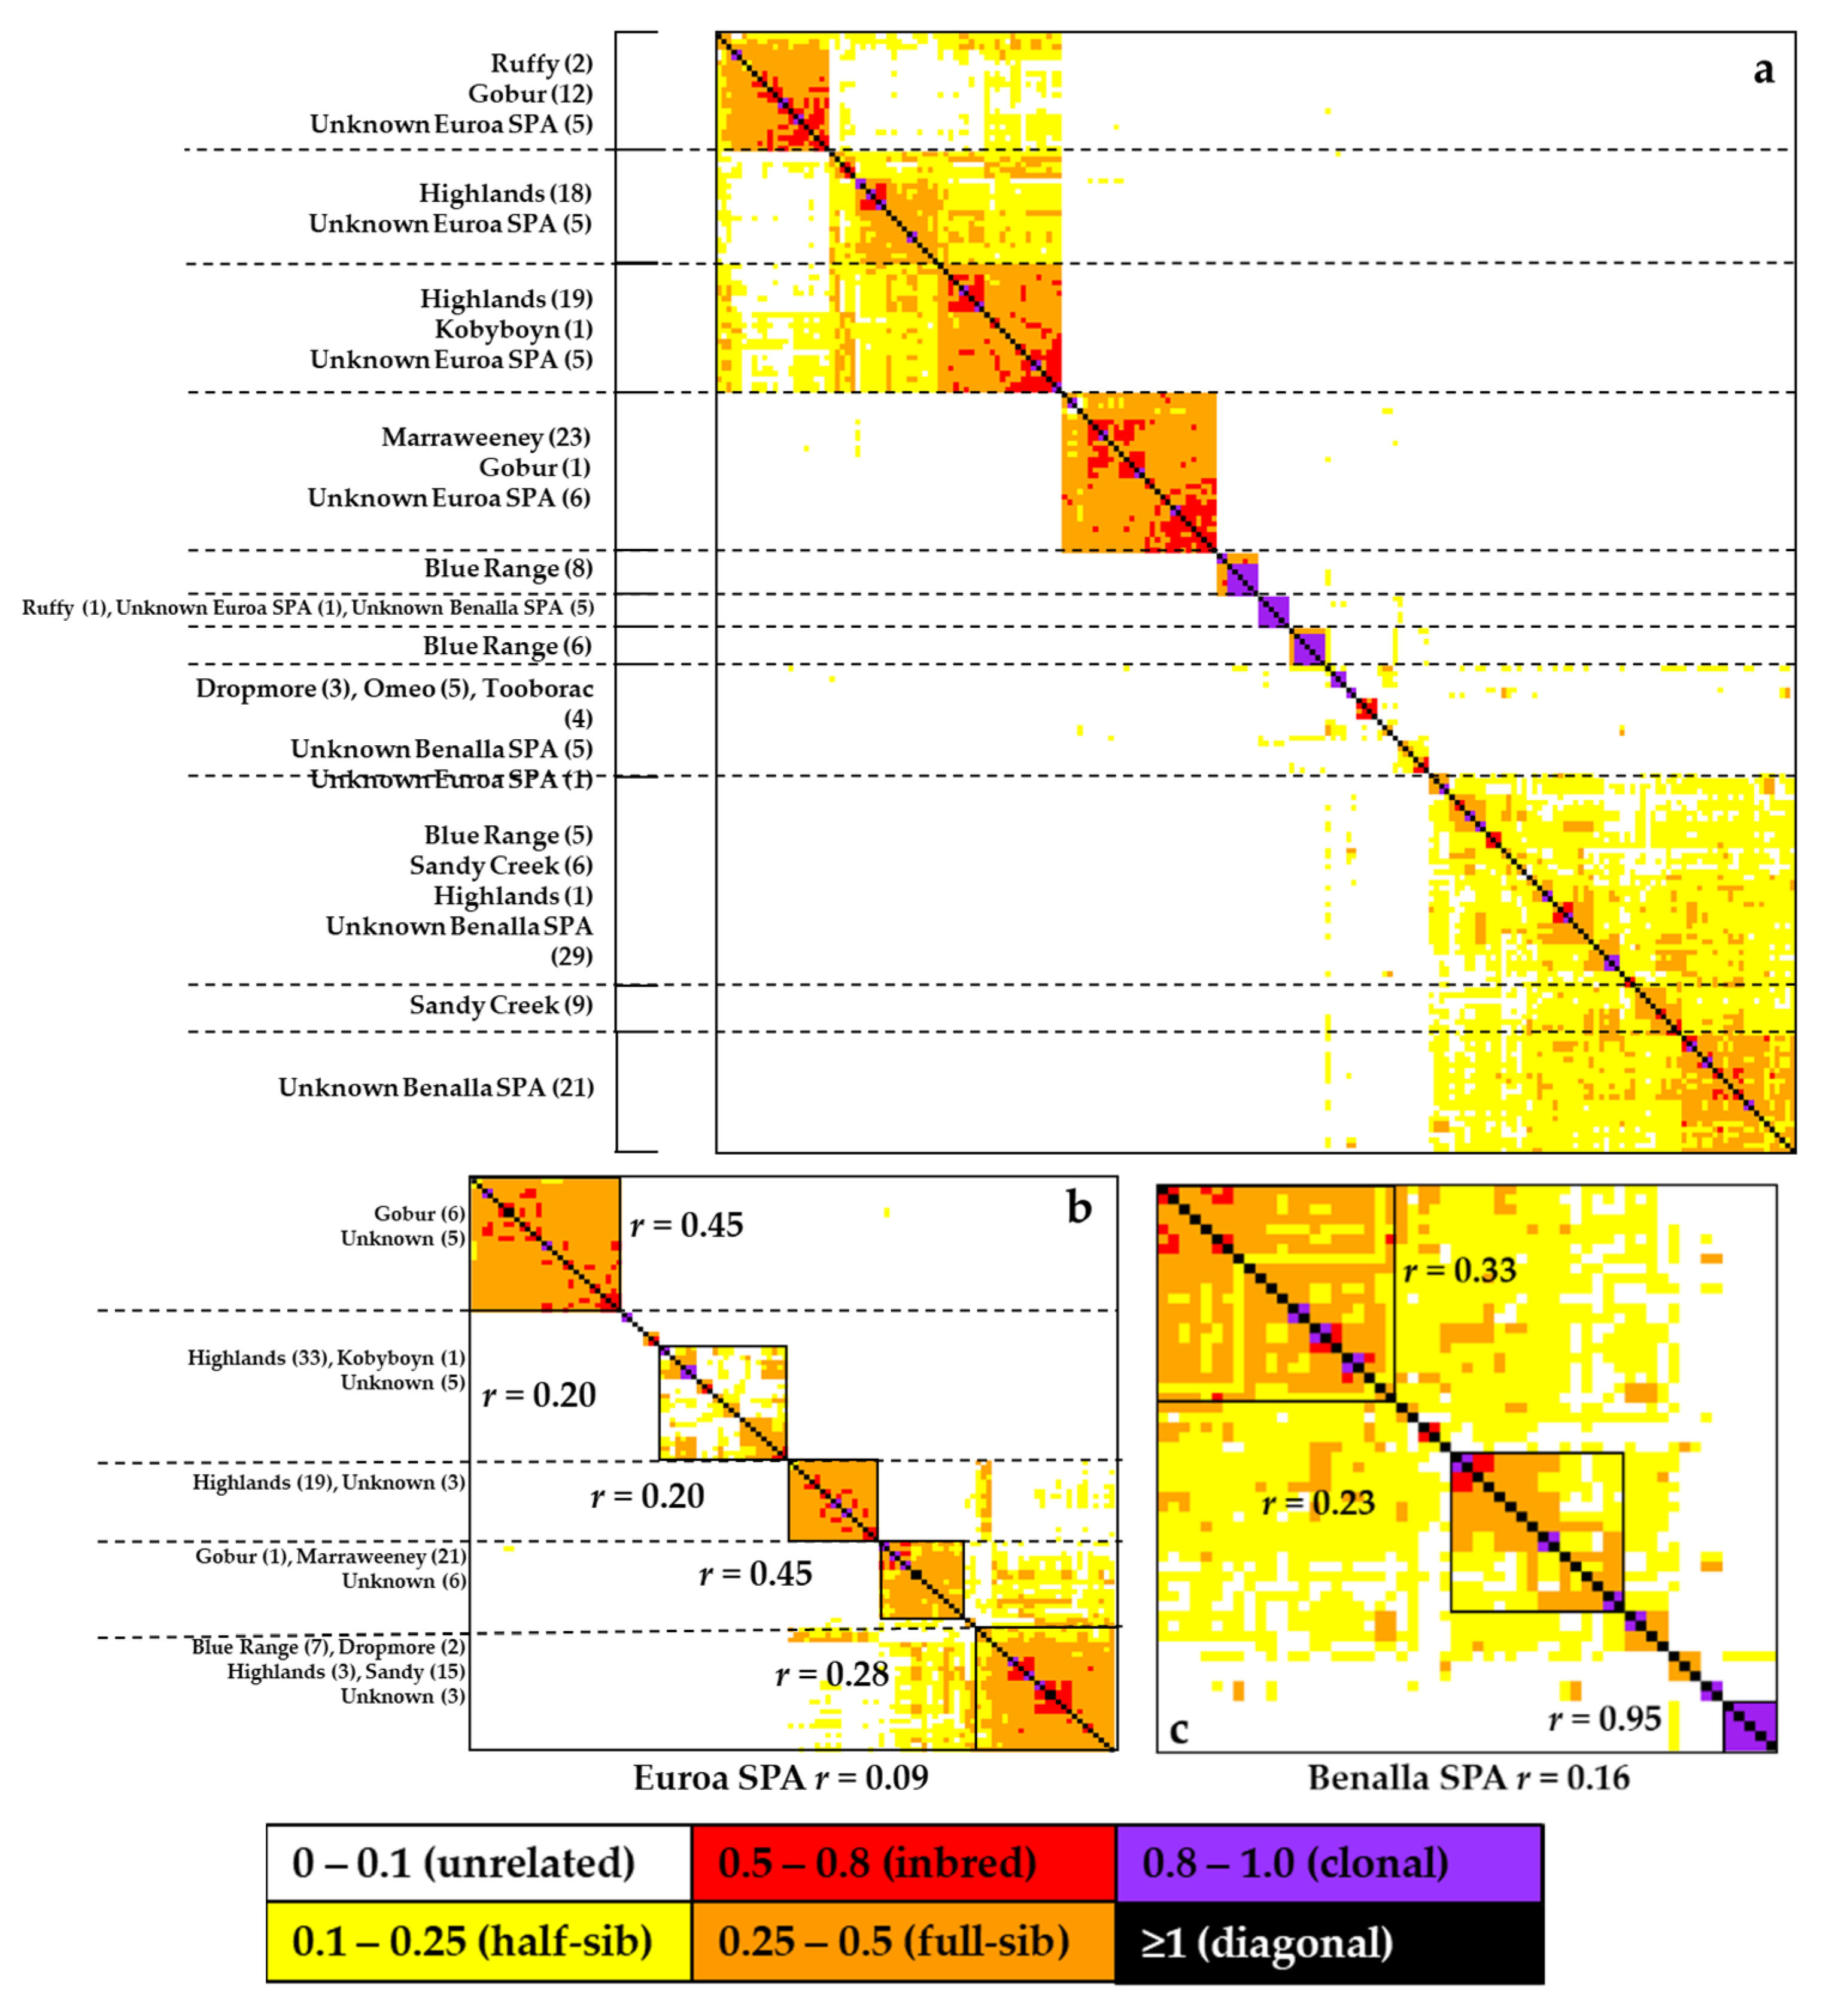
3.1. Genetic Diversity and Relatedness in Wild and SPA Populations

There was no evidence for null alleles but some evidence of HWE departure for Bint02, Bint05, Bint24, Br3 and Bo22 (Supplementary Table S2) and LD in nine of the 28 comparisons after Bonferroni corrections [69] (Supplementary Table S3). These deviations were inconsistent among sites and loci so all loci were retained for analyses. Levels of genetic diversity based on SSRs and SNPs varied among remnants (Table 1 and Table 2). While genetic diversity indices for the small Banksia remnants should be viewed cautiously, the number of alleles (Na) based on SSRs ranged between 1.63 and 6.75. SSR allelic richness (Rs) was 1.62–2.44, although this was based on a diploid sample of two individuals due to the small population sizes, and was 1.12–1.31 for the SNPs. SSR-based observed heterozygosity (Ho) was 0.38–0.69 compared with 0.12–0.25 for SNPs. Expected heterozygosity (UHe) for SSRs ranged 0.38–0.64 while for SNPs He was 0.06–0.30. Standard errors associated with the SNP data for these parameters were generally smaller than those associated with the SSR estimates. The SSR inbreeding coefficient (FIS) indicated that populations ranged from neutral (0.03) to highly outbred (−0.47) while the SNPs indicated that populations ranged from inbred (0.23) to outbred (−0.33). Private alleles were detected using SSRs in the Blue Range (2 alleles in 2 plants), Highlands (3 alleles in 3 plants), Marraweeney (1), Omeo (2 alleles in 2 plants), Ruffy (1) and Sandy Creek (1) remnants with two private alleles in each of the Euroa and Benalla SPA trees. There were no private SNP alleles identified among the remnants with only 22 private alleles (of 3161) identified among the plants with unknown remnants origins.
Both SSR-based relatedness measures indicated that all remnants had significantly higher mean relatedness except for Omeo and Tooborac (Figure 2a,b) as did the pooled wild and SPA populations (Figure 2c,d). The SNP-based genomic relationship matrix (G) is shown in Figure 3. Individual inbreeding estimates ranged from zero to 0.8, averaging 0.28. The SNP panel provided excellent power for resolving relationships using the Wang (2007) triadic estimator, revealing strong relatedness within and among the SPA and wild trees (Figure 3). A small number of clones not evident in the SSR dataset were also detected in this analysis.

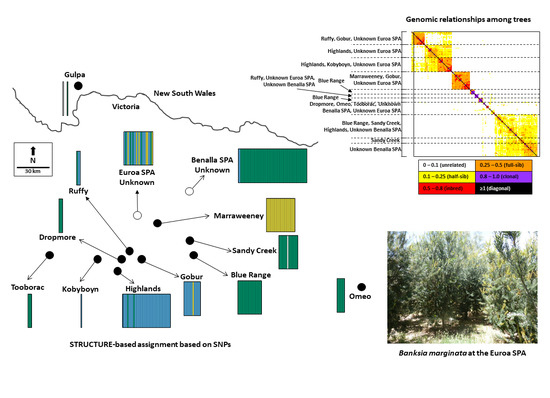
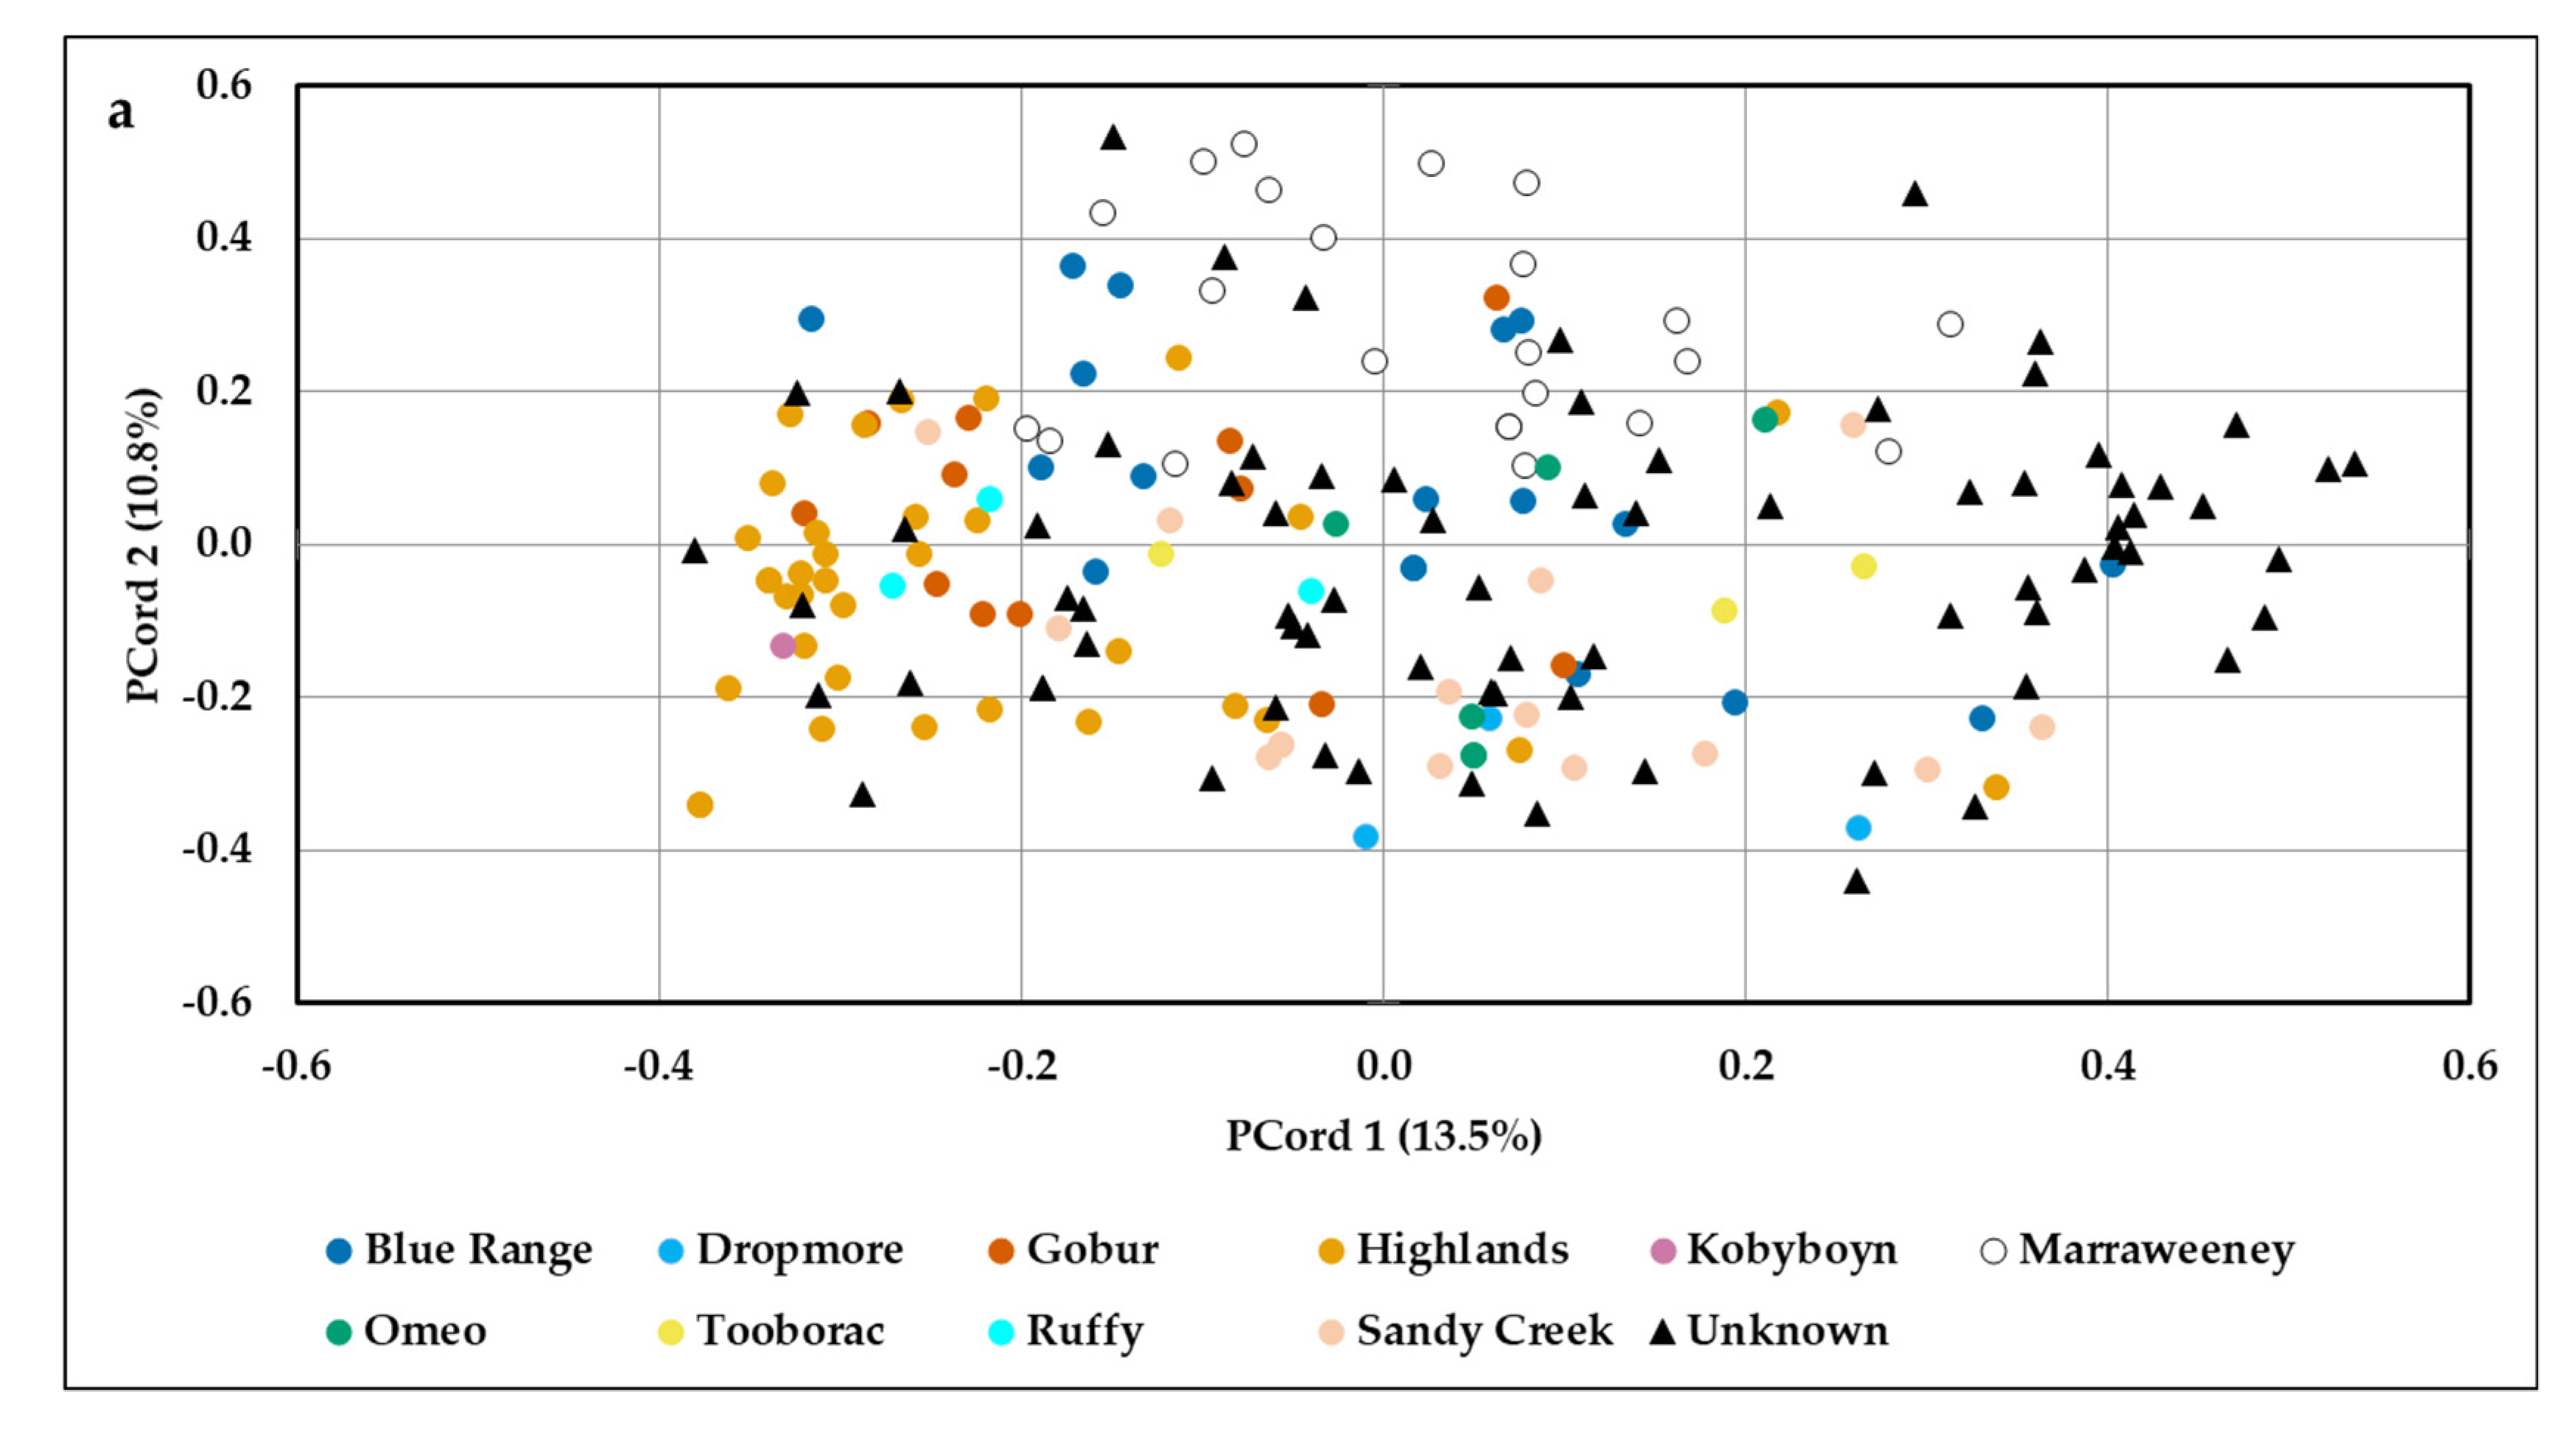
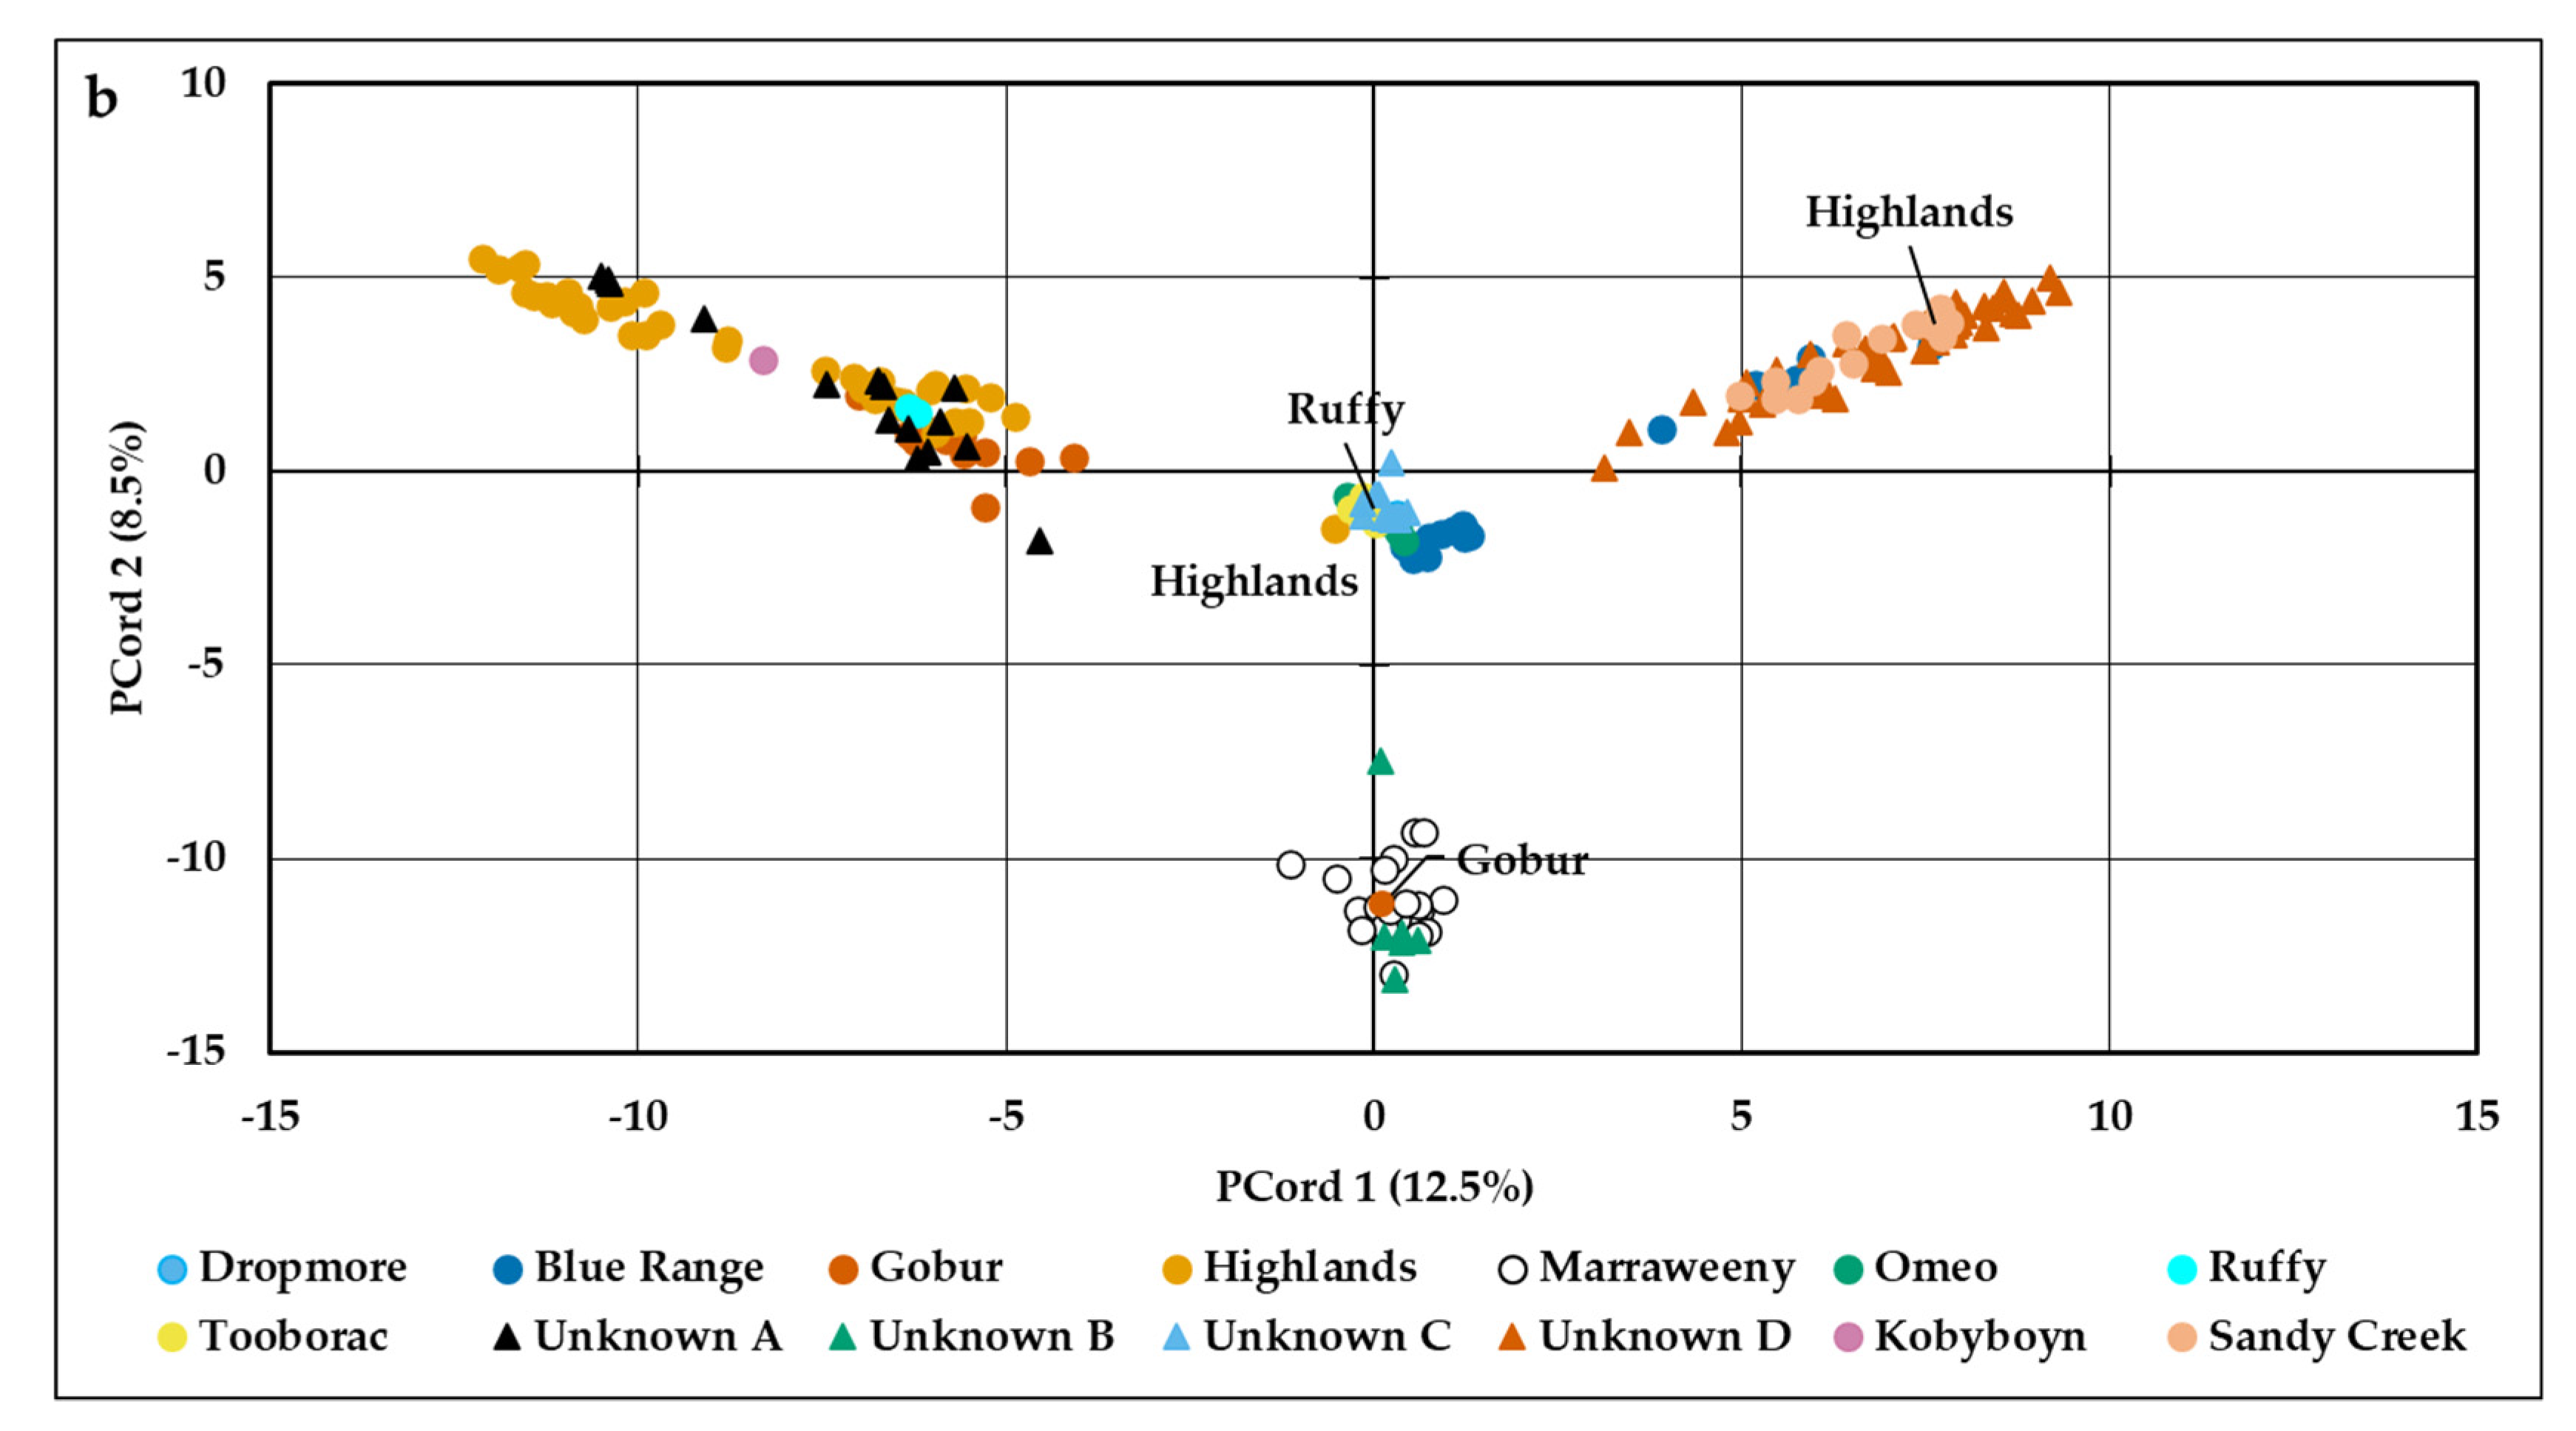
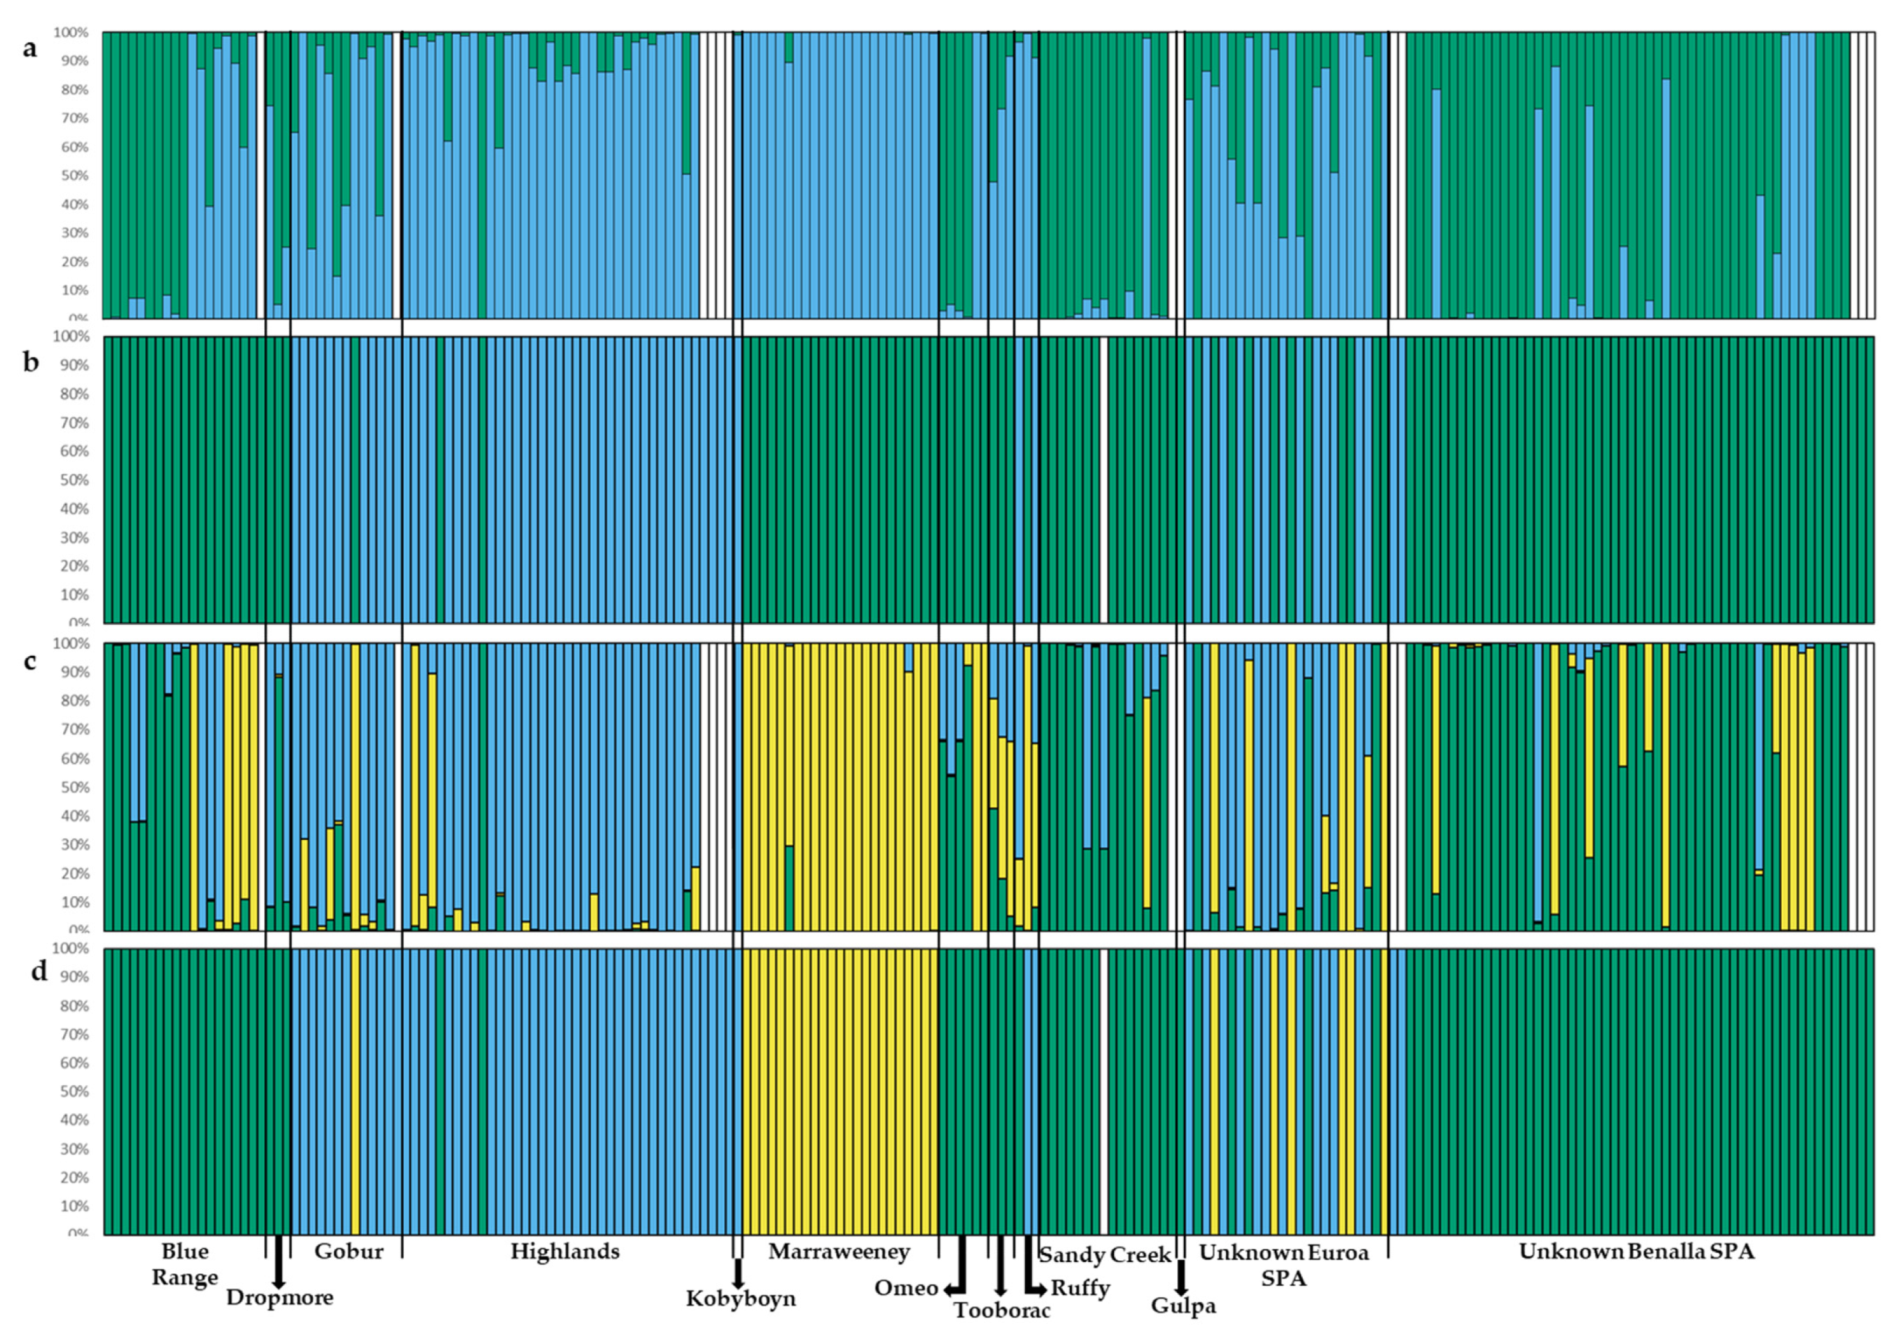
3.2. Population Genetic Structure

Principal co-ordinate analysis using the SSR data indicated that 13.5% of the total genetic variation was accounted for on the first axis and 10.8% on the second axis (Figure 4a). Highlands trees were distributed in negative PCord 1 space and Marraweeney trees in positive PCord 2 space but overall, there was no clear differentiation of trees into discrete groups; trees of unknown origin were distributed across all of the PCord space. While similar levels of total genetic variation were also observed in the first two axes of the SNP PCord (12.5% and 8.5% respectively), the trees in this analysis were clearly differentiated into four groups (Figure 4b). Highlands, Gobur, Kobyboyn and Ruffy trees fell together in negative PCord 1 space while Sandy Creek and some Blue Range trees were in a second group in positive PCord 1 space. The third group was primarily comprised of Marraweeney trees with a fourth group that consisted of Tooborac, Omeo, Dropmore and the remaining Blue Range trees placed centrally to the three other groups. One tree from both Ruffy and Gobur and two of the Highlands trees did not fall within their expected groups. Unknown trees were variously distributed among all four groups, allowing inferences to be drawn about their probable origins. Fifteen trees (Unknown A) grouped with Highlands cluster were all from the Euroa SPA as were the 6 trees (Unknown B) which fell with Marraweeney. Trees from Unknown C (two Euroa and eight Benalla) fell within the central group of Tooborac, Omeo, Dropmore and some Blue Range trees with the remaining 52 trees from Unknown D (three Euroa and 49 Benalla SPA) grouped with the Sandy Creek group.
Despite no clear groupings in the PCord SSR dataset, STRUCTURE indicated that the most probable number of K was 3 whereas for the SNP data K = 2 was the optimal clustering (Supplementary Figure S1). While the K = 2 assignments were similar for many trees in both the SSR and SNP datasets some notable differences were present. For example, the SSR analysis indicated that Blue Range trees came from both clusters (Figure 5a) whereas the SNP analysis assigned all these trees to Cluster 1 (Figure 5b). The Marraweeney trees were also assigned to different clusters by the two analyses and the Unknown trees were primarily assigned to Cluster 1 by both the analyses. The K = 3 analyses provided a nearly identical result between the SSR and SNP assignments (Figure 5c,d) that is readily interpretable and that is more useful for assigning the unknown individuals to their likely source populations. The SNP markers resulted in assignments of individual trees to populations with 99.9–100% probability whereas SSR markers resulted in proportional assignments to more than one class in most cases. Some differences in the assignment of trees observed between these two analyses included SSRs again differentiating between the Blue Range trees and not being reflected in the SNP analysis and a small number of trees (e.g., Highlands and Sandy Creek) being assigned to different clusters. As expected from the PCord analyses the Unknown trees were assigned to all three K by both analyses however Benalla SPA trees were predominantly from Cluster 1 whereas Euroa SPA trees were represented in from all three clusters.

4. Discussion

Our study used both SSR and SNP markers to assess genetic diversity and population genetic structure in remnant and SPA populations of Banksia marginata. We found that genetic diversity and inbreeding varied among the remnants. However, when the trees were pooled into their respective wild and SPA populations, genetic diversity and inbreeding indices were similar among the three groups. High levels of relatedness were also observed within most remnants as well as within the pooled wild and SPA populations. We also found that the population genetic structure was best described by three groups of trees and that each tree of unknown origin could be unambiguously assigned to one of these groups.
Lower levels of genetic diversity and increased inbreeding are globally recognized signatures of landscape fragmentation [18,70] that are also likely to be exacerbated by climate change (see review by [71]). Similar levels of genetic diversity were observed among these B. marginata remnants irrespective of whether SSRs or SNPs were analyzed. Our SSR genetic diversity measures are lower than those found for this species by [72] but this is likely due to the different SSR marker panels used in the two studies and because our study populations were considerably smaller and likely to have lower genetic diversity. As B. marginata was once a widely distributed, but likely scattered, species in savannah-like ecosystems [32,73], it is unclear whether the genetic diversity patterns presented here are indicative of the species’ history, of recent fragmentation, or both. However, the SSR indices reported here are comparable with rare species such as B. mimica, B. vestita and B. arborea [74,75] as well as the widespread but fragmented B. menziesii [76], suggesting that recent fragmentation is likely the driver of low diversity. While few SNP-based comparisons are available for Banksia our diversity indices were generally higher than those observed in the disjunct B. biterax [77] but similar to the more widely distributed B. seminuda [78].
The low genetic diversity observed here is presumed to expose these fragmented Banksia remnants to inbreeding and genetic drift and eventual extinction [11]. However, longevity and large spatial and temporal gene dispersal distances are thought to buffer longer-lived species against the effects of habitat fragmentation [27,28], although this assumption has been recently challenged [79,80]. In general, outcrossing species such as this Banksia [35], are also thought to be able to counter the effects of fragmentation [27,28] but not always, even in the case of wind-pollinated species [81,82,83]. Banksia marginata is a major nectar source for honeyeaters, possums and insects [33] which presumably helps to maintain gene dispersal and preferential outcrossing and limiting the production of small inbred seed that are less likely to survive [35]. As B. marginata populations do not appear to be experiencing recruitment bottlenecks [73], it is possible that sufficient outcrossed progeny are still being produced to maintain demographic processes. The very real challenge for these and other small remnants may be to continue to attract pollinators to maintain gene flow in the face of ongoing vegetation loss and associated decline of woodland birds [84,85].
Contrasting inbreeding estimates ranging from inbred to outbred were observed for many of our remnants depending on the dataset analyzed. While these data did not provide any clear patterns, the relatedness analyses tell a quite different story for these B. marginata remnants. High relatedness based on SSRs was detected in more than half of the remnants as well as when trees were pooled as wild and SPA populations. This result has also been observed in other remnants of this species [72]. The kinship estimates using the SNP dataset provided a much more nuanced understanding of the relationships among our remnant and SPA trees with many trees determined to be more closely related than full-sibs as a result of selfing or mating between close relatives. This may reflect (i) that trees within the fragmented populations from which the SPA trees were selected are often closely related, (ii) that sampling of trees for inclusion in the SPAs was carried out over short geographical distances resulting in related trees being included, or (iii) both. These findings have very important consequences for the efficacy of the two SPAs, as it increases the likelihood that the seed being produced will be inbred.
For outcrossing species, especially those with self-incompatibility systems, high relatedness reduces mate availability and often results in seed crop failures [86,87]. Several Australian genera are primarily preferentially outcrossing including banksias [88] and eucalypts [89], allowing these species to continue to set seed through selfing when mate availability is low. However, selfed seed in banksias (e.g., [90]) and eucalypts (e.g., [91,92]) can fail to germinate or has poor seedling survival. The prognosis for eucalypt seedlings that are the result of selfed or close-relative mating is poor, with inbreeding depression generally resulting in near-complete mortality before reproductive maturity is reached [93]. While kinship among trees is lower in the Euroa SPA (r = 0.09) than in the Benalla SPA (r = 0.16), neither of these is likely to be producing seed with the broad genetic base required for restoration, with the likely effects of inbreeding depression on fitness and survival compounding this problem. Unfortunately this is a seemingly common issue across SPAs established to meet the seed demands for restoration [6,20,21,22]. There is much to be learnt from forestry seed orchards that are actively designed and managed to achieve high outcrossing rates [91] when establishing genetically diverse SPAs for restoration. In particular, ensuring that close relatives are not included, to minimize inbreeding, is a high priority. Sampling trees within remnants at appropriate densities to avoid clusters of near relatives and/or pre-screening selections using molecular markers is also advisable.
While Miller et al. (2020) observed strong population structuring among fragmented B. marginata populations across the Victorian Volcanic Plains (2.3M Ha), we were somewhat surprised to find similarly strong partitioning at much finer geographic scales. Interestingly, these observations are inconsistent with expectations for outcrossing, longer-lived trees where more extensive gene dispersal should reduce differentiation among populations [27,28]. This expectation is, however, dependent on numerous factors including successful gene dispersal via pollen and seed. Pollen-mediated gene flow in banksias is primarily via insects, birds and mammals [39,94,95]. Birds can potentially transport pollen over large distances with B. menziesii pollen known to travel from 400 m to <2 km [76,96], although [97] highlight that most B. sphaerocarpa var. caesia pollen travels very short distances (<20 m). Banksia seed dispersal also varies with B. hookeriana seed moving from 36 m [98] to several kilometers [99], although the latter distance is possibly due to wind vortices and a lack of obstacles following fire. As B. marginata is likely to be bird and insect pollinated and the seed lack adaptations for long distance dispersal [72] it is expected that similar dispersal distances also characterize this species. It is difficult to ascertain from our data whether the strong population genetic structure observed was due to this species being widespread but naturally scattered or whether it reflects fragmentation since European settlement. The three genetic clusters we identified did not relate to any obvious geographical characteristics, making it possible that our populations reflect historic processes such as founder effects, genetic drift and limited gene flow among naturally scattered populations.
The population structure observed has allowed us to determine the probable origins of the Unknown SPA trees, helping to determine if new germplasm is required to alleviate biases towards particular remnants in the SPAs. The Benalla SPA trees were originally and primarily sourced from Sandy Creek with smaller contributions from Marraweeney, Ruffy, Gobur and the Euroa SPA. Most of the Unknown trees in this SPA were identified as being from Sandy Creek with only two coming from either Ruffy or Gobur and none from Marraweeney. While we cannot identify the Unknown Euroa SPA trees to individual remnants, most of these trees were from the Highlands/Gobur/Ruffy Cluster. The SNP dataset provided significantly better resolution of the Unknown trees than the SSRs demonstrating the value of using SNP markers despite the higher cost. As SPA establishment and management is expensive and time consuming, it is critical to ensure that any investment produces seed that is likely to generate a long-term biodiversity benefit. This includes more-careful selection of SPA foundational germplasm including sampling small and declining remnants at appropriate densities to avoid relatedness rather than selecting as many trees as possible to ‘save’ these from extinction.

5. Conclusions

SPAs are likely to be increasingly important to meet the seed demand for restoration. This will be especially so in Australia as a drying climate begins to impact on seed production and remnant populations continue to decline.
There is an urgent need to develop best practice protocols for SPAs that include design and active management practices that ensure outcrossing similar to those developed for forestry seed orchards.
To maximize the investment in SPAs studies to assess genetic diversity and population genetic structure is required to guide the selection of germplasm.
Studies to determine whether SPA-produced seed provide a significant biodiversity benefit are required to ensure that the investment required to produce these seed is justified or can become more cost-effective.

Supplementary Materials

The following are available online at https://www.mdpi.com/1424-2818/13/2/39/s1, Figure S1: ΔK based on STRUCTURE analyses for Banksia marginata remnant and SPA trees (a) SSRs and (b) SNPs., Table S1: Cross amplification of Banksia marginata samples using primer pairs developed for other Banksia species. + initially amplified across all samples; * data suitable for analyses., Table S2: p-values for each locus indicating departure from Hardy-Weinberg equilibrium., Table S3: Significant p-values for each locus pair across all Banksia marginata populations based on Fisher’s exact test [100]. * p-value remains significant after Bonferroni correction of p = 0.002 [69].

Author Contributions

Conceptualization, L.B. and J.B.; methodology, L.B.; formal analysis, L.B. and D.B.; data curation, L.B.; writing—original draft preparation, L.B.; writing—review and editing, L.B., D.B. and J.B.; visualization, L.B. and D.B. All authors have read and agreed to the published version of the manuscript.

Funding

This research was jointly funded by CSIRO and Goulburn Broken Catchment Management Authority.

Institutional Review Board Statement

Not applicable.

Informed Consent Statement

Not applicable.

Data Availability Statement

The data presented in this study are openly available in the CSIRO Data Access Portal (https://data.csiro.au/collections) at https://doi.org/10.25919/kwqv-t191.

Acknowledgments

The authors wish to thank Janet Hagen, Helen Repacholi, Carl Atkinson, Andy Guerin, Cathy Olive and Liz Evans for helping with plant and seed collection for this project.

Conflicts of Interest

The authors declare no conflict of interest.

References

  1. IPBES. Summary for Policymakers of the Thematic Assessment Report on Land Degradation and Restoration of the Intergovernmental Science-Policy Platform on Biodiversity and Ecosystem Services; IPBES Secretariat: Bonn, Germany, 2018. [Google Scholar]
  2. Mortlock, W. Local seed for revegetation: Where will all that seed come from? Ecol. Manag. Restor. 2000, 1, 93–101. [Google Scholar] [CrossRef]
  3. Merritt, D.J.; Dixon, K.W. Restoration Seed Banks—A Matter of Scale. Science 2011, 332, 424–425. [Google Scholar] [CrossRef] [PubMed]
  4. Broadhurst, L.; Lowe, A.; Coates, D.; Cunningham, S.; McDonald, M.; Vesk, P.; Yates, C. Seed supply for broadscale restoration: Maximizing evolutionary potential. Evol. Appl. 2008, 1, 587–597. [Google Scholar] [CrossRef] [PubMed]
  5. Broadhurst, L.M.; Jones, T.A.; Smith, F.; North, T.; Guja, L. Maximizing seed resources for restoration in an uncertain future. Bioscience 2016, 66, 73–79. [Google Scholar] [CrossRef] [Green Version]
  6. Broadhurst, L.; Hopley, T.; Li, L.; Begley, J. A genetic assessment of seed production areas (SPAs) for restoration. Conserv. Genet. 2017, 18, 1257–1266. [Google Scholar] [CrossRef]
  7. Gordon, D.R.; Rice, K.J. Patterns of differentiation in wiregrass (Aristida beyrichiana): Implications for restoration. Restor. Ecol. 1998, 6, 166–174. [Google Scholar] [CrossRef]
  8. Avise, J.C. A role for molecular genetics in the recognition and conservation of endangered species. Trends Ecol. Evol. 1989, 4, 279–281. [Google Scholar] [CrossRef] [Green Version]
  9. Helenurm, K. Outplanting and differential source population success in Lupinus guadalupensis. Conserv. Biol. 1998, 12, 118–127. [Google Scholar] [CrossRef]
  10. Ellstrand, N.C.; Elam, D.R. Population genetics consequences of small population size: Implications for plant conservation. Ann. Rev. Ecol. Syst. 1993, 24, 217–242. [Google Scholar] [CrossRef]
  11. Young, A.G.; Boyle, T.J.B.; Brown, T. The population genetic consequences of habitat fragmentation for plants. Trends Ecol. Evol. 1996, 11, 413–417. [Google Scholar] [CrossRef]
  12. Hobbs, R.J.; Higgs, E.; Harris, J.A. Novel ecosystems: Implications for conservation and restoration. Trends Ecol. Evol. 2009, 24, 599–605. [Google Scholar] [CrossRef] [PubMed]
  13. Jones, T.A. Ecologically appropriate plant materials for functional restoration of rangelands. J. Sust. Forest. 2014, 33, S93–S103. [Google Scholar] [CrossRef]
  14. Jones, T.A. Ecologically appropriate plant materials for restoration applications. BioScience 2013, 63, 211–219. [Google Scholar] [CrossRef] [Green Version]
  15. Vander Mijnsbrugge, K.; Bischoff, A.; Smith, B. A question of origin: Where and how to collect seed for ecological restoration. Basic Appl. Ecol. 2010, 11, 300–311. [Google Scholar] [CrossRef] [Green Version]
  16. Butcher, P.; Williams, E. Variation in outcrossing rates and growth in Eucalyptus camaldulensis from the Petford region, Queensland; evidence of outbreeding depression. Silvae Genet. 2002, 51, 6–12. [Google Scholar]
  17. Jones, R.; Vaillancourt, R.; Gore, P.; Potts, B. Genetic control of flowering time in Eucalyptus globulus ssp. globulus. Tree Genet. Genomes 2011, 7, 1209–1218. [Google Scholar] [CrossRef] [Green Version]
  18. Aguilar, R.; Ashworth, L.; Galetto, L.; Aizen, M.A. Plant reproduction susceptibility to habitat fragmentation: Review and synthesis through a meta-analysis. Ecol. Lett. 2006, 9, 968–980. [Google Scholar] [CrossRef]
  19. Broadhurst, L.; Fifield, G.; Vanzella, B.; Pickup, M. Evaluating the evolutionary potential of two Yellow Box (Eucalyptus melliodora A.Cunn. ex Schauer, Myrtaceae) seed production areas. Aust. J. Bot. 2015, 63, 455–466. [Google Scholar] [CrossRef]
  20. Dolan, R.W.; Marr, D.L.; Schnabel, A. Capturing genetic variation during ecological restorations: An example from Kankakee Sands in Indiana. Restor. Ecol. 2008, 16, 386–396. [Google Scholar] [CrossRef]
  21. Fant, J.B.; Holmstrom, R.M.; Sirkin, E.; Etterson, J.R.; Masi, S. Genetic structure of threatened native populations and propagules used for restoration in a clonal species, American Beachgrass (Ammophila breviligulata Fern.). Restor. Ecol. 2008, 16, 594–603. [Google Scholar] [CrossRef]
  22. Dyer, A.R.; Knapp, E.E.; Rice, K.J. Unintentional selection and genetic changes in native perennial grass populations during commercial seed production. Ecol. Restor. 2016, 34, 39–48. [Google Scholar] [CrossRef]
  23. Kettle, C.J.; Ennos, R.A.; Jaffre, T.; Gardner, M.; Hollingsworth, P.M. Cryptic genetic bottlenecks during restoration of an endangered tropical conifer. Biol. Conserv. 2008, 141, 1953–1961. [Google Scholar] [CrossRef]
  24. Broadhurst, L.; Breed, M.; Lowe, A.; Bragg, J.; Catullo, R.; Coates, D.; Encinas-Viso, F.; Gellie, N.; James, E.; Krauss, S.; et al. Genetic diversity and structure of the Australian flora. Divers. Distrib. 2017, 23, 41–52. [Google Scholar] [CrossRef] [Green Version]
  25. Hamrick, J.L.; Godt, M.J.W. Effects of life history traits on genetic diversity in plant species. Philos. Trans. R. Soc. Lond. B Biol. Sci. 1996, 351, 1291–1298. [Google Scholar] [CrossRef]
  26. Nybom, H.; Bartish, I.V. Effects of life history traits and sampling strategies on genetic diversity estimates obtained with RAPD markers in plants. Perspect. Plant Ecol. Evol. Syst. 2000, 3, 93–114. [Google Scholar] [CrossRef]
  27. Hamrick, J.L.; Godt, M.J.W.; Sherman-Broyles, S.L. Factors influencing levels of genetic diversity in woody plant species. New For. 1992, 6, 95–124. [Google Scholar] [CrossRef]
  28. Hamrick, J.L. Response of forest trees to global environmental changes. Forest Ecol. Manag. 2004, 197, 323–335. [Google Scholar] [CrossRef]
  29. Hancock, N.; Gibson Roy, P.; Driver, M.; Broadhurst, L. The Australian Native Seed Survey Report; Australian Network for Plant Conservation: Canberra, Australia, 2020. [Google Scholar]
  30. Broadhurst, L.; Driver, M.; Guja, L.; North, T.; Vanzella, B.; Fifield, G.; Bruce, S.; Taylor, D.; Bush, D. Seeding the Future – the issues of supply and demand in restoration. Ecol. Manag. Restor. 2015, 16, 29–32. [Google Scholar] [CrossRef]
  31. Taylor, A.; Hopper, S.D. Banksia Atlas; Australian Government Publishing Service: Canberra, Australia, 1991.
  32. Collins, K.; George, A. Banksias; Bloomings Books: Melbourne, Australia, 2008. [Google Scholar]
  33. George, A.S. The Banksia Book; Kangaroo Press: Sydney, Australia, 1984. [Google Scholar]
  34. George, A.S. The genus Banksia L.f. (Proteaceae). Nuytsia 1981, 3, 239–473. [Google Scholar]
  35. Vaughton, G.; Ramsey, M. Selfed seed set and inbreeding depression in obligate seeding populations of Banksia marginata. Proceed. Linnean Soc. NSW 2006, 127, 19–25. [Google Scholar]
  36. Charlesworth, D.; Charlesworth, B. Inbreeding depression and its evolutionary consequences. Annu. Rev. Ecol. Syst. 1987, 18, 237–268. [Google Scholar] [CrossRef]
  37. Vaughton, G.; Ramsey, M. Sources and consequences of seed mass variation in Banksia marginata (Proteaceae). J. Ecol. 1998, 86, 563–573. [Google Scholar] [CrossRef]
  38. Specht, R.; Rayson, P.; Jackman, M. Dark Island heath (Ninety-mile Plain, South Australia). VI. Pyric succession: Changes in composition, coverage, dry weight, and mineral nutrient status. Aust. J. Bot. 1958, 6, 59–88. [Google Scholar] [CrossRef]
  39. Ford, H.A.; Paton, D.C.; Forde, N. Birds as pollinators of Australian plants. N. Z. J. Bot. 1979, 17, 509–519. [Google Scholar] [CrossRef] [Green Version]
  40. Lepschi, B. Food of some birds in southern Australia: Additions to Barker & Vestjens, Part 2. EMU 1997, 97, 84–87. [Google Scholar]
  41. Duncan, A.; Taylor, R. Occurrence of pygmy possums, Cercartetus lepidus and C. nanus, and their nest sites in logged and unlogged dry and wet eucalypt forest in Tasmania. Aust. For. 2001, 64, 159–164. [Google Scholar] [CrossRef]
  42. Hord, H.A.; Paton, D.C. Partitioning of nectar sources in an Australian honeyeater community. Aust. J. Ecol. 1982, 7, 149–159. [Google Scholar] [CrossRef]
  43. Swart, H.J. Australian leaf-inhabiting fungi XXIX. Some ascomycetes on Banksia. Trans. Brit. Mycol. Soc. 1988, 91, 453–465. [Google Scholar] [CrossRef]
  44. Blundell, M.J.; Phongkham, T.; Gale, K.R. A novel enzyme-linked immunosorbent assay for the detection of WX-B1 null wheat lines using a monclonal antibody and its application for the detection of marker heterogeneity within commercial cultivars. J. Cereal Sci. 2010, 52, 187–191. [Google Scholar] [CrossRef]
  45. Usher, A.V.; Ayre, D.J.; Whelan, R.J. Microsatellites for eastern Australian Banksia species. Mol. Ecol. Notes 2005, 5, 821–823. [Google Scholar] [CrossRef]
  46. He, T.; Krauss, S.L.; Lamont, B.B. Polymorphic microsatellite DNA markers for Banksia hookeriana (Proteaceae). Mol. Ecol. Resour. 2008, 8, 1515–1517. [Google Scholar] [CrossRef] [PubMed]
  47. Fatemi, M.; Houliston, G.J.; Haddadchi, A.; Gross, C.L. Cost-effective microsatellite markers for Banksia integrifolia (Proteaceae). Appl. Plant Sci. 2013, 1, 1200130. [Google Scholar] [CrossRef] [PubMed]
  48. Nistelberger, H.M.; Llorens, T.M.; Byrne, M. Isolation and characterization of microsatellites in the woody shrub, Banksia sphaerocarpa var. caesia (Proteaceae). Mol. Ecol. Resour. 2009, 9, 148–149. [Google Scholar] [CrossRef] [PubMed]
  49. Merwin, L.; He, T.; Krauss, S.L. Isolation and characterization of polymorphic microsatellite DNA markers for Banksia candolleana (Proteaceae). Conserv. Genet. Resour. 2010, 2, 345–347. [Google Scholar] [CrossRef]
  50. He, T.; Krauss, S.; Lamont, B.B. Polymorphic microsatellite DNA markers for Banksia attenuata (Proteaceae). Mol. Ecol. Notes 2007, 7, 1329–1331. [Google Scholar] [CrossRef]
  51. Broadhurst, L.M. Genetic diversity and population genetic structure in fragmented Allocasuarina verticillata (Allocasuarinaceae) - implications for restoration. Aust. J. Bot. 2011, 59, 770–780. [Google Scholar] [CrossRef]
  52. Van Oosterhout, C.; Hutchinson, W.F.; Wills, D.P.M.; Shipley, P. micro-checker: Software for identifying and correcting genotyping errors in microsatellite data. Mol. Ecol. Notes 2004, 4, 535–538. [Google Scholar] [CrossRef]
  53. Sansaloni, C.; Petroli, C.; Jaccoud, D.; Carling, J.; Detering, F.; Grattapaglia, D.; Kilian, A. Diversity Arrays Technology (DArT) and next-generation sequencing combined: Genome-wide, high throughput, highly informative genotyping for molecular breeding of Eucalyptus. BMC Proc. 2011, 5, 54. [Google Scholar] [CrossRef] [Green Version]
  54. Kilian, A.; Wenzl, P.; Huttner, E.; Carling, J.; Xia, L.; Blois, H.; Caig, V.; Heller-Uszynska, K.; Jaccoud, D.; Hopper, C. Diversity arrays technology: A generic genome profiling technology on open platforms. In Data Production and Analysis in Population Genomics; Springer: Berlin/Heidelberg, Germany, 2012; pp. 67–89. [Google Scholar] [CrossRef]
  55. Peakall, R.; Smouse, P.E. GENALEX 6: Genetic analysis in Excel. Population genetic software for teaching and research. Mol. Ecol. Notes 2006, 6, 228–295. [Google Scholar] [CrossRef]
  56. Goudet, J. FSTAT, a Program to Estimate and Test Gene Diversities and Fixation Indices (Version 2.9.3). Available online: http://www2.unil.ch/izea/softwares/fstat.html (accessed on 5 February 2002).
  57. Jombart, T. adegenet: A R package for the multivariate analysis of genetic markers. Bioinformatics 2008, 24, 1403–1405. [Google Scholar] [CrossRef] [Green Version]
  58. Gruber, B.; Unmack, P.J.; Berry, O.F.; Georges, A. dartr: An R package to facilitate analysis of SNP data generated from reduced representation genome sequencing. Mol. Ecol. Resour. 2018, 18, 691–699. [Google Scholar] [CrossRef] [PubMed]
  59. Kamvar, Z.N.; Tabima, J.F.; Grünwald, N.J. Poppr: An R package for genetic analysis of populations with clonal, partially clonal, and/or sexual reproduction. PeerJ 2014, 2, e281. [Google Scholar] [CrossRef] [PubMed] [Green Version]
  60. Goudet, J. Hierfstat, a package for R to compute and test hierarchical F-statistics. Mol. Ecol. Notes 2005, 5, 184–186. [Google Scholar] [CrossRef] [Green Version]
  61. Lynch, M.; Ritland, K. Estimation of pairwise relatedness with molecular markers. Genetics 1999, 152, 1753–1766. [Google Scholar] [PubMed]
  62. Queller, D.C.; Goodnight, K.F. Estimating relatedness using genetic markers. Evolution 1989, 43, 258–275. [Google Scholar] [CrossRef]
  63. Wang, J. Coancestry: A program for simulating, estimating and analysing relatedness and inbreeding coefficients. Mol. Ecol. Resour. 2010, 11, 141–145. [Google Scholar] [CrossRef]
  64. Wang, J. Triadic IBD coefficients and applications to estimating pairwise relatedness. Genet. Res. 2007, 89, 135–153. [Google Scholar] [CrossRef]
  65. Pritchard, J.K.; Stephens, M.; Donnelly, P. Inference of population structure using multilocus genotype data. Genetics 2000, 155, 945–959. [Google Scholar]
  66. Evanno, G.; Regnaut, S.; Goudet, J. Detecting the number of clusters of individuals using the software STRUCTURE: A simulation study. Mol. Ecol. 2005, 14, 2611–2620. [Google Scholar] [CrossRef] [Green Version]
  67. Earl, D.; vonHoldt, B. STRUCTURE HARVESTER: A website and program for visualizing STRUCTURE output and implementing the Evanno method. Conserv. Genet. Resour. 2012, 4, 359–361. [Google Scholar] [CrossRef]
  68. Kopelman, N.M.; Mayzel, J.; Jakobsson, M.; Rosenberg, N.A.; Mayrose, I. Clumpak: A program for identifying clustering modes and packaging population structure inferences across K. Mol. Ecol. Resour. 2015, 15, 1179–1191. [Google Scholar] [CrossRef] [PubMed] [Green Version]
  69. Rice, W.R. Analyzing Tables of Statistical Tests. Evolution 1989, 43, 223–225. [Google Scholar] [CrossRef] [PubMed]
  70. Aguilar, R.; Quesada, M.; Ashworth, L.; Herrerias-Diego, Y.; Lobo, J. Genetic consequences of habitat fragmentation in plant populations: Susceptible signals in plant traits and methodological approaches. Mol. Ecol. 2008, 17, 5177–5188. [Google Scholar] [CrossRef] [PubMed]
  71. Nickolas, H.; Harrison, P.A.; Tilyard, P.; Vaillancourt, R.E.; Potts, B.M. Inbreeding depression and differential maladaptation shape the fitness trajectory of two co-occurring Eucalyptus species. Ann. For. Sci. 2019, 76, 10. [Google Scholar] [CrossRef] [Green Version]
  72. Miller, A.D.; Nitschke, C.; Weeks, A.R.; Weatherly, W.L.; Heyes, S.D.; Sinclair, S.J.; Holland, O.J.; Stevenson, A.; Broadhurst, L.; Hoebee, S.E.; et al. Genetic data and climate niche suitability models highlight the vulnerability of a functionally important plant species from south-eastern Australia. Evol. Appl. 2020, 13, 2014–2029. [Google Scholar] [CrossRef] [PubMed] [Green Version]
  73. Heyes, S.D.; Sinclair, S.J.; Hoebee, S.E.; Morgan, J.W. How widespread are recruitment bottlenecks in fragmented populations of the savanna tree Banksia marginata (Proteaceae)? Plant Ecol. 2020, 221, 545–557. [Google Scholar] [CrossRef]
  74. Millar, M.A.; Byrne, M. Variable clonality and genetic structure among disjunct populations of Banksia mimica. Conserv. Genet. 2020, 21, 803–818. [Google Scholar] [CrossRef]
  75. Nistelberger, H.M.; Byrne, M.; Coates, D.; Roberts, J.D. Phylogeography and population differentiation in terrestrial island populations of Banksia arborea (Proteaceae). Biol. J. Linn. Soc. Lond. 2015, 114, 860–872. [Google Scholar] [CrossRef] [Green Version]
  76. Ritchie, A.L.; Dyer, R.J.; Nevill, P.G.; Sinclair, E.A.; Krauss, S.L. Wide outcrossing provides functional connectivity for new and old Banksia populations within a fragmented landscape. Oecologia 2019, 190, 255–268. [Google Scholar] [CrossRef] [Green Version]
  77. Bradbury, D.; Binks, R.M.; Coates, D.J.; Byrne, M. Conservation genomics of range disjunction in a global biodiversity hotspot: A case study of Banksia biterax (Proteaceae) in southwestern Australia. Biol. J. Linn. Soc. Lond. 2019, 127, 390–406. [Google Scholar] [CrossRef]
  78. Robins, T.P.; Binks, R.M.; Byrne, M.; Hopper, S.D. Contrasting patterns of population divergence on young and old landscapes in Banksia seminuda (Proteaceae), with evidence for recognition of subspecies. Biol. J. Linn. Soc. Lond. 2020. [Google Scholar] [CrossRef]
  79. Vranckx, G.; Jacquemyn, H.; Muys, B.; Honnay, O. Meta-analysis of susceptibility of woody plants to loss of genetic diversity through habitat fragmentation. Conserv. Biol. 2012, 26, 228–237. [Google Scholar] [CrossRef] [PubMed]
  80. González, A.V.; Gómez-Silva, V.; Ramírez, M.J.; Fontúrbel, F.E. Meta-analysis of the differential effects of habitat fragmentation and degradation on plant genetic diversity. Conserv. Biol. 2020, 34, 711–720. [Google Scholar] [CrossRef] [PubMed]
  81. Seltmann, P.; Hensen, I.; Renison, D.; Wesche, K.; Ploch, S.; Rondan Duenas, J.; Cocucci, A.; Jung, K. Biparental inbreeding depression, genetic relatedness and progeny vigour in a wind-pollinated treeline species in Argentina. Plant Ecol. 2009, 205, 155–164. [Google Scholar] [CrossRef] [Green Version]
  82. Seltmann, P.; Renison, D.; Cocucci, A.; Hensen, I.; Jung, K. Fragment size, pollination efficiency and reproductive success in natural populations of wind-pollinated Polylepis australis (Rosaceae) trees. Flora 2007, 202, 547–554. [Google Scholar] [CrossRef]
  83. Jump, A.S.; Penuelas, J. Genetic effects of chronic habitat fragmentation in a wind-pollinated tree. Proc. Natl. Acad. Sci. USA 2006, 103, 8096–8100. [Google Scholar] [CrossRef] [Green Version]
  84. Ford, H.A.; Barrett, G.W.; Saunders, D.A.; Recher, H.F. Why have birds in the woodlands of Southern Australia declined? Biol. Conserv. 2001, 97, 71–88. [Google Scholar] [CrossRef]
  85. Lindenmayer, D.B.; Lane, P.; Westgate, M.; Scheele, B.C.; Foster, C.; Sato, C.; Ikin, K.; Crane, M.; Michael, D.; Florance, D.; et al. Tests of predictions associated with temporal changes in Australian bird populations. Biol. Conserv. 2018, 222, 212–221. [Google Scholar] [CrossRef]
  86. Young, A.G.; Pickup, M. Low S-allele numbers limit mate availability, reduce seed set and skew fitness in small populations of a self-incompatible plant. J. Appl. Ecol. 2010, 47, 541–548. [Google Scholar] [CrossRef]
  87. Broadhurst, L.M.; Young, A.G. Reproductive constraints to the long-term persistence of fragmented Acacia dealbata (Mimosaceae) populations in southeast Australia. Biol. Conserv. 2006, 133, 512–526. [Google Scholar] [CrossRef]
  88. Carthew, S.M.; Whelan, R.J.; Ayre, D.J. Experimental Confirmation of Preferential Outcrossing in Banksia. Int. J. Plant Sci. 1996, 157, 615–620. [Google Scholar] [CrossRef]
  89. Pryor, L.D. Biology of Eucalypts; Edward Arnold: London, UK, 1976. [Google Scholar]
  90. Heliyanto, B.; Veneklaas, E.J.; Lambers, H.; Krauss, S.L. Preferential outcrossing in Banksia ilicifolia (Proteaceae). Aust. J. Bot. 2005, 53, 164–170. [Google Scholar] [CrossRef]
  91. Moran, G.; Bell, C.; Griffin, A.R. Reduction in levels of inbreeding in a seed orchard of Eucalyptus regnans F.Muell. compared with natural populations. Silvae Genet. 1989, 38, 32–36. [Google Scholar]
  92. Ellis, M.F.; Sedgley, M. Floral morphology and breeding system of three species of Eucalyptus, section Bisectaria (Myrtaceae). Aust. J. Bot. 1992, 40, 249–262. [Google Scholar] [CrossRef]
  93. Griffin, A.R.; Potts, B.M.; Vaillancourt, R.E.; Bell, J.C. Life cycle expression of inbreeding depression in Eucalyptus regnans and inter-generational stability of its mixed mating system. Ann. Bot. 2019, 124, 179–187. [Google Scholar] [CrossRef]
  94. Wooller, R.; Russell, E.; Renfree, M.; Towers, P. A comparison of seasonal changes in the pollen loads of nectarivorous marsupials [Tarsipes] and birds [Honeyeaters]. Wildl. Res. 1983, 10, 311–317. [Google Scholar] [CrossRef]
  95. Blake, S.T. Flowering and seeding habits in some species of Banksia. QLD Natur. 1971, 20, 21–24. [Google Scholar]
  96. Frick, K.M.; Ritchie, A.L.; Krauss, S.L. Field of dreams: Restitution of pollinator services in restored bird-pollinated plant populations. Restor. Ecol. 2014, 22, 832–840. [Google Scholar] [CrossRef]
  97. Llorens, T.M.; Byrne, M.; Yates, C.J.; Nistelberger, H.M.; Coates, D.J. Evaluating the influence of different aspects of habitat fragmentation on mating patterns and pollen dispersal in the bird-pollinated Banksia sphaerocarpa var. caesia. Mol. Ecol. 2012, 21, 314–328. [Google Scholar] [CrossRef]
  98. Krauss, S.; He, T.; Barrett, L.; Lamont, B.; Enright, N.; Miller, B.; Hanley, M. Contrasting impacts of pollen and seed dispersal on spatial genetic structure in the bird-pollinated Banksia hookeriana. Heredity 2009, 102, 274–285. [Google Scholar] [CrossRef] [Green Version]
  99. He, T.; Krauss, S.L.; Lamont, B.B.; Miller, B.P.; Enright, N.J. Long-distance seed dispersal in a metapopulation of Banksia hookeriana inferred from a population allocation analysis of amplified fragment length polymorphism data. Mol. Ecol. 2004, 13, 1099–1109. [Google Scholar] [CrossRef] [PubMed]
  100. Fisher, R. Statistical Methods for Research Workers; Oliver and Boyd: Edinburgh, UK, 1954. [Google Scholar]
Figure 1. Location of (a) study sites in south-eastern Australia, (b) the two SPAs sampled and (c) source populations for each of the SPAs.
Diversity 13 00039 g001
Figure 2. Mean relatedness (r) estimates based on pairwise comparisons for Banksia marginata using Lynch and Milligan (1994) for (a) remnants and for (c) wild and SPAs; Queller and Goodnight (1989) for (b) remnants and for (d) wild and SPAs. Mean values are the mean level of relatedness within the population. U and L are the 95% confidence intervals around the null hypothesis of ‘No difference’ across the populations. Black lines with error bars are the observed mean relatedness and standard deviation for each group.
Diversity 13 00039 g002
Figure 3. Genomic relationship matrix (G) giving pairwise relatedness (r = 2θ) estimates based on pairwise comparisons using the Wang (2007) estimator for (a) all trees, (b) Euroa SPA only and (c) Benalla SPA only. The diagonal shows the relatedness of an individual to itself (1 + f, where f is Wright’s inbreeding coefficient). Colors other than white indicate close relatedness, with colors darker than orange showing relationships closer than half-sib (half-sibs, full-sibs, parent-offspring). A small number of individuals from Blue Range and Ruffy appear to be clonal or replications of the same tree.
Diversity 13 00039 g003
Figure 4. Principal coordinates analysis results for all Banksia marginata trees based on (a) SSR and (b) SNP datasets.
Diversity 13 00039 g004aDiversity 13 00039 g004b
Figure 5. STRUCTURE analyses for Banksia marginata remnant and SPA trees; each bar represents a single tree. K = 2 for (a) SSRs and (b) SNP. K = 3 for (c) SSRs and (d) SNPs. Green is Cluster 1, blue is Cluster 2, yellow is Cluster 3 and white bars indicate failed reactions.
Diversity 13 00039 g005
Table 1. Collection details and SSR genetic diversity indices of Banksia marginata SPAs and presumed local wild seed sources.
TypeNameNNa (s.e.)Rs (s.e.) *Ho (s.e.)UHe (s.e.)FIS (s.e.)
RemnantBlue Range174.34 (0.99)2.16 (0.28)0.46 (0.10)0.53 (0.09)0.03 (0.13)
Dropmore32.00 (0.27)1.62 (0.19)0.38 (0.13)0.38 (0.10)−0.15 (0.21)
Gobur112.88 (0.40)1.94 (0.17)0.49 (0.12)0.47 (0.08)−0.12 (0.19)
Gulpa†NANANANANANA
Highlands344.38 (0.38)2.01 (0.17)0.55 (0.11)0.48 (0.08)−0.11 (0.12)
Kobyboyn11.63 (0.18)NA0.63 (0.18)0.63 (0.18)NA
Marraweeney213.63 (0.42)2.11 (0.16)0.66 (0.10)0.54 (0.07)−0.20 (0.14)
Omeo53.50 (0.50)2.33 (0.24)0.69 (0.12)0.59 (0.09)−0.29 (0.16)
Tooborac32.63 (0.32)2.28 (0.23)0.38 (0.10)0.60 (0.09)0.27 (0.15)
Ruffy32.38 (0.26)2.07 (0.23)0.67 (0.08)0.58 (0.05)−0.47 (0.14)
Sandy Creek153.88 (0.48)2.24 (0.15)0.63 (0.08)0.57 (0.05)−0.20 (0.10)
Unknown726.75 (0.99)2.44 (0.19)0.58 (0.08)0.64 (0.07)0.05 (0.12)
PooledWild296.00 (1.07)5.97 (1.07)0.55 (0.09)0.59 (0.08)0.05 (0.12)
Euroa SPA1086.88 (0.92)5.22 (0.71)0.56 (0.08)0.58 (0.08)0.00 (0.11)
Benalla SPA505.88 (0.95)5.29 (0.88)0.60 (0.08)0.62 (0.06)0.00 (0.12)
* based on 2 diploid individuals for unpooled (i.e., population-level) samples and 28 diploid individuals for pooled (i.e., combined as wild or SPA) samples. N, number of trees sampled; Na, number of alleles; Rs, allelic richness; Ho, observed heterozygosity; UHe, unbiased expected heterozygosity; FIS, inbreeding coefficient; s.e. standard error. † included in SNP dataset only. NA, not estimated.
Table 2. Collection details and SNP genetic diversity indices of Banksia marginata SPAs and presumed local wild seed sources.
TypeNameNRs (s.e.) *Ho (s.e.)He (s.e.)FIS (s.e.)
RemnantBlue Range191.26 (<0.01)0.21 (<0.01)0.25 (<0.01)0.16 (<0.01)
Dropmore31.18 (<0.01)0.20 (<0.01)0.15 (<0.01)−0.33 (<0.01)
Gobur131.23 (<0.01)0.22 (<0.01)0.22 (<0.01)0.00 (<0.01)
Gulpa†11.12 (<0.01)0.12 (<0.01)0.06 (<0.01)NA
Highlands391.26 (<0.01)0.23 (<0.01)0.26 (<0.01)0.12 (<0.01)
Kobyboyn11.25 (0.01)0.25 (<0.01)0.13 (<0.01)NA
Marraweeney231.22 (<0.01)0.23 (<0.01)0.21 (<0.01)−0.10 (<0.01)
Omeo51.23 (<0.01)0.20 (<0.01)0.21 (<0.01)0.05 (<0.01)
Tooborac41.26 (<0.01)0.21 (<0.01)0.22 (<0.01)0.05 (<0.01)
Ruffy31.24 (0.01)0.24 (<0.01)0.20 (<0.01)−0.20 (<0.01)
Sandy Creek151.25 (<0.01)0.22 (<0.01)0.24 (<0.01)0.17 (<0.01)
Unknown831.31 (<0.01)0.23 (<0.01)0.30 (<0.01)0.23 (<0.01)
PooledWild321.87 (0.005)0.22 (<0.01)0.29 (<0.01)0.24 (<0.01)
Euroa SPA1201.92 (0.003)0.23 (<0.01)0.31 (<0.01)0.27 (<0.01)
Benalla SPA571.82 (0.006)0.23 (<0.01)0.28 (<0.01)0.17 (<0.01)
* based on 28 diploid individuals for pooled (i.e., combined as wild or SPA) samples. N, number of trees sampled; Na, number of alleles; Rs, allelic richness; Ho, observed heterozygosity; He, expected heterozygosity; FIS, inbreeding coefficient; s.e. standard error. † included in SNP dataset only. NA, not estimated.
Publisher’s Note: MDPI stays neutral with regard to jurisdictional claims in published maps and institutional affiliations.

