Abstract
As secondary forests become more common around the world, it is essential to understand successional pathways to ensure their proper forest management. Despite optimism about secondary forests in terms of landscape restoration, the influence of invasive species on their development has been poorly explored. Here, forest plots in the Araucaria Forest, Southern Brazil, are used to compare forest dynamics over a 14-year period between unmanaged bamboo forest development (control) and the removal of bamboo. Six control plots (15 × 15 m) were monitored for all adult trees since 2007 alongside six adjacent removal plots; after the initial measurement of the control in 2007, all plots were measured bi-annually from 2010 to 2020. Comparisons were based on tree species diversity, composition, and structure parameters. Removal plots show a trend towards developing a forest composition with more secondary and late successional species while the control plots demonstrate succession restricted to the pioneer trees that regenerated immediately after bamboo die-off (2005–2006). Without the presence of bamboos, removal plots are mirroring the well-known successional pathway typical of the Araucaria Forest. Conversely, bamboos are effectively arresting successional development in the control, resulting in lower levels of diversity and less complex forest structure. For the first time, this study presents a direct analysis of the influence of bamboos on forest succession, providing evidence on which practices to manage bamboo forests can be developed so these secondary forests can fulfill their ecological and economic potential.
1. Introduction
Natural ecosystems, especially forests, have been subjected to unprecedented degradation that has reduced their overall land cover [1]; this has resulting in habitat reduction, fragmentation, and biodiversity extinction [2,3], all of which have the potential to threaten the well-being of future generations [4]. After forests are clear-cut and large tracts of land are abandoned following improper agriculture and pasture management, secondary forests are increasingly becoming part of the world’s landscape [1]. In this context, it is essential to understand which successional pathways and mechanisms are taking place to inform management policies and support the development of silvicultural practices that will ensure effective and balanced conservation, ecosystem services and production strategies of regenerating forests.
Secondary forests are described as being highly productive and resilient [5] with potential for carbon sequestration and maintaining important levels of biodiversity [6]. They are integral to forest landscape restoration efforts [7] where forest diversity and composition have the potential for recovery through long-term natural succession [8]. Although some successional pathways have been studied [9], there is still the need for a better understanding as to whether secondary forests can deliver the expected environmental and economic benefits considering current challenges linked to climate change and invasive species and to inform proper management practices [10].
One of the biggest current challenges in forest management is the increasing threat to forest health due to invasive species (e.g., [11]). Bamboos have been shown to be an important ecological driver in different parts of the world, where its invasive behaviour is hindering the natural succession of secondary forests and so causing losses to biodiversity and productive opportunities. Previous studies have described the short-to-medium-term effects of bamboos on forest regeneration and adult populations, showing that their presence as a dominant species hinders the ability of recruits from the seed bank to successfully develop [12,13,14,15,16], ultimately leading to the impoverishment of forest structure and tree diversity [17]. However, to date no study has tested the influence of bamboo dominance on forest dynamics directly in the field by comparing forest dynamics in plots dominated by bamboos to plots that are kept bamboo free.
Bamboos, as native invasive species (sensu [18,19]), have dominated many secondary forests in Southern Brazil and other parts of the world, effectively arresting their successional development [17,20,21,22,23]. This can have important ecological implications that might require active management [21,23]. Despite the information already gathered, no study has used experimental data to directly test for such causality. This study aims to determine the influence of bamboos on forest succession in the long-term. To test this, I monitored forest succession over a 14-year period to compare tree species diversity and composition, and forest structure between forests plots with bamboo presence (control) and plots where bamboos were removed (removal).
2. Material and Methods
2.1. Study Area
This study was conducted in the Embrapa Research Station in Caçador (ERSC), Santa Catarina State, Brazil (26°50′32.69″ and 26°52′36.7″ S, 50°54′51.69″ and 51°58′40.36″ W; (Figure 1). The ERSC, covers an area of 1,157 ha and is characterized by the subtropical humid forest of Southern Brazil (locally known as Araucaria Forest) that occurs in subtropical highland climates (Cfb) with high annual precipitation (~1694 mm) with elevation varying from 800 to 1060 m asl [21]. Currently, around 5% of the original forest cover remains as primary forest, with 20–25% as secondary forest [24,25]. Because of its unique flora and high levels of deforestation, this ecosystem is considered a hotspot for the conservation of biodiversity [26].
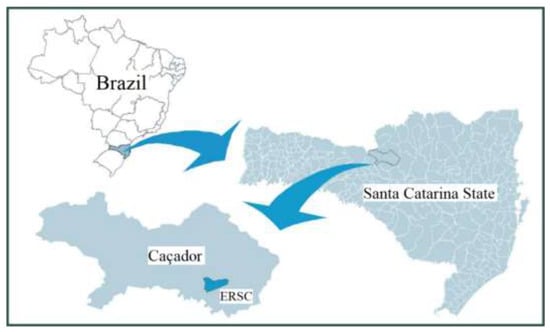
Figure 1.
Location of the Embrapa Research Station in Caçador (ERSC), Santa Catarina State, Brazil.
In the ERSC, some areas are still covered by old-growth forests, widely recognized as the region’s late successional stage, in which bamboos are present at low densities in the understory and are a natural, but not defining, element of the forest structure [27,28,29]. These forests are dominated by Araucaria angustifolia, Ocotea porosa and other Lauraceae species, Ilex paraguariensis (yerba mate) and other Aquifoliaceae species, Cedrela fissilis, and many Myrtaceae species, among others; in the ERSC, old-growth forest have a basal area of ~45.24 m2 ha−1, a density of 201 trees ha−1 (DBH > 19.09 cm) [30] and a general maximum number of tree species of 71 [31]. On the other hand, forests that were subjected to more intense historical harvesting levels are dominated by secondary species such as Cupania vernalis, Ocotea puberula, Matayba elaeagnoides, Clethra scabra, Lithrea brasiliensis, among others [32], a typical pattern observed in the region [33].
The ERSC has been under government stewardship since the 1930s and was set aside due to large populations of A. angustifolia and O. porosa, although logging continued for some time resulting in some clear-cut areas, with selective logging occurring in the most easily accessible areas until the 1990s [34]. After historical logging in the ERSC, large tracts of previously clear-cut areas are currently covered by younger forests characterized by pioneer species (primarily Mimosa scabrella Benth. and Piptocarpha angustifolia Dusén ex Malme) with bamboos (mainly M. skvortzovii) dominating the understory (Figure 2A,B). In these young forests, native bamboo species have shown intense population growth, creating in some areas near monospecific forest stands [35].
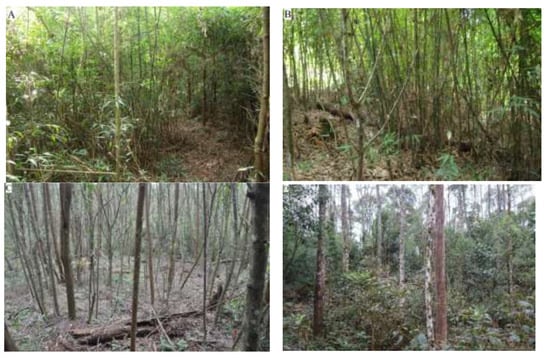
Figure 2.
Overview of the understory in a control plot in 2010 (A) and 2020 (B) showing consistent bamboo dominance, and a removal plot in 2010 (C) and 2020 (D) depicting successional development in the absence of bamboos.
This bamboo species has a life cycle of 30–32 years [36,37,38], and the last synchronised flowering was observed between 2004 and 2006 when the entire ERSC bamboo population died and subsequently recolonized through seed germination. Three years after germination, M. skvortzovii culms were fully recovered and reached about 1.5 m in height, by year five they reached 2.5–4 m, and by year seven 5–8 m [21]. Bamboos were measured periodically for reference but were not monitored for this study.
2.2. Methodology
I compared secondary forest development with and without the dominance of bamboos (control and removal, respectively) over a 14-year period (2007–2020) with data collected in July and August in 2007, 2010, 2012, 2014, 2016, 2018, and 2020; the control plots are dominated by bamboos and were not subjected to any interference; removal plots had bamboo populations removed periodically upon resprouting. As removal plots were installed in 2010, for some comparisons I used data from the control in 2007 as a proxy for its diversity and structure.
Using a lottery system, I randomly chose six out of the 20 Bamboo plots set up in 2006-2007 in the ERSC as the control (see [21]) after which I established a companion removal plot for comparison. In order to ensure that comparisons were based on similar environmental conditions, the analysis was restricted to the six control-removal plot pairs. All plots were established following cardinal orientation with the south-west corner as the initial point of reference. Nearly adjacent to each control plot (about 5–10 m distant), I established one removal plot, always parallel on the east side of its accompanying control plot. The distance between control and removal plots were established to allow for movement around and between plots, thus diminishing the impact of unnecessary traffic inside plots (i.e., researchers trampling bamboo and tree seedlings), and to ensure no reciprocal interference between treatments (i.e., light conditions from removal plots that could influence the control treatment and vice-versa). Plot corners were marked with 1.5 m PVC water pipes for visibility and long-term durability. During monitoring, the team verified that corner markers were still intact and when necessary, they were replaced. As such, a total of 12 plots, each of 225 m2 (15 × 15 m), were monitored in which all trees with a minimum height of 1.5 m (H) and diameter at breast height (DBH) of 3.18 cm were botanically identified (based on the team’s field knowledge, and sampled when necessary for later confirmation in the herbarium), tagged, and measured for height (using a Suunto clinometer) and DBH (tape measure); the minimum values are the threshold for trees to be considered adults. I also classified species into ecological groups (pioneer, secondary, and late successional) based on Budowski [39], specialized literature (e.g., [40]), and the team′s experience.
Bamboo forests (control) are young secondary forests with a simplified structure and species composition where the canopy is dominated by pioneer tree species (mostly Mimosa scabrella but also Vernonanthura discolor and Piptocarpha angustifolia) and the understory is occupied by the bamboo species M. skvortzovii (regionally known as taquara-lixa). In the study region, secondary forests tend to follow a predictable successional pathway towards an increasingly complex diversity and structure. After an initial successional stage dominated by pioneer species [41], the forest develops towards the typical Araucaria forest that characterizes the Southern Brazil Plateau [27]. In this region, A. angustifolia dominates the canopy and becomes an iconic feature that defines the landscape, developing its unique crown in the shape of a flat-topped candelabra as it ages.
I assessed and compared the species diversity between control and removal and among years for each forest type by using diversity parameters based on collected and extrapolated data. For collected data I used EstimateS v9.1.0 [42] to calculate the number of shared species between forest types (Sshared; without replacement configuration), number of species exclusive to each forest type (SExcl), and the total number of species (Stotal). I also used iNEXT Online software [43] to calculate empirical diversity as the effective number of species based on Hill numbers described by their q-values (qD), where: 0D is species richness; 1D is the algebraic logarithmic transformation of the Shannon–Wiener Index; and 2D is the inverse of the Simpson concentration [44]. The comparisons between forest types and among years using Hill numbers was considered significantly different when confidence intervals did not overlap. While Hill numbers allow for the comparison of diversity between forest type, based on different aspects of their species composition and abundance, SExcl and Sshared focus on the number of species that are exclusive to a forest type and how their diversity influences overall diversity (Stotal).
Species diversity extrapolation curves were calculated using iNEXT to standardize to a common sample size following Chao et al. [43]. Calculations were set up with 500 bootstrap replications, a confidence interval of 0.95, and with an endpoint of twice the smallest reference sample size or the maximum reference sample size, whichever is larger [43,45].
The differences in species diversity and composition over time between control and removal plots were calculated through the nonparametric multi-response permutation procedures (MRPP) statistical analysis (based on the Sorensen distance) with accompanying indicator species analysis (ISA; Dufrêne and Legendre method with 4999 permutations) in the software PC-ORD v7.08 [46]. MRPP tests the significance of the differences between two or more groups of sampling units; it does not require distributional assumptions typical of parametric tests which are uncommon for ecological data [46].
I used Mixed Models with Repeated Measures (MMRM) to assess significance between treatments (control and removal) in relation to the available forest structure parameters in the NCSS 2019 software [47] following the software recommendations and as applied elsewhere [17,21] in which the Akaike Information Criterion (AIC) was used to compare model covariance structures among analyses where the lowest AIC value was chosen. Additionally, the settings were based on a single fixed factor (forest type, ecological group, or size class, depending on the analysis), without covariates, and the type of likelihood equation set to restricted maximum likelihood (REML). The forest structure parameters analysed were: density (N, no. of trees. ha−1); basal area (G, m2 ha−1); mean height (, m); and mean DBH (, cm). Results for forest structure were compared across the 2007–2020 period, between years for control and removal, and used to assess population arrangement among species ecological groups.
3. Results
3.1. Species Diversity and Composition
The results based on empirical data show that species richness (0D) surged from 9 to 16 tree species in the control between the first year monitored after the bamboo die-off (2007) and the second measurement (2010), after which the richness decreased continuously reaching 12 in 2020 (Table 1; see Supplementary Figure S1 for extrapolated results). Furthermore, richness also surged in removal from 2007 to 2010 (based on 2007 control baseline) increasing from nine to 20 species. From 2010, richness continued to increase until 2020 when 29 species were recorded. Such divergent trends rendered significant differences in richness between control and removal beginning in 2014. The species diversity based on the effective number of species (algebraic logarithmic-transformed Shannon–Wiever index; 1D) was relatively stable in control at around 4.7–5.2 species (after an increase in 2010). Removal showed a different pattern where values increased quickly from 5.16 species (2012) to 7.45 in 2014 and finally reached 18.02 in 2020 (all values from 2014 onwards were significantly different between forest types). Finally, the effective number of species based on the inverse Simpson concentration index (2D) increased consistently in both treatments, although only slightly in control and more noticeably in removal, particularly from 2018 onwards (significant differences were observed starting in 2016).

Table 1.
Calculated tree species diversity for control and removal plots based on empirical Hill numbers (qD; q = 0 to 2), number of species exclusive to one forest type (Sexcl), number of shared species between forest types (Sshared), and total number of species in both forests (Stotal).
Overall richness (Stotal) was basically stable during most of the study period (after a sharp increase from 2007–2010) and varied between 29 and 30 species. However, the distribution between treatments was quite different. While control showed more exclusive species at the beginning of monitoring (2007), such a distribution was quickly inverted where no exclusive species in the control treatment were found in 2020 (in contrast with 17 in removal); by 2020 all species found in control were also found in removal, resulting in a greater number of shared species (Sshared).
Species composition analysed by MRPP resulted in significant A values (chance-corrected within-group agreement; p < 0.05) ranging from 0.085 in 2012 to 0.156 in 2020, except for 2014 in which A values reached 0.074 (p = 0.056). The complementary ISA showed that in the control there were no species that differentiated its composition. Removal, on the other hand, had three pioneers as indicator species in 2010, one pioneer species for most of the monitoring period, and three detected in 2020 (one pioneer, one secondary, and one late successional; see Supplementary Table S1 for list of species groups by successional stage).
The statistical analysis for density showed an overall significant difference between treatments (F(1, 90.1) = 140.3; p < 0.00000) with removal being consistently more diverse. When analyzed on a yearly basis, there was a general reduction in p-values throughout the study (Table S2), although 2012 and 2014 were not significantly different. The number of trees showed a marked increase in both treatments in 2010 after which they declined but with different trends. Removal tended toward stabilization where a reduction of only 0.4% between 2018 and 2020 was observed by 2020; in the control, density reduced continuously (33.3% less trees in 2020 compared with 2018; Figure 3 and Supplementary Table S2). Consequently, the difference between forests reached around 200% in 2020 (1593 trees in removal and 533 in the control) with significant differences in 2010 and from 2016 onwards (Supplementary Table S2).
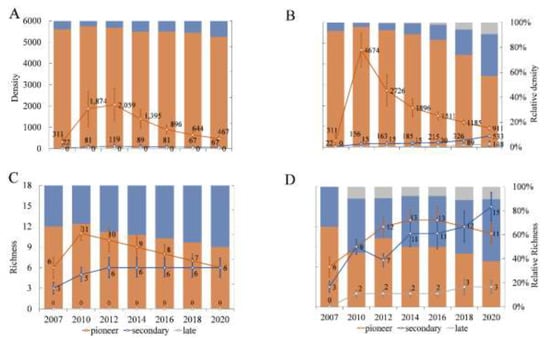
Figure 3.
Density (no. trees.ha−1, lines) and relative density (no. trees.ha−1%, columns) for control (A) and removal (B), and richness (number of species—S, lines) and relative richness (% of number of species, columns) for control (C) and removal (D) for the different species successional groups. Bars around values represent standard deviations. Values for removal 2017 are from control as reference.
The analysis of density and relative density by successional group showed that pioneers increased in both treatments in the initial monitoring phase after which it declined abruptly, but always maintaining levels above the initial values (Figure 3). Specifically, density of pioneer species peaked in control in 2012 with an increase of 562% in relation to 2007 (311 and 2059 trees, respectively), and subsequently declined steadily until reaching 467 trees in 2020, a value still 50% higher than 2007. Similarly, in removal the number of pioneer trees peaked in 2010 with an increase of 1,403% in relation to 2007 (4674 and 311 trees, respectively) and then declined continuously until 2020 when 911 were observed (193% higher than 2007). The relative density (in relation to the total number of trees) of the pioneer group also declined throughout the study after surging in 2010 when around 96% of the trees were pioneers in both forests. Despite the initial similarity, by 2020 the density of pioneers in removal were much lower than control (57.2 and 87.5%, respectively).
The secondary species group showed different patterns between treatments. In control, density decreased (after an initial increase in 2010) although its relative density was considerably higher in 2020 (6.7% in 2007 and 12.5% in 2020). On the other hand, secondary species showed a constant increase in density and relative density in removal, reaching 33.5% relative density by 2020 (compared with 6.7% in 2007 and 3.2% in 2010). Finally, the late successional group was markedly different between forests with no individuals observed in control, whereas an increase in both number of trees and species was detected for absolute and relative density values in removal.
In relation to the number of species (richness) by successional group, the control showed an initial increase of pioneer species after which it declined to reach its earliest value (six species). Nevertheless, the relative richness showed a constant decline, ending at 50% after its peak in 2010 (Figure 3). In removal, pioneer species also increased initially, maintaining higher levels (13 species) until 2016 and falling to 11 species by 2020. However, the relative richness values in most years were at 50% or lower (except for 2012 with 57.5%), showing a tendency of decline (37.5% in 2020). The secondary species group increased in both forests throughout the study reaching similar values of around 50% in 2020. Lastly, late successional species diversity was absent in control while in removal they showed a slight increase (two to three species) with relative richness varying between 8 and 11%.
3.2. Forest Structure
The overall statistical analysis for stand basal area (G) showed a significant difference between treatments (F(1,15.9) = 117.3; p = 0.000118), although the yearly analysis showed significance only in 2010 (Supplementary Table S2). Additionally, the yearly analysis for each treatment independently only showed significant differences between 2010 and all other years in control. No significant differences were found in removal. G in control increased quickly to nearly double in the first three measurements (4.32 m in 2007, 9.91 in 2010, and 16.45 in 2012) after which values remained around 18 m2.ha−1 (Supplementary Table S2). On the other hand, removal began with 20.98 m2.ha−1 in 2010 (assuming a similar value to control in 2007) and varied from 19 and 22 m2.ha−1 until 2020.
The statistical analysis for mean height () showed that there is a significant difference between treatments (F(1,106.1) = 185.8; p = 0.000000) and for all years with the exception of 2010 (Table S2). Furthermore, the yearly analysis for each treatment independently showed significant differences between years in most cases for control (except for comparisons between successive monitoring years). For removal, the differences were significant only in relation to 2010. The mean height in control increased consistently throughout the study, with a difference of around 297.5% between 2007 and 2020 (4 and 15.9 m, respectively; Table 2, Figure 4). During the 2007–2014 period, there was an average increase of about 43%, which fell to 12% between 2016 and 2020. In contrast, in removal was 50% higher in 2020 in relation to 2010 (8.1 and 5.4 m, respectively), but varied throughout the study period. There was a constant increase until 2018, after which the values began to decline, averaging 8.1 m in 2020 after peaking at 9.3 m in 2018 (a decrease of 13.9%).
Table 2.
Results of the analysis between control and removal for density (N, no. trees.ha−1), stand basal area (G, m2.ha−1), mean height (, m), and mean DBH (, cm).
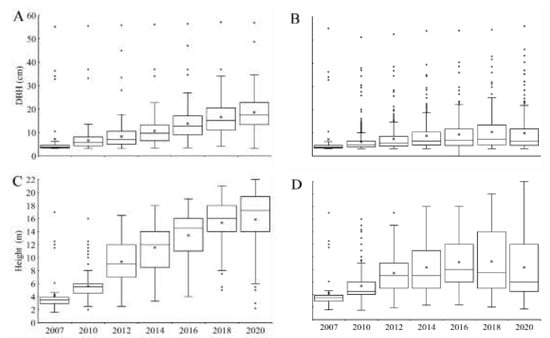
Figure 4.
Population distribution based on DBH (m2) and height (m) for control (A,C) and removal (B,D) between 2007 and 2020. X indicates the mean and O indicates outliers.
The overall statistical analysis for showed a significant difference between treatments (F(1,90.1) = 140.3; p = 0.000000) and for all years after 2012 (Supplementary Table S2). Furthermore, the yearly analysis for each treatment independently showed in general significant differences between years for control (except for 2016–2018 and 2018–2020). For removal, the differences were significant in most cases in comparison with 2010 and 2012. in control increased consistently during the study, with a difference of around 182% between 2007 and 2020 (6.6 and 18.6 m, respectively) and a yearly average increase of about 23% from 2010 to 2020 (Supplementary Table S2, Figure 4). In contrast, in removal was 59% higher in 2020 than 2010 (9.7 and 6.1, respectively), although the trend was variable. DBH distribution in control showed a concentration of gradually higher values throughout the study (Figure 4A). In contrast, values were concentrated in a much lower range (<10 cm; Figure 3B) for removal, yet with an increasing number of higher values that contrast with the general distribution (outliers). Similarly, H showed a progressive concentration in higher values in control in contrast to removal. In the latter, after an initial increase the trend inverted, with the mean declining and the general distribution concentrated in a lower range by the end of the study (Figure 4C,D).
4. Discussion
4.1. Species Diversity and Composition
The results show an initial increase (2007–2010) in species diversity (0–2D) in control, which is consistent with rapid recruitment and tree development [17] after improved light conditions due to bamboo die-off (2005–2006), as observed in other studies [17,20,21]. The same process was detected in removal but with higher values. These trends begin to diverge by 2014 when richness starts to decline in control as a response to the re-establishment of bamboos. This process began to affect recruitment in 2012 [21] but is observed herein for adults only in 2014. On the other hand, in removal, regeneration and adult development were not constrained by the presence of bamboos; therefore, the diversity of species continued to increase.
In removal, as diversity increased over time, there was a change in species composition in which pioneers decreased continuously both in terms of richness and density, while secondary and late succession species consistently increased. In contrast, the density for both pioneer and secondary species declined in control, along with an overall reduction in diversity (with no late successional species observed).
These trends suggest that ecological succession was kickstarted with the removal of bamboo. This should lead to further reductions of the pioneer population (in terms of density and diversity) and the development of a forest composition and structure dominated by secondary and late successional species. Furthermore, as bamboos re-established in control (see [21] for information on bamboo population) the results show a continuous trend toward a forest with lower density and less richness where succession is effectively arrested, as detected by Lacerda and Kellermann [17]. This trend also corroborates the observations by Greig et al. [48] through remote sensing for the same area, in which the bamboo-dominated forest is characterized by an open canopy with a declining density of pioneer trees that typically have a short life span similar to the mid-term phase of the bamboo cycle (i.e., approximately 15 years).
Successful bamboo re-establishment after die-off was also found in other studies in South America and China indicating the capacity of bamboos to re-colonize young, secondary, or logged old-growth forests, creating an environment in which tree seedlings can only find ideal growth conditions during the short period immediately after bamboo die-off [17,20,23,49,50,51].
4.2. Forest Structure
Forest structure also showed divergent patterns between control and removal for all parameters. Density differed significantly as early as 2010 which likely shows that the effects of bamboo recolonization in control was already affecting recruitment and the number of plants that developed into adults. However, in removal, recruitment and adult growth continue undisturbed. Furthermore, DBH and height distribution in control show that the adult cohort was the result of an initial and isolated successful recruitment that took place after bamboo die-off; in contrast, there was continuous recruitment in removal throughout the study. As a result of such recruitment, a reduction in mean height and DBH values began to occur in 2018 as the proportion of young trees increased in relation to the more developed trees that established initially after bamboo die-off.
The increasing stand basal area pattern in control until 2018 was a result of rapid pioneer tree growth in diameter and height until thinning and senility began to limit their influence. This caused a reduction in stand basal area despite a continuous increase in mean height and DBH. In contrast, removal showed higher overall density resulting from the development of new adults that originated from successful recruitment. Along with the growth of the initial surge of pioneers observed after bamboo die-off, this helped to make up for the declining trend in density and therefore maintain a relatively stable stand basal area.
Even though stand basal area showed no significant differences for most of the study, with values within the expected range for natural young forest stands [52], species composition, density, and mean height and DBH distribution are already showing different successional mechanisms (competition, establishment) that drive the changes in both treatments. Specifically, removal shows a more stable density which clearly indicates the influence of new adults that are established increasingly from secondary (e.g., I. paraguariensis) and late successional groups (e.g., O. porosa). In fact, these changes mirror the well-known successional pathway typical of the Araucaria Forest where vegetation composition changes over time, transitioning from a young forest dominated by pioneer tree species (M. scabrella, P. angustifolia and V. discolor) [32,41,48] into more diverse and complex stands that are characterized by I. paraguariensis and O. porosa, among others (e.g., [27,28,53]).
On the other hand, because successful recruitment in control is hindered by bamboos, the observed forest structure is reliant solely on the initial tree regeneration that took place immediately after bamboo die-off. As density decreases due to pioneer trees reaching the end of their life span, the forest canopy becomes more open, creating even more beneficial light conditions for bamboos. It is expected that this low-density open canopy forest [48] structure will continue until the next bamboo die-off takes place, creating a closed cycle in which the forest continues to return to the initial stages of development, effectively arresting succession as has been suggested by Griscom and Ashton [15], Kellermann and Lacerda [21], Lacerda and Kellermann [17], and others.
5. Conclusions
This study offers, for the first time, a comparative analysis to test the effects of bamboo dominance on structure and diversity of young forests through the monitoring of forest development in plots with and without the presence of bamboo. The 14-year study corresponds to approximately half of the life cycle of M. skvortzovii and was sufficient to show long-term trends and shed light on the two divergent successional pathways that take place when bamboos are the main ecological driver: (i) bamboo dominance sustains a self-perpetuating cycle determined by its life-history that is complemented by the development of few pioneer tree species; and alternatively (ii) when bamboos are removed, forest succession is not restricted and the natural successional process can continue. As such, pioneer tree species are successively replaced by secondary and late succession species, increasing forest diversity and structural complexity.
As the ecological impacts of bamboo dominance on species diversity and forest structure are clear, this information can be used to develop better management policies for conservation and production. Specifically, a deeper understanding about the different successional pathways should allow for better ecosystem management which considers biodiversity conservation in the region [34] and the wider landscape [54], forest composition dynamics [48,55] and their relation to silviculture and forecasting of forest products [56,57], carbon sequestration [58,59] as part of climate change mitigation and adaptation efforts [60], nature-based solutions [61], and community-based forestry and agroforestry [62], among others.
Current prohibitive environmental legislation in Southern Brazil is a response to historical deforestation that almost completely eradicated old-growth Araucaria Forests. The result of this legislation has been a resurgence of secondary forests in the region where about 25% of the original forested area is now young forests. However, large tracks of such forests are bamboo-dominated, which indicates reduced value in terms of conservation and production. As we begin to fully understand the relationship between bamboos and successional pathways and mechanisms in forests in Southern Brazil, it is becoming clear that there is a need to establish new regulations and practices to restore forest resources. Traditional ecological knowledge has long been integral to forest management, including the control of bamboo, and should be integrated into public policies in order to transform local communities into forest stewards. Evidence-based knowledge is now available to support discussions around the need to manage bamboo-degraded forests that should be brought out of the realm of academia and transferred into concrete public policies. Maintaining the status-quo might lead to further forest degradation and impoverishment of rural communities.
Supplementary Materials
The following are available online at https://www.mdpi.com/article/10.3390/d13110567/s1, Figure S1: Interpolated and extrapolated curves of the effective number of species based on Hill numbers: 0D is the species richness, 1D is the algebraic logarithmic transformation of Shannon-Wiener Index, and 2D is the inverse of the Simpson concentration; Table S1: List of species grouped by successional stage and their abundance by treatment and year; Table S2: Results for statistical significance (p-values) using mixed model statistics for comparisons between control and removal during the 2010–2020 period and between years for control and removal separately for stand basal area (G, m2.ha−1), density (N, no. trees.ha−1), mean diameter (DBH, cm) and mean height (H, m). Annual values and standard deviations (SD) are also included for each parameter. * Denotes significant difference at 𝛼 = 0.05 after Bonferroni correction.
Funding
This research was made possible through the financial support of the Brazilian Agriculture Research Corporation (EMBRAPA) (3.13.07.007.00).
Institutional Review Board Statement
Not applicable.
Data Availability Statement
Data is contained within the article or supplementary material.
Acknowledgments
I thank Betina Kellermann, Arnaldo Soares, Carlos Roberto Urio and Maria Izabel Radomski (in memoriam) for their assistance with data collection and botanical identification, and Gilberto Terra for initial plot set up and data collection. Finally, I thank Evelyn Nimmo for technical assistance and editing the article.
Conflicts of Interest
The authors declare no conflict of interest.
References
- FAO. Global Forest Resources Assessment 2020: Main Report; FAO: Rome, Italy, 2020; ISBN 9789251329740. [Google Scholar]
- Pimm, S.L.; Jenkins, C.N.; Abell, R.; Brooks, T.M.; Gittleman, J.L.; Joppa, L.N.; Raven, P.H.; Roberts, C.M.; Sexton, J.O. The biodiversity of species and their rates of extinction, distribution, and protection. Science 2014, 344, 1246752. [Google Scholar] [CrossRef] [PubMed]
- Alroy, J. Effects of habitat disturbance on tropical forest biodiversity. Proc. Natl. Acad. Sci. USA 2017, 114, 6056–6061. [Google Scholar] [CrossRef]
- Malhi, Y.; Gardner, T.A.; Goldsmith, G.R.; Silman, M.R.; Zelazowski, P. Tropical forests in the anthropocene. Annu. Rev. Environ. Resour. 2014, 39, 125–159. [Google Scholar] [CrossRef]
- Poorter, L.; Bongers, F.; Aide, T.M.; Almeyda Zambrano, A.M.; Balvanera, P.; Becknell, J.M.; Boukili, V.; Brancalion, P.H.S.; Broadbent, E.N.; Chazdon, R.L.; et al. Biomass resilience of Neotropical secondary forests. Nature 2016, 530, 211–214. [Google Scholar] [CrossRef]
- Matos, F.A.R.; Magnago, L.F.S.; Aquila Chan Miranda, C.; de Menezes, L.F.T.; Gastauer, M.; Safar, N.V.H.; Schaefer, C.E.G.R.; da Silva, M.P.; Simonelli, M.; Edwards, F.A.; et al. Secondary forest fragments offer important carbon and biodiversity cobenefits. Glob. Change Biol. 2020, 26, 509–522. [Google Scholar] [CrossRef] [PubMed]
- Stanturf, J.A.; Kant, P.; Lillesø, J.-P.B.; Mansourian, S.; Kleine, M.; Graudal, L.; Madsen, P. Forest Landscape Restoration as a Key Component of Climate Change Mitigation and Adaptation; International Union of Forest Research Organizations (IUFRO): Vienna, Austria, 2015; Volume 34, ISBN 9783902762504. [Google Scholar]
- Van Breugel, M.; Hall, J.S.; Craven, D.; Bailon, M.; Hernandez, A.; Abbene, M.; Van Breugel, P. Succession of ephemeral secondary forests and their limited role for the conservation of floristic diversity in a human-modified tropical landscape. PLoS ONE 2013, 8, e82433. [Google Scholar] [CrossRef] [PubMed]
- Norden, N.; Chazdon, R.L.; Chao, A.; Jiang, Y.H.; Vílchez-Alvarado, B. Resilience of tropical rain forests: Tree community reassembly in secondary forests. Ecol. Lett. 2009, 12, 385–394. [Google Scholar] [CrossRef] [PubMed]
- Arroyo-Rodríguez, V.; Melo, F.P.L.; Martínez-Ramos, M.; Bongers, F.; Chazdon, R.L.; Meave, J.A.; Norden, N.; Santos, B.A.; Leal, I.R.; Tabarelli, M. Multiple successional pathways in human-modified tropical landscapes: New insights from forest succession, forest fragmentation and landscape ecology research. Biol. Rev. 2017, 92, 326–340. [Google Scholar] [CrossRef]
- Vyn, R. Estimated Expenditures on Invasive Species in Ontario: 2019 Survey Results; Invasive Species Centre: Marie, ON, Canada, 2019. [Google Scholar]
- Abe, M.; Izaki, J.; Miguchi, H.; Masaki, T.; Makita, A.; Nakashizuka, T. The effects of Sasa and canopy gap formation on tree regeneration in an old beech forest. J. Veg. Sci. 2002, 13, 565–574. [Google Scholar] [CrossRef]
- Holz, C.A.; Veblen, T.T. Tree regeneration responses to Chusquea montana bamboo die-off in a subalpine Nothofagus forest in the southern Andes. J. Veg. Sci. 2006, 17, 19–28. [Google Scholar] [CrossRef]
- Campanello, P.I.; Genoveva Gatti, M.; Ares, A.; Montti, L.; Goldstein, G. Tree regeneration and microclimate in a liana and bamboo-dominated semideciduous Atlantic Forest. For. Ecol. Manag. 2007, 252, 108–117. [Google Scholar] [CrossRef]
- Griscom, B.W.; Ashton, P.M.S. A self-perpetuating bamboo disturbance cycle in a neotropical forest. J. Trop. Ecol. 2006, 22, 587–597. [Google Scholar] [CrossRef]
- Kellermann, B.; Lacerda, A.E.B. Bambus nativos como espécies invasoras no sul do Brasil. In Bambus no Brasil: Da biologia à tecnologia; ICH-Instituto Ciência Hoje: Rio de Janeiro, Brazil, 2017; pp. 179–196. [Google Scholar]
- Lacerda, A.E.B.; Kellermann, B. What is the Long-Term Effect of Bamboo Dominance on Adult Trees in the Araucaria Forest?A Comparative Analysis between Two Successional Stages in Southern Brazil. Diversity 2019, 11, 165. [Google Scholar] [CrossRef]
- Valéry, L.; Fritz, H.; Lefeuvre, J.C.; Simberloff, D. In search of a real definition of the biological invasion phenomenon itself. Biol. Invasions 2008, 10, 1345–1351. [Google Scholar] [CrossRef]
- Valéry, L.; Fritz, H.; Lefeuvre, J.C.; Simberloff, D. Invasive species can also be native... Trends Ecol. Evol. 2009, 24, 585. [Google Scholar] [CrossRef]
- Montti, L.; Campanello, P.I.; Gatti, M.G.; Blundo, C.; Austin, A.T.; Sala, O.E.; Goldstein, G. Understory bamboo flowering provides a very narrow light window of opportunity for canopy-tree recruitment in a neotropical forest of Misiones, Argentina. For. Ecol. Manag. 2011, 262, 1360–1369. [Google Scholar] [CrossRef]
- Kellermann, B.; Lacerda, A.E.B. Arrested development? Investigating the role of bamboo in Araucaria Forest succession in Southern Brazil. J. Plant Ecol. 2019, 12, 1034–1046. [Google Scholar] [CrossRef]
- Griscom, B.W.; Ashton, P.M.S. Bamboo control of forest succession: Guadua sarcocarpa in Southeastern Peru. For. Ecol. Manag. 2003, 175, 445–454. [Google Scholar] [CrossRef]
- Larpkern, P.; Moe, S.R.; Totland, Ø. Bamboo dominance reduces tree regeneration in a disturbed tropical forest. Oecologia 2011, 165, 161–168. [Google Scholar] [CrossRef]
- Vibrans, A.C.; Sevegnani, L.; de Gasper, A.L.; Lingner, D.V. Diversidade e Conservação dos Remanescentes Florestais; Edifurb: Blumenau, Brazil, 2012; ISBN 9788571143302. [Google Scholar]
- Castella, P.R.; Britez, R.M. A Floresta com Araucária no Paraná: Conservação e Diagnóstico dos Remanescentes Florestais; Ministério do Meio Ambiente: Brasilia, Brazil, 2004. [Google Scholar]
- Mittermeier, R.A.; van Dijk, P.P.; Rhodin, A.G.J.; Nash, S.D. Hotspots Revisited: Earth’s Biologically Richest and Most Endangered Ecoregions; CEMEX: Mexico City, Mexico, 2004. [Google Scholar]
- Klein, R.M. O aspeto dinâmico do pinheiro brasileiro. Sellowia 1960, 12, 17–48. [Google Scholar]
- Klein, R.M. Aspectos dinâmicos da vegetação do Sul do Brasil. Sellowia 1984, 36, 5–54. [Google Scholar]
- Leite, P.F.; Klein, R.M. Vegetação. In Geografia do Brasil: Região Sul; IBGE: Rio de Janeiro, Brazil, 1990; pp. 113–150. [Google Scholar]
- Lingner, D.V.; De Oliveira, M.M.; Rosot, N.C.; Dlugosz, L.F. Caracterização da estrutura e da dinâmica de um remanescente de Floresta com Araucária no Planalto Catarinense. Pesqui. Florest. Bras. 2007, 55, 55–66. [Google Scholar]
- Herrera, H.A.R.; Rosot, N.C.; Rosot, M.A.D.; Oliveira, Y.M.M. De Análise florística e fitossociológica do componente arbóreo da floresta ombrófila mista presente na reserva florestal EMBRAPA/EPAGRI, Caçador, SC—Brasil. Floresta 2009, 39, 485–500. [Google Scholar] [CrossRef]
- Maran, J.C.; Rosot, M.A.D.; Figueiredo Filho, A.; Lacerda, A.E.B. Ordenamento florestal por talhões: Metodologia apoiada em SIG e silvicultura para o manejo de florestas nativas. Adv. For. Sci. 2020, 7, 997–1008. [Google Scholar] [CrossRef]
- Vibrans, A.C.; Sevegnani, L.; Gasper, A.L.; Lingner, D.V. (Eds.) Inventário florístico florestal de Santa Catarina; Edifurb: Blumenau, Brazil, 2013; Volume 3. [Google Scholar]
- Lacerda, A.E.B. Conservation strategies for Araucaria Forests in Southern Brazil: Assessing current and alternative approaches. Biotropica 2016, 48, 537–544. [Google Scholar] [CrossRef]
- Lacerda, A.E.B.; Rosot, M.A.D.; Filho, A.F.; Garrastazú, M.C.; Nimmo, E.R.; Kellermann, B.; Radomski, M.I.; Beimgraben, T.; Mattos, P.P.; Oliveira, Y.M.M. Sustainable Forest Management in Rural Southern Brazil: Exploring Participatory Forest Management Planning. Sustain. For. Manag. Case Stud. 2012, 97–118. [Google Scholar] [CrossRef]
- Sendulsky, T. Merostachys multiramea (Poaceae: Bambusoideae: Bambuseae) and similar species from Brazil. Novon 1995, 5, 76–96. [Google Scholar] [CrossRef]
- Giovannoni, M.; Vellozo, L.; Kubiak, G. Sobre as “ratadas” do primeiro planalto paranaense. Arq. Biol. E Tecnol. 1946, 1, 185–195. [Google Scholar]
- Pereira, C. Sobre as ‘ratadas’ no sul do Brasil e o ciclo vegetativo das taquaras. Arq. Inst. Biol. Sao Paulo 1941, 12, 175–195. [Google Scholar]
- Budowski, G. Distribution of tropical American rain forest species in the light of successional processes. Turrialba 1065, 15, 40–42. [Google Scholar]
- Carvalho, P.E.R. Espécies Arbóreas Brasileiras v 5; Embrapa: Brasília, Brasil, 2014. [Google Scholar]
- Klein, R.M. Aspectos fitossociológicos da bracatinga (Mimosa scabrella). In Proceedings of the Seminário sobre Atualidades e Perspectivas Florestais, 4: Bracatinga uma alternativa para refIorestamento. Documentos 5; EMBRAPA-URPFCS: Curitiba, Brasil; 1981; pp. 145–148. [Google Scholar]
- Colwell, R.K. EstimateS: Statistical Estimation of Species Richness and Shared Species from Samples. Version 9.1.0. 2013. Available online: http://purl.oclc.org/estimates (accessed on 4 November 2021).
- Chao, A.; Ma, K.H.; Hsieh, T.C. User’s Guide for iNEXT Online: Software for Interpolation and Extrapolation of Species Diversity. Code 2016, 30043, 1–14. [Google Scholar]
- Chao, A.; Gotelli, N.J.; Hsieh, T.C.; Sander, E.L.; Ma, K.H.; Colwell, R.K.; Ellison, A.M. Rarefaction and extrapolation with Hill numbers: A framework for sampling and estimation in species diversity studies. Ecol. Monogr. 2014, 84, 45–67. [Google Scholar] [CrossRef]
- Jost, L.; Chao, A. Coverage-based rarefaction and extrapolation: Standardizing samples by completeness rather than size. Ecology 2012, 93, 2533–2547. [Google Scholar] [CrossRef]
- PC-ORD. Multivariate Analysis of Ecological Data. Version 7.08 2018. Available online: https://www.wildblueberrymedia.net/pcord (accessed on 04 November 2021).
- NCSS Statistical Software 2021. Available online: https://www.ncss.com/ (accessed on 04 November 2021).
- Greig, C.; Robertson, C.; Lacerda, A.E.B. Spectral-temporal modelling of bamboo-dominated forest succession in the Atlantic Forest of Southern Brazil. Ecol. Modell. 2018, 384, 316–332. [Google Scholar] [CrossRef]
- Montti, L.; Campanello, P.I.; Goldstein, G. Flowering, die-back and recovery of a semelparous woody bamboo in the Atlantic Forest. Acta Oecologica 2011, 37, 361–368. [Google Scholar] [CrossRef]
- González, M.E.; Veblen, T.T.; Donoso, C.; Valeria, L. Tree regeneration responses in a lowland Nothofagus-dominated forest after bamboo dieback in South-Central Chile. Plant Ecol. 2002, 161, 59–73. [Google Scholar] [CrossRef]
- Qing-Pei, Y.; Guang-Yao, Y.; Qing-Ni, S.; Jian-Min, S.; Ming, O.; Hong-Yan, Q.; Xiang-Min, F. Ecological studies on bamboo expansion: Process, consequence and mechanism. Chin. J. Plant Ecol. 2015, 39, 110–124. [Google Scholar] [CrossRef]
- de Souza, R.F.; do Amaral Machado, S.; Figueiredo Filho, A. Modelagem da biomassa total e da lenha por unidade de área para bracatingais nativos. Rev. Arvore 2014, 38, 53–62. [Google Scholar] [CrossRef][Green Version]
- Gomes, J.F.; Longhi, S.J.; Araújo, M.M.; Brena, D.A. Classificação e crescimento de unidades de vegetação em Floresta Ombrófila Mista, São Francisco de Paula, RS. Ciência Florest 2008, 18, 93. [Google Scholar] [CrossRef][Green Version]
- Miller, J.R.; Morton, L.W.; Engle, D.M.; Debinski, D.M.; Harr, R.N. Nature reserves as catalysts for landscape change. Front. Ecol. Environ. 2012, 10, 144–152. [Google Scholar] [CrossRef]
- Gergeron, Y. Species and stand dynamics in the mixed woods of Quebec’s southern boreal forest. Ecology 2000, 81, 1500–1516. [Google Scholar] [CrossRef]
- Bergeron, Y.; Harvey, B. Basing silviculture on natural ecosystem dynamics: An approach applied to the southern boreal mixedwood forest of Quebec. For. Ecol. Manag. 1997, 92, 235–242. [Google Scholar] [CrossRef]
- Franklin, J.F.; Spies, T.A.; Van Pelt, R.; Carey, A.B.; Thornburgh, D.A.; Berg, D.R.; Lindenmayer, D.B.; Harmon, M.E.; Keeton, W.S.; Shaw, D.C.; et al. Disturbances and structural development of natural forest ecosystems with silvicultural implications, using Douglas-fir forests as an example. For. Ecol. Manag. 2002, 155, 399–423. [Google Scholar] [CrossRef]
- Nath, A.J.; Lal, R.; Das, A.K. Managing woody bamboos for carbon farming and carbon trading. Glob. Ecol. Conserv. 2015, 3, 654–663. [Google Scholar] [CrossRef]
- Shi, L.; Feng, W.; Xu, J.; Kuzyakov, Y. Agroforestry systems: Meta-analysis of soil carbon stocks, sequestration processes, and future potentials. L. Degrad. Dev. 2018, 29, 3886–3897. [Google Scholar] [CrossRef]
- IPCC. Climate Change 2014: Mitigation of Climate Change. Contribution of Working Group III to the Fifth Assessment Report of the Intergovernmental Panel on Climate Change; Edenhofer, O., Pichs-Madruga, R., Sokona, Y., Farahani, E., Kadner, S., Seyboth, K., Adler, A., Baum, I., Brunner, S., Eickemeier, P., et al., Eds.; Cambridge University Press: Cambridge, UK; New York, NY, USA, 2014; ISBN 9781107654815. [Google Scholar]
- Lacerda, A.E.B.; Hanisch, A.L.; Nimmo, E.R. Leveraging traditional agroforestry practices to support sustainable and agrobiodiverse landscapes in Southern Brazil. Land 2020, 9, 176. [Google Scholar] [CrossRef]
- Duguma, L.A.; Atela, J.; Ayana, A.N.; Alemagi, D.; Mpanda, M.; Nyago, M.; Minang, P.A.; Nzyoka, J.M.; Foundjem-Tita, D.; Ntamag-Ndjebet, C.N. Community forestry frameworks in sub-Saharan Africa and the impact on sustainable development. Ecol. Soc. 2018, 23, 21. [Google Scholar] [CrossRef]
Publisher’s Note: MDPI stays neutral with regard to jurisdictional claims in published maps and institutional affiliations. |
© 2021 by the author. Licensee MDPI, Basel, Switzerland. This article is an open access article distributed under the terms and conditions of the Creative Commons Attribution (CC BY) license (https://creativecommons.org/licenses/by/4.0/).