Article

Morphometric Analyses Distinguish Wabash Pigtoe (Fusconaia flava) and Round Pigtoe (Pleurobema sintoxia) Mussels

1
Department of Biology, Central Michigan University, Mt. Pleasant, MI 48859, USA
2
Fisheries and Oceans Canada, Great Lakes Laboratory for Fisheries and Aquatic Sciences, 867 Lakeshore Rd., Burlington, ON L7S 1A1, Canada
3
Institute for Great Lakes Research, Central Michigan University, Mt. Pleasant, MI 48859, USA
*
Author to whom correspondence should be addressed.
Diversity 2020, 12(9), 337; https://doi.org/10.3390/d12090337
Submission received: 24 June 2020 / Revised: 25 August 2020 / Accepted: 31 August 2020 / Published: 3 September 2020
(This article belongs to the Special Issue Freshwater Mollusk Conservation)

Abstract

:
Wabash Pigtoe, Fusconaia flava, and the related Round Pigtoe, Pleurobema sintoxia, are freshwater mussels (Bivalvia: Unionidae: Pleurobemini) native to the Great Lakes region of North America. Fusconaia flava is considered widespread and relatively common while P. sintoxia is considered an imperiled species. These species are similar in shell shape and coloration and have confounded many freshwater malacologists, resulting in frequent misidentifications. We sought to determine if morphometric analyses could be used to reliably distinguish between these species. Two hundred and forty-six specimens were collected from rivers in Michigan and Ontario. For each specimen, a preliminary identification was made, shell measurements and foot color (orange or white) were documented, and photos of the left shell valve were taken. A genetic sample was taken from 133 specimens for cytochrome c oxidase subunit 1 (COI) barcoding. COI sequences were used for species identification by comparing to sequences on GenBank. Twenty-one digitized landmarks along the outline of the left valve were analyzed and compared to the results of the DNA barcoding. Landmark data correctly assigned 99.2% of specimens to their DNA-confirmed species identity, compared to 82.0% accuracy of field identifications and 77.0% accuracy for foot color. The creation of a DNA-confirmed morphometric database will aid freshwater malacologists across the Great Lakes region in differentiating between these species.

1. Introduction

For most of the past 200 years freshwater malacologists have primarily used shell characteristics to define freshwater mussel species [1]. Shell characteristics are still used today as a primary means of identification in modern field studies. When first describing the diversity of North America’s 300 plus freshwater mussel species in the late-1700s and early-1800s, naturalists would frequently identify new species solely on the basis of small differences in their shell morphology [1]. These differences in morphology were often later found to result from within-species shell plasticity resulting from varying hydrologic forces in streams and rivers of different sizes [1,2]. This problem of differentiating between important species-level differences in shell morphology versus simple habitat-driven within-species shell plasticity has been greatly assisted by the recent advancement of modern morphometric and genetic techniques.
The accurate identification and taxonomy of freshwater mussel species are still problematic today [3]. Pigtoe mussels (tribe Pleurobemini) from the genera Pleurobema and Fusconaia are especially challenging and have only recently received some attention using modern phylogenetic analyses to resolve their evolutionary history and taxonomic issues [4]. In the Great Lakes region of North America, there are two conchologically similar and often confused pigtoe mussels: Fusconaia flava (Rafinesque, 1820) and Pleurobema sintoxia (Rafinesque, 1820) [5]. These species are notoriously difficult to differentiate and are frequently misidentified, even by expert freshwater malacologists [6]. As members of the mussel tribe Pleurobemini, they have broadly similar shell characteristics: coloring of reddish-brown tones, shell shape, smooth shell surface, and a relatively thick shell [5,6,7]. Fusconaia flava is particularly well known for being highly variable in shell shape [6,7]. In some cases, F. flava tends to be more triangular in shape than the P. sintoxia [6] with a lower, more centrally located beak, a deeper lateral sulcus, and a deeper beak cavity that can be compared to the compressed, slightly elevated beaks and shallow beak cavities found on the P. sintoxia [5,6]. In many unionids, most notably in pleurobemines, shell shape is highly correlated to where an individual mussel resides in a watershed [1,2]. Periostracum color for both species is also variable, ranging from tan through brown, reddish-brown, and black [6]. These variable and plastic characteristics are what make the two species so difficult to differentiate. Potential misidentification of P. sintoxia is a problem as it has become increasingly rare in the Great Lakes region over the last 30 years primarily due to habitat degradation (pollution) and competition with invasive species such as dreissenid mussels [8]. As a result, P. sintoxia has been listed as an endangered species in the province of Ontario, Canada, is a species of special concern in Michigan, and is considered rare or vulnerable in other Great Lakes states of the United States [8,9].
The risk of misidentification and confusion has important implications for the conservation of imperiled unionids such as P. sintoxia [3,10]. If F. flava are being regularly misidentified as P. sintoxia, this means that P. sintoxia is in fact rarer than presumed and that status assessments are overly optimistic and conservation efforts may need to be increased. Conversely, if P. sintoxia are being mistaken as F. flava, P. sintoxia may be more common than presumed and status assessments are perhaps overly pessimistic; conservation concerns and protections may not be fully justified. Correct identifications will ensure the accuracy of status assessments of P. sintoxia in the Great Lakes region and will ensure that resources, such as government conservation funding, are being properly allocated.
The development of DNA barcoding has made defining and differentiating among systematically and taxonomically problematic species easier. DNA barcoding uses a short fragment of a specific gene (typically the cytochrome c oxidase subunit 1 (COI) gene from the mitochondrial genome for animals) to assign an organism to a species [11]. Modern genetic methods can easily amplify and sequence these fragments of DNA at relatively low cost from tissues biopsied from specimens collected in the field. COI barcoding has proven to be useful for differentiating among many unionid species [12,13,14]. However, COI sequences and other mtDNA loci may not be sufficiently unique enough to differentiate among some species within genera of the unionid tribe Pleurobemini; including Elliptio, Fusconaia, and Pleurobema [4]; this deserves further investigation.
Morphometric analysis has also advanced considerably over the last 30 years with the development of landmark-based morphometric analyses making the quantification of shapes much more rigorous and reliable [15]. Modern morphometric analyses, in combination with DNA barcoding, has the potential to greatly clarify and quantify differences between morphologically problematic and difficult to identify species; these techniques have been applied to freshwater mussels and have proven useful for aiding in identifying morphologically difficult species [16,17,18,19] and near-microscopic juvenile mussels [13].
This study uses geometric morphometric and DNA barcoding techniques to differentiate between P. sintoxia and F. flava. The objectives of this study were to: (1) find reliable and quantifiable morphological shell shape characteristics for differentiating between P. sintoxia and F. flava, (2) determine if foot color is a reliable diagnostic feature for differentiating P. sintoxia and F. flava, and (3) evaluate how well field malacologists of varying experience perform against non-malacologists in differentiating these two species using typical field methods.

2. Methods

2.1. Specimen Collections

Specimen were collected from seven rivers in the Great Lakes region: six rivers in southern Michigan, USA, including the Pine River, the St. Joseph River, River Raisin, the Kalamazoo River, the Clinton River, and the Belle River, and one river in southwestern Ontario Canada, the Sydenham River (Table 1). Upon collection, an initial field identification of each specimen (F. flava or P. sintoxia) was made by the field team. Attempts were made to collect swabs of the visceral mass [20] or mantle tissue biopsies [21] from 20 pigtoe mussels at every site. Swabs were stored in lysis buffer [22] and the tissue samples were stored in 95% ethanol. The foot color (orange or white) of each specimen was documented while taking the tissue biopsy or swab sample. Each specimen was photographed; an image of the left valve of each specimen was taken at the same angle using a portable camera mount, with the shell being laid as flat as possible using modeling clay and perpendicular to the camera lens. Measurements of the shell (to the nearest mm) were taken using Vernier calipers; measurements taken included the length (maximum distance anterior to posterior), width (maximum distance across valves), height (maximum distance dorsal to ventral, perpendicular to the maximum length measurement), and hinge length (distance from tip of umbo to end of hinge) of the shell. At sites where more than 20 pigtoe specimens were found, photos, measurements, and foot color information were recorded for all specimens collected. All specimens were returned alive to their river and site of origin after processing.

2.2. DNA Barcoding

Specimen tissues had DNA extracted using a Qiagen (Germantown, MD, USA) Blood and Tissue Kit and swab samples had DNA extracted using an Isohelix (Harrietsham UK) buccal swab extraction kit. After the DNA was extracted, it was stained with SYBR green and electrophoresed in a 1.5% agarose gel to determine the success of the extraction and the quality of the DNA.
Using primers described in Campbell et al. [23], the female-lineage COI region of the mitogenome was amplified. A 10 µL reaction was used; it consisted of 5.15 µL deionized water, 1 µL 10x reaction buffer (Empirical Biosciences), 1 µL bovine serum albumin, 0.2 µL dNTP, 0.3 µL forward primer, 0.3 µL reverse primer, 0.05 µL Taq polymerase (Empirical Biosciences) and 2 µL of extracted DNA. The thermocycler (Eppendorf Mastercycler) amplification conditions were denaturation at 92 °C for 2 min; five cycles of 92 °C for 40 s, 40 °C for 40 s, 72 °C for 90 s; 25 cycles of 92 °C for 40 s, 50 °C for 40 s, 72 °C for 90 s; followed by 72 °C for ten minutes, and held at 4 °C. A 2 µL volume of amplicon was stained with SYBR green and electrophoresed in a 1.5% agarose gel to confirm successful amplification and visualize fragment size. The amplified DNA was purified using Exonuclease I (ExoI, Amersham Biosciences cat# E70073X, 10 U/mL) and shrimp alkaline phosphatase (SAP, Amersham Biosciences cat# E70092X 1 U/mL) procedure (ExoSAP). A solution of ExoSAP was created using 78 µL ddH2O, 2 µL ExoI, and 20 µL SAP; 1.5 µL of the solution was added to each amplified sample. To denature any remaining primers or enzymes, the samples were then incubated at 37 °C for 40 min, followed by 80 °C for 20 min.
Purified COI amplicons were Sanger sequenced in the forward direction by ETON Bioscience (www.etonbio.com). Sequence electropherograms were checked for quality and consistency using 4PEAKS software (Nucleobytes, http://www.nucleobytes.com). Samples with at least 400 continuous base-pairs with quality scores >20 were compared to COI sequences available on GenBank using the Basic Local Alignment Search Tool (BLAST; http://blast.ncbi.nlm.nih.gov/Blast.cgi). The GenBank sequence that was most similar (>98% identification score) to the sequences generated from the purified samples was chosen as the most likely species for each specimen.

2.3. Traditional Morphometrics

Field-recorded shell measurements were converted to height/length, width/length, width/height, and hinge length/length ratios to control for specimen size. The ratios were arcsine transformed to normalize the data. A principal component analysis (PCA) implemented in XLSTAT [24] was used to visualize the pattern of variation in the shell measurement ratios among the COI-confirmed F. flava and P. sintoxia specimens. A discriminant analysis (DA) implemented in XLSTAT was used to determine how well specimens assigned back to their DNA-confirmed species.

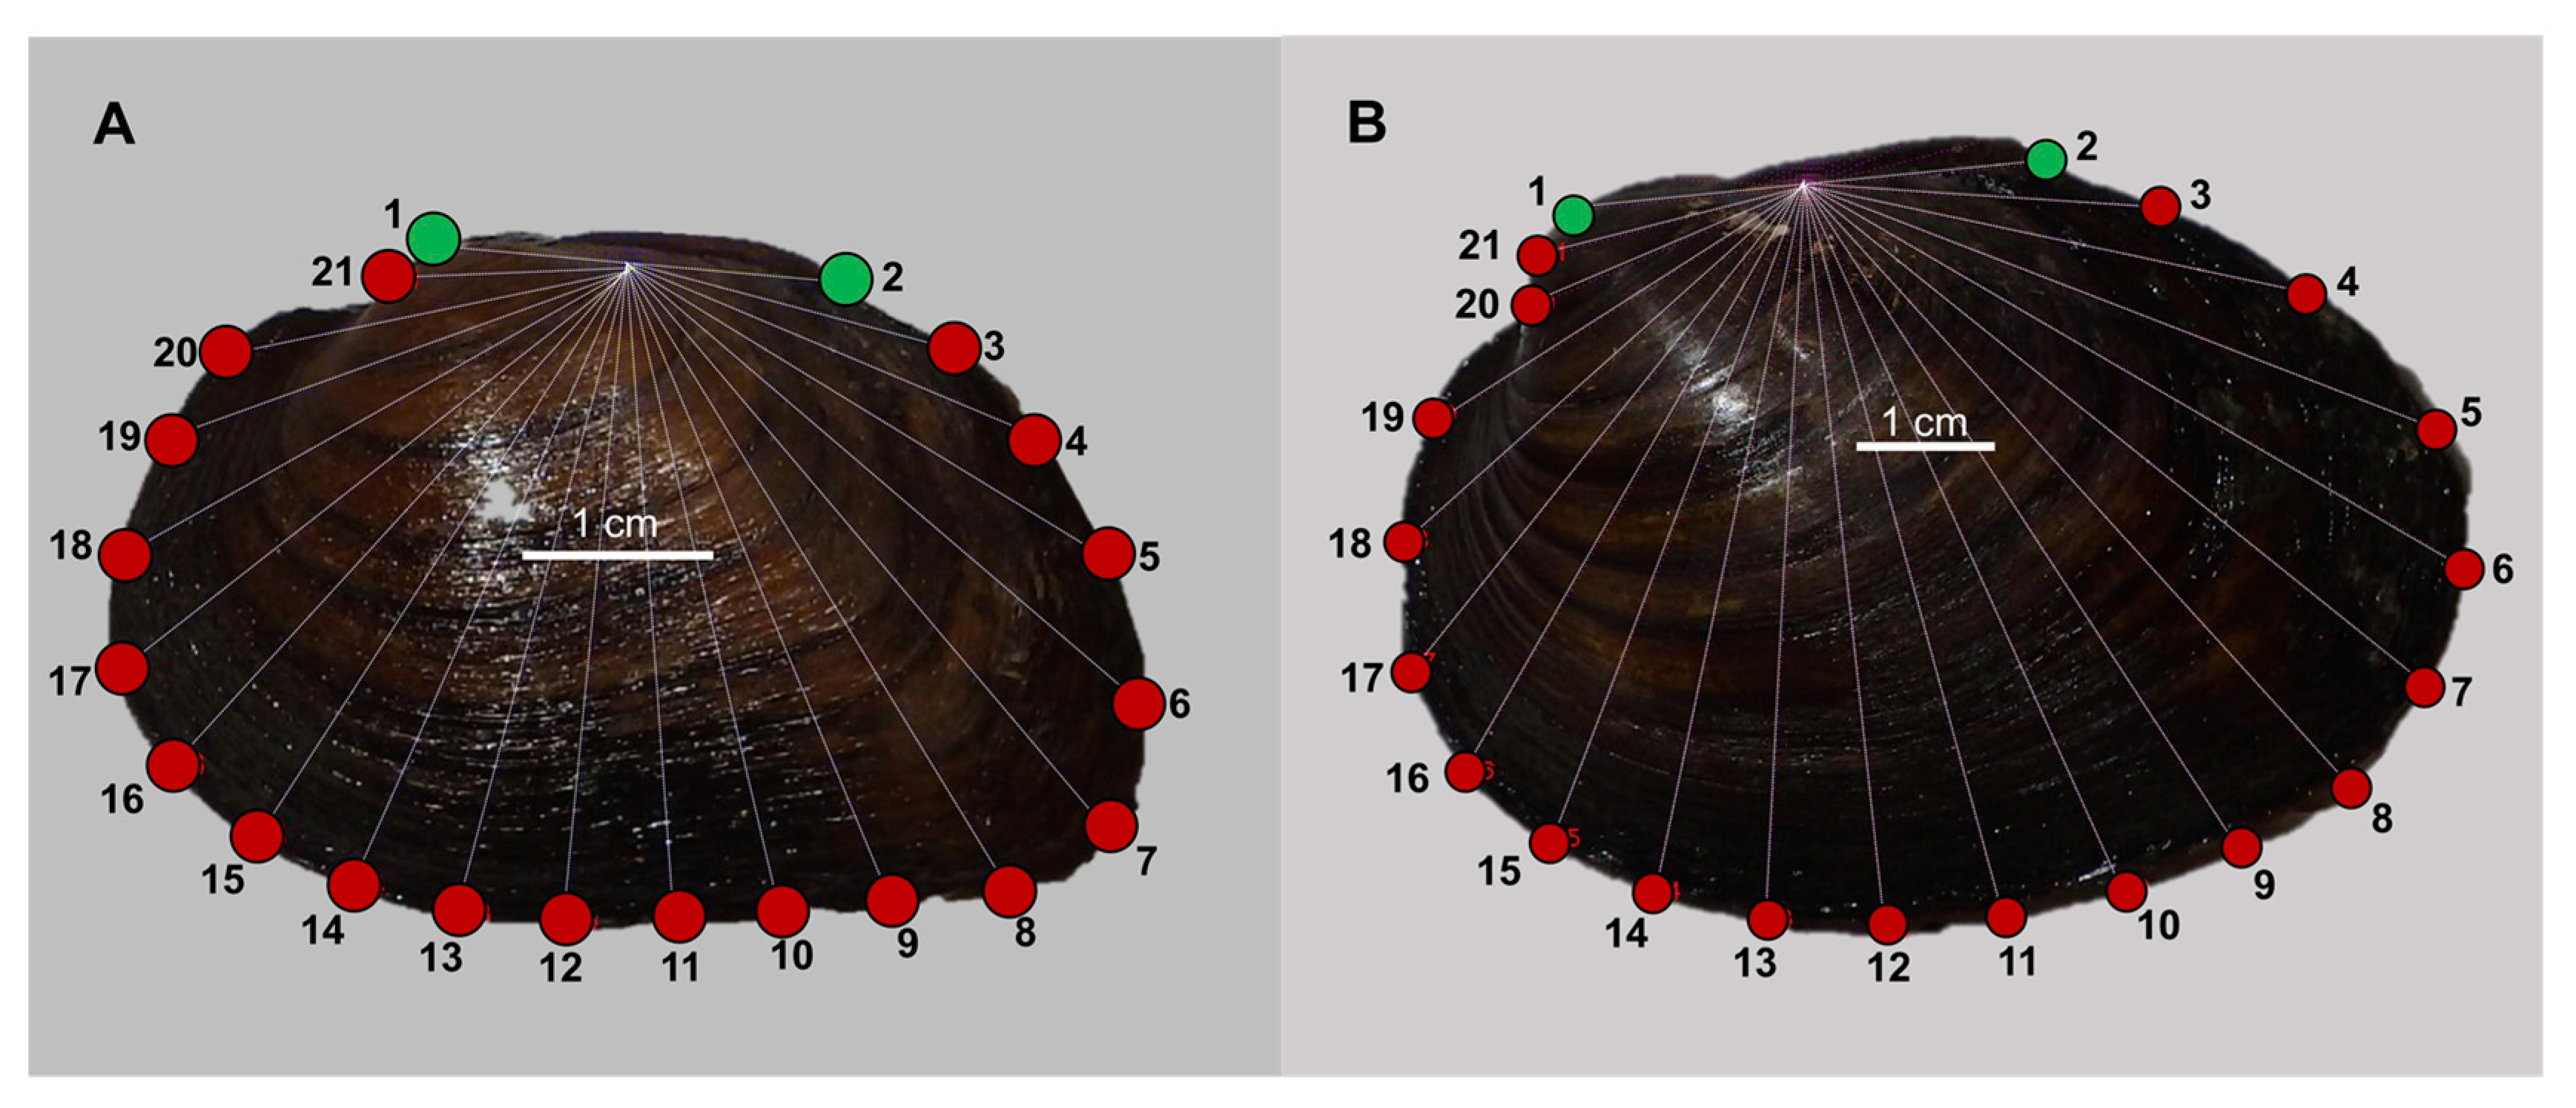
2.4. Geometric Morphometrics

Using the photographs of the left valves, geometric morphometric analyses was carried out using Integrated Morphometrics Package v. 8 (IMP8 [25]). Homologous type I landmarks were placed on the tip of the specimen’s umbo and at the posterior end of the hinge ligament. A 40-ray fan was then placed over each shell image anchored at the median point between landmarks 1 and 2 (Figure 1).
Type II landmarks were placed where each ray of the fan intersected the edge of the shell, resulting in 19 additional landmarks (Figure 1). CoordGen in IMP8 was used to implement a Procrustes superimposition to control for specimen size and rotation of images.
The CVAGen package in IMP8 was used to implement a canonical variates analysis (CVA) on the 133 DNA-confirmed specimens. CVA was used to determine if there were significant differences (α = 0.05) in shell shape between the species and to determine if specimens could be correctly assigned back to their DNA-confirmed species. CVA was also used to visualize the position of the shell landmarks that differentiated between the species. Specimens without COI identifications were assigned to species using the CVA results alone.

2.5. Identification Quiz

An identification quiz (Supplemental Information) was created to compare the differences in identification accuracy among groups with different levels of experience working with freshwater mussels; the quiz responses were compared to the identifications based on DNA barcoding and geometric morphometrics. Left valve photos, from a selection of 50 of the 133 specimens with DNA-confirmed identifications from each of the 7 rivers, were included in the quiz. Of the 50 specimens selected, 29 were F. flava and 21 were P. sintoxia so that at least one of each species was included from each river sampled. Additionally, included with the shell photos were the lengths of specimen and the rivers of origin. People with a range of mussel identification abilities (self-identified as novice, intermediate, and expert) and years of experience (<1 year to >5 years) were recruited to take the quiz. Participants were sent files with the shell photos and an answer sheet to record their identifications. Answers from respondents were compared to the DNA-confirmed identifications. Due to small sample sizes, non-parametric Kruskal–Wallis tests with Dunn post-hoc tests were used to determine if there were differences (α = 0.05) in the proportion of correctly identified species among groups assigned by identification skill level and years of experience.

3. Results and Discussion

Field collections resulted in 246 pigtoe specimens from the seven rivers; 133 pigtoes had mantle biopsies or swabs taken for genetic analysis and an additional 113 specimens were photographed with no genetic samples taken. Of the 133 used for genetic analysis, 108 (81.2%) were identified in the field as F. flava and 25 (18.8%) were identified as P. sintoxia. Photographs of the left valve of each specimen have been submitted Morphobank (Project 3683, MorphoBank accession #M692936-M693193; http://morphobank.org/permalink/?P3683) and all shell measurement data are available in Supplemental Table S1.

3.1. DNA Barcoding

Specimens from the seven rivers visited yielded 133 COI sequences with a mean length of 577 bp. After comparing the COI sequences generated to those on GenBank using BLAST, 90 specimens (67.7%) were confirmed as F. flava and 43 (32.3%) were confirmed as belonging to the genus Pleurobema. The COI sequences generated for putative P. sintoxia specimens collected could only be identified as either P. sintoxia or Pleurobema rubrum Rafinesque, 1820 using BLAST, as several haplotypes appear to be shared between these species [4], making it impossible to differentiate between these species using COI alone. Pleurobema sintoxia and P. rubrum (only known from the Ohio River drainage [4]) are known to share mtDNA haplotypes and may be conspecific [4]. Sequencing resulted in 13 unique haplotypes generated for F. flava specimens (GenBank Accession Nos. MT876991-MT877003) and 12 unique haplotypes generated for P. sintoxia specimens (GenBank Accession Nos. MT878085-MT878096). After comparing the initial field identifications to the COI barcode identity, only 82.0% of specimens were accurately identified in the field, all members of the field collection team had an intermediate level of experience (<3 years) with identifying mussels in the field (Table 1). Misidentification rates were 19.4% for F. flava identified in the field and 15.3% for P. sintoxia indicating a slight bias for confusing F. flava as P. sintoxia.
When identifying pigtoe species, COI barcoding is useful for differentiating between F. flava and P. sintoxia in the Great Lakes region, as these are the only common members of their respective genera in the region [5]. The only other members of the Pleurobemini present in the Great Lakes region are the federally endangered Pleurobema clava (Lamarck, 1819) (Clubshell) and Fusconaia subrotunda (Lea, 1831) (Longsolid) [5]. Both P. clava and F. subrotunda are extremely rare in the Great Lakes drainage, where they are restricted to just the Maumee River drainage [5] and both are morphologically quite distinct from F. flava or P. sintoxia. All of the COI sequences that we generated matched Genbank sequences from the genera Fusconaia or Pleurobema; all generated sequences that were Fusconaia sequences on Genbank were F. flava, however, the COI sequences that matched Pleurobema were a mix of P. sintoxia and P. rubrum. Although highly accurate for differentiating among most animal species [11], the COI barcoding region, along with other mtDNA loci, are not especially useful for differentiating among the species of Pleurobemini [4]. The sequence variation at COI (and other mtDNA genes) among some members of the Pleurobemini is similar at the species and genus level, which means the COI barcode region is useful in differentiating among genera but not necessarily for differentiating among species within genera of the Pleurobemini [4]. This means that the usefulness of our findings using COI barcoding may be limited to areas where the only pigtoes likely to be present are F. flava and P. sintoxia (i.e., the Great Lakes region and parts of the upper Mississippi River drainage).

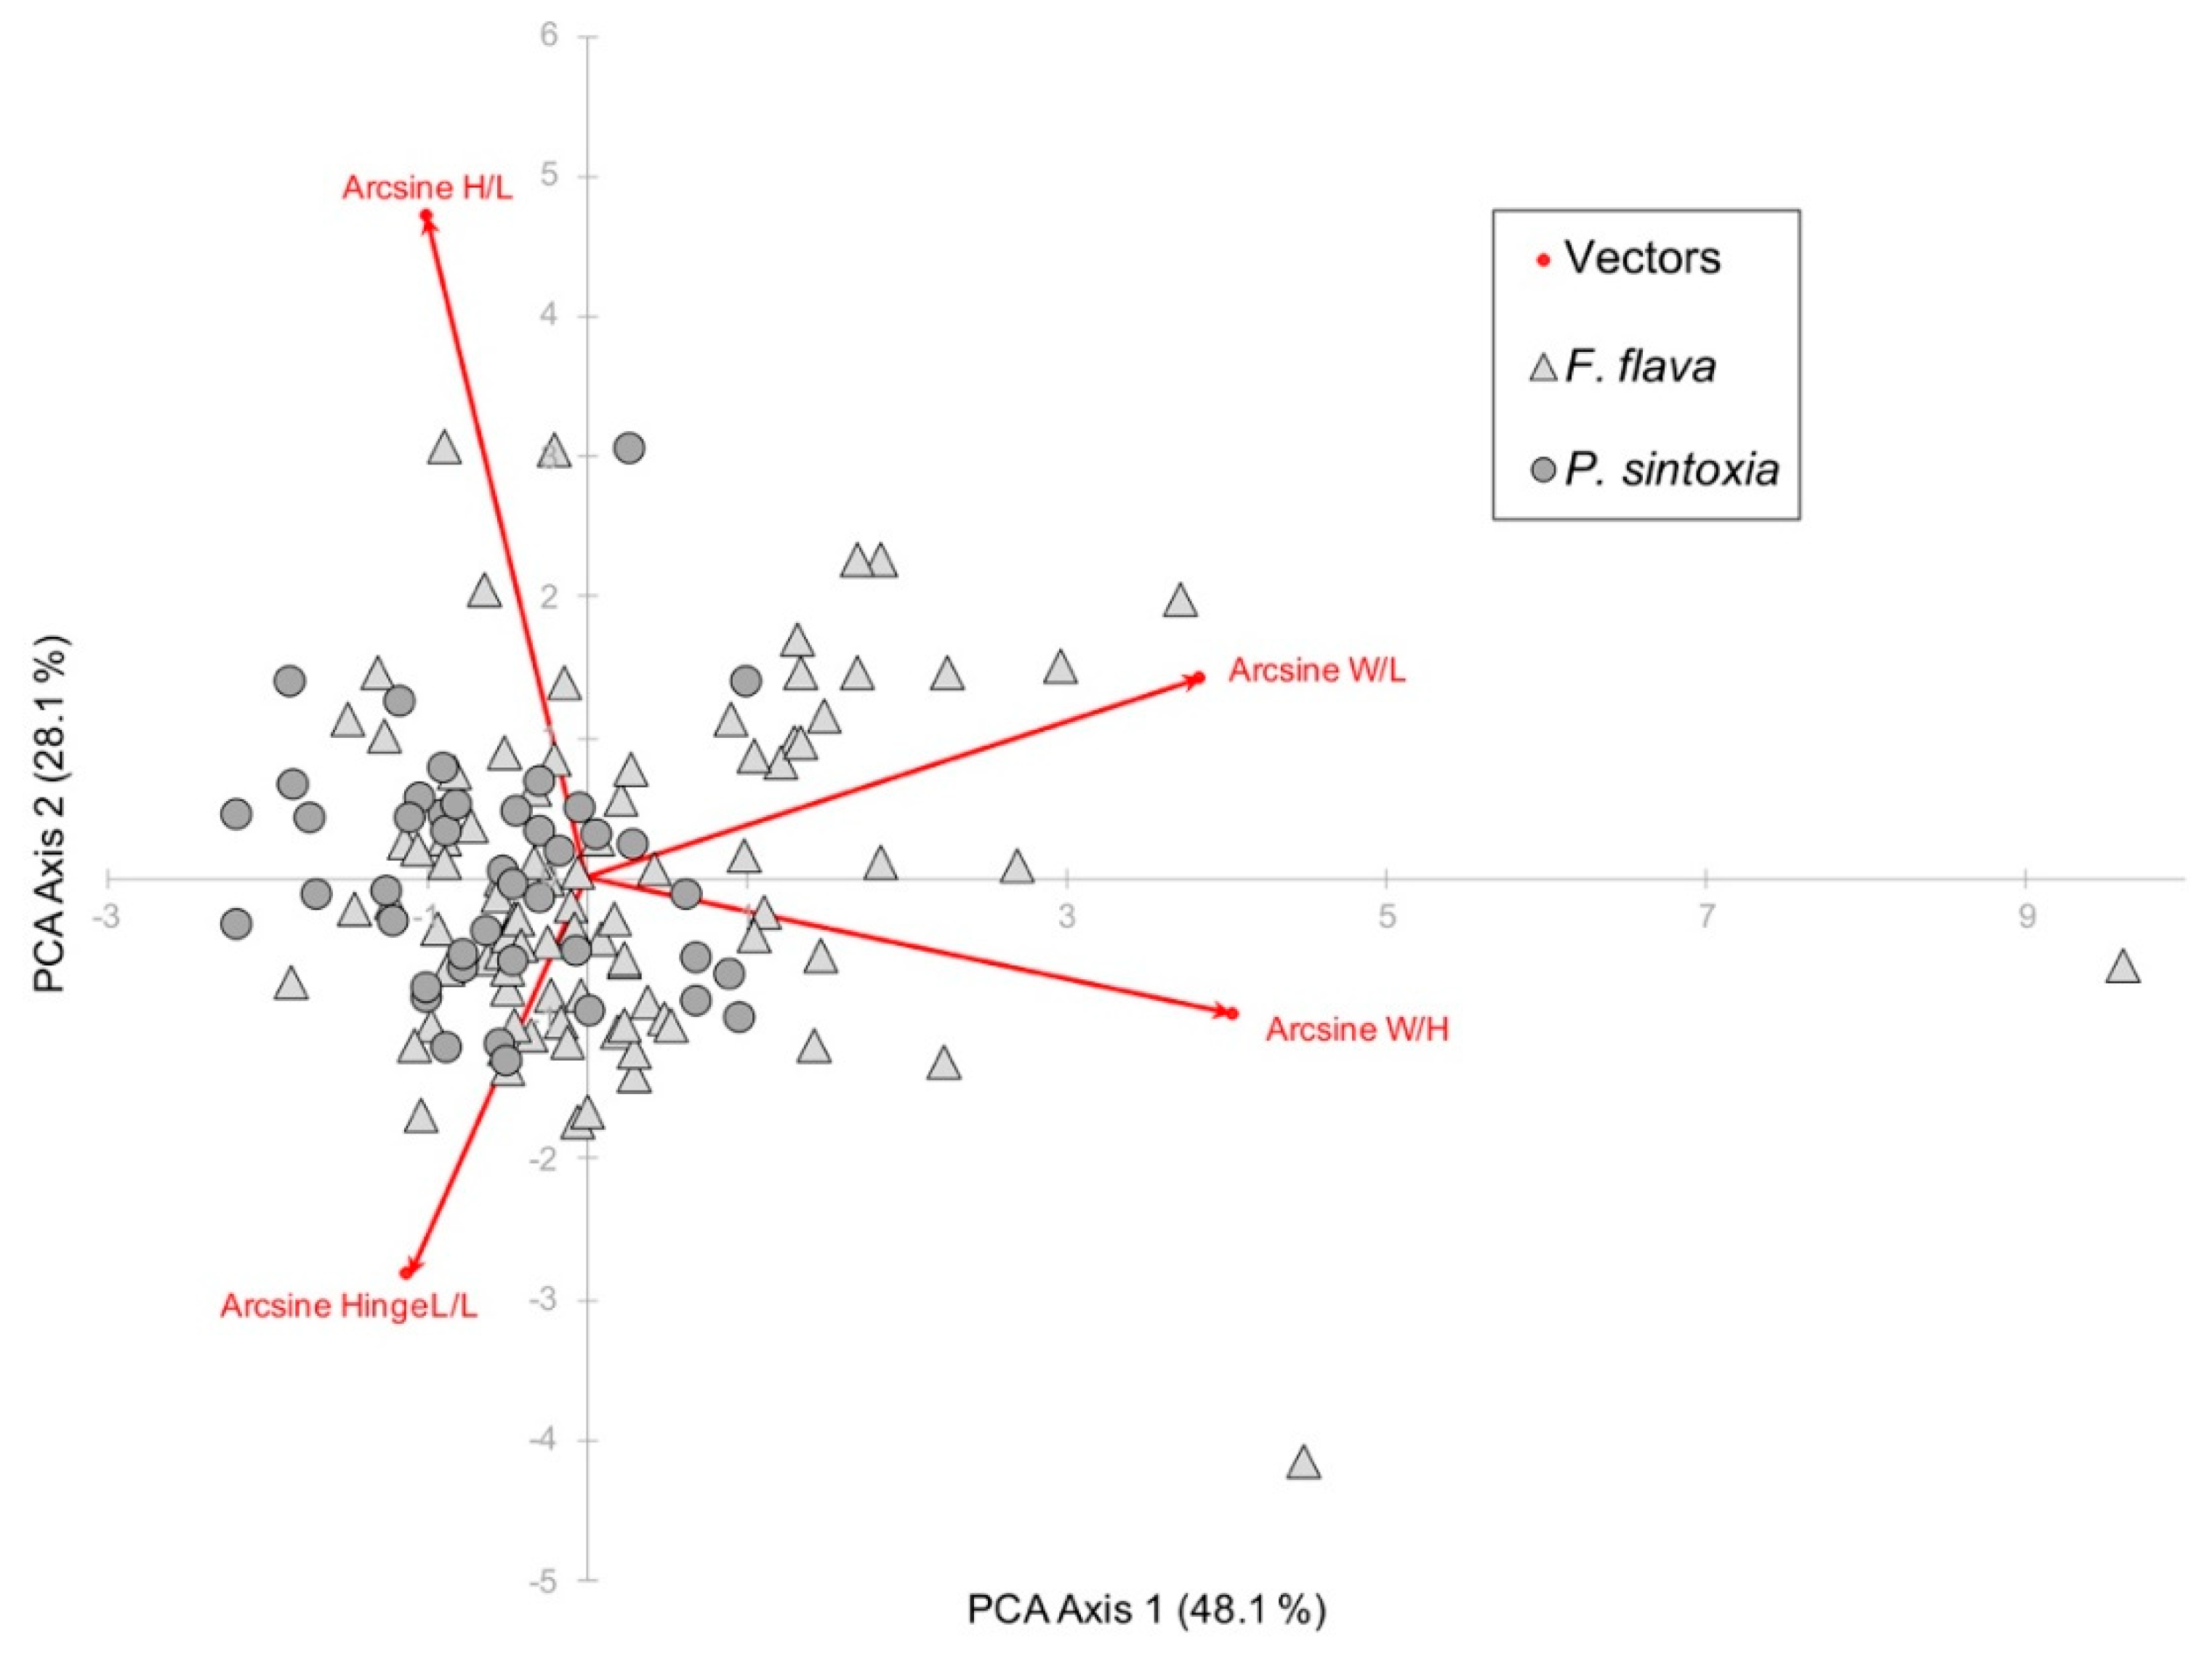
3.2. Traditional Morphometrics

Ratios of shell measurements were not very accurate in differentiating between the two species (Figure 2). Using discriminant analysis, shell measurements were only 70.3% accurate in differentiating between the DNA-confirmed specimens. Shell width/length and width/height were somewhat useful in differentiating between the two species with F. flava specimens often being more inflated than P. sintoxia (Figure 2).
Compared to geometric morphometric analyses (see below), traditional morphometrics were much less useful in differentiating between species (as in Inoue et al. [16]). Traditional morphometrics analysis was not reliable in differentiating between the species when compared to field identifications (Supplemental Table S1) or the results of the identification quiz (see below).

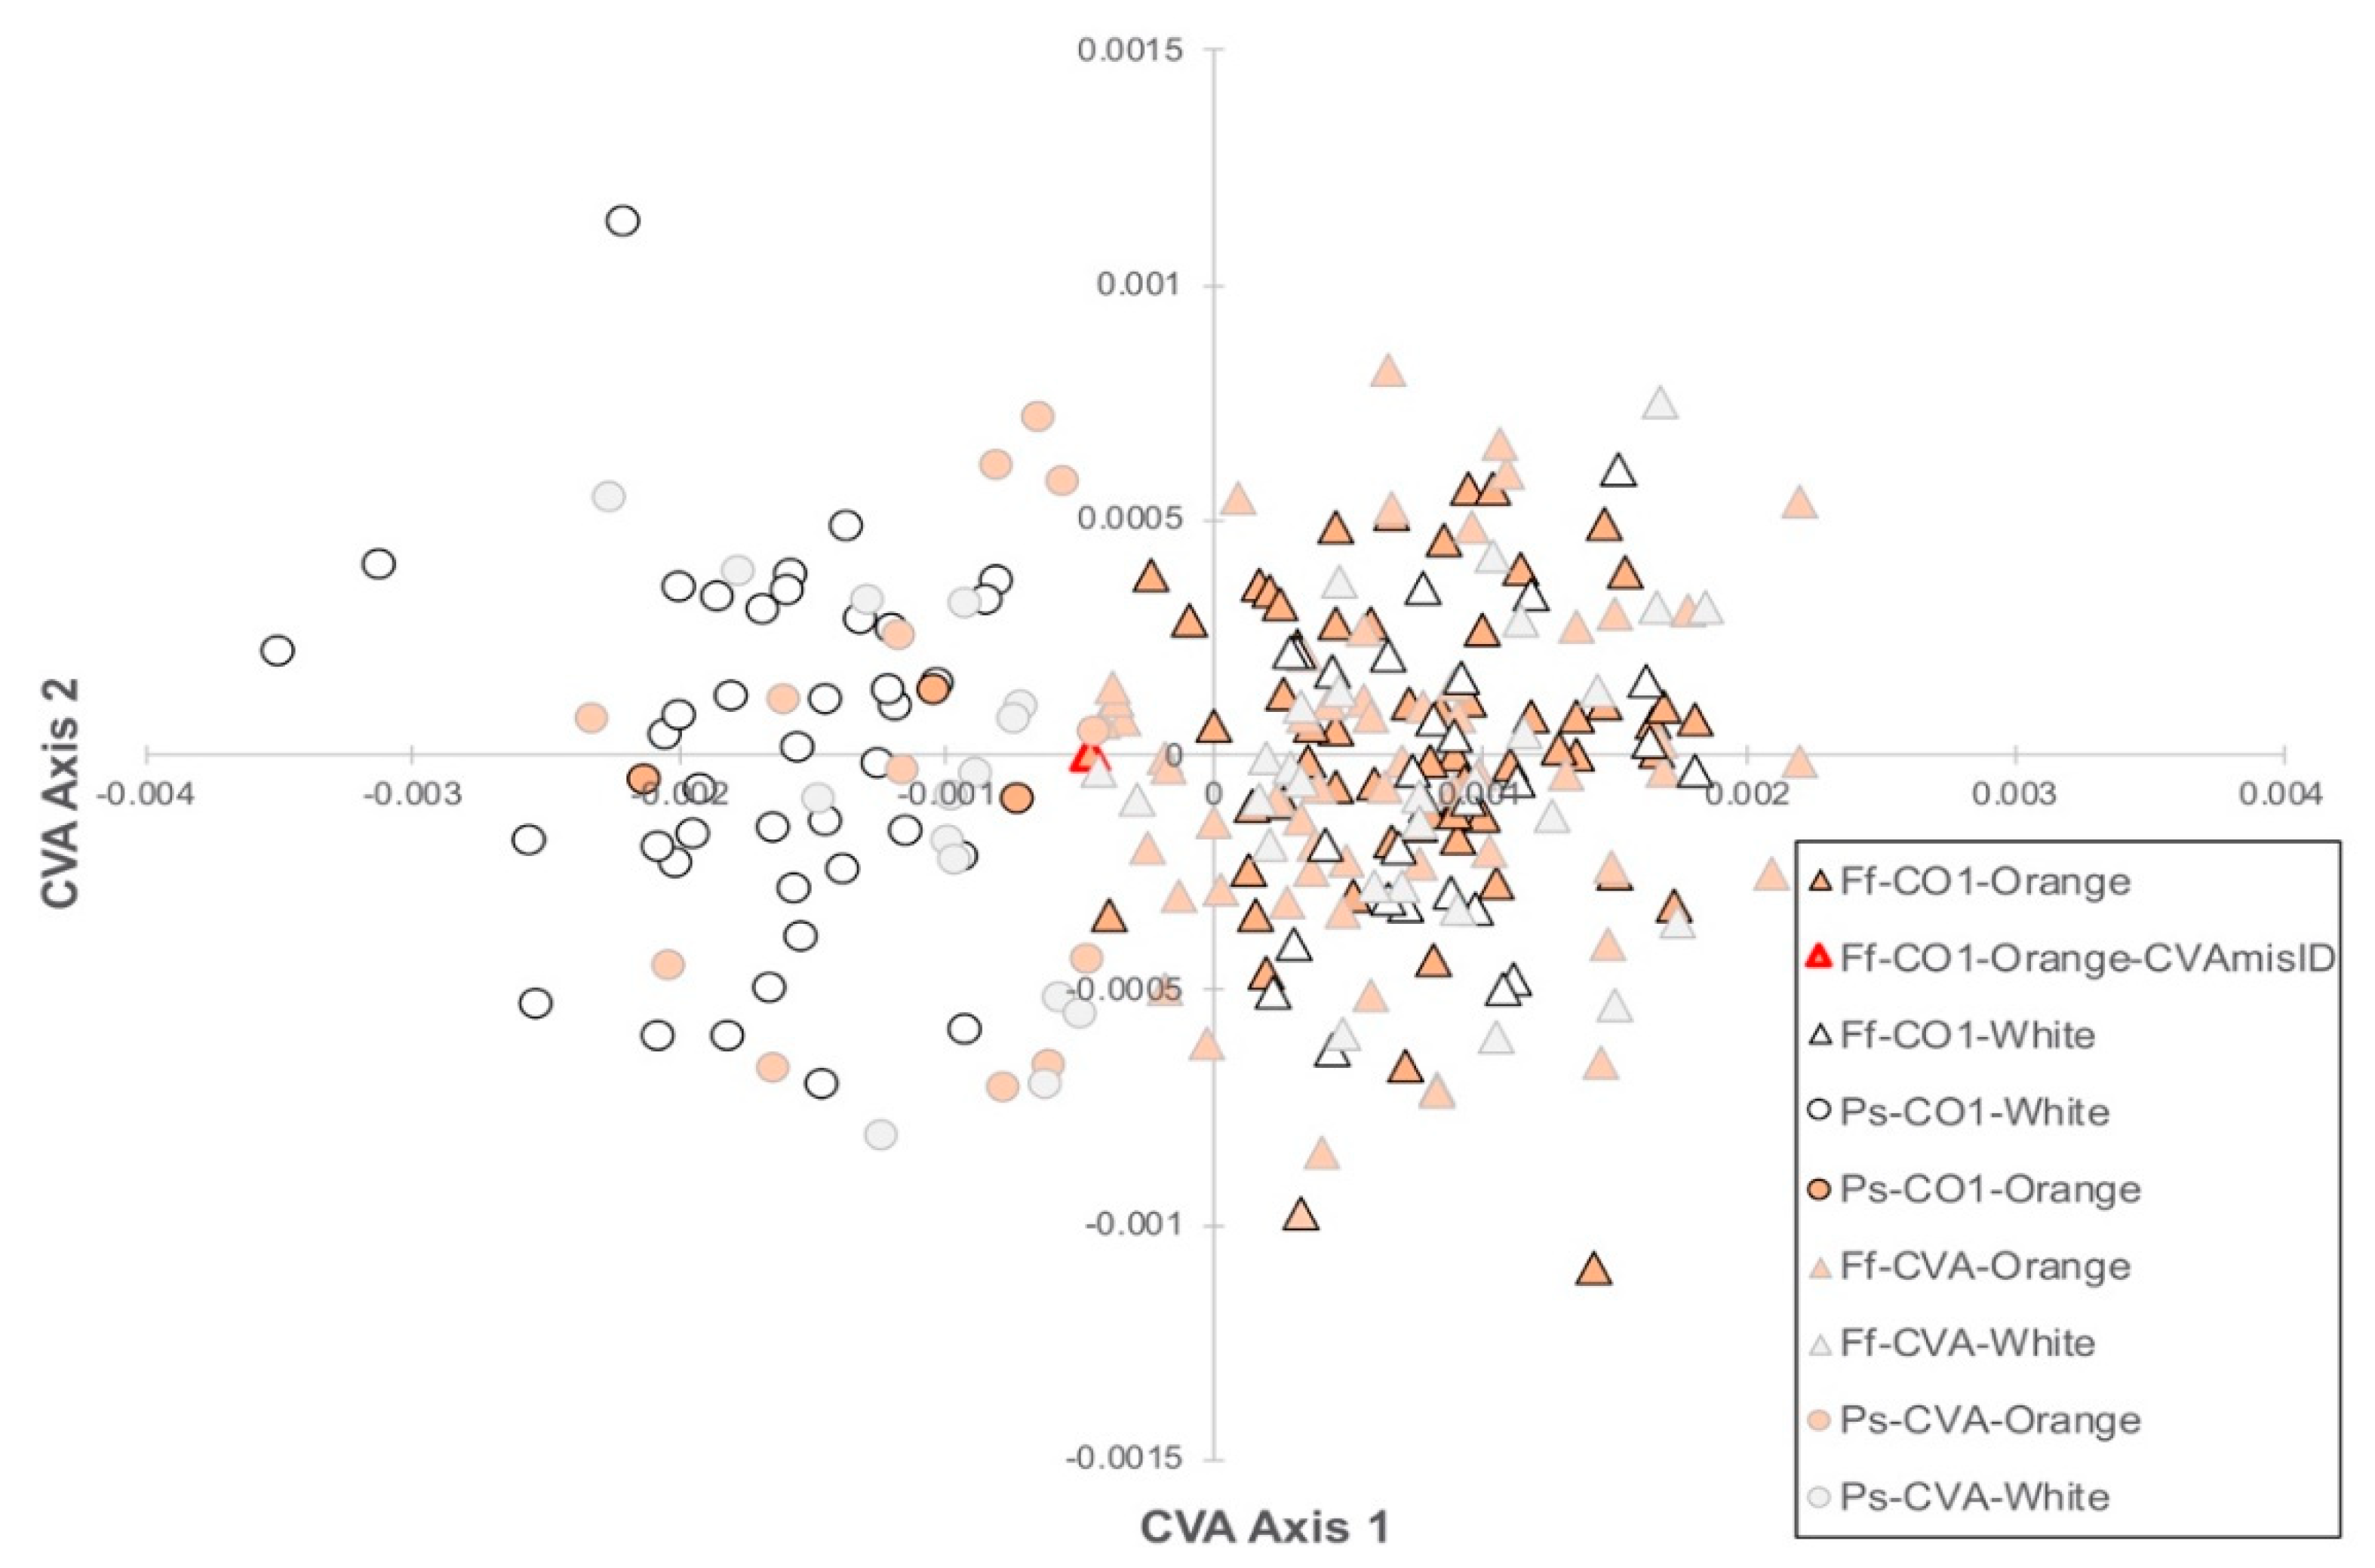
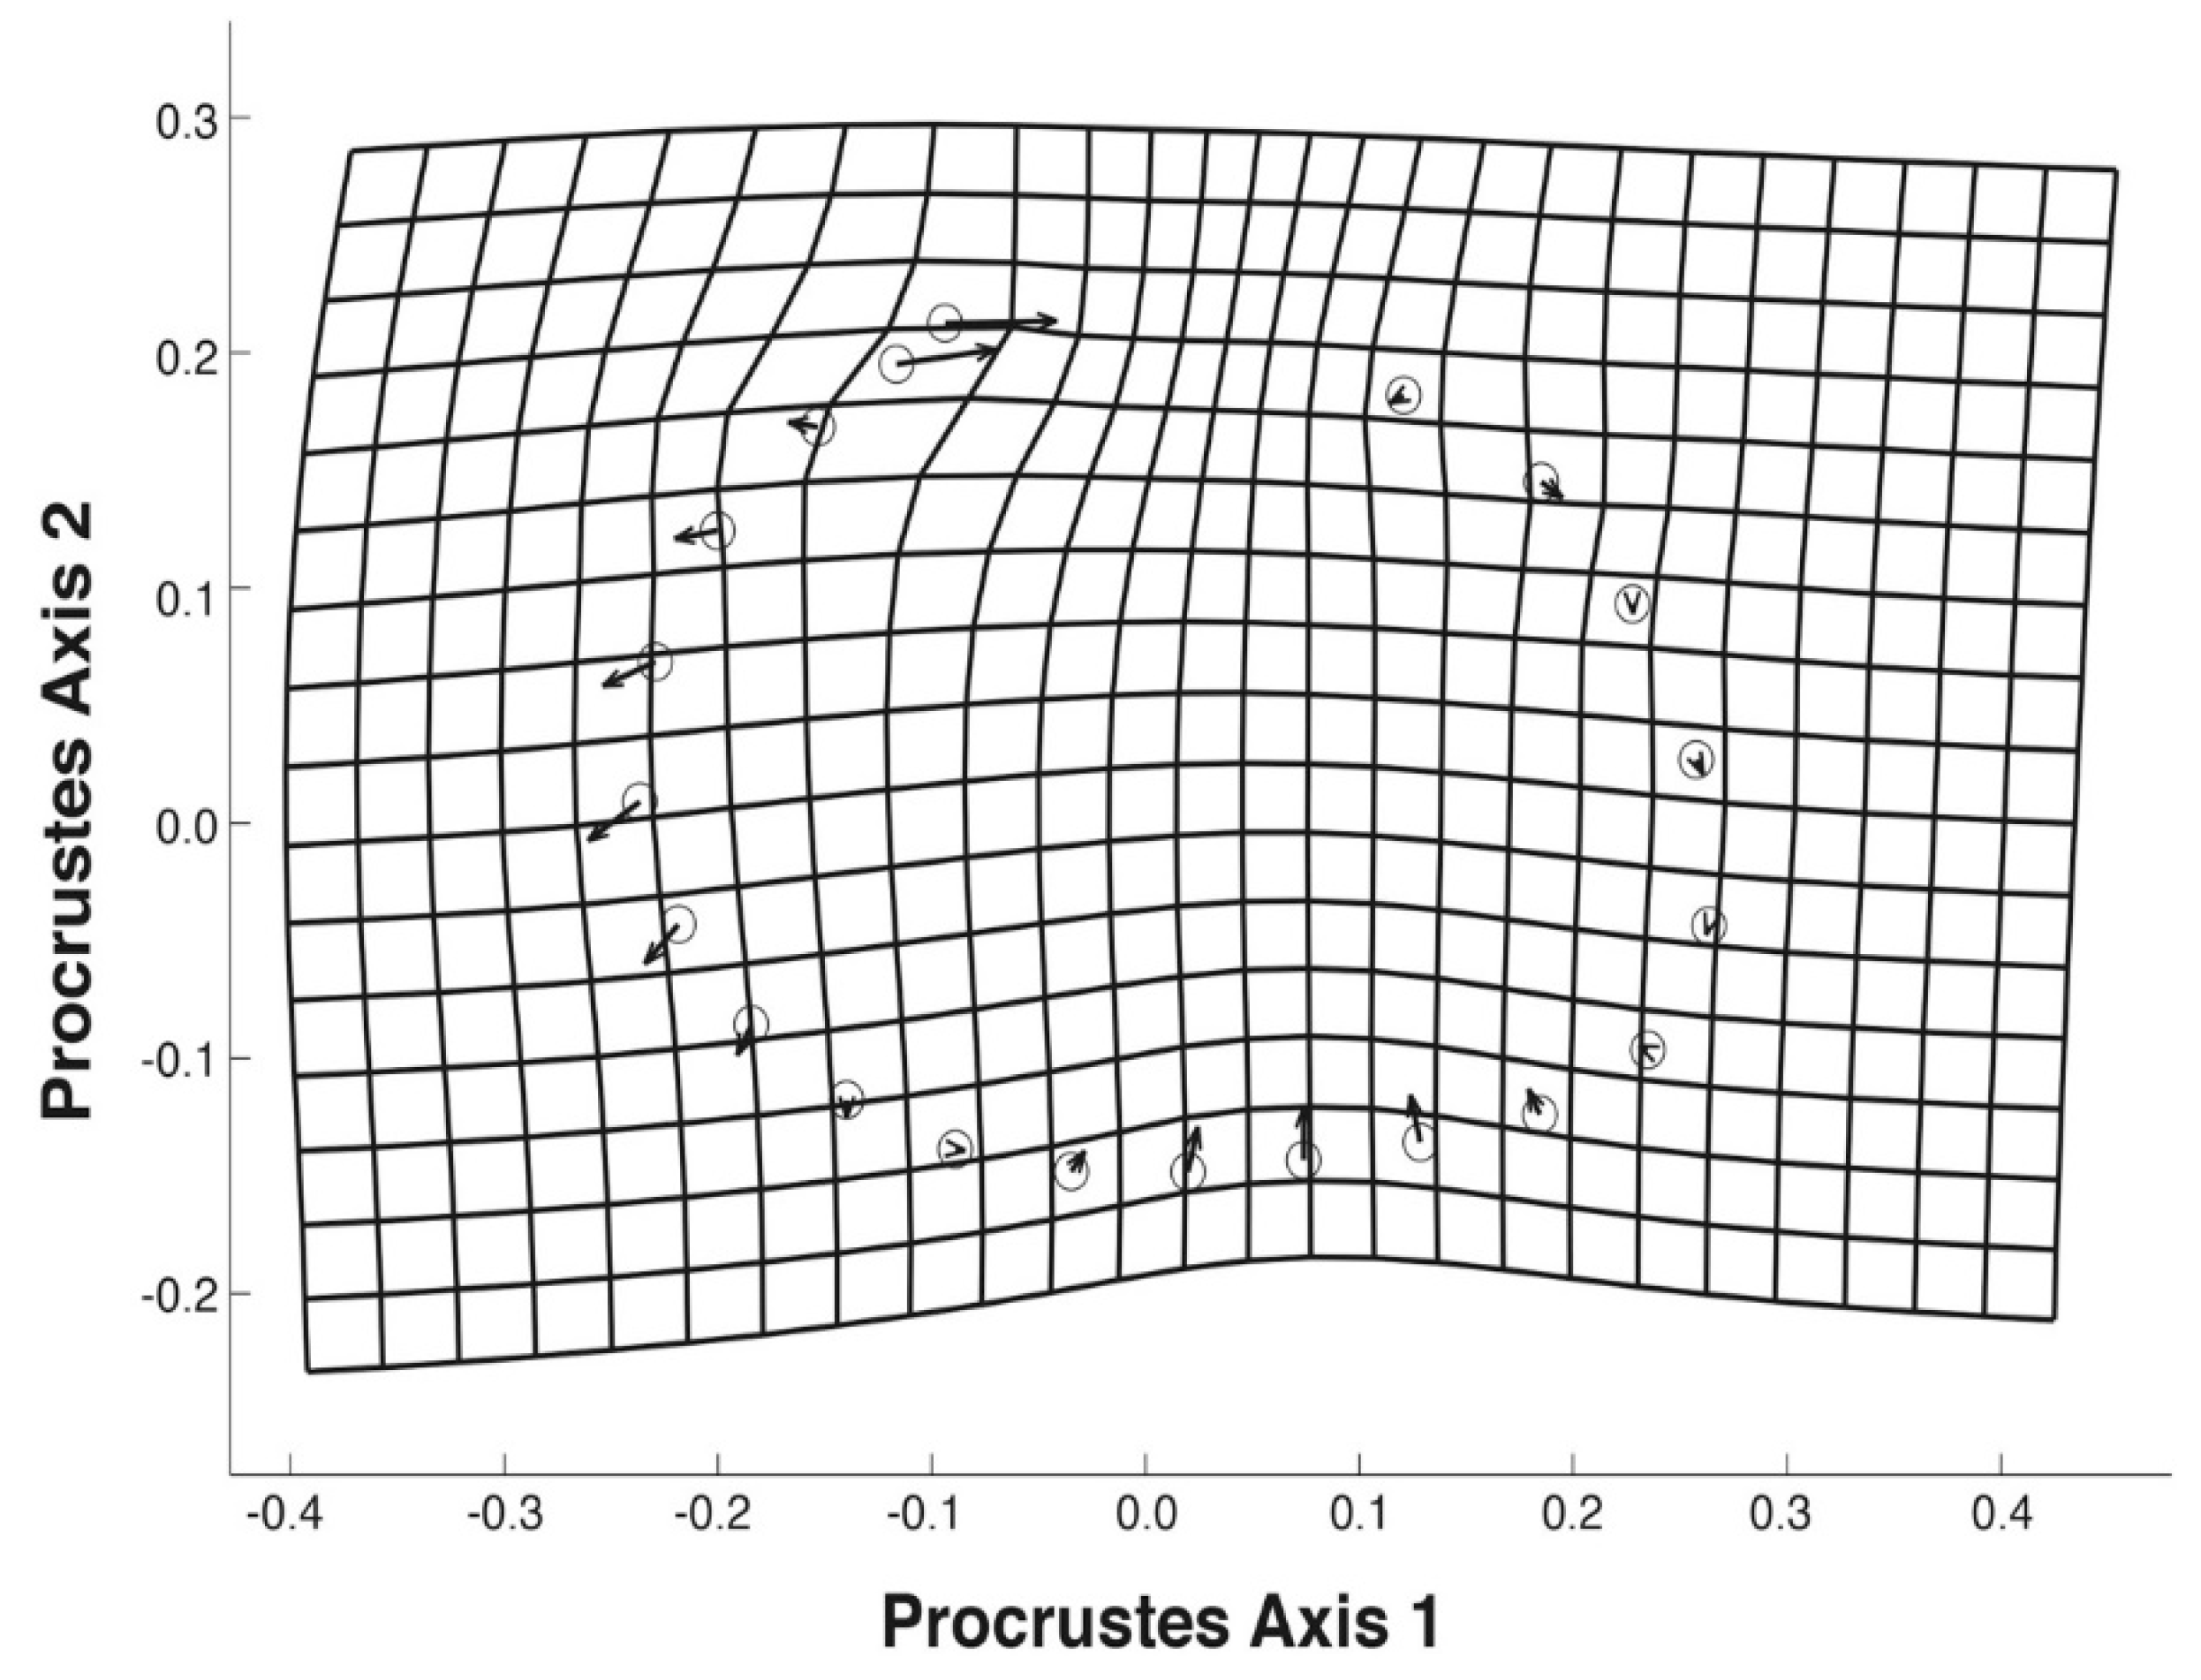
3.3. Geometric Morphometrics

The CVA of the 21 Procrustes transformed landmarks found significant (p < 0.0001) differences in shell shape between the two species (Figure 3).
Using the landmark dataset, specimens were correctly assigned to their COI-confirmed species at a rate of 99.2% (132/133 of specimens). Shape differences were primarily in the position of the beak (central in F. flava and anterior in P. sintoxia) and the shape of the ventral margin (flat to concave in F. flava, flat to convex in P. sintoxia) (Figure 4). Specimens of F. flava were often more elongated than P. sintoxia (Figure 4).
Differentiation between F. flava and P. sintoxia using geometric morphometric analysis was considerably more accurate than traditional morphometrics. CVA was very useful in differentiating between species when using landmark-based morphometric data and showed high agreement with the COI barcode identifications. Geometric morphometric analysis is also more economical than COI barcoding and potentially less harmful as only a photograph is needed (rather than a tissue biopsy or swab sample [19]). A drawback to identifying pigtoes in this way is that it takes a substantial amount of time; specimens must be carefully photographed, all specimens must have landmarks digitized, and then specimens must be compared to those in a database of the specimens’ DNA-confirmed identities.

3.4. Foot Color

Foot color was only 77.0% accurate in identifying species and was variable in both species. An orange foot was more common in F. flava with 70.0% of specimens having an orange foot and a white foot was more common in P. sintoxia with 93.0% of specimens having a white foot. The foot color was not a reliable character for identification.

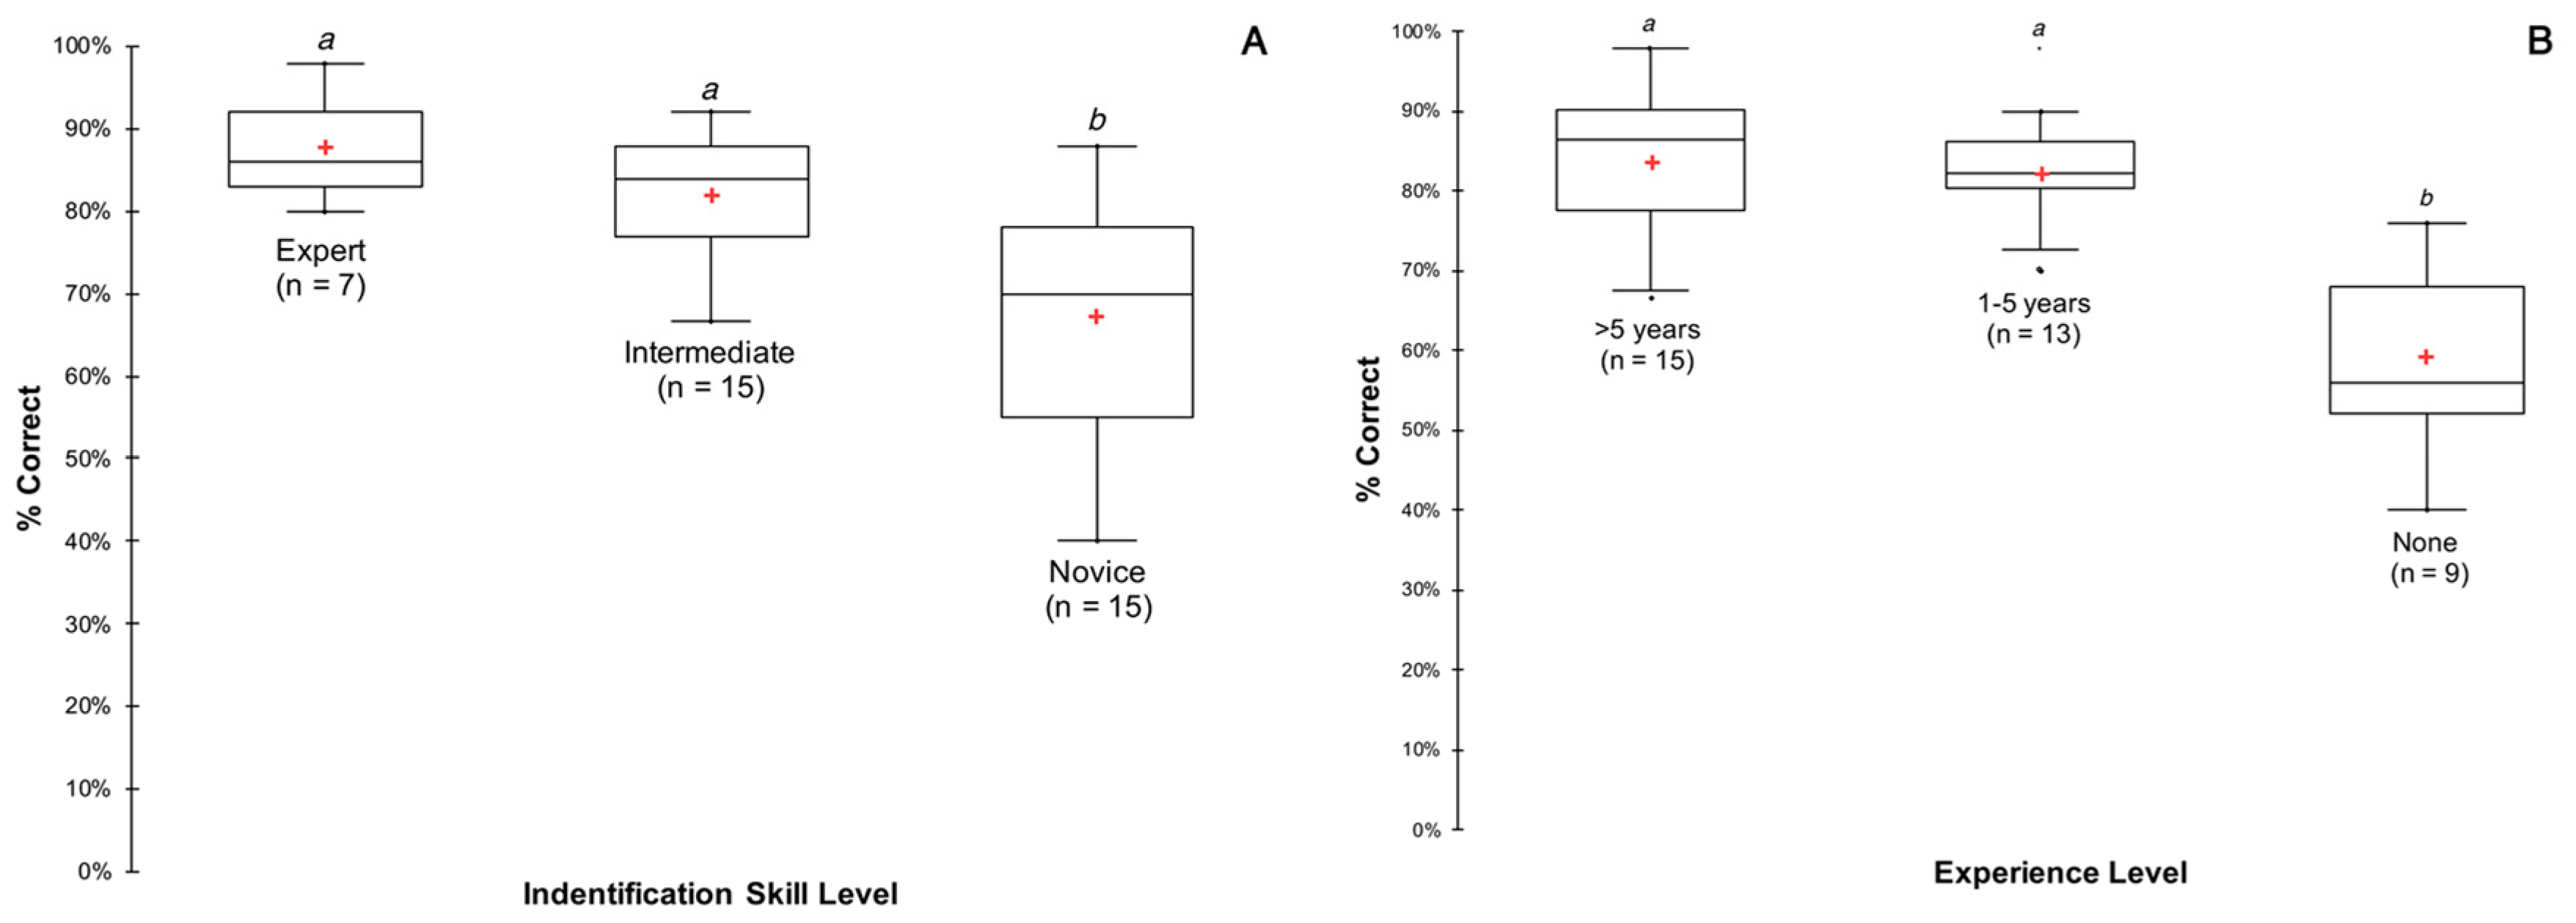
3.5. Identification Quiz

The 37 participants of the identification quiz had a mean score of 77.0% ± 7.5% (SD) and a median score of 82.0%. Results showed that participants performed equally on both species with 77.0% of F. flava and 77.3% of P. sintoxia identified correctly. The quiz results also showed that mussel identification expertise (p < 0.01) and years of experience (p < 0.001) increased the proportion of pigtoes that were correctly identified (Figure 5). However, participants who were considered experts (n = 7) or with more than five years (n = 15) of experience in identifying mussels, did not score higher (p = 0.282 and p = 0.532, respectively) than those who had intermediate (n = 15) identification skills or who had only one to five years of experience (n = 13) in identifying mussels.
Specimens that were misidentified often had a different shape than the typical pigtoe specimens. For instance, a specimen on the quiz that was often misidentified (PINE-15-03) had a deformity that made it look as though it had a deep sulcus on the left valve. As F. flava typically has a more pronounced sulcus, participants of the quiz often misidentified the specimen as F. flava when it is actually P. sintoxia. Two specimens from the lower Kalamazoo River (site 5) were misidentified often as P. sintoxia (Table S2). This is most likely due to the mussels’ rounded shape that is typically seen more often in P. sintoxia than in F. flava. These two Kalamazoo River mussels were also very dark in color, which may have influenced participants to mistake them for P. sintoxia.

3.6. Conservation Implications and Conclusions

Based on our results, COI barcoding and landmark-based geometric morphometric analyses are reliable in differentiating between F. flava and P. sintoxia in the Great Lakes region. Landmark-based morphometrics are much more reliable in differentiating between the species than traditional morphometrics. Furthermore, traditional morphometrics performed more poorly than field identifications by biologists with moderate to extensive experience with freshwater mussels. Foot color was not diagnostic for differentiating between the species and was polymorphic for both species. Identification accuracy for these species increased with experience but was not different between those with many years of experience and those with moderate levels of experience.
Based on the accuracy of the field identification and quiz results of the pigtoes, P. sintoxia may be somewhat more common than originally believed [8], as they were frequently misidentified as F. flava. Although P. sintoxia and F. flava were misidentified at roughly the same rate in the identification quizzes, because P. sintoxia is considerably less common than F. flava, misidentifications could cause errors assessing its presence and abundance during surveys. If P. sintoxia are being misidentified as the more common F. flava (as they were in our field identifications), P. sintoxia may be more common than previously assessed and conservation and restoration efforts may be better spent on other species and habitats.
Misidentification of a common species for a rare species may lead to an overall reduction in monitoring and conservation of rare and endangered species [3,10], including P. sintoxia. In some cases, misidentifications may lead to a removal or inadvertent killing of an endangered species [10] with the permitting of habitat alteration or destruction during infrastructure construction and development projects (e.g., bridges, roads, pipelines, marinas, etc.). Resolving misidentifications of freshwater mussels has become increasingly important (e.g., Inoue et al. [16], Beyett et al. [19]), as approximately 70% of unionid mussel species in North America are considered at risk of extinction [1]. Incorporating modern methods, such as DNA barcoding and geometric morphometric analysis, should prove to be a valuable aid in the correct identification of freshwater mussel species and may be crucial in ensuring the survival of some rare and endangered species. The morphometric dataset of DNA-confirmed specimens that we have assembled should be useful for helping malacologists in the Great Lakes region to accurately differentiate between problematic pigtoe specimens.

Supplementary Materials

The following are available online at https://www.mdpi.com/1424-2818/12/9/337/s1. Supplemental Table S1: Individual specimen information for F. flava and P. sintoxia specimens collected in Great Lakes region. Supplemental Figure S1: The administered pigtoe identification quiz of 50 specimens of F. flava and P. sintoxia from the Great Lakes region of North America.

Author Contributions

Conceptualization, J.A.W., T.J.M. and D.T.Z.; Methodology, J.A.W. and D.T.Z.; Formal Analysis, J.A.W. and D.T.Z.; Data Curation, J.A.W. and D.T.Z.; Writing—Original Draft Preparation, J.A.W. and D.T.Z.; Writing—Review and Editing, T.J.M. and D.T.Z.; Visualization, D.T.Z.; Supervision, D.T.Z.; Project Administration, D.T.Z.; Funding Acquisition, J.A.W., T.J.M. and D.T.Z. All authors have read and agreed to the published version of the manuscript.

Funding

Funding for this study came from Fisheries and Oceans Canada, Central Michigan University’s (CMU) Summer Scholars Program, and CMU’s Office of Research and Graduate Studies.

Acknowledgments

Thank you to everyone who helped in the field collections or laboratory work, including Daelyn Woolnough, Nichelle VanTassel, Kate Beauchamp, Tyler Beyett, Shay Allred, and Eric Linton (CMU Biology Department); Renee Mulcrone; and Sheri Faust and Amy Meeker-Taylor (Friends of the St. Clair River); and Kelly McNichols-O’Rourke (Fisheries and Oceans Canada). Thanks to all who bravely participated in the identification quiz (and will remain anonymous), especially those who knew nothing about mussels beforehand from the CMU BIO212 class in Fall 2019. Canadian specimens were collected under SARA permit number 19-PCAA-00008 and Michigan specimens were collected under a Scientific Collection Permit issued by the Michigan Department of Natural Resources. This manuscript is contribution #145 of the Central Michigan University Institute for Great Lakes Research.

Conflicts of Interest

The authors declare no conflict of interest.

References

  1. Haag, W.R. North American Freshwater Mussels: Natural History, Ecology, and Conservation; Cambridge University Press: Cambridge, UK, 2012. [Google Scholar]
  2. Ortmann, A.E. The geographical distribution of freshwater decapods and its bearing upon ancient geography. Proc. Am. Phil. Soc. 1920, 41, 267–400. [Google Scholar]
  3. Shea, C.P.; Peterson, J.T.; Wisniewski, J.M.; Johnson, N.A. Misidentification of freshwater mussel species (Bivalvia: Unionidae): Contributing factors, management implications, and potential solutions. J. N. Am. Benthol. Soc. 2011, 30, 446–458. [Google Scholar] [CrossRef]
  4. Inoue, K.; Hayes, D.M.; Harris, J.L.; Johnson, N.A.; Morrison, C.L.; Eackles, M.S.; King, T.L.; Jones, J.W.; Hallerman, E.M.; Christian, A.D.; et al. The Pleurobemini (Bivalvia: Unionida) revisited: Molecular species delineation using a mitochondrial DNA gene reveals multiple conspecifics and undescribed species. Invert. Syst. 2018, 32, 689–702. [Google Scholar] [CrossRef]
  5. Watters, G.T.; Hoggarth, M.A.; Stansbery, D.H. The Freshwater Mussels of Ohio; The Ohio State University: Columbus, OH, USA, 2009. [Google Scholar]
  6. Mulcrone, R.S.; Rathburn, J.E. Field Guide to the Freshwater Mussels of Michigan; Michigan Department of Natural Resources: Lansing, MI, USA, 2018. [Google Scholar]
  7. Pieri, A.M.; Inoue, K.; Johnson, N.A.; Smith, C.H.; Harris, J.L.; Robertson, C.; Randklev, C.R. Molecular and morphometric analyses reveal cryptic diversity within freshwater mussels (Bivalvia: Unionidae) of the western Gulf coastal drainages of the USA. Biol. J. Linn. Soc. 2018, 124, 261–277. [Google Scholar] [CrossRef]
  8. COSEWIC Assessment and Status Report on the Round Pigtoe Pleurobema sintoxia in Canada. Committee on the Status of Endangered Wildlife in Canada, Ottawa, ON Canada, 2004; vi + 33 pp. Available online: https://www.sararegistry.gc.ca/virtual_sara/files/cosewic/sr%5Fround%5Fpigtoe%5Fe%2Epdf (accessed on 10 January 2019).
  9. Cummings, K.S.; Mayer, K.S. Field Guide to Freshwater Mussels of the Midwest; Illinois Natural History Survey: Champaign, IL USA, 1992; Manual 5, 194p; Available online: https://wwv.inhs.illinois.edu/collections/mollusk/publications/guide/ (accessed on 10 January 2019).
  10. Newth, J.L.; Wood, K.A.; McDonald, R.A.; Nuno, A.; Semenov, I.; Chistyakov, A.; Mikhaylova, G.; Bearhop, S.; Belousova, A.; Glazov, P.; et al. Conservation implications of misidentification and killing of protected species. Conserv. Sci. Prac. 2019, 1, e24. [Google Scholar] [CrossRef] [Green Version]
  11. Hebert, P.D.N.; Cywinska, A.; Ball, S.L.; DeWaard, J.R. Biological identifications through DNA barcodes. Proc. R. Soc. Lon. Ser. B Biol. Sci. 2003, 270, 313–321. [Google Scholar] [CrossRef] [Green Version]
  12. Campbell, D.C.; Johnson, P.D.; Williams, J.D.; Rindsberg, A.K.; Serb, J.M.; Small, K.K.; Lydeard, C. Identification of ‘extinct’ freshwater mussel species using DNA barcoding. Mol. Ecol. Res. 2008, 8, 711–724. [Google Scholar] [CrossRef]
  13. Boyer, S.L.; Howe, A.A.; Juergens, N.W.; Hove, M.C. A DNA-barcoding approach to identifying juvenile freshwater mussels (Bivalvia: Unionidae) recovered from naturally infested fishes. J. N. Am. Benthol. Soc. 2011, 30, 182–194. [Google Scholar] [CrossRef]
  14. Wu, R.-W.; Liu, Y.-T.; Sa, W.; Liu, X.-J.; Zanatta, D.T.; Roe, K.J.; Song, X.-L.; An, C.-T.; Wu, X.-P. Testing the utility of DNA barcodes and a preliminary phylogenetic framework for Chinese freshwater mussels (Bivalvia: Unionidae) from the middle and lower Yangtze River. PLoS ONE 2018, 13, e0200956. [Google Scholar] [CrossRef]
  15. Webster, M.; Sheets, H.D. A practical introduction to landmark-based geometric morphometrics. In Quantitative Methods in Paleontology; Alroy, J., Hunt, G., Eds.; Yale University Press: New Haven, CT, USA, 2010; Volume 16, pp. 163–188. [Google Scholar]
  16. Inoue, K.; Hayes, D.M.; Harris, J.L.; Christian, A.D. Phylogenetic and morphometric analyses reveal ecophenotypic plasticity in freshwater mussels Obovaria jacksoniana and Villosa arkansasensis (Bivalvia: Unionidae). Ecol. Evol. 2013, 3, 2670–2683. [Google Scholar] [CrossRef]
  17. Inoue, K.; McQueen, A.L.; Harris, J.L.; Berg, D.J. Molecular phylogenetics and morphological variation reveal recent speciation in freshwater mussels of the genera Arcidens and Arkansia (Bivalvia: Unionidae). Biol. J. Linn. Soc. 2014, 112, 535–545. [Google Scholar] [CrossRef] [Green Version]
  18. Beauchamp, K.A.; Beyett, T.W.; Scott, M.W.; Zanatta, D.T. Detection of hybrid Pyganodon grandis and P. lacustris (Bivalvia: Unionidae) using F- and M-lineage mtDNA sequences and geometric morphometrics. J. Mollusc. Stud. 2020, 86, 233–239. [Google Scholar] [CrossRef]
  19. Beyett, T.W.; McNichols-O’Rourke, K.; Morris, T.J.; Zanatta, D.T. Use of morphometric analyses and DNA barcoding to distinguish Truncilla donaciformis and Truncilla truncata (Bivalvia: Unionidae). Freshw. Moll. Biol. Cons. 2020, in press. [Google Scholar]
  20. Henley, W.F.; Grobler, J.P.; Neves, R.J. Non-invasive method to obtain DNA from freshwater mussels (Bivalvia: Unionidae). J. Shellfish Res. 2006, 25, 975–977. [Google Scholar]
  21. Berg, D.J.; Haag, W.R.; Guttman, S.I.; Sickel, J.B. Mantle biopsy: A technique for nondestructive tissue-sampling of freshwater mussels. J. N. Am. Benth. Soc. 1995, 14, 577–581. [Google Scholar] [CrossRef] [Green Version]
  22. Sambrook, J.; Fritsch, E.F.; Maniatis, T. Molecular Cloning: A Laboratory Manual, 2nd ed.; Cold Spring Harbor Laboratory Press: Plainview, NY, USA, 1989. [Google Scholar]
  23. Campbell, D.C.; Serb, J.M.; Buhay, J.E.; Roe, K.J.; Minton, R.L.; Lydeard, C. Phylogeny of north American amblemines (Bivalvia: Unionoida): Prodigious polyphyly proves pervasive across genera. Invert. Biol. 2005, 124, 131–164. [Google Scholar] [CrossRef]
  24. XLSTAT. XLSTAT: Data Analysis and Statistical Solutions for Microsoft Excel; Addinsoft: Paris, France, 2018. [Google Scholar]
  25. Sheets, H.D. Integrated Morphometrics Package (IMP), Version 8, 2014. Available online: https://www.animal-behaviour.de/imp/ (accessed on 3 May 2020).
Figure 1. Typical F. flava (A) and P. sintoxia (B) specimens showing position of 21 digitized landmarks. Homologous type I landmarks (1 and 2) at the tip of the umbo and posterior end of the hinge ligament are shown in green. Type II landmarks (3–21 in red) along the shell margin were placed using a fan anchored at the median point between landmarks 1 and 2.
Diversity 12 00337 g001
Figure 2. Principal components analysis (PCA) biplot for arcsine transformed shell height/length (H/L), width/length (W/L), width/height (W/H), and hinge length/length (HingeL/L) of F. flava and P. sintoxia specimens.
Diversity 12 00337 g002
Figure 3. Canonical variates analysis (CVA) biplot of F. flava (Ff) and P. sintoxia (Ps) using 21 landmarks (Figure 1). In the legend, “CO1” refers to specimens that were sequenced at COI and used to build the CVA model and “CVA” refers to specimens were assigned to species using the CVA only (no COI sequence). Foot color is indicated using orange or white markers. Significant differences (p < 0.0001) in shell shape were found along axis 1.
Diversity 12 00337 g003
Figure 4. Procrustes deformation grid of shell shape showing differences in mean shell shape between P. sintoxia (circles) and F. flava (ends of vector arrows) along CVA Axis 1 (Figure 3).
Diversity 12 00337 g004
Figure 5. Box plots of scores showing mean, median, quartiles, and outliers, based on identification skill levels (A) and years of experience (B) in correctly identifying pigtoe mussels. Significant groupings from a Kruskal–Wallis and Dunn post-hoc test (p < 0.05) are shown as a and b.
Diversity 12 00337 g005
Table 1. Site locations of F. flava and P. sintoxia and numbers field-identified specimens, cytochrome c oxidase subunit 1 (COI)-confirmed specimens, and specimens identified using geometric morphometric analyses (canonical variates analysis—CVA).
Site (River)LatitudeLongitudeF. flavaP. sintoxia
N Initial Field IDN COI Confirmed IDN Morphometric IDN Initial Field IDN COI Confirmed IDN Morphometric ID
Belle River, MI42.774682−82.551841151615212
Clinton River, MI42.628098−83.395628400044
Kalamazoo River, MI-site 542.338800−85.234710433011
Kalamazoo River, MI-site 942.291040−85.559610181818000
Pine River, MI-LJR43.398068−84.836731322122
Pine River, MI-site 1543.335373−84.712585156651414
Pine River, MI-site 843.425904−84.835667111111999
River Raisin, MI42.177829−84.092819171717333
St Joseph River (Maumee), MI41.781106−84.650714666000
Sydenham River, ON42.589146−82.127622151111599

