Pliocene Origin, Ice Ages and Postglacial Population Expansion Have Influenced a Panmictic Phylogeography of the European Bee-Eater Merops apiaster

 , and
, and 
Abstract
1. Introduction
2. Materials and Methods
2.1. Taxon Sampling, PCR Amplification, and Sequencing
2.2. Demographic Analysis
2.3. Phylogenetic Analyses and Molecular Dating
2.4. Genotyping and Microsatellite Analyses
3. Results
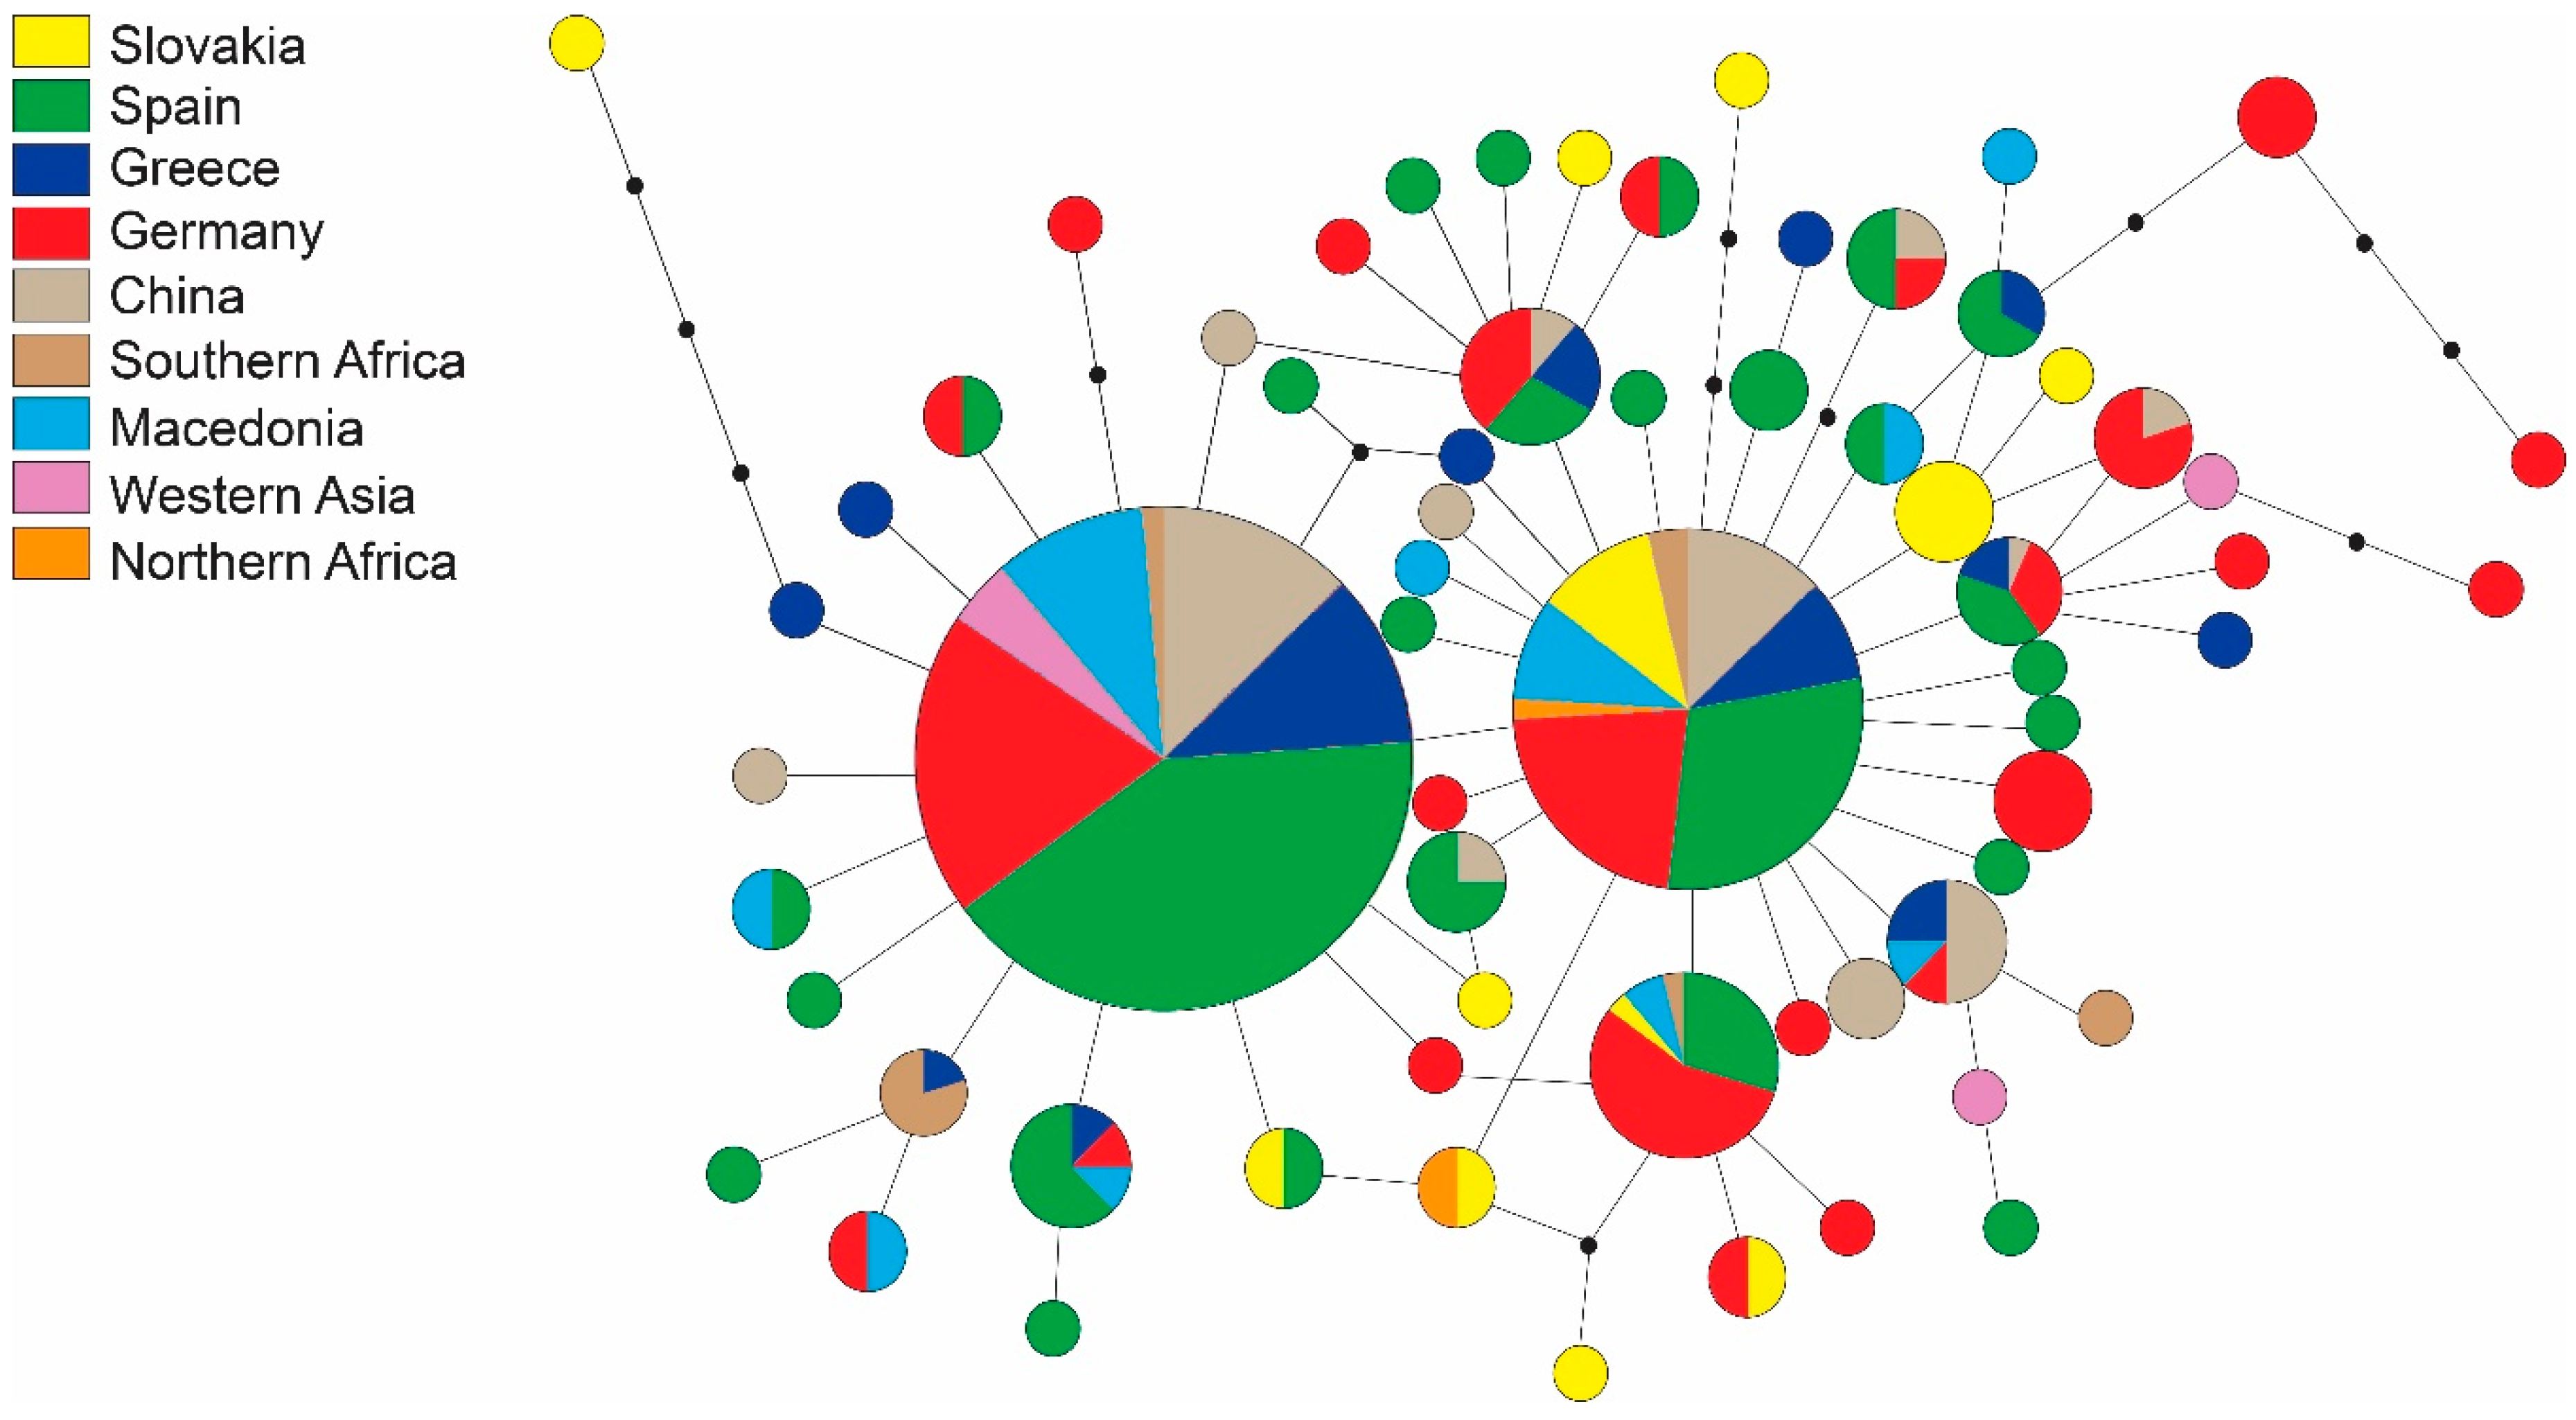
3.1. Sequence Data
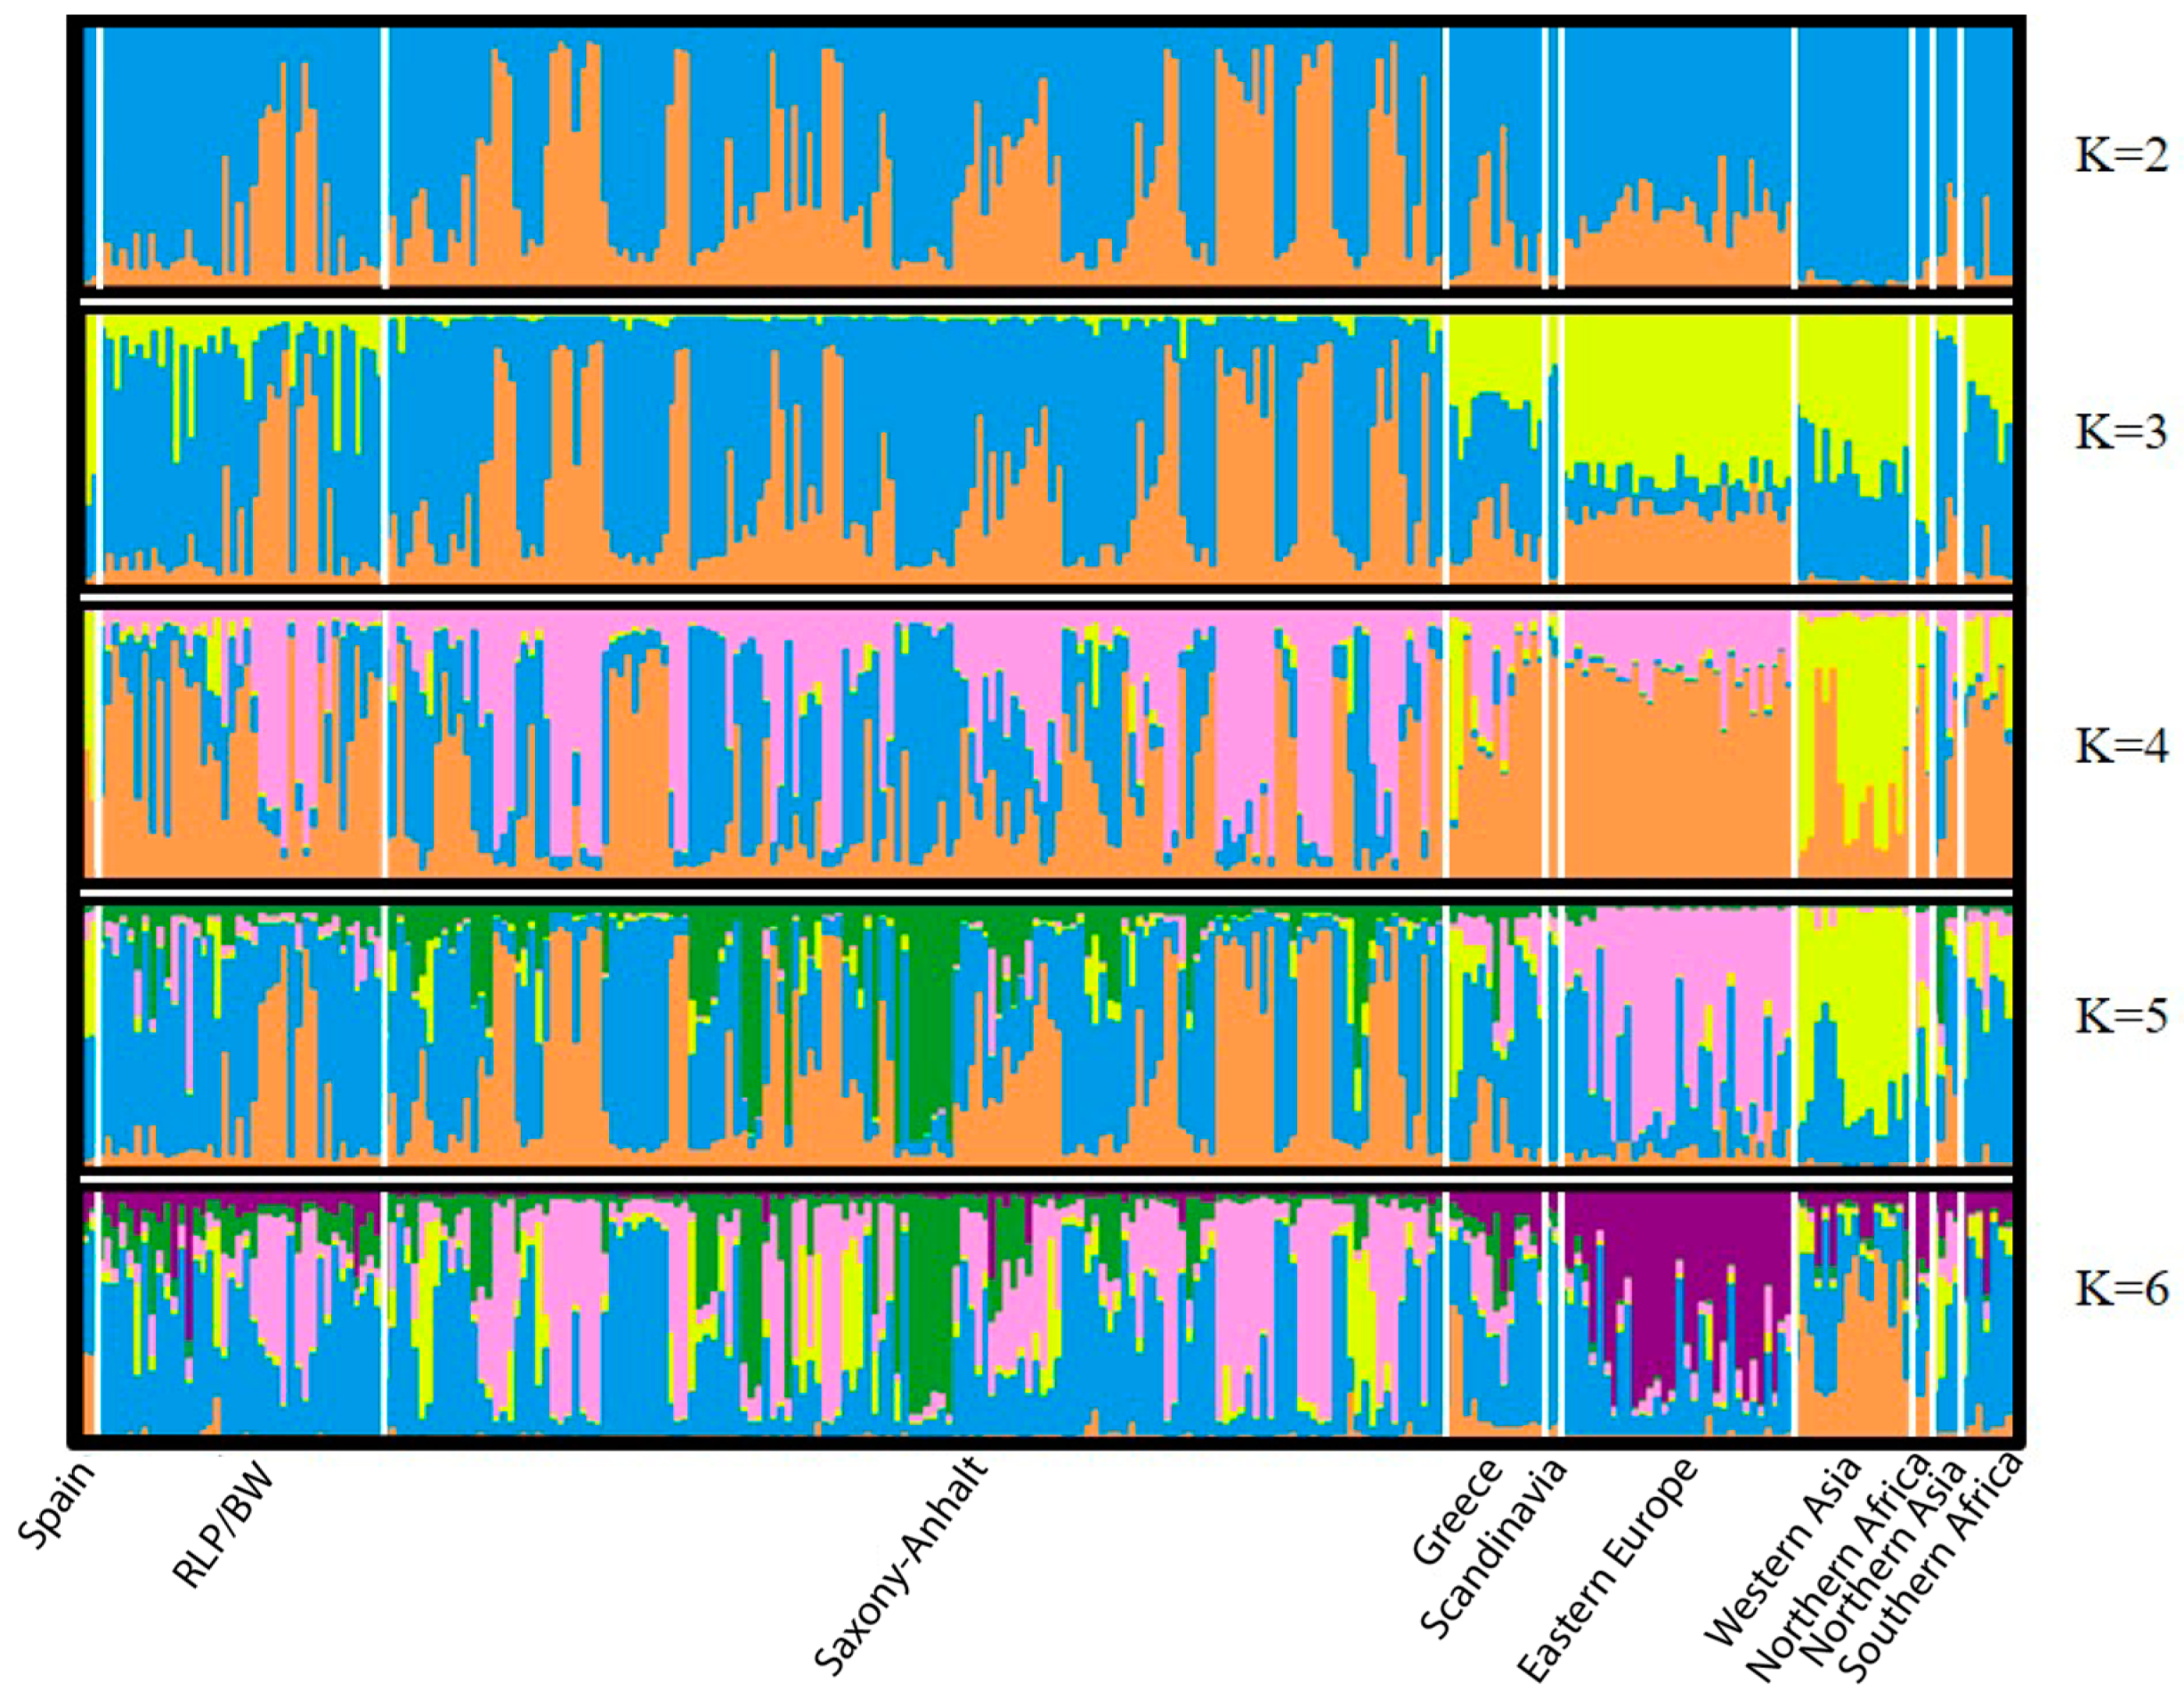
3.2. Microsatellite Data
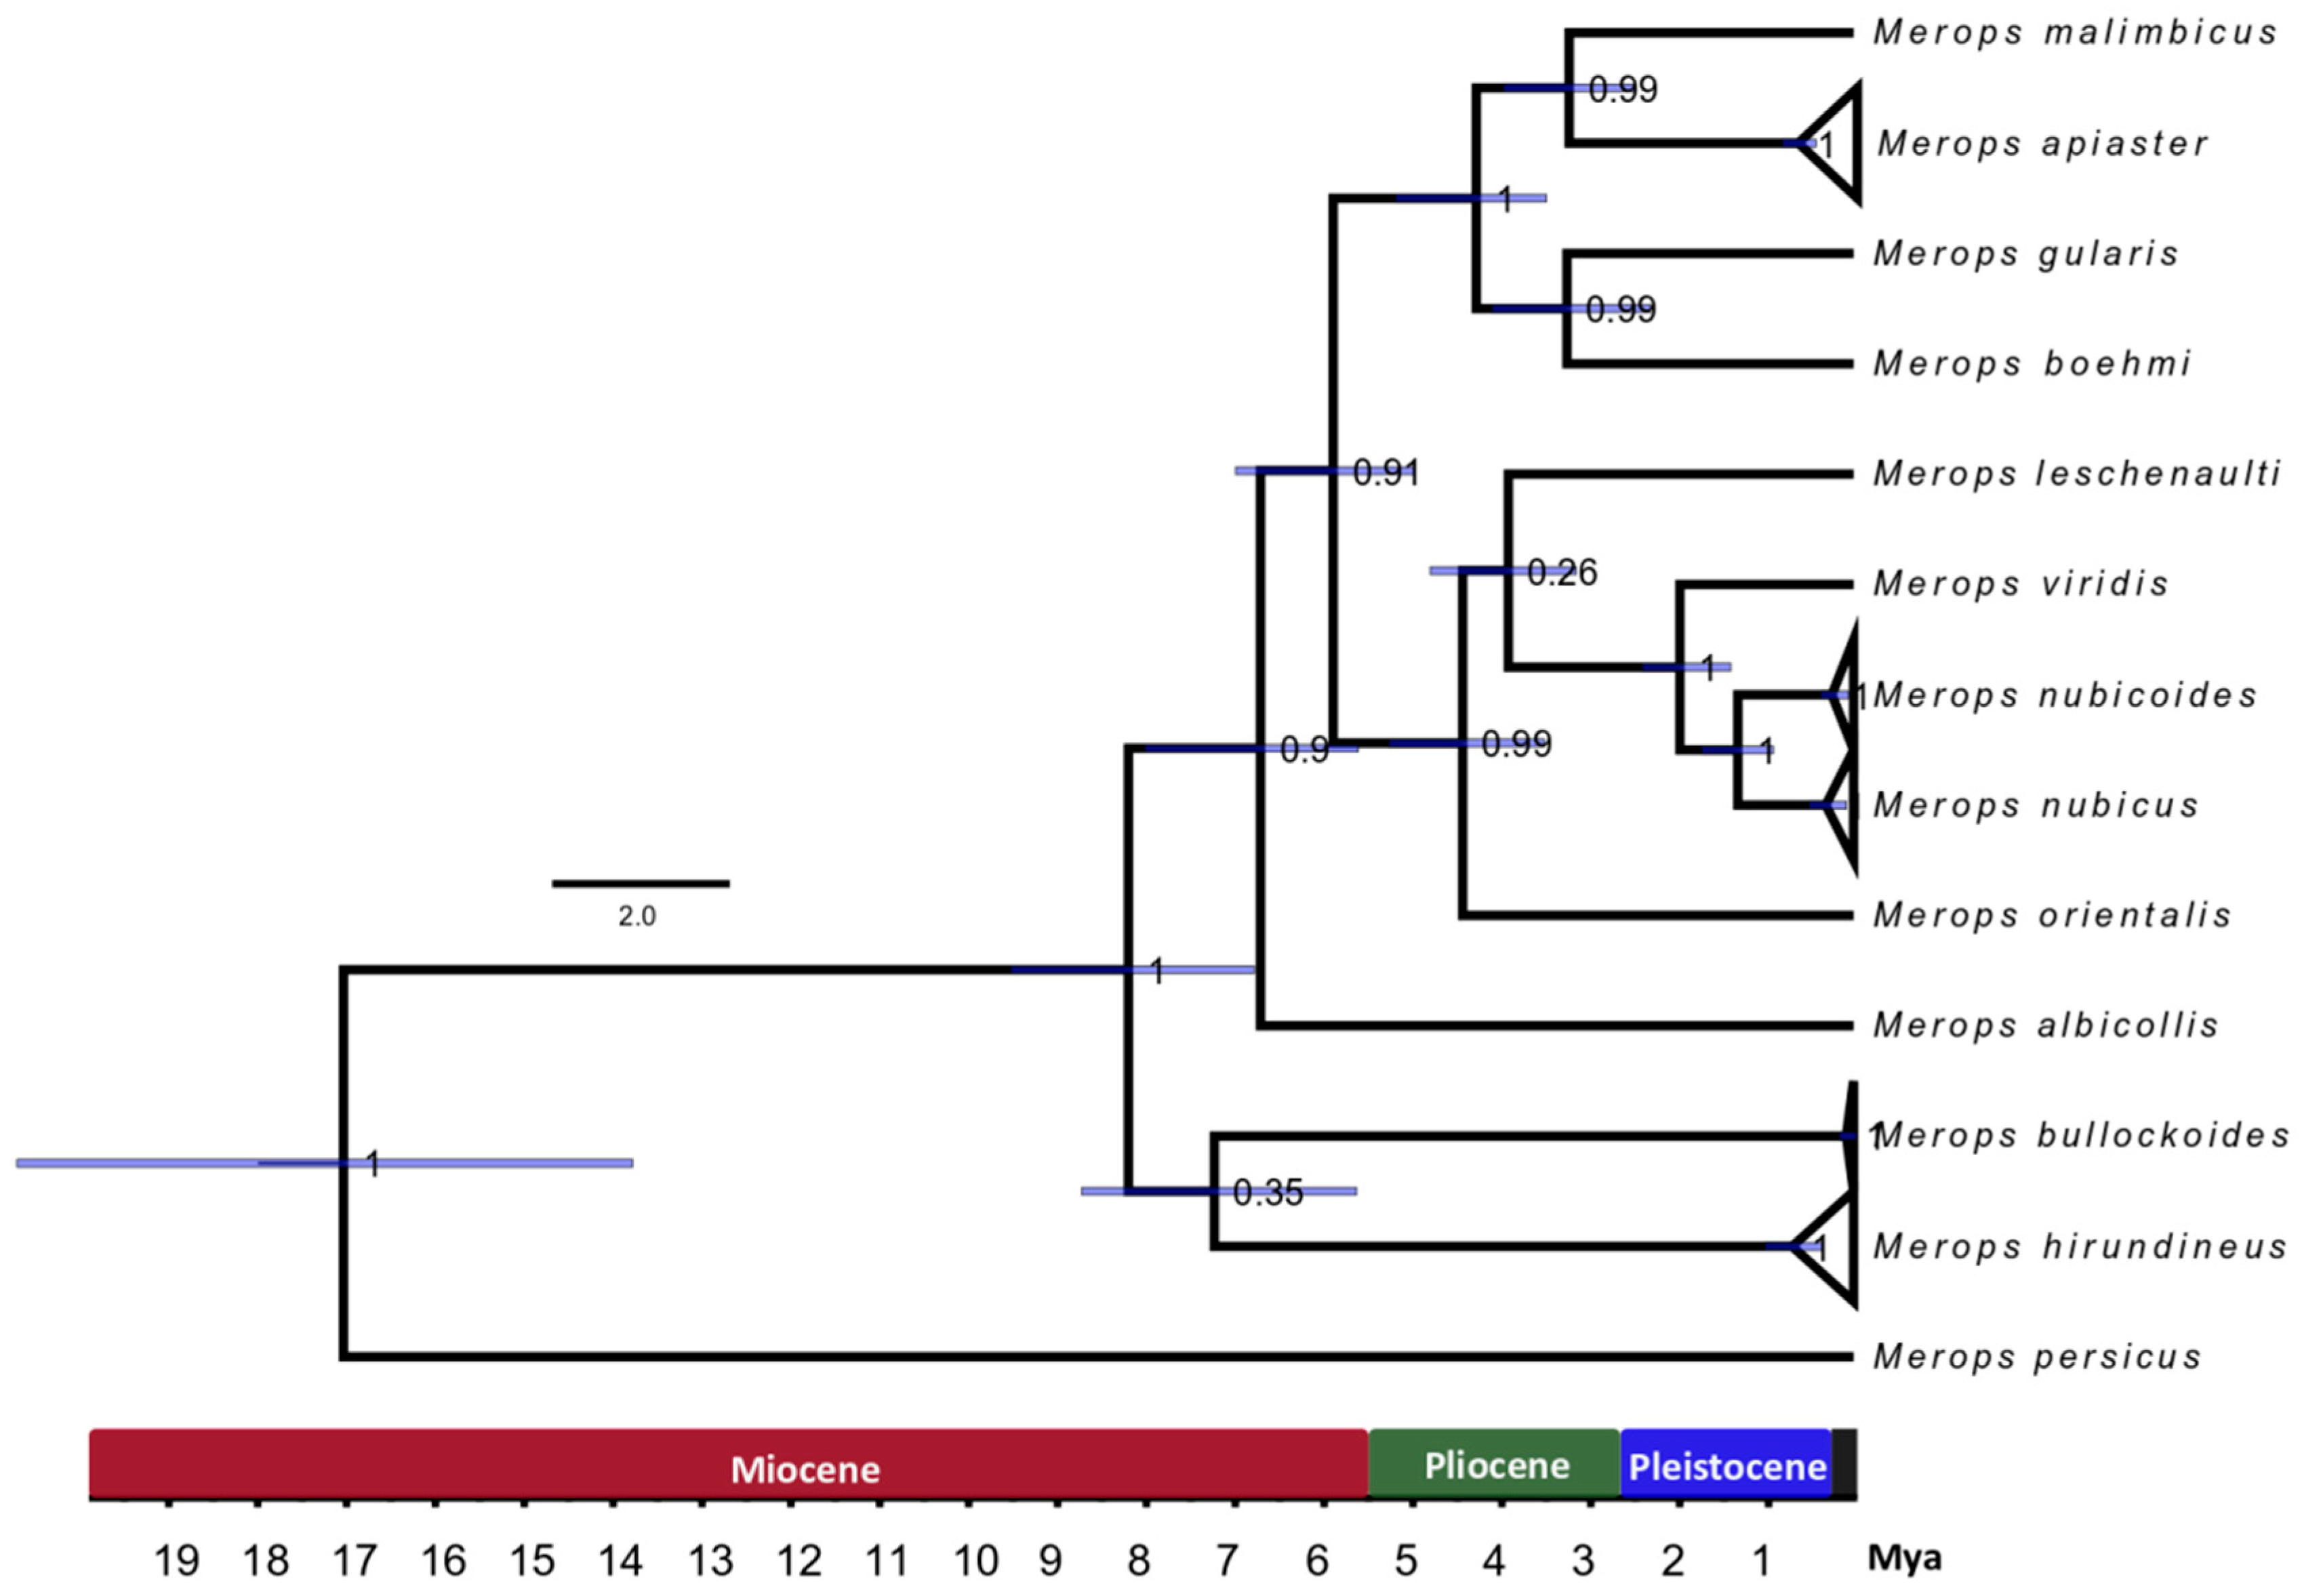
3.3. Divergence Time Estimation
4. Discussion
4.1. Historical Demography of the European Bee-eater
4.2. Lack of Differentiation of the African Populations from Merops apiaster
4.3. Molecular Dating of the European Bee-eater
Supplementary Materials
Author Contributions
Funding
Acknowledgments
Conflicts of Interest
References
- Nittinger, F.; Haring, E.; Pinsker, W.; Wink, M.; Gamauf, A. Out of Africa? Phylogenetic relationships between Falco biarmicus and the other hierofalcons (Aves: Falconidae). J. Zool. Syst. Evol. Res. 2005, 43, 321–331. [Google Scholar] [CrossRef]
- Shephard, J.M.; Ogden, R.; Tryjanowski, P.; Olsson, O.; Galbusera, P. Is population structure in the European white stork determined by flyway permeability rather than translocation history? Ecol. Evol. 2013, 3, 4881–4895. [Google Scholar] [CrossRef] [PubMed]
- Wang, E.; Van Wijk, R.E.; Santhosh, M.; Wink, M. Gene flow and genetic drift contribute to high genetic diversity with low phylogeographical structure in European hoopoes (Upupa epops). Mol. Phylogenet. Evol. 2017, 113, 113–125. [Google Scholar] [CrossRef] [PubMed]
- Cresswell, W. Migratory connectivity of Palaearctic-African migratory birds and their responses to environmental change: The serial residency hypothesis. Ibis 2014, 156, 493–510. [Google Scholar] [CrossRef]
- Irwin, D.E.; Irwin, J.H.; Smith, T.B. Genetic variation and seasonal migratory connectivity in Wilson’s warblers (Wilsonia pusilla): Species-level differences in nuclear DNA between western and eastern populations: Migratory connectivity and genetic divergence. Mol. Ecol. 2011, 20, 3102–3115. [Google Scholar] [CrossRef] [PubMed]
- Hewitt, G. The genetic legacy of the Quaternary ice ages. Nature 2000, 405, 907–913. [Google Scholar] [CrossRef] [PubMed]
- Newton, I.; Brockie, K. The Migration Ecology of Birds; Elsevier/Academic Press: Amsterdam, The Netherlands, 2008; ISBN 978-0-12-517367-4. [Google Scholar]
- Moreau, R.E. The main vicissitudes of the european avifauna since the Pliocene. Ibis 2008, 96, 411–431. [Google Scholar] [CrossRef]
- Fry, C.H. Family Meropidae (bee-eaters). In Handbook of the Birds of the World; Lynx Edicions: Barcelona, Spain, 2001; Volume 6, pp. 286–341. ISBN 84-87334-30-X. [Google Scholar]
- Marks, B.D.; Weckstein, J.D.; Moyle, R.G. Molecular phylogenetics of the bee-eaters (Aves: Meropidae) based on nuclear and mitochondrial DNA sequence data. Mol. Phylogenet. Evol. 2007, 45, 23–32. [Google Scholar] [CrossRef]
- Burt, B.D. Plumage-based phylogenetic analyses of the Merops. Mol. Phylogenet. Evol. 2004, 146, 481–492. [Google Scholar]
- Howard, R.; Moore, A.; Dickinson, E.C. The Howard and Moore Complete Checklist of the Birds of the World, Enlarged 3rd ed.; Princeton University Press: Princeton, NJ, USA, 2003; ISBN 978-0-691-11701-0. [Google Scholar]
- Fraser, P.A.; Rogers, M.J.; Calandrella, S.L. Report on scarce migrant birds in Britain in 2001. Br. Birds 2003, 96, 626–649. [Google Scholar]
- Ramos, R.; Song, G.; Navarro, J.; Zhang, R.; Symes, C.T.; Forero, M.G. Population genetic structure and long-distance dispersal of a recently expanding migratory bird. Mol. Phylogenet. Evol. 2016, 99, 194–203. [Google Scholar] [CrossRef] [PubMed]
- Sambrook, J.; Fritsch, E.F.; Maniatis, T. Molecular Cloning: A Laboratory Manual; Cold Spring Harbor Laboratory Press: Cold Spring Harbor, NY, USA, 1989; ISBN-13 978-0879693091. [Google Scholar]
- Sorenson, M.D.; Ast, J.C.; Dimcheff, D.E.; Yuri, T.; Mindell, D.P. Primers for a PCR-Based Approach to Mitochondrial Genome Sequencing in Birds and Other Vertebrates. Mol. Phylogenet. Evol. 1999, 12, 105–114. [Google Scholar] [CrossRef] [PubMed]
- Brumfield, R.T.; Edwards, S.V. Evolution into and out of the Andes: A Bayesian analysis of historical diversification in Thamnophilus Antshrikes. Evolution 2007, 61, 346–367. [Google Scholar] [CrossRef]
- Librado, P.; Rozas, J. DnaSP v5: A software for comprehensive analysis of DNA polymorphism data. Bioinformatics 2009, 25, 1451–1452. [Google Scholar] [CrossRef] [PubMed]
- Rogers, A.H.; Harpending, H. Population growth makes waves in the distribution of pairwise genetic differences. Mol. Biol. Evol. 1992, 9, 552–569. [Google Scholar] [CrossRef]
- Harpending, H.C. Signature of Ancient Population Growth in a Low-Resolution Mitochondrial DNA Mismatch Distribution. Hum. Biol. 1994, 66, 591–600. [Google Scholar]
- Posada, D. jModelTest: Phylogenetic Model Averaging. Mol. Biol. Evol. 2008, 25, 1253–1256. [Google Scholar] [CrossRef]
- Weir, J.T.; Schluter, D. Calibrating the avian molecular clock: Avian Molecular Clock. Mol. Ecol. 2008, 17, 2321–2328. [Google Scholar] [CrossRef]
- Drummond, A.J.; Suchard, M.A.; Xie, D.; Rambaut, A. Bayesian Phylogenetics with BEAUti and the BEAST 1.7. Mol. Biol. Evol. 2012, 29, 1969–1973. [Google Scholar] [CrossRef]
- Rambaut, A.; Drummond, A.J. Tracer v. 1.5; Institute of Evolutionary Biology, University of Edinburgh: Edinburgh, UK, 2014. [Google Scholar]
- Miller, M.A.; Pfeiffer, W.; Schwartz, T. Creating the CIPRES Science Gateway for inference of large phylogenetic trees. In Proceedings of the 2010 Gateway Computing Environments Workshop (GCE), New Orleans, LA, USA, 14 November 2010. [Google Scholar]
- Dasmahapatra, K.K.; Lessels, C.M.; Mateman, A.C.; Amos, W. Microsatellite loci in the European bee-eater, Merops apiaster. Mol. Ecol. 2004, 500–502. [Google Scholar] [CrossRef]
- Van Oosterhout, C.; Hutchinson, W.F.; Wills, D.P.M.; Shipley, P. micro-checker: Software for identifying and correcting genotyping errors in microsatellite data. Mol. Ecol. Notes 2004, 4, 535–538. [Google Scholar] [CrossRef]
- Rousset, F. Genepop’007: A complete re-implementation of the genepop software for Windows and Linux. Mol. Ecol. Resour. 2008, 8, 103–106. [Google Scholar] [CrossRef]
- Belkhir, K. GENETIX (v4. 04): A Windows Program for Population Genetic Analysis; Laboratorie Genome, Populations Interactions, UPR 5000 du CNRS; Universite Montpellier II: Montpellier, France, 1999. [Google Scholar]
- Goudet, J. FSTAT, A Program to Estimate and Test Gene Diversity and Fixation Indices (Version 2.9.3.2); Lausanne University: Lausanne, Switzerland, 2001. [Google Scholar]
- Weir, B.S.; Cockerham, C.C. Estimating F-statistics for the analysis of population structure. Evolution 1984, 38, 1358–1370. [Google Scholar] [CrossRef]
- Excoffier, L.; Laval, G.; Schneider, S. Arlequin (version 3.0): An integrated software package for population genetics data analysis. Evol. Bioinform. 2005, 1, 47–50. [Google Scholar] [CrossRef]
- Jombart, T. adegenet: A R package for the multivariate analysis of genetic markers. Bioinformatics 2008, 24, 1403–1405. [Google Scholar] [CrossRef]
- Pritchard, J.K.; Stephens, M.; Donnelly, P. Inference of population structure using multilocus genotype data. Genetics 2000, 155, 945–959. [Google Scholar]
- Evanno, G.; Regnaut, S.; Goudet, J. Detecting the number of clusters of individuals using the software structure: A simulation study. Mol. Ecol. 2005, 14, 2611–2620. [Google Scholar] [CrossRef]
- Piry, S.; Luikart, G.; Cornuet, J.M. BOTTLENECK: A computer program for detecting recent reductions in the effective population size using allele frequency data. J. Hered. 1999, 90, 502–503. [Google Scholar] [CrossRef]
- Di Rienzo, A.; Peterson, A.C.; Garza, J.C.; Valdes, A.M.; Slatkin, M.; Freimer, N.B. Mutational processes of simple-sequence repeat loci in human populations. Proc. Natl. Acad. Sci. USA 1994, 91, 3166–3170. [Google Scholar] [CrossRef]
- Piry, S.; Alapetite, A.; Cornuet, J.-M.; Paetkau, D.; Baudouin, L.; Estoup, A. GENECLASS2: A Software for Genetic Assignment and First-Generation Migrant Detection. J. Hered. 2004, 95, 536–539. [Google Scholar] [CrossRef] [PubMed]
- Paetkau, D.; Slade, R.; Burden, M.; Estoup, A. Genetic assignment methods for the direct, real-time estimation of migration rate: A simulation-based exploration of accuracy and power. Mol. Ecol. 2004, 13, 55–65. [Google Scholar] [CrossRef] [PubMed]
- Arbabi, T.; Gonzalez, J.; Witt, H.-H.; Klein, R.; Wink, M. Mitochondrial phylogeography of the Eurasian Reed Warbler Acrocephalus scirpaceus and the first genetic record of A. s. fuscus in Central Europe. Ibis 2014, 156, 799–811. [Google Scholar] [CrossRef]
- Dhanjal-Adams, K.L.; Bauer, S.; Emmenegger, T.; Hahn, S.; Lisovski, S.; Liechti, F. Spatiotemporal group dynamics in a long-distance migratory bird. Curr. Biol. 2018, 28, 2824–2830. [Google Scholar] [CrossRef] [PubMed]
- Guillemain, M.; Sadoul, N.; Simon, G. European flyway permeability and abmigration in Teal Anas crecca, an analysis based on ringing recoveries. Ibis 2005, 147, 688–696. [Google Scholar] [CrossRef]
- Ericson, P.G.; Anderson, C.L.; Britton, T.; Elzanowski, A.; Johansson, U.S.; Kallersjo, M.; Ohlson, J.I.; Parsons, T.J.; Zuccon, D.; Mayr, G. Diversification of Neoaves: Integration of molecular sequence data and fossils. Biol. Lett. 2006, 2, 543–547. [Google Scholar] [CrossRef] [PubMed]
- Woodruff, D.S. Biogeography and conservation in Southeast Asia: How 2.7 million years of repeated environmental fluctuations affect today’s patterns and the future of the remaining refugial-phase biodiversity. Biodivers. Conserv. 2010, 19, 919–941. [Google Scholar] [CrossRef]
- Fjeldså, J.; Bowie, R.C.K. New perspectives on the origin and diversification of Africa’s forest avifauna. Afr. J. Ecol. 2008, 46, 235–247. [Google Scholar] [CrossRef]
- Johansson, U.S.; Fjeldså, J.; Bowie, R.C.K. Phylogenetic relationships within Passerida (Aves: Passeriformes): A review and a new molecular phylogeny based on three nuclear intron markers. Mol. Phylogenet. Evol. 2008, 48, 858–876. [Google Scholar] [CrossRef]


| Region | Locality | N | H | s | Hd | Pi | Fu and Li’s F | Fu’s Fs | Tajima’s D |
|---|---|---|---|---|---|---|---|---|---|
| Western Europe | RLP/BW | 14 | 9 | 13 | 0.879 | 0.0041 | −2.427 * | −4.417 * | −1.857 * |
| Saxony-Anhalt | 67 | 17 | 23 | 0.886 | 0.0037 | −2.868 * | −6.179 * | −1.472 | |
| Greece | 39 | 23 | 25 | 0.945 | 0.0036 | −2.249 | −18.44 * | −1.751 | |
| Spain | 96 | 32 | 38 | 0.886 | 0.0027 | −3.919 * | −29.18 * | −2.189 * | |
| Eastern Europe | Slovakia | 22 | 12 | 15 | 0.870 | 0.0045 | −1.866 | −5.870 * | −1.473 |
| Macedonia | 20 | 14 | 18 | 0.958 | 0.0028 | −2.730 * | −9.967 * | −1.916 * | |
| Western Asia | Western Asia | 5 | 3 | 5 | 0.700 | 0.0030 | −0.577 | 0.804 | −0.561 |
| Central Asia | China | 32 | 16 | 86 | 0.927 | 0.0087 | −4.7645 * | −2.060 | −2.525 * |
| Southern Africa | South Africa | 7 | 5 | 5 | 0.905 | 0.0032 | −0.392 | −1.654 | −0.330 |
| All | 296 | 56 | 86 | 0.878 | 0.0043 | −6.800 * | −64.19 * | −2.524 * |
| Hap | Variable Sites | N | Localities | |||||||||||||||||||||||||||||||||||||||||
|---|---|---|---|---|---|---|---|---|---|---|---|---|---|---|---|---|---|---|---|---|---|---|---|---|---|---|---|---|---|---|---|---|---|---|---|---|---|---|---|---|---|---|---|---|
| H1 | T | T | T | T | T | C | C | A | C | T | G | G | A | A | T | C | T | C | T | G | G | C | T | T | C | A | T | C | A | A | C | T | G | C | C | T | T | T | G | A | C | C | 64 | China, Greece, Spain, Macedonia, Saxony-Anhalt, Baden-Württemberg, Rhineland-Palatinate, Turkey, Southern Africa. |
| H2 | . | . | . | . | . | T | . | . | . | . | . | . | . | . | . | . | . | . | . | . | . | . | . | . | . | . | . | . | . | . | . | . | . | . | . | . | . | . | . | . | . | . | 32 | China, Greece, Spain, Slovakia, Macedonia, Saxony-Anhalt, Egypt, Tunisia, Baden-Württemberg, Rhineland-Palatinate. |
| H3 | . | . | . | . | . | T | . | . | . | . | . | . | . | . | . | T | . | . | . | . | . | . | . | . | . | . | . | . | . | . | . | . | . | . | . | . | . | . | . | . | . | . | 27 | Saxony-Anhalt, Spain, Macedonia, BW/RLP, Slovakia, Southern Africa. |
| H4 | . | . | . | . | C | T | . | . | . | . | . | . | . | . | . | . | . | . | . | . | . | . | . | . | . | . | . | . | . | . | . | . | . | . | . | . | . | . | . | . | . | . | 17 | China, Greece, Spain, Saxony-Anhalt, Rhineland-Palatinate. |
| H5 | . | . | . | . | . | T | . | . | . | . | . | . | . | . | C | . | . | . | . | . | . | . | . | . | . | . | . | . | . | . | . | . | . | . | . | . | . | . | . | . | . | . | 13 | China, Spain, Saxony-Anhalt, Greece. |
| H6 | . | . | . | . | . | T | . | . | . | . | . | . | . | . | . | . | . | . | . | . | . | . | . | . | . | . | . | . | . | . | . | . | . | A | . | . | . | . | . | . | . | . | 14 | China, Greece, Spain, Southern Africa, Macedonia, Rhineland-Palatinate. |
| H7 | . | . | . | . | . | T | . | . | . | . | . | . | . | . | . | . | . | . | . | . | . | . | . | C | . | . | . | . | . | . | T | . | . | . | . | . | . | . | . | . | . | . | 7 | China, Greece, Macedonia. |
| H8 | . | . | . | . | . | . | . | . | . | . | . | . | . | . | . | . | . | . | C | . | . | . | . | . | . | . | . | . | . | . | . | . | . | . | . | . | . | . | . | . | . | . | 7 | Spain, Greece and Macedonia. |
| H9 | . | . | . | . | . | T | . | G | . | . | . | . | . | . | . | . | . | . | . | . | . | . | . | . | . | . | . | . | . | . | . | . | . | . | . | . | . | . | . | . | . | . | 6 | Slovakia. |
| H10 | . | . | . | . | . | T | . | . | . | . | . | . | . | . | . | . | . | . | . | . | . | . | . | . | . | . | . | . | . | . | . | . | . | . | . | . | C | . | . | . | . | . | 5 | China and Greece. |
| H11 | . | . | C | . | . | T | . | . | . | . | . | . | . | . | . | . | . | . | . | . | . | . | . | . | . | . | . | . | . | . | . | . | . | . | . | . | . | . | . | . | . | . | 4 | Saxony-Anhalt. |
| H12 | . | . | . | . | . | . | . | . | . | . | . | . | . | . | . | . | . | . | . | . | . | . | . | . | . | C | . | . | . | . | . | . | . | . | . | . | . | . | . | . | . | . | 4 | Kazakhstan, Rhineland-Palatinate, Greece. |
| H13 | . | . | . | . | . | T | . | . | . | . | . | . | . | . | . | . | . | . | . | . | . | . | . | . | . | . | . | T | . | . | . | . | . | . | . | . | C | . | . | . | . | . | 4 | Spain and China. |
| H14 | C | . | . | . | . | . | . | . | . | . | . | . | . | . | . | . | . | . | . | . | . | . | . | . | . | . | . | . | . | . | . | . | . | . | . | . | . | . | . | . | . | . | 3 | Southern Africa. |
| H15 | . | . | . | . | . | T | . | . | . | . | . | . | . | . | . | . | . | . | . | . | A | . | . | . | . | . | . | . | . | . | . | . | . | . | . | . | . | . | . | . | . | . | 3 | Spain. |
| H16 | . | . | . | . | . | T | . | . | T | . | . | . | . | . | . | . | . | . | . | . | . | . | . | . | T | . | . | . | . | . | . | . | . | A | . | . | . | . | . | . | . | . | 3 | China and Spain. |
| H17 | . | . | . | . | . | . | . | . | . | . | . | . | . | . | . | . | . | . | . | . | . | . | . | . | . | . | . | . | . | . | . | . | . | . | T | . | . | . | . | . | . | . | 3 | Macedonia and Greece. |
| H18 | . | . | . | C | . | T | . | . | . | . | . | . | . | . | . | . | . | . | . | . | . | . | . | . | . | . | . | . | . | . | . | . | . | . | . | . | . | . | . | . | . | . | 2 | China. |
| H19 | . | . | . | . | . | T | . | . | . | . | . | . | . | . | . | . | . | . | . | . | . | . | . | . | . | . | . | . | . | G | . | . | . | . | . | . | . | . | . | . | . | . | 2 | Spain and Slovakia. |
| H20 | . | . | . | . | . | T | . | . | . | . | . | . | . | . | C | . | . | . | . | . | . | . | . | . | . | . | . | . | . | . | . | C | . | . | . | . | . | . | . | . | . | . | 2 | Spain and Greece. |
| H21 | C | . | . | . | . | . | . | . | . | . | . | . | . | . | . | . | . | . | . | . | . | . | . | . | . | . | C | . | . | . | . | . | . | . | . | . | . | . | . | . | . | . | 2 | Saxony-Anhalt and Macedonia. |
| H22 | . | . | . | . | . | T | . | . | . | . | . | . | . | . | . | T | . | . | . | . | . | . | . | . | . | . | . | . | G | . | . | . | . | . | . | . | . | . | . | . | . | . | 2 | Saxony-Anhalt and Slovakia. |
| Locus | Na | Ar | Ho | Hs | HT | FST |
|---|---|---|---|---|---|---|
| BE129 | 13 | 1.874 | 0.766 | 0.855 | 0.876 | 0.020 |
| BE72 | 17 | 1.805 | 0.904 | 0.846 | 0.862 | 0.030 |
| BE192 | 9 | 1.829 | 0.678 | 0.784 | 0.835 | 0.050 |
| BE216 | 7 | 1.477 | 0.441 | 0.496 | 0.513 | 0.024 |
| BE233 | 8 | 1.522 | 0.402 | 0.456 | 0.458 | 0.008 |
| BE231 | 16 | 1.856 | 0.793 | 0.867 | 0.885 | 0.041 |
| Population | N | Na | Ho | He |
|---|---|---|---|---|
| Spain | 4 | 2.500 | 0.666 | 0.479 |
| RLP/BW (Germany) | 21 | 8.666 | 0.687 | 0.730 |
| Saxony-Anhalt (Germany) | 153 | 10.33 | 0.699 | 0.716 |
| Greece | 14 | 6.833 | 0.658 | 0.688 |
| Scandinavia | 2 | 2.833 | 0.750 | 0.541 |
| Eastern Europe | 32 | 7.166 | 0.624 | 0.599 |
| Western Asia | 16 | 4.090 | 0.616 | 0.691 |
| Northern Africa | 3 | 2.833 | 0.472 | 0.495 |
| Northern Asia | 4 | 4.166 | 0.750 | 0.692 |
| Sub-Saharan Africa | 4 | 5.833 | 0.714 | 0.719 |
| Spain | RLP/BW | Saxony | Greece | Scandinavia | Eastern Europe | Western Asia | Northern Africa | Northern Asia | Sub-Saharan Africa | |
|---|---|---|---|---|---|---|---|---|---|---|
| Spain | - | |||||||||
| RLP/BW | 0.0053 | - | ||||||||
| Saxony-Anhalt | 0.0096 | 0.0003 | - | |||||||
| Greece | 0.0071 | 0.0029 | 0.0121 | - | ||||||
| Scandinavia | 0.0000 | 0.0085 | 0.0096 | 0.0007 | - | |||||
| Eastern Europe | 0.0275 | 0.0228 | 0.0272 | 0.0305 | 0.0353 | - | ||||
| Western Asia | 0.0074 | 0.0077 | 0.0103 | 0.0240 | 0.0074 | 0.0243 | - | |||
| Northern Africa | −0.0514 | −0.0457 | −0.0141 | −0.058 | 0.0366 | −0.1407 | −0.0630 | − | ||
| Northern Asia | 0.0000 | −0.0053 | 0.0039 | −0.058 | 0.0000 | 0.0274 | −0.0012 | −0.0102 | − | |
| Sub-Saharan Africa | −0.0181 | −0.0010 | −0.0001 | 0.0029 | 0.0000 | 0.0211 | 0.0063 | −0.0574 | −0.0090 | - |
| Source of Variation | Sum of Squares | Percentage of Variation | FST | p Value | Average F-Statistics Over All Loci | ||
|---|---|---|---|---|---|---|---|
| FIS | FST | FIT | |||||
| Among groups | 31.064 | 2.522 | 0.01041 | 0.000 | 0.04383 | 0.0305 | 0.0733 |
| Among populations within groups | 11.052 | 1.248 | |||||
| Among individuals within populations | 535.819 | 4.21769 | |||||
| Within populations | 512.000 | 92.01154 | |||||
© 2019 by the authors. Licensee MDPI, Basel, Switzerland. This article is an open access article distributed under the terms and conditions of the Creative Commons Attribution (CC BY) license (http://creativecommons.org/licenses/by/4.0/).
Share and Cite
Carneiro de Melo Moura, C.; Bastian, H.-V.; Bastian, A.; Wang, E.; Wang, X.; Wink, M. Pliocene Origin, Ice Ages and Postglacial Population Expansion Have Influenced a Panmictic Phylogeography of the European Bee-Eater Merops apiaster. Diversity 2019, 11, 12. https://doi.org/10.3390/d11010012
Carneiro de Melo Moura C, Bastian H-V, Bastian A, Wang E, Wang X, Wink M. Pliocene Origin, Ice Ages and Postglacial Population Expansion Have Influenced a Panmictic Phylogeography of the European Bee-Eater Merops apiaster. Diversity. 2019; 11(1):12. https://doi.org/10.3390/d11010012
Chicago/Turabian StyleCarneiro de Melo Moura, Carina, Hans-Valentin Bastian, Anita Bastian, Erjia Wang, Xiaojuan Wang, and Michael Wink. 2019. "Pliocene Origin, Ice Ages and Postglacial Population Expansion Have Influenced a Panmictic Phylogeography of the European Bee-Eater Merops apiaster" Diversity 11, no. 1: 12. https://doi.org/10.3390/d11010012
APA StyleCarneiro de Melo Moura, C., Bastian, H.-V., Bastian, A., Wang, E., Wang, X., & Wink, M. (2019). Pliocene Origin, Ice Ages and Postglacial Population Expansion Have Influenced a Panmictic Phylogeography of the European Bee-Eater Merops apiaster. Diversity, 11(1), 12. https://doi.org/10.3390/d11010012