
Trimethylamine N-Oxide as a Biomarker for Left Ventricular Diastolic Dysfunction and Functional Remodeling After STEMI

 , , , ,
  ,
,
Abstract
1. Introduction
2. Results
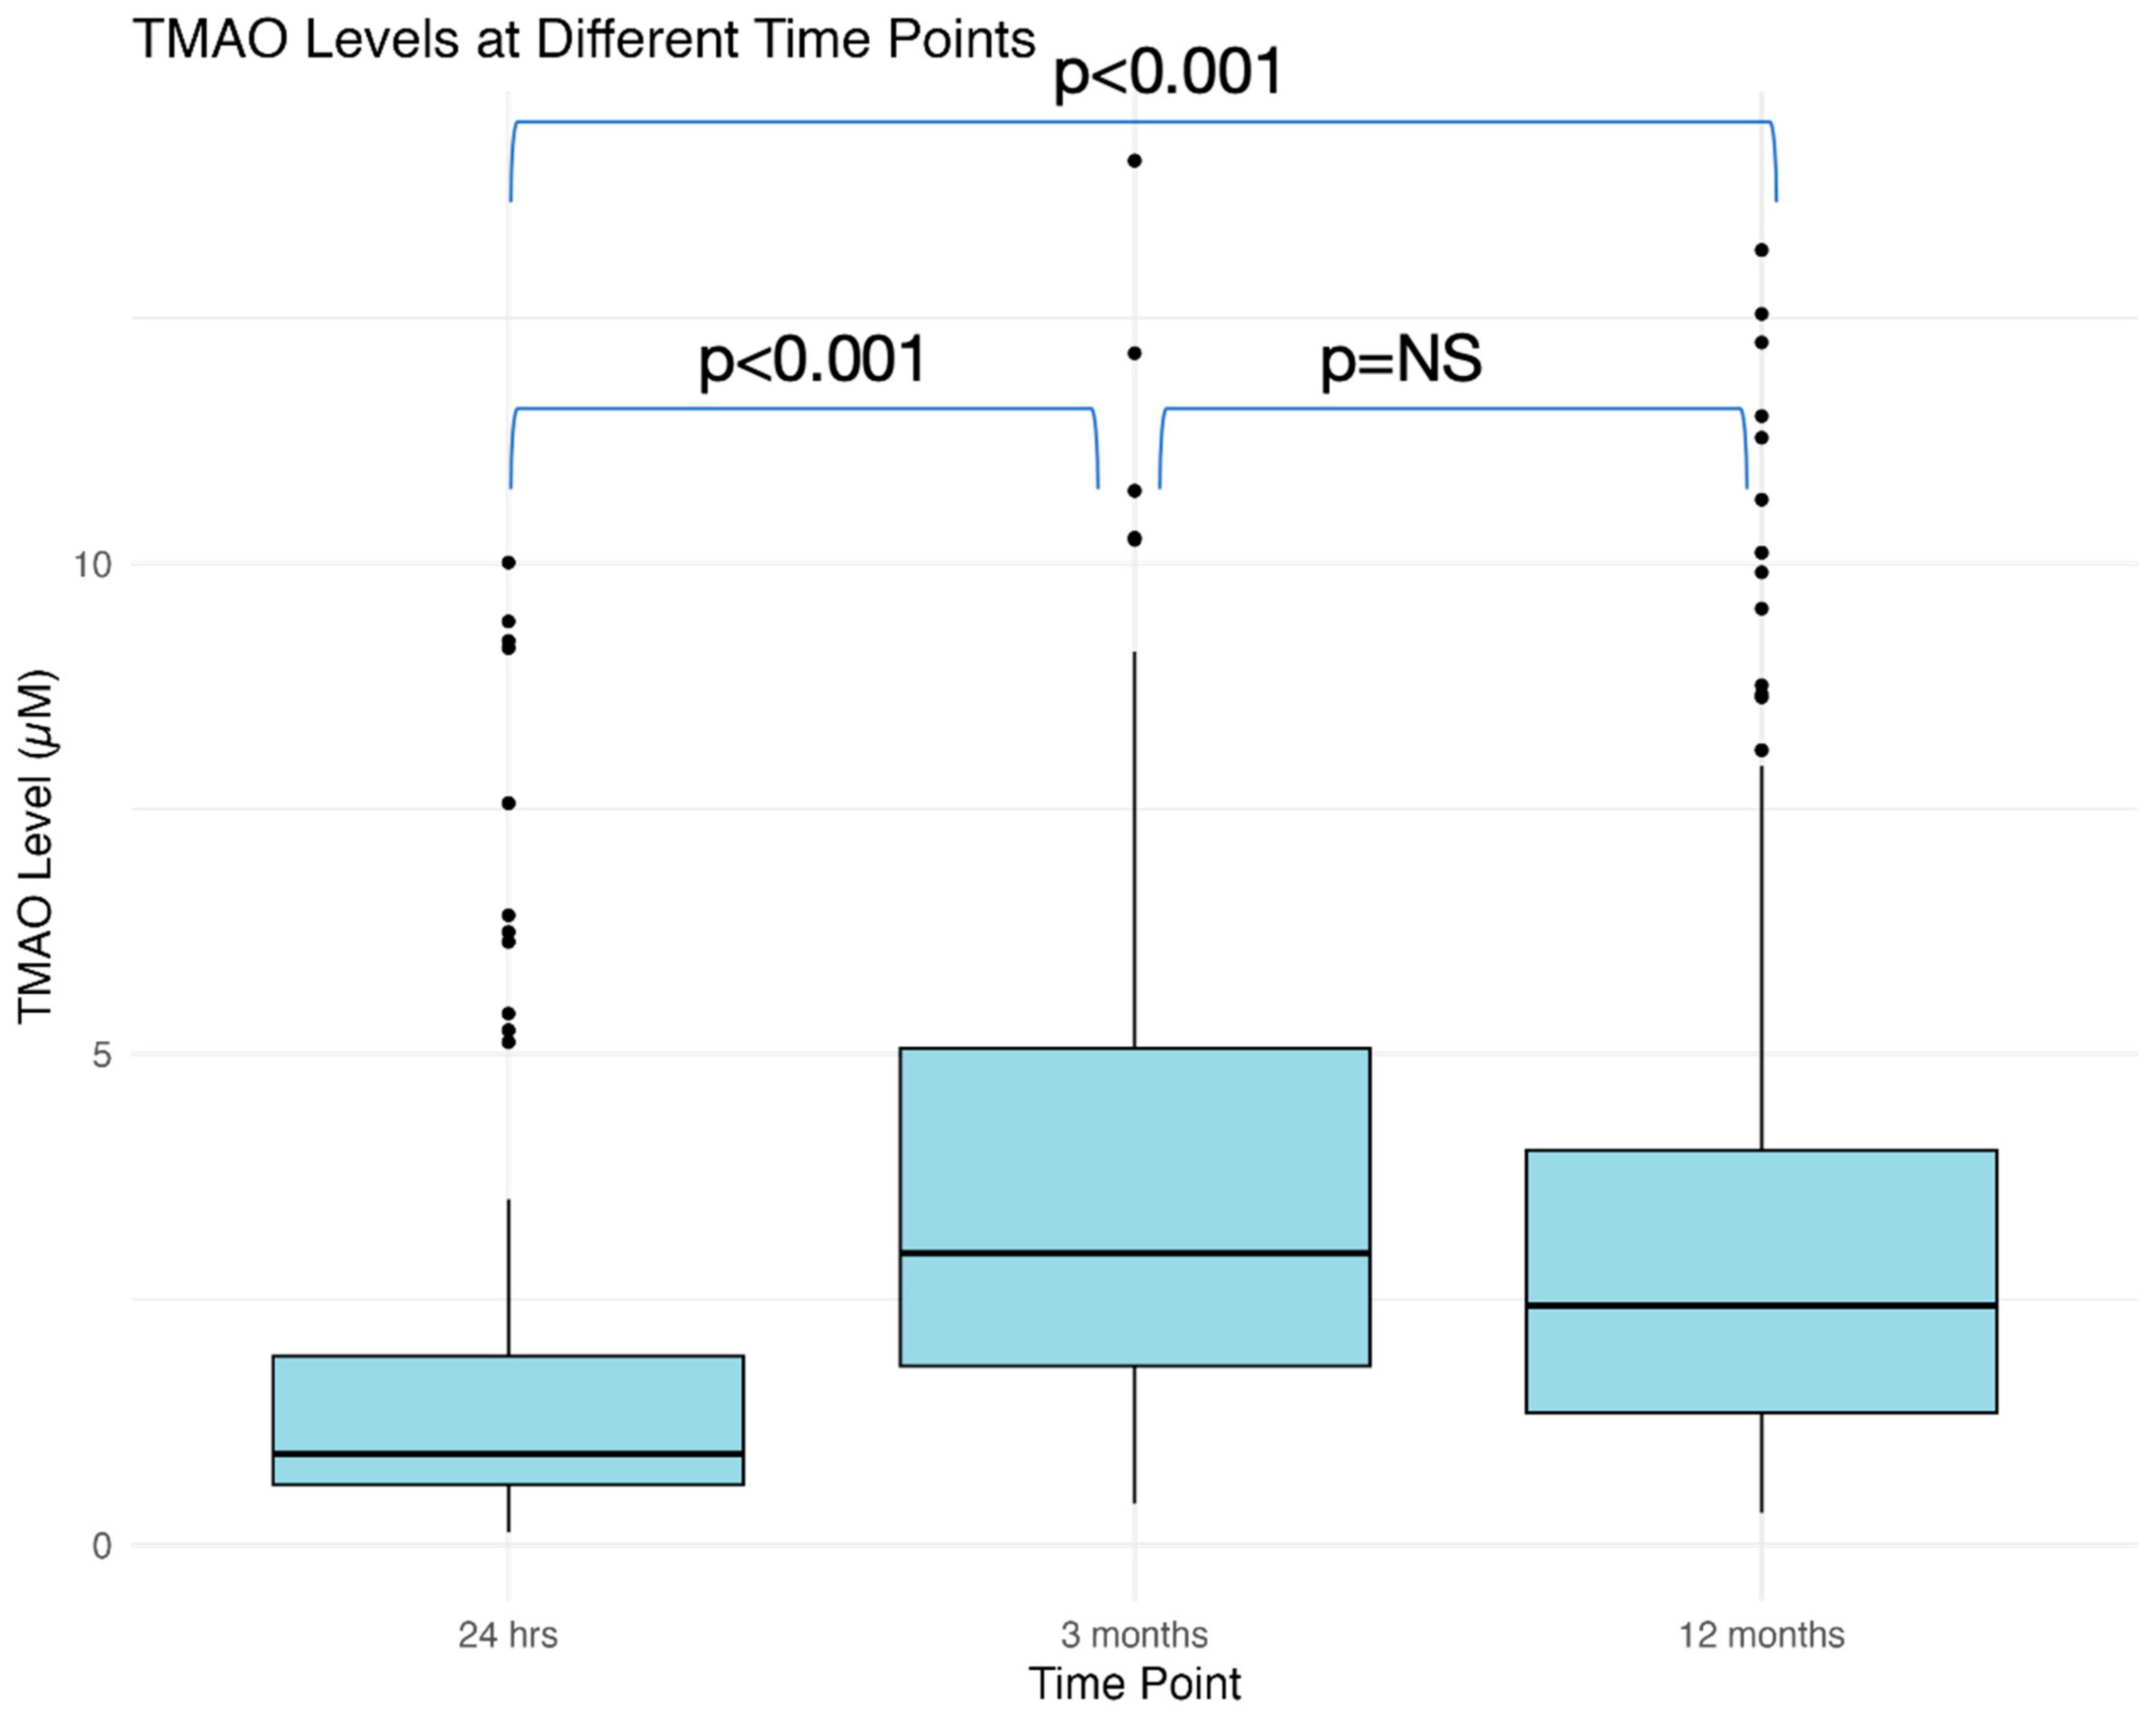
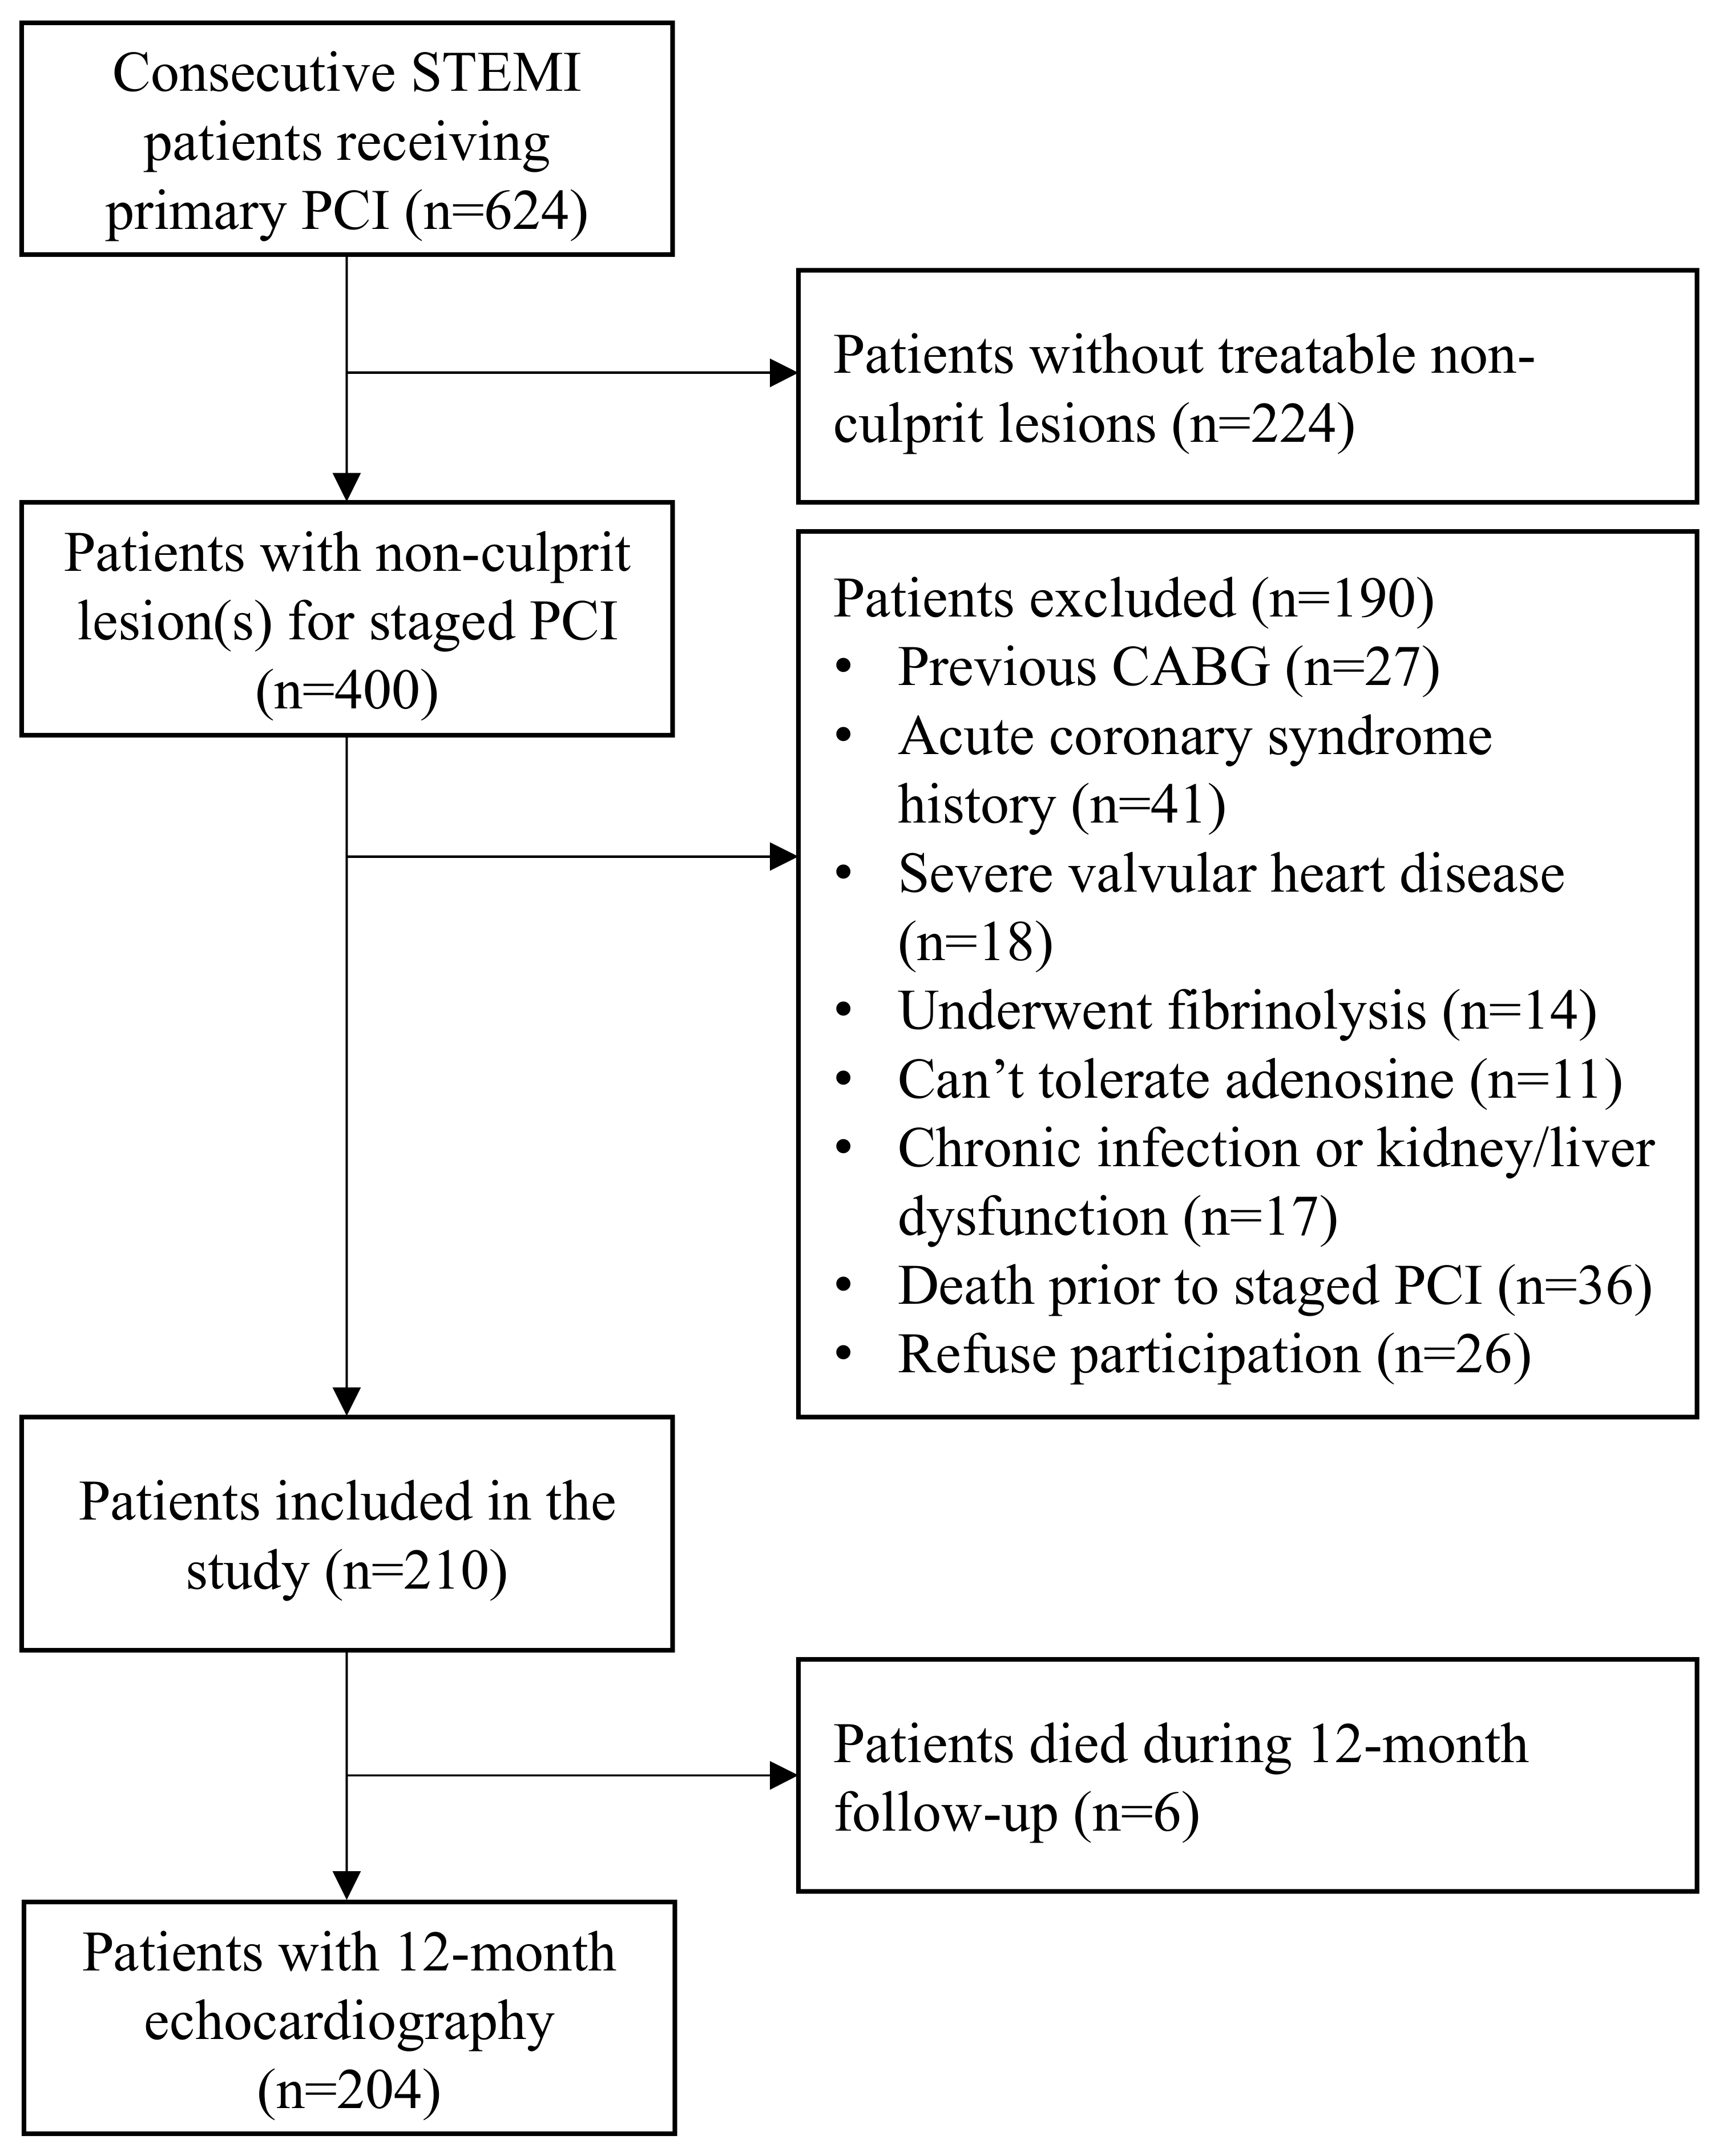
2.1. Study Population
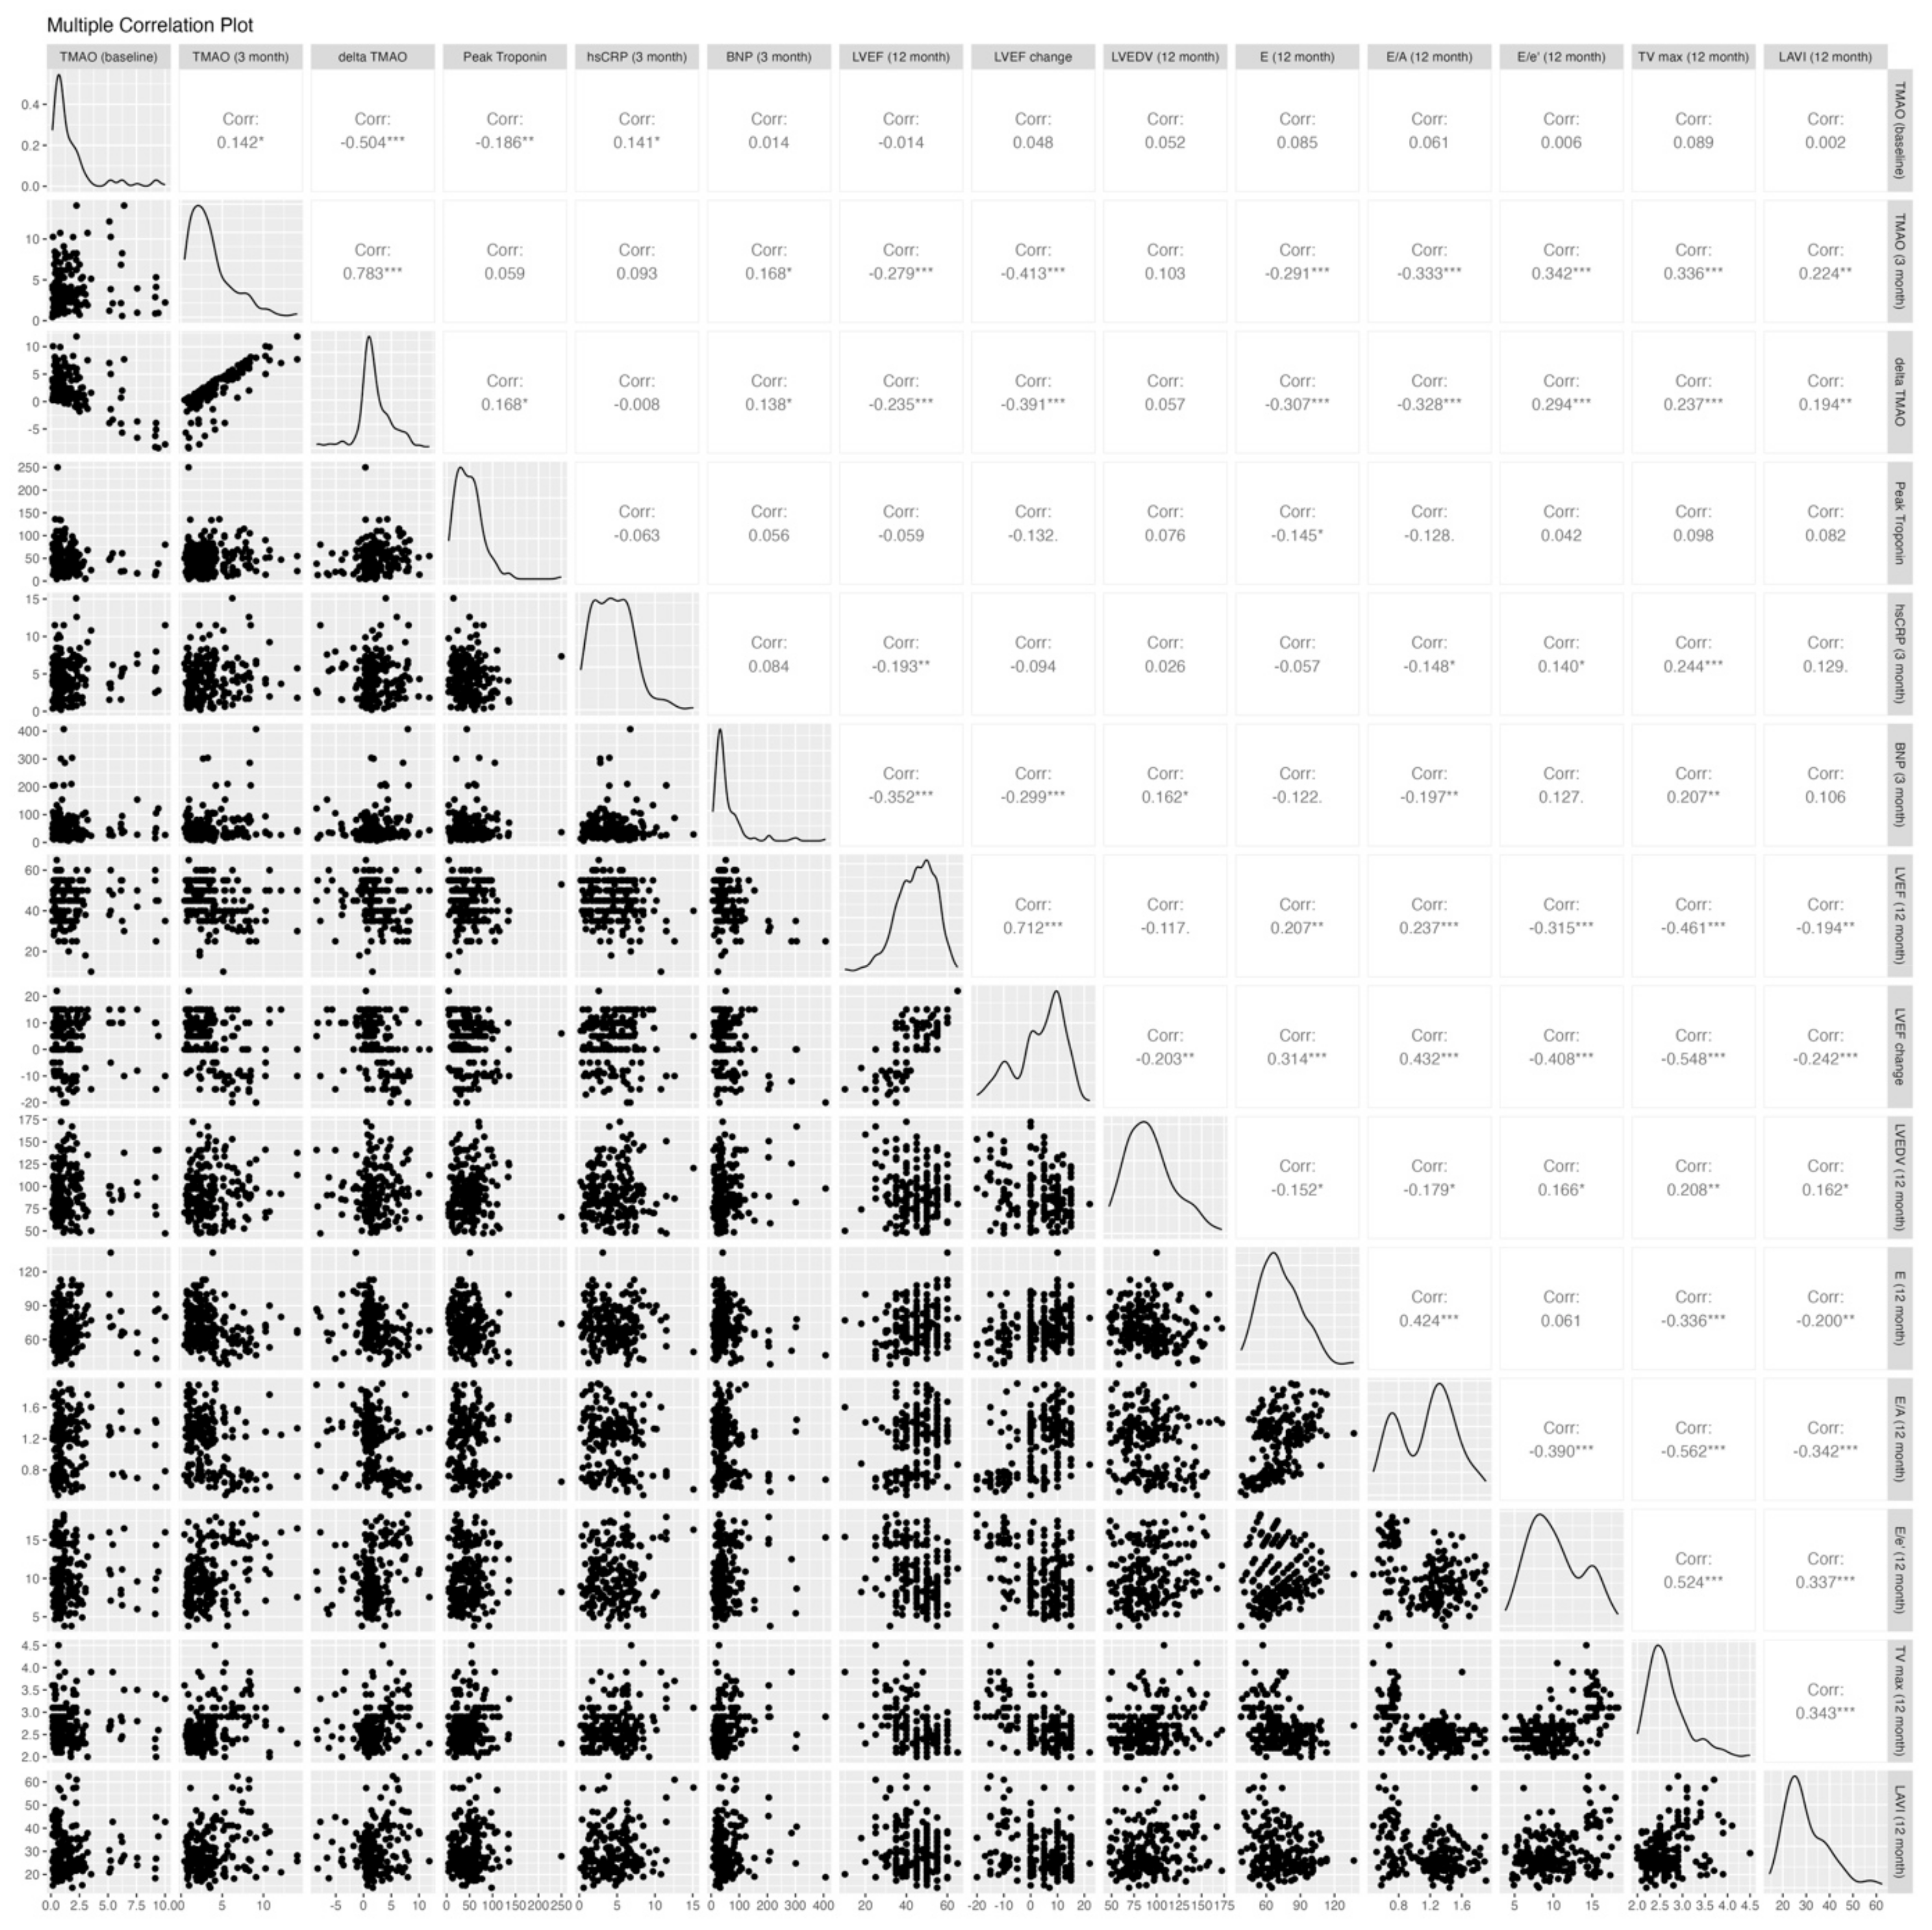
2.2. Association Between Trimethylamine N-Oxide and LV Systolic and Diastolic Function
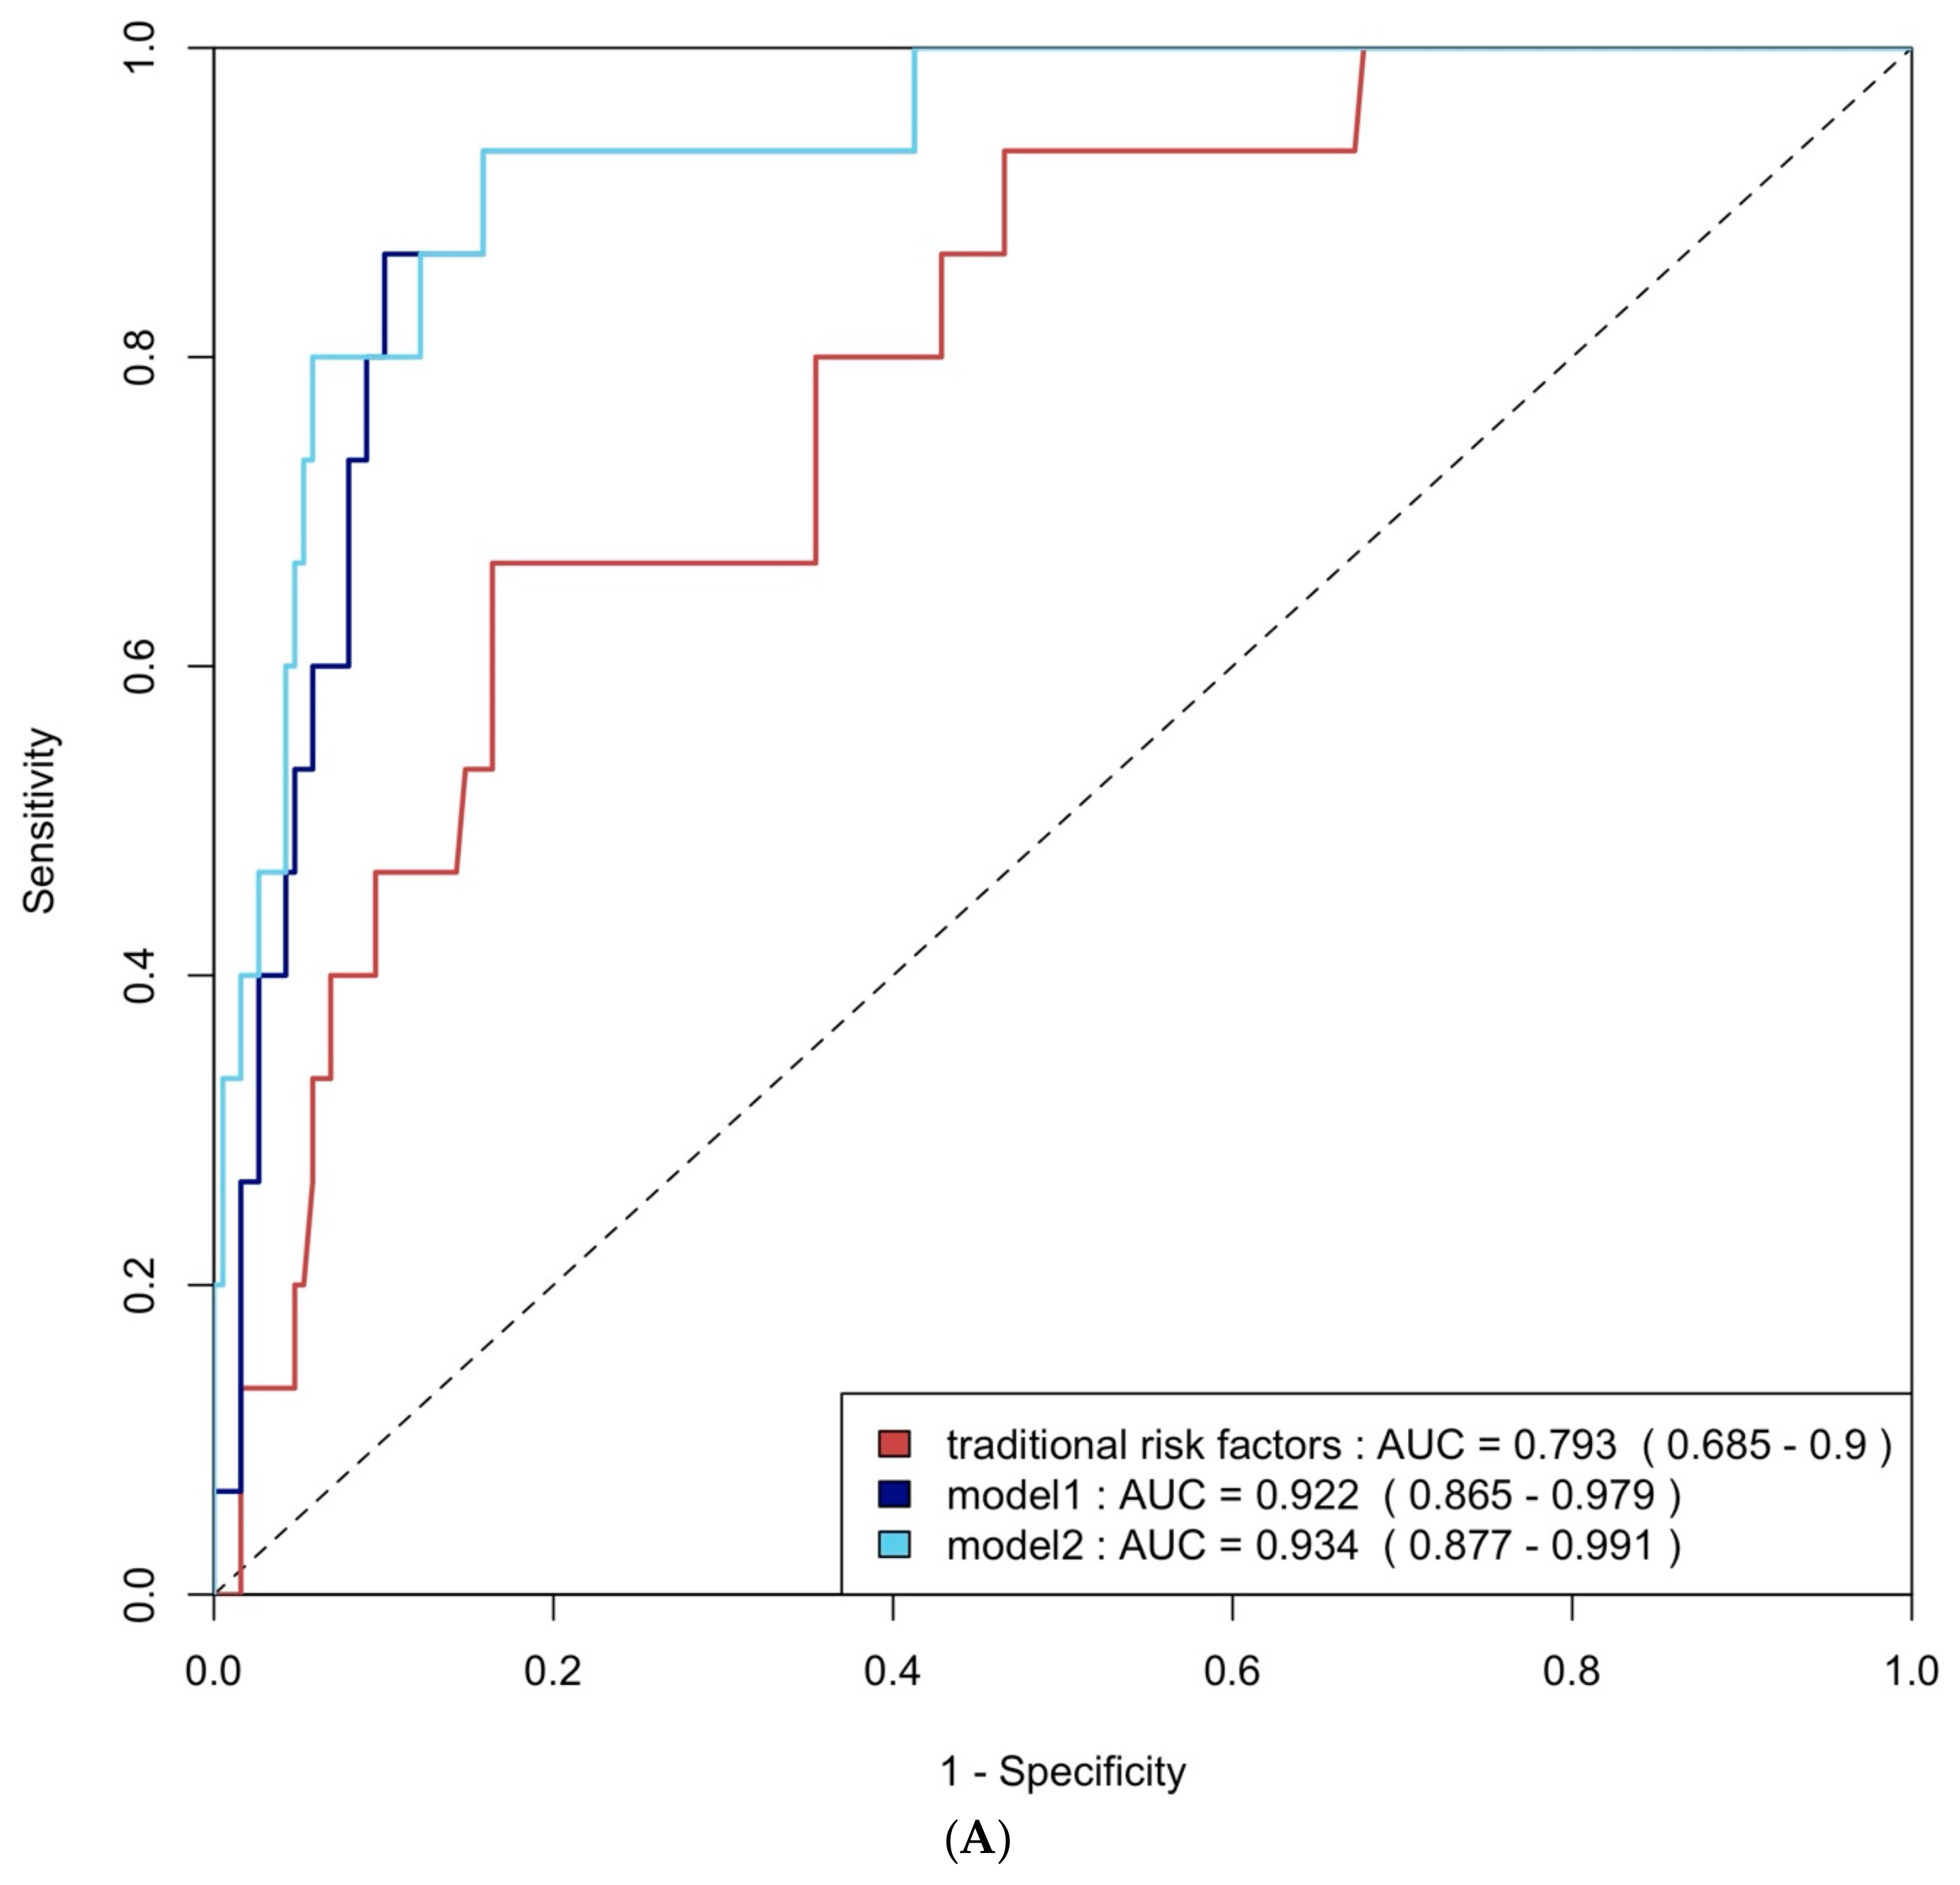
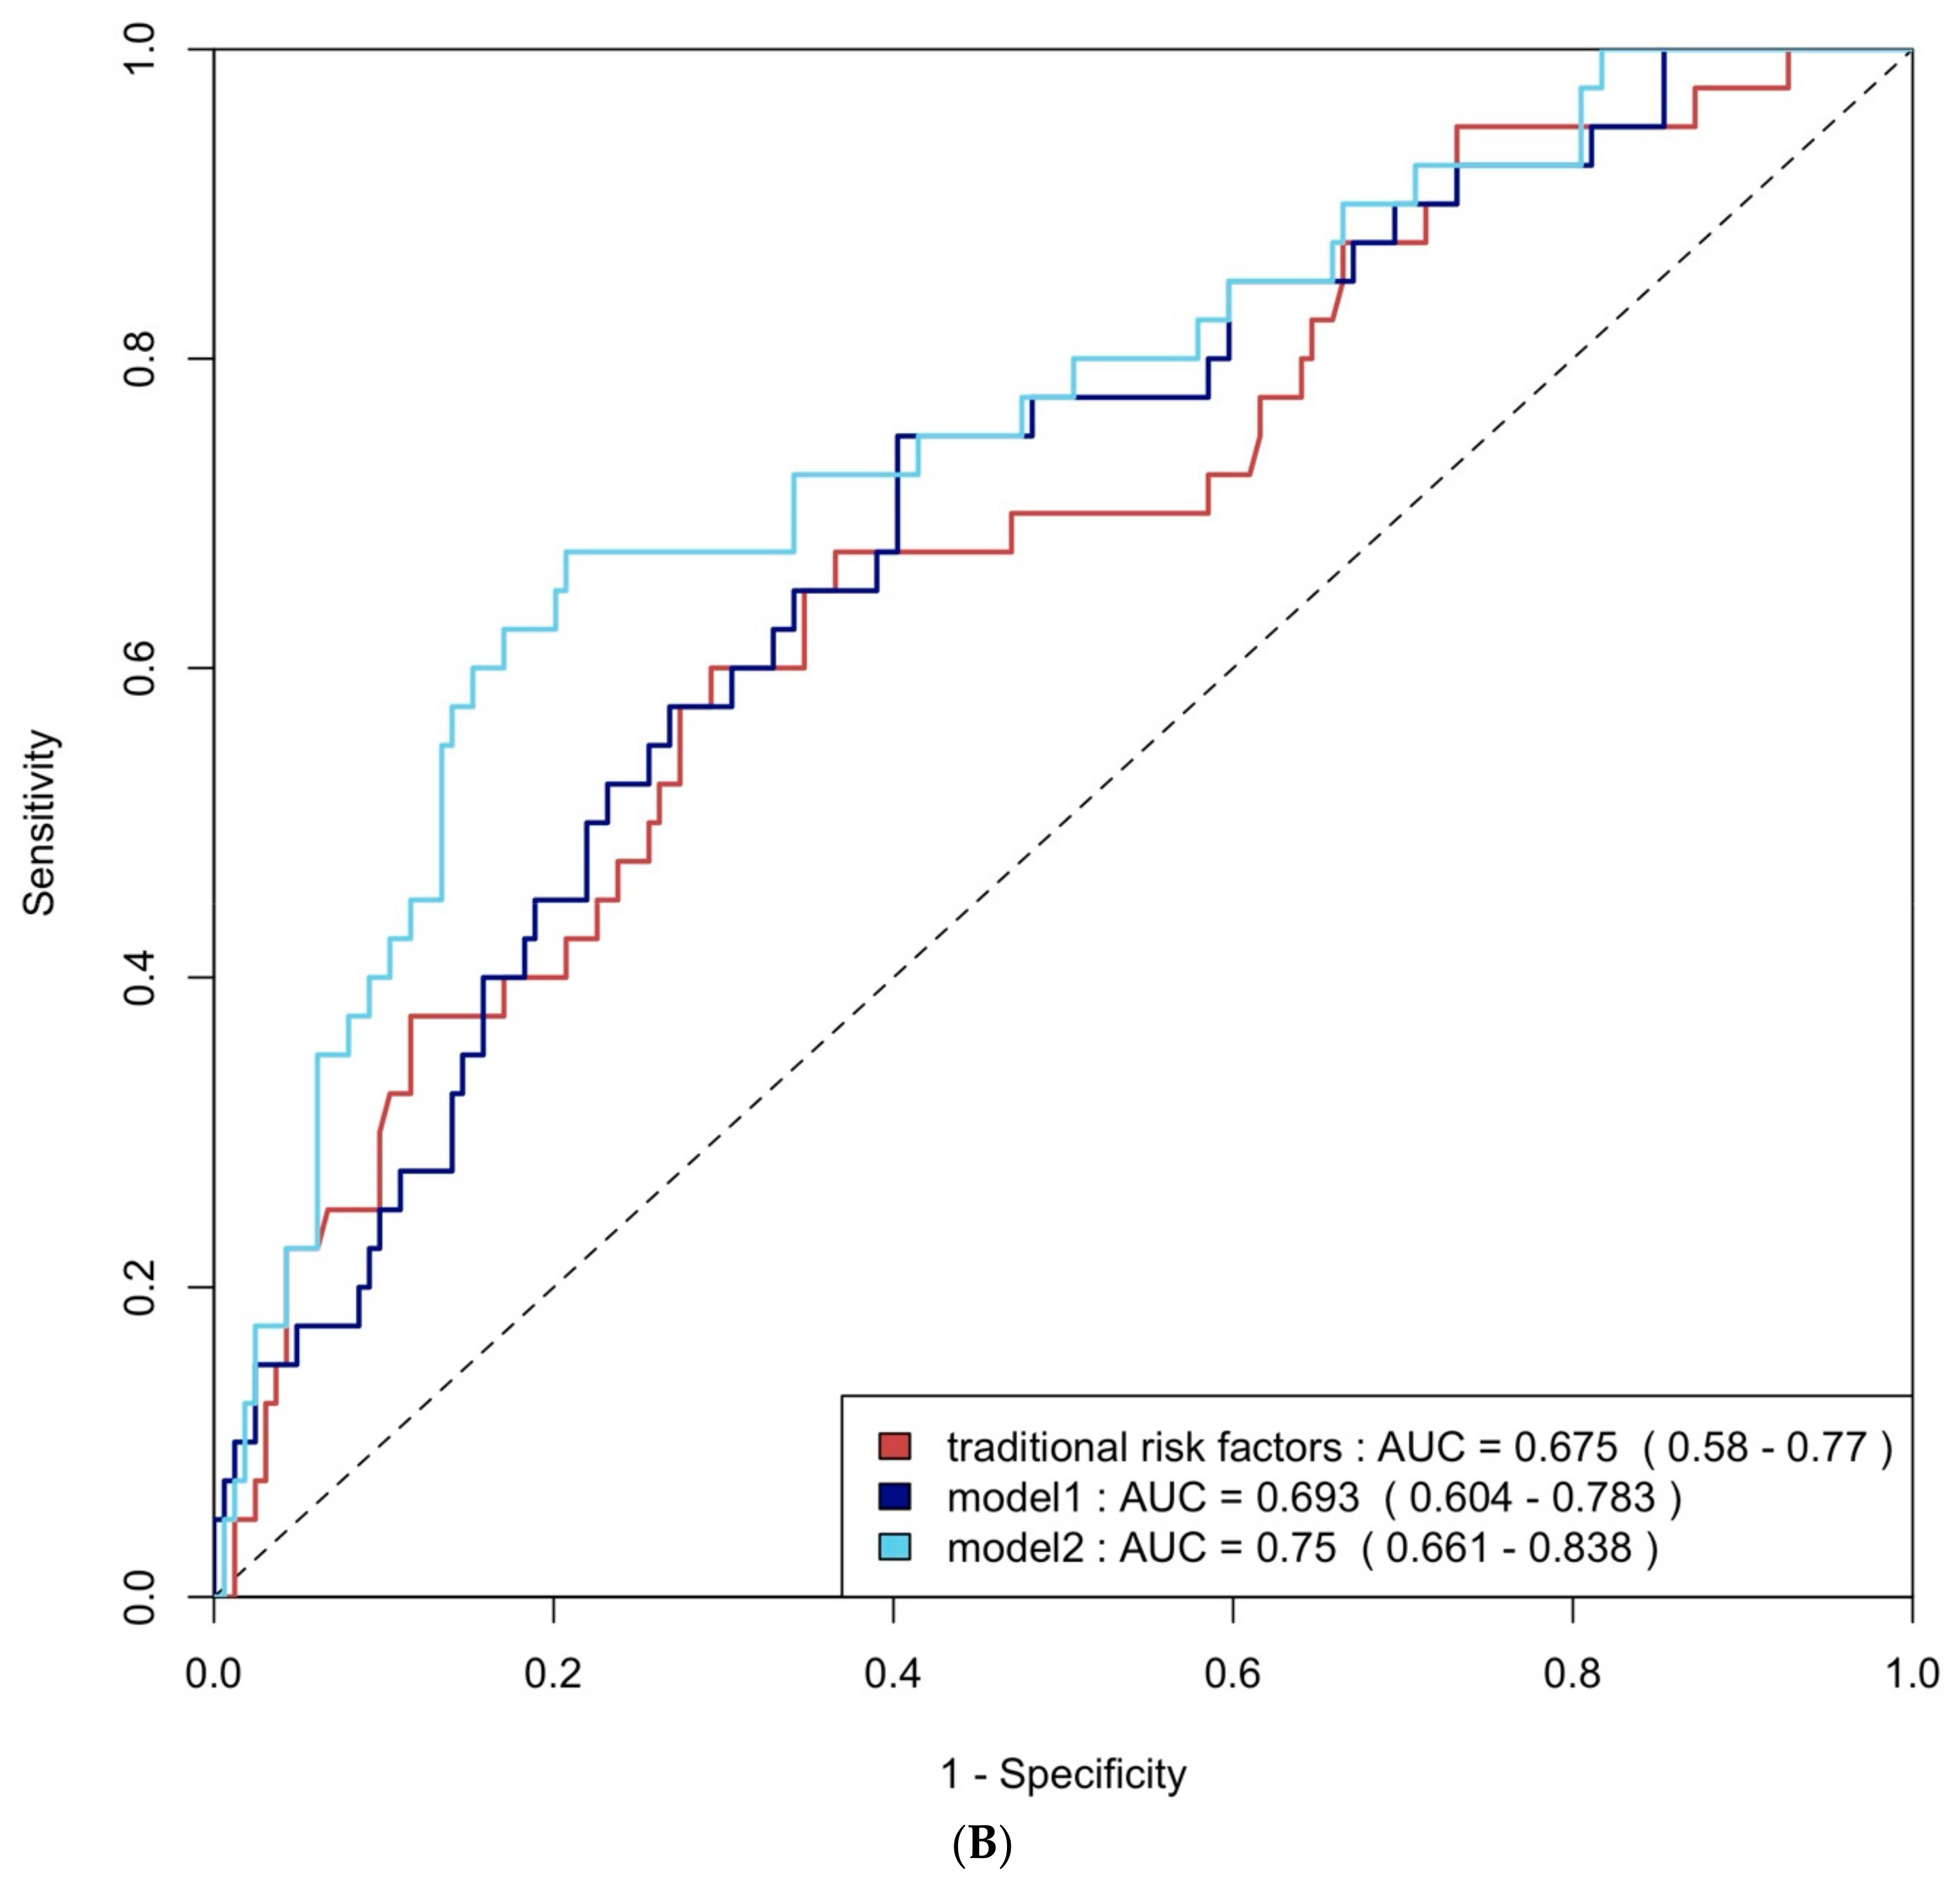
2.3. The Diagnostic Performance of TMAO and Biomarkers to Detect Significant FLVR and Significant LV Diastolic Dysfunction
2.4. Trimethylamine N-Oxide’s Additional Value in LV Dysfunction Diagnosis
2.5. Multivariable Logistic Regression Analysis
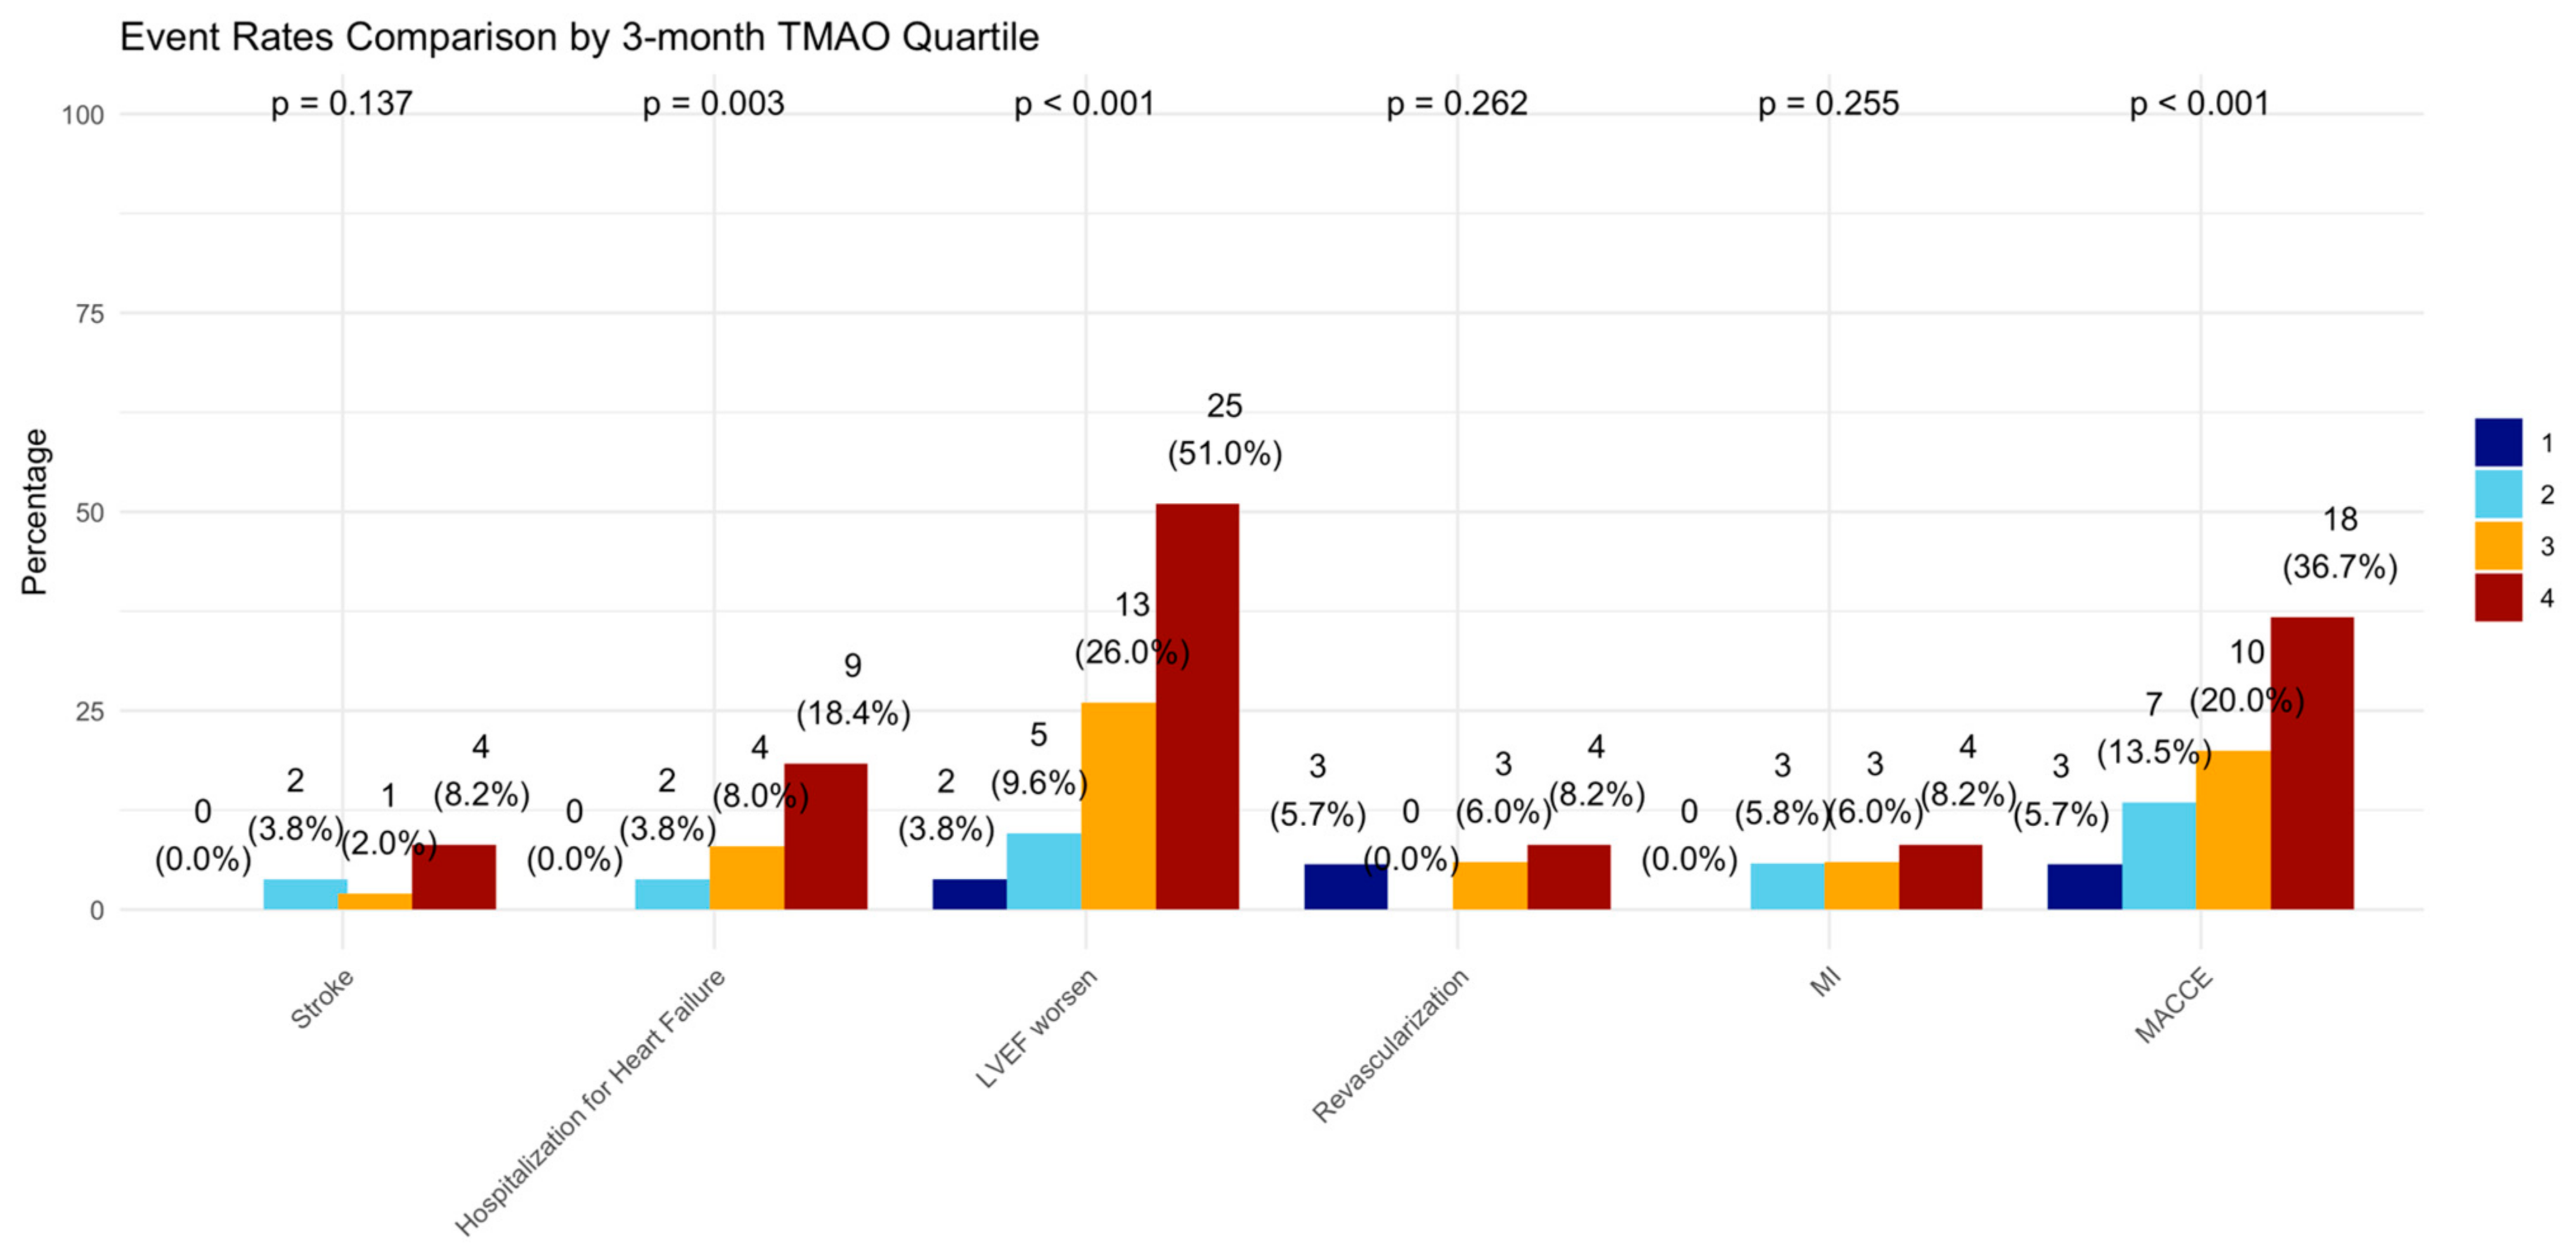
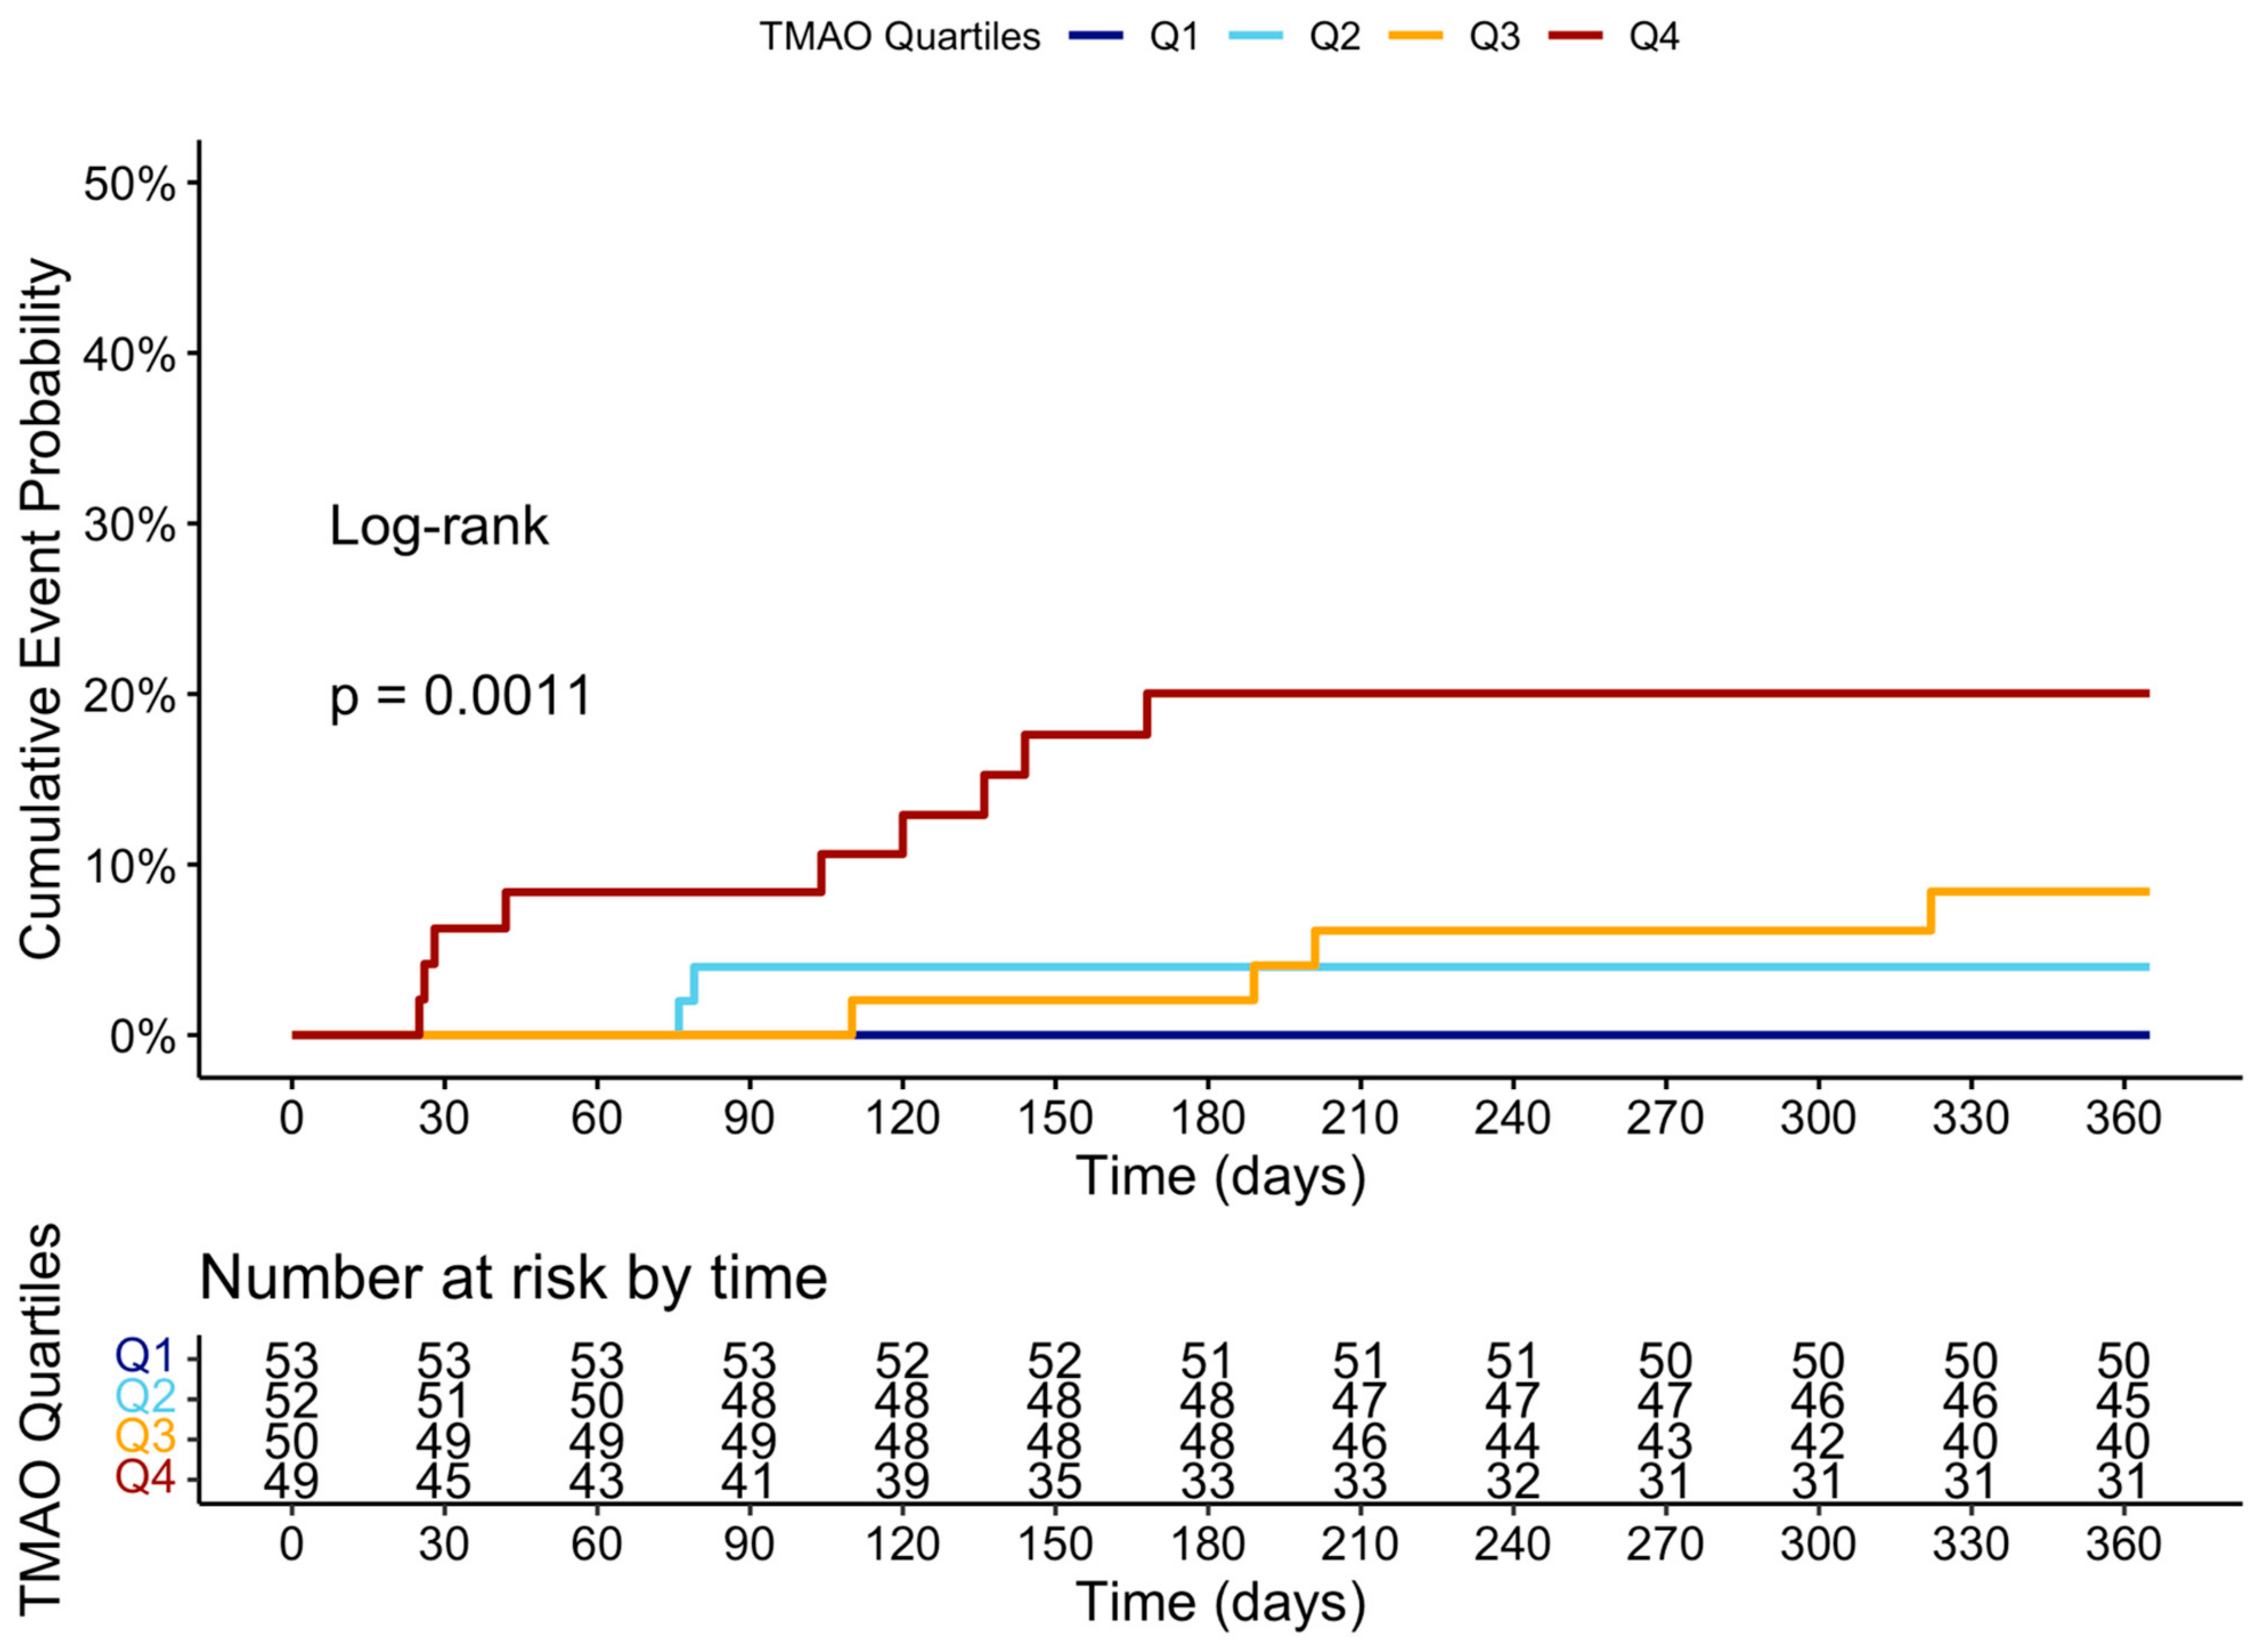
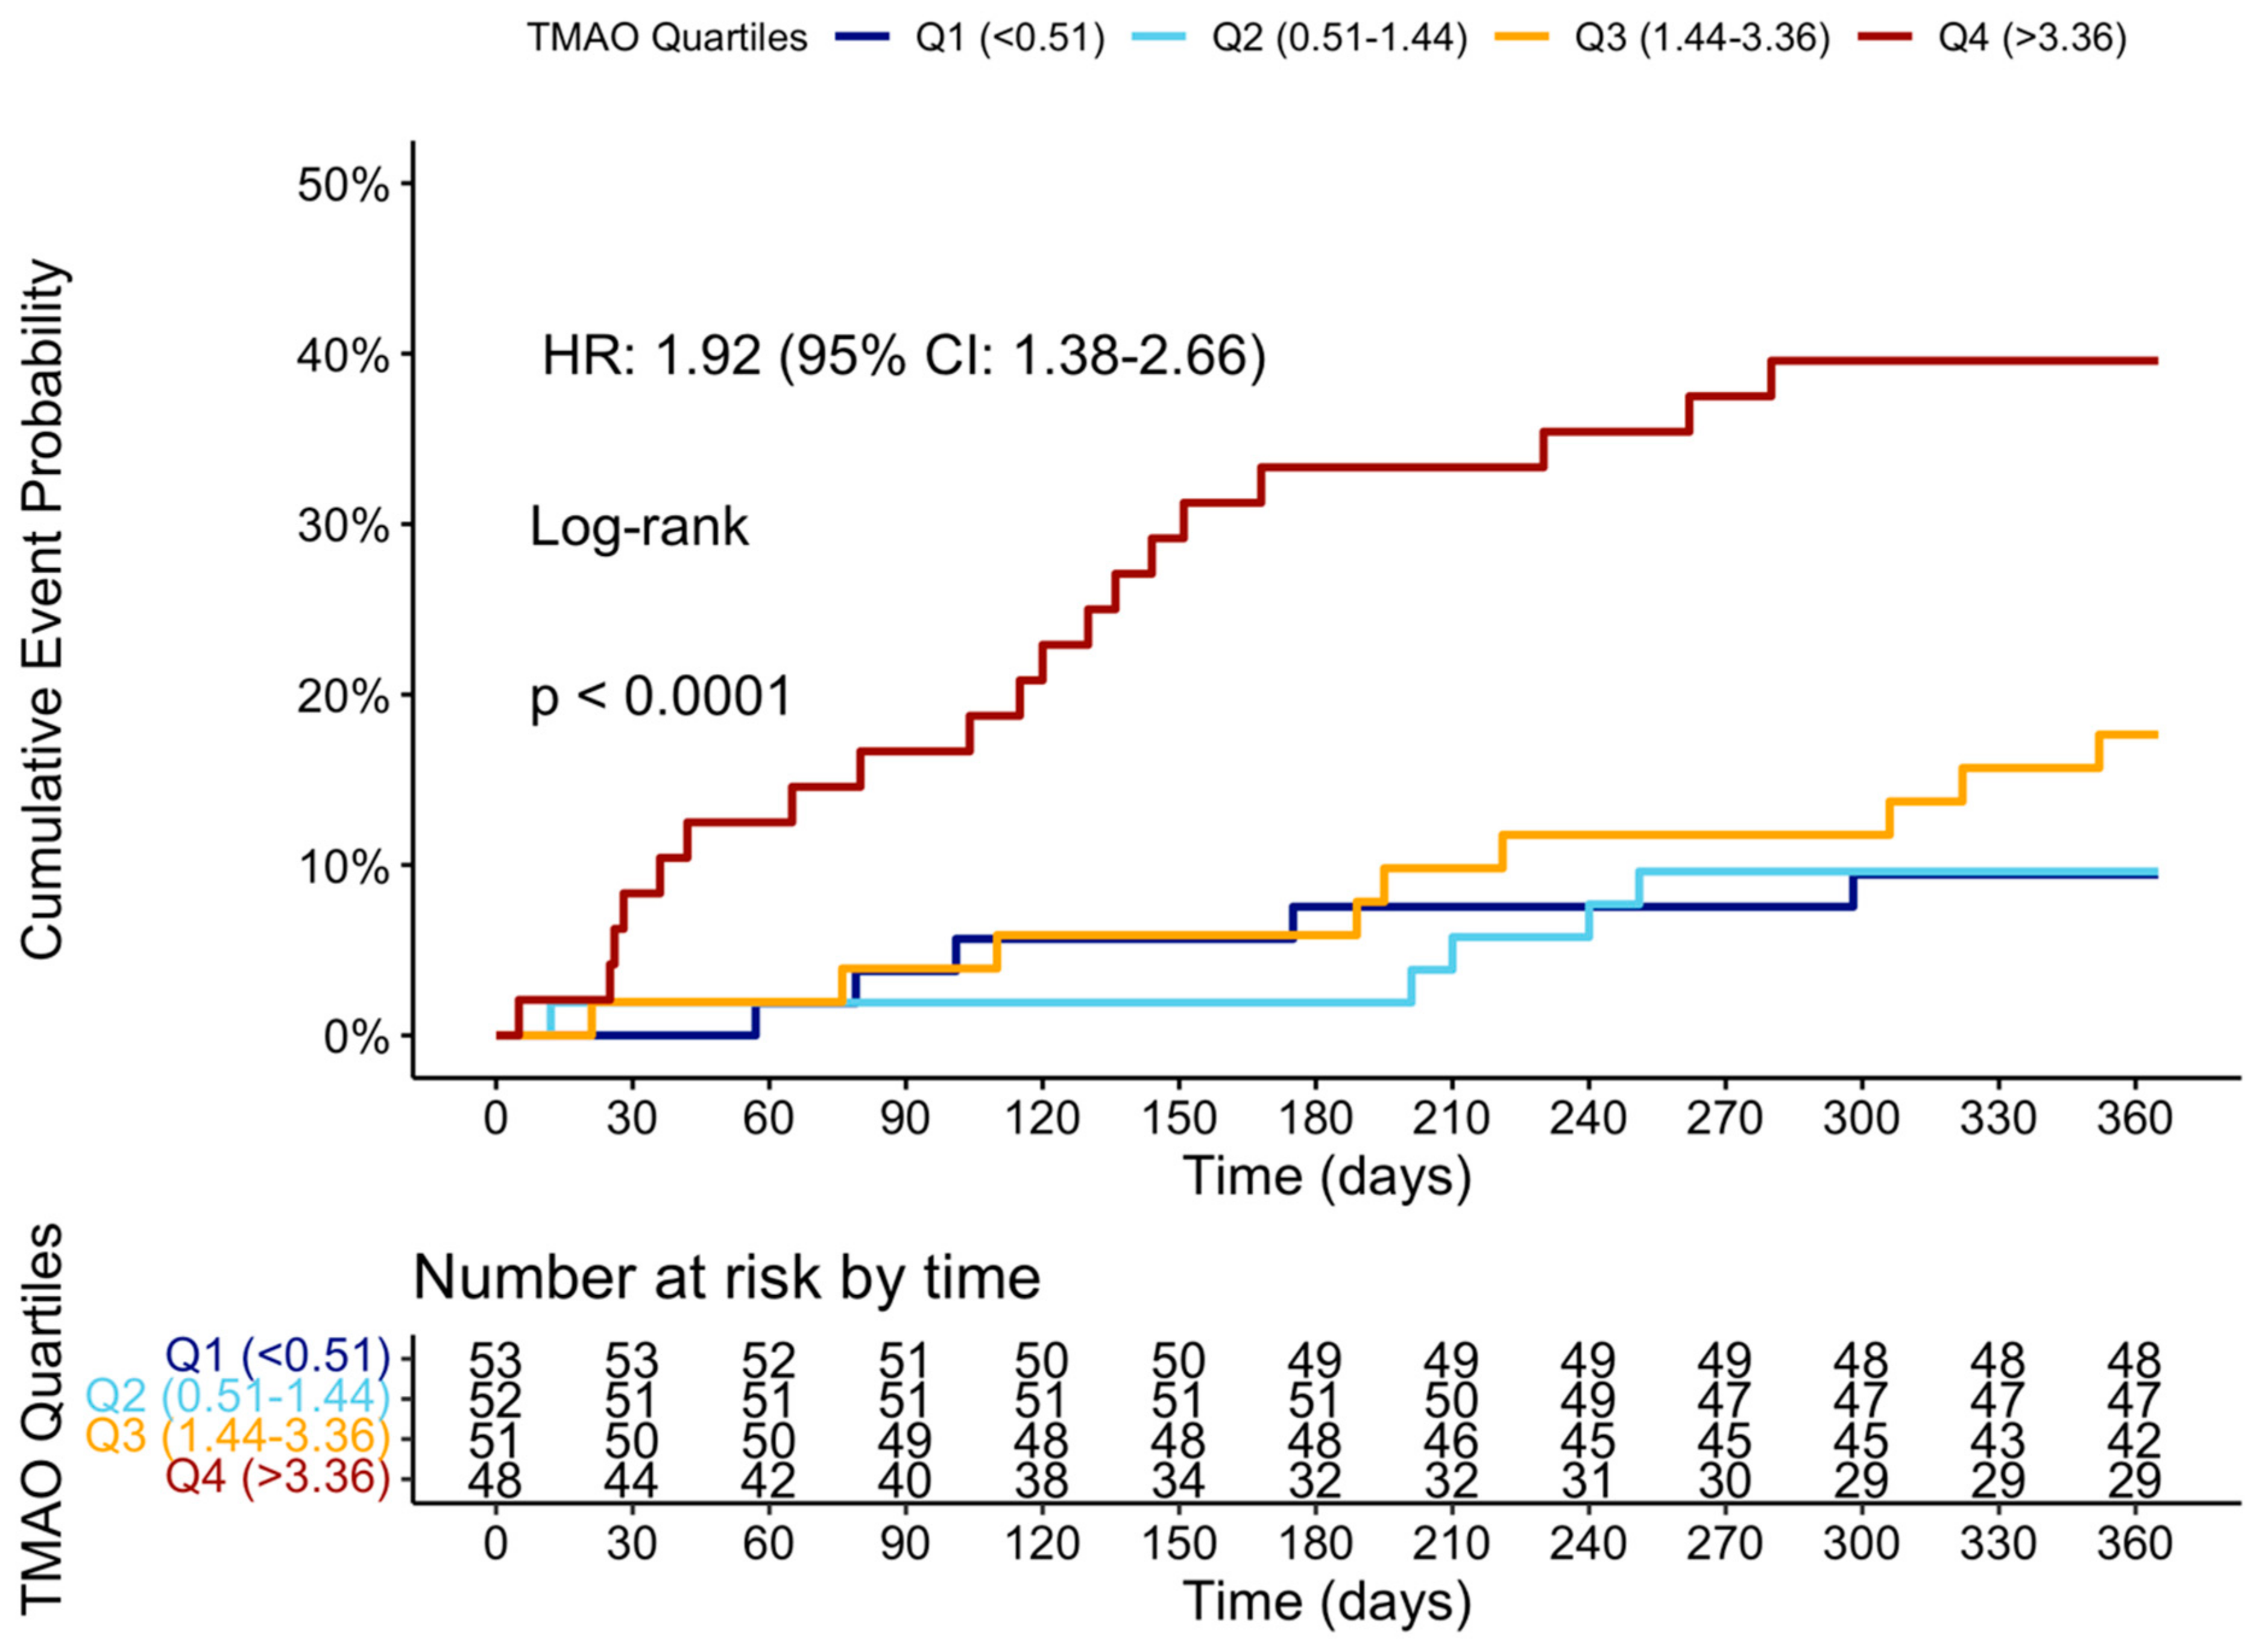
2.6. Trimethylamine N-Oxide and Clinical Outcomes at 12 Months
3. Discussion
- 1.
- The TMAO level 3 months after STEMI is significantly associated with poorer recovery in LV systolic function, LVDD, FLVR, and a higher incidence of MACCEs at 12 months.
- 2.
- The TMAO level at 3 months is one of the best biomarkers for predicting ≥grade II LVDD and group 4 FLVR, outperforming the baseline echocardiographic parameters, and is validated in a prospectively enrolled cohort.
- 3.
- The addition of TMAO and other biomarkers to traditional risk factors significantly improves the prediction of ≥grade II LVDD and group 4 FLVR.
- 4.
- In multivariable logistic regression adjusted for clinical factors and other biomarkers, the 3-month TMAO remains an independent predictor of developing ≥grade II LVDD and group 4 FLVR.
3.1. LV Functional Remodeling, Diastolic Dysfunction, and Adverse Outcomes After STEMI
3.2. Association Between Trimethylamine N-Oxide and LV Systolic and Diastolic Dysfunction
3.3. Deciphering the Pathway of Trimethylamine N-Oxide and Potential Interventions
3.4. The Role of Traditional Risk Factors and Other Biomarkers in FLVR and LVDD
3.5. Limitations
4. Materials and Methods
4.1. Study Design
4.2. Inclusion and Exclusion Criteria
4.3. Data Collection and Echocardiographic Analysis
4.4. Study Endpoints and Definitions
4.5. Statistical Analysis
4.6. Ethics Approval and Consent to Participate
5. Conclusions
Author Contributions
Funding
Institutional Review Board Statement
Informed Consent Statement
Data Availability Statement
Acknowledgments
Conflicts of Interest
Abbreviations
| HF | Heart failure |
| STEMI | ST-elevation myocardial infarction |
| PPCI | Primary Percutaneous Coronary Intervention |
| LVEF | Left ventricular ejection fraction |
| FLVR | Functional left ventricular remodeling |
| LVDD | Left ventricular diastolic dysfunction |
| CMD | Coronary microvascular dysfunction |
| TMAO | Trimethylamine N-oxide |
| CAD | Coronary artery disease |
| FFR | Fractional flow reserve |
| LA | Left atrial |
| EACVI | European Association of Cardiovascular imaging |
| LVEDV | Left ventricular end-diastolic volume |
| IQR | Interquartile range |
| BNP | Brain natriuretic |
| MACCE | Major adverse cardiovascular and cerebrovascular event |
| POCE | Patient-oriented composite endpoint |
| Hs-CRP | High-sensitivity C-reactive protein |
| NRI | Net reclassification improvement |
| IDI | Integrated discrimination improvement |
Appendix A


| TMAO Quartile | 1 | 2 | 3 | 4 | p-Value |
|---|---|---|---|---|---|
| LVEF | 47.74 | 47.33 | 42.36 | 41.29 | <0.001 |
| LVEDV | 88.58 | 90.99 | 94.41 | 95.98 | 0.461 |
| E | 76.23 | 78.33 | 72.54 | 61.64 | <0.001 |
| E/A | 1.28 | 1.25 | 1.15 | 0.92 | <0.001 |
| E/e’ | 8.91 | 10.05 | 10.49 | 11.90 | 0.001 |
| TrPV | 2.51 | 2.55 | 2.69 | 2.91 | <0.001 |
| LAVI | 27.98 | 28.96 | 28.72 | 34.34 | 0.049 |
| Group 4 FLVR | ||||
|---|---|---|---|---|
| Predictor1 | AUC | Predictor2 | AUC | p-Value |
| baseline TMAO | 0.467 (0.346–0.587) | TMAO at 3 months | 0.622 (0.504–0.74) | 0.026 |
| baseline TMAO | 0.467 (0.346–0.587) | delta TMAO | 0.639 (0.525–0.752) | 0.045 |
| baseline TMAO | 0.467 (0.346–0.587) | peak troponin | 0.545 (0.437–0.652) | 0.41 |
| baseline TMAO | 0.467 (0.346–0.587) | post-PCI LVEF | 0.465 (0.358–0.572) | 0.981 |
| baseline TMAO | 0.467 (0.346–0.587) | post-PCI E/A | 0.61 (0.504–0.716) | 0.102 |
| baseline TMAO | 0.467 (0.346–0.587) | CRP at 3 months | 0.608 (0.486–0.729) | 0.054 |
| baseline TMAO | 0.467 (0.346–0.587) | BNP at 3 months | 0.723 (0.619–0.827) | <0.001 |
| TMAO at 3 months | 0.622 (0.504–0.74) | delta TMAO | 0.639 (0.525–0.752) | 0.599 |
| TMAO at 3 months | 0.622 (0.504–0.74) | peak troponin | 0.545 (0.437–0.652) | 0.329 |
| TMAO at 3 months | 0.622 (0.504–0.74) | post-PCI LVEF | 0.465 (0.358–0.572) | 0.026 |
| TMAO at 3 months | 0.622 (0.504–0.74) | post-PCI E/A | 0.61 (0.504–0.716) | 0.993 |
| TMAO at 3 months | 0.622 (0.504–0.74) | CRP at 3 months | 0.608 (0.486–0.729) | 0.863 |
| TMAO at 3 months | 0.622 (0.504–0.74) | BNP at 3 months | 0.723 (0.619–0.827) | 0.191 |
| delta TMAO | 0.639 (0.525–0.752) | peak troponin | 0.545 (0.437–0.652) | 0.191 |
| delta TMAO | 0.639 (0.525–0.752) | post-PCI LVEF | 0.465 (0.358–0.572) | 0.012 |
| delta TMAO | 0.639 (0.525–0.752) | post-PCI E/A | 0.61 (0.504–0.716) | 0.782 |
| delta TMAO | 0.639 (0.525–0.752) | CRP at 3 months | 0.608 (0.486–0.729) | 0.716 |
| delta TMAO | 0.639 (0.525–0.752) | BNP at 3 months | 0.723 (0.619–0.827) | 0.304 |
| peak troponin | 0.545 (0.437–0.652) | post-PCI LVEF | 0.465 (0.358–0.572) | 0.329 |
| peak troponin | 0.545 (0.437–0.652) | post-PCI E/A | 0.61 (0.504–0.716) | 0.372 |
| peak troponin | 0.545 (0.437–0.652) | CRP at 3 months | 0.608 (0.486–0.729) | 0.501 |
| peak troponin | 0.545 (0.437–0.652) | BNP at 3 months | 0.723 (0.619–0.827) | 0.023 |
| post-PCI LVEF | 0.465 (0.358–0.572) | post-PCI E/A | 0.61 (0.504–0.716) | 0.074 |
| post-PCI LVEF | 0.465 (0.358–0.572) | CRP at 3 months | 0.608 (0.486–0.729) | 0.095 |
| post-PCI LVEF | 0.465 (0.358–0.572) | BNP at 3 months | 0.723 (0.619–0.827) | 0.002 |
| post-PCI E/A | 0.61 (0.504–0.716) | CRP at 3 months | 0.608 (0.486–0.729) | 0.85 |
| post-PCI E/A | 0.61 (0.504–0.716) | BNP at 3 months | 0.723 (0.619–0.827) | 0.139 |
| CRP at 3 months | 0.608 (0.486–0.729) | BNP at 3 months | 0.723 (0.619–0.827) | 0.142 |
| Grade II LV diastolic dysfunction | ||||
| Predictor1 | AUC | Predictor2 | AUC | p-value |
| baseline TMAO | 0.554 (0.446–0.662) | TMAO at 3 months | 0.72 (0.628–0.811) | 0.037 |
| baseline TMAO | 0.554 (0.446–0.662) | delta TMAO | 0.722 (0.626–0.818) | 0.011 |
| baseline TMAO | 0.554 (0.446–0.662) | peak troponin | 0.551 (0.451–0.651) | 0.967 |
| baseline TMAO | 0.554 (0.446–0.662) | post-PCI LVEF | 0.613 (0.521–0.705) | 0.415 |
| baseline TMAO | 0.554 (0.446–0.662) | post-PCI E/A | 0.691 (0.613–0.77) | 0.017 |
| baseline TMAO | 0.554 (0.446–0.662) | CRP at 3 months | 0.607 (0.512–0.702) | 0.505 |
| baseline TMAO | 0.554 (0.446–0.662) | BNP at 3 months | 0.647 (0.548–0.746) | 0.199 |
| TMAO at 3 months | 0.72 (0.628–0.811) | delta TMAO | 0.722 (0.626–0.818) | 0.928 |
| TMAO at 3 months | 0.72 (0.628–0.811) | peak troponin | 0.551 (0.451–0.651) | 0.013 |
| TMAO at 3 months | 0.72 (0.628–0.811) | post-PCI LVEF | 0.613 (0.521–0.705) | 0.062 |
| TMAO at 3 months | 0.72 (0.628–0.811) | post-PCI E/A | 0.691 (0.613–0.77) | 0.623 |
| TMAO at 3 months | 0.72 (0.628–0.811) | CRP at 3 months | 0.607 (0.512–0.702) | 0.102 |
| TMAO at 3 months | 0.72 (0.628–0.811) | BNP at 3 months | 0.647 (0.548–0.746) | 0.265 |
| delta TMAO | 0.722 (0.626–0.818) | peak troponin | 0.551 (0.451–0.651) | 0.016 |
| delta TMAO | 0.722 (0.626–0.818) | post-PCI LVEF | 0.613 (0.521–0.705) | 0.065 |
| delta TMAO | 0.722 (0.626–0.818) | post-PCI E/A | 0.691 (0.613–0.77) | 0.583 |
| delta TMAO | 0.722 (0.626–0.818) | CRP at 3 months | 0.607 (0.512–0.702) | 0.118 |
| delta TMAO | 0.722 (0.626–0.818) | BNP at 3 months | 0.647 (0.548–0.746) | 0.252 |
| peak troponin | 0.551 (0.451–0.651) | post-PCI LVEF | 0.613 (0.521–0.705) | 0.346 |
| peak troponin | 0.551 (0.451–0.651) | post-PCI E/A | 0.691 (0.613–0.77) | 0.035 |
| peak troponin | 0.551 (0.451–0.651) | CRP at 3 months | 0.607 (0.512–0.702) | 0.445 |
| peak troponin | 0.551 (0.451–0.651) | BNP at 3 months | 0.647 (0.548–0.746) | 0.162 |
| post-PCI LVEF | 0.613 (0.521–0.705) | post-PCI E/A | 0.691 (0.613–0.77) | 0.211 |
| post-PCI LVEF | 0.613 (0.521–0.705) | CRP at 3 months | 0.607 (0.512–0.702) | 0.929 |
| post-PCI LVEF | 0.613 (0.521–0.705) | BNP at 3 months | 0.647 (0.548–0.746) | 0.62 |
| post-PCI E/A | 0.691 (0.613–0.77) | CRP at 3 months | 0.607 (0.512–0.702) | 0.188 |
| post-PCI E/A | 0.691 (0.613–0.77) | BNP at 3 months | 0.647 (0.548–0.746) | 0.502 |
| CRP at 3 months | 0.607 (0.512–0.702) | BNP at 3 months | 0.647 (0.548–0.746) | 0.567 |
| Grade II or III LV Diastolic Dysfunction | ||||||
|---|---|---|---|---|---|---|
| Metric | Value (Model 1 vs. Traditional) | 95% CI (Model 1 vs. Traditional) | p-Value (Model 1 vs. Traditional) | Value (Model 2 vs. Model 1) | 95% CI (Model 2 vs. Model 1) | p-Value (Model 2 vs. Model 1) |
| NRI | 0.293 | [−0.049–0.637] | 0.093 | 0.577 | [0.241–0.913] | <0.001 |
| IDI | 0.024 | [−0.045–0.053] | 0.098 | 0.064 | [0.024–0.104] | 0.001 |
| Group 4 FLVR | ||||||
| Metric | Value (Model 1 vs. Traditional) | 95% CI (Model 1 vs. Traditional) | p-value (Model 1 vs. Traditional) | Value (Model 2 vs. Model 1) | 95% CI (Model 2 vs. Model 1) | p-value (Model 2 vs. Model 1) |
| NRI | 0.133 | [−0.149–0.415] | 0.355 | 0.546 | [0.217–0.876] | 0.001 |
| IDI | 0.022 | [−0.029–0.073] | 0.393 | 0.040 | [0.005–0.074] | 0.024 |
References
- Sulo, G.; Igland, J.; Vollset, S.E.; Nygård, O.; Ebbing, M.; Sulo, E.; Egeland, G.M.; Tell, G.S. Heart Failure Complicating Acute Myocardial Infarction; Burden and Timing of Occurrence: A Nation-wide Analysis Including 86 771 Patients from the Cardiovascular Disease in Norway (CVDNOR) Project. J. Am. Heart Assoc. 2016, 5, e002667. [Google Scholar] [CrossRef] [PubMed]
- Desta, L.; Jernberg, T.; Löfman, I.; Hofman-Bang, C.; Hagerman, I.; Spaak, J.; Persson, H. Incidence, Temporal Trends, and Prognostic Impact of Heart Failure Complicating Acute Myocardial Infarction. The SWEDEHEART Registry (Swedish Web-System for Enhancement and Development of Evidence-Based Care in Heart Disease Evaluated According to Recommended Therapies): A Study of 199,851 Patients Admitted with Index Acute Myocardial Infarctions, 1996 to 2008. JACC Heart Fail. 2015, 3, 234–242. [Google Scholar] [CrossRef] [PubMed]
- Gerber, Y.; Weston, S.A.; Enriquez-Sarano, M.; Berardi, C.; Chamberlain, A.M.; Manemann, S.M.; Jiang, R.; Dunlay, S.M.; Roger, V.L. Mortality Associated with Heart Failure After Myocardial Infarction: A Contemporary Community Perspective. Circ. Heart Fail. 2016, 9, e002460. [Google Scholar] [CrossRef] [PubMed]
- Chimed, S.; van der Bijl, P.; Lustosa, R.; Fortuni, F.; Montero-Cabezas, J.M.; Ajmone Marsan, N.; Gersh, B.J.; Delgado, V.; Bax, J.J. Functional Classification of Left Ventricular Remodelling: Prognostic Relevance in Myocardial Infarction. ESC Heart Fail. 2022, 9, 912–924. [Google Scholar] [CrossRef]
- Bae, S.; Yoon, H.J.; Kim, K.H.; Kim, H.Y.; Park, H.; Cho, J.Y.; Kim, M.C.; Kim, Y.; Ahn, Y.; Cho, J.G.; et al. Usefulness of Diastolic Function Score as a Predictor of Long-Term Prognosis in Patients with Acute Myocardial Infarction. Front. Cardiovasc. Med. 2021, 8, 730872. [Google Scholar] [CrossRef]
- Aldujeli, A.; Tsai, T.-Y.; Haq, A.; Tatarunas, V.; Knokneris, A.; Briedis, K.; Unikas, R.; Onuma, Y.; Brilakis, E.S.; Serruys, P.W. Impact of Coronary Microvascular Dysfunction on Functional Left Ventricular Remodeling and Diastolic Dysfunction. J. Am. Heart Assoc. 2024, 13, e033596. [Google Scholar] [CrossRef]
- Reinstadler, S.J.; Feistritzer, H.-J.; Reindl, M.; Klug, G.; Mayr, A.; Mair, J.; Jaschke, W.; Metzler, B. Combined Biomarker Testing for the Prediction of Left Ventricular Remodelling in ST-Elevation Myocardial Infarction. Open Heart 2016, 3, e000485. [Google Scholar] [CrossRef]
- Del Buono, M.G.; Garmendia, C.M.; Seropian, I.M.; Gonzalez, G.; Berrocal, D.H.; Biondi-Zoccai, G.; Trankle, C.R.; Bucciarelli-Ducci, C.; Thiele, H.; Lavie, C.J.; et al. Heart Failure After ST-Elevation Myocardial Infarction: Beyond Left Ventricular Adverse Remodeling. Curr. Probl. Cardiol. 2023, 48, 101215. [Google Scholar] [CrossRef]
- Wang, Z.; Klipfell, E.; Bennett, B.J.; Koeth, R.; Levison, B.S.; Dugar, B.; Feldstein, A.E.; Britt, E.B.; Fu, X.; Chung, Y.-M.; et al. Gut Flora Metabolism of Phosphatidylcholine Promotes Cardiovascular Disease. Nature 2011, 472, 57–63. [Google Scholar] [CrossRef]
- Tan, Y.; Sheng, Z.; Zhou, P.; Liu, C.; Zhao, H.; Song, L.; Li, J.; Zhou, J.; Chen, Y.; Wang, L.; et al. Plasma Trimethylamine N-Oxide as a Novel Biomarker for Plaque Rupture in Patients with ST-Segment-Elevation Myocardial Infarction. Circ Cardiovasc Interv 2019, 12, e007281. [Google Scholar] [CrossRef]
- Bin Waleed, K.; Lu, Y.; Liu, Q.; Zeng, F.; Tu, H.; Wei, Y.; Xu, S.; Zhang, Z.; Rongfeng, Y.; Fan, A.; et al. Association of Trimethylamine N-Oxide with Coronary Atherosclerotic Burden in Patients with Non-ST-Segment Elevation Myocardial Infarction. Medicine (Baltimore) 2020, 99, e20794. [Google Scholar] [CrossRef] [PubMed]
- Aldujeli, A.; Tsai, T.-Y.; Haq, A.; Tatarunas, V.; Garg, S.; Hughes, D.; Ciapiene, I.; Unikas, R.; Sharif, F.; Lesauskaite, V.; et al. The Association Between Trimethylamine N-Oxide Levels and Coronary Microvascular Dysfunction and Prognosis in Patients with ST-Elevation Myocardial Infarction. Atherosclerosis 2024, 398, 118597. [Google Scholar] [CrossRef] [PubMed]
- Suryapranata, H.; Zijlstra, F.; MacLeod, D.C.; van den Brand, M.; de Feyter, P.J.; Serruys, P.W. Predictive Value of Reactive Hyperemic Response on Reperfusion on Recovery of Regional Myocardial Function After Coronary Angioplasty in Acute Myocardial Infarction. Circulation 1994, 89, 1109–1117. [Google Scholar] [CrossRef] [PubMed]
- van der Bijl, P.; Abou, R.; Goedemans, L.; Gersh, B.J.; Holmes, D.R.; Ajmone Marsan, N.; Delgado, V.; Bax, J.J. Left Ventricular Post-Infarct Remodeling: Implications for Systolic Function Improvement and Outcomes in the Modern Era. JACC Heart Fail. 2020, 8, 131–140. [Google Scholar] [CrossRef]
- Das, A.; Kelly, C.; Teh, I.; Stoeck, C.T.; Kozerke, S.; Sharrack, N.; Swoboda, P.P.; Greenwood, J.P.; Schneider, J.E.; Plein, S.; et al. Pathophysiology of LV Remodeling Following STEMI. JACC Cardiovasc. Imaging 2023, 16, 159–171. [Google Scholar] [CrossRef]
- Rodriguez-Palomares, J.F.; Gavara, J.; Ferreira-González, I.; Valente, F.; Rios, C.; Rodríguez-García, J.; Bonanad, C.; García Del Blanco, B.; Miñana, G.; Mutuberria, M.; et al. Prognostic Value of Initial Left Ventricular Remodeling in Patients with Reperfused STEMI. JACC Cardiovasc. Imaging 2019, 12, 2445–2456. [Google Scholar] [CrossRef]
- Ibanez, B.; Rossello, X. Left Ventricular Remodeling Is No Longer a Relevant Outcome After Myocardial Infarction. JACC Cardiovasc. Imaging 2019, 12, 2457–2459. [Google Scholar] [CrossRef]
- Serruys, P.W.; Wijns, W.; van den Brand, M.; Meij, S.; Slager, C.; Schuurbiers, J.C.; Hugenholtz, P.G.; Brower, R.W. Left Ventricular Performance, Regional Blood Flow, Wall Motion, and Lactate Metabolism During Transluminal Angioplasty. Circulation 1984, 70, 25–36. [Google Scholar] [CrossRef]
- Sandek, A.; Bauditz, J.; Swidsinski, A.; Buhner, S.; Weber-Eibel, J.; von Haehling, S.; Schroedl, W.; Karhausen, T.; Doehner, W.; Rauchhaus, M.; et al. Altered Intestinal Function in Patients with Chronic Heart Failure. J. Am. Coll. Cardiol. 2007, 50, 1561–1569. [Google Scholar] [CrossRef]
- Zhang, Y.; Wang, Y.; Ke, B.; Du, J. TMAO: How Gut Microbiota Contributes to Heart Failure. Transl. Res. 2021, 228, 109–125. [Google Scholar] [CrossRef]
- Tang, W.H.W.; Wang, Z.; Kennedy, D.J.; Wu, Y.; Buffa, J.A.; Agatisa-Boyle, B.; Li, X.S.; Levison, B.S.; Hazen, S.L. Gut Microbiota-Dependent Trimethylamine N-Oxide (TMAO) Pathway Contributes to Both Development of Renal Insufficiency and Mortality Risk in Chronic Kidney Disease. Circ. Res. 2015, 116, 448–455. [Google Scholar] [CrossRef] [PubMed]
- Andrikopoulos, P.; Aron-Wisnewsky, J.; Chakaroun, R.; Myridakis, A.; Forslund, S.K.; Nielsen, T.; Adriouch, S.; Holmes, B.; Chilloux, J.; Vieira-Silva, S.; et al. Evidence of a Causal and Modifiable Relationship Between Kidney Function and Circulating Trimethylamine N-Oxide. Nat. Commun. 2023, 14, 5843. [Google Scholar] [CrossRef]
- Tang, W.H.W.; Wang, Z.; Shrestha, K.; Borowski, A.G.; Wu, Y.; Troughton, R.W.; Klein, A.L.; Hazen, S.L. Intestinal Microbiota-Dependent Phosphatidylcholine Metabolites, Diastolic Dysfunction, and Adverse Clinical Outcomes in Chronic Systolic Heart Failure. J. Card. Fail. 2015, 21, 91–96. [Google Scholar] [CrossRef] [PubMed]
- Organ, C.L.; Li, Z.; Sharp, T.E.; Polhemus, D.J.; Gupta, N.; Goodchild, T.T.; Tang, W.H.W.; Hazen, S.L.; Lefer, D.J. Nonlethal Inhibition of Gut Microbial Trimethylamine N-Oxide Production Improves Cardiac Function and Remodeling in a Murine Model of Heart Failure. J. Am. Heart Assoc. 2020, 9, e016223. [Google Scholar] [CrossRef] [PubMed]
- Almesned, M.A.; Prins, F.M.; Lipšic, E.; Connelly, M.A.; Garcia, E.; Dullaart, R.P.F.; Groot, H.E.; van der Harst, P. Temporal Course of Plasma Trimethylamine N-Oxide (TMAO) Levels in ST-Elevation Myocardial Infarction. J. Clin. Med. 2021, 10, 5677. [Google Scholar] [CrossRef]
- Kalagi, N.A.; Abbott, K.A.; Alburikan, K.A.; Alkofide, H.A.; Stojanovski, E.; Garg, M.L. Modulation of Circulating Trimethylamine N-Oxide Concentrations by Dietary Supplements and Pharmacological Agents: A Systematic Review. Adv. Nutr. 2019, 10, 876–887. [Google Scholar] [CrossRef]
- Matsuzawa, Y.; Nakahashi, H.; Konishi, M.; Sato, R.; Kawashima, C.; Kikuchi, S.; Akiyama, E.; Iwahashi, N.; Maejima, N.; Okada, K.; et al. Microbiota-Derived Trimethylamine N-Oxide Predicts Cardiovascular Risk After STEMI. Sci. Rep. 2019, 9, 11647. [Google Scholar] [CrossRef]
- Li, D.Y.; Li, X.S.; Chaikijurajai, T.; Li, L.; Wang, Z.; Hazen, S.L.; Tang, W.H.W. Relation of Statin Use to Gut Microbial Trimethylamine N-Oxide and Cardiovascular Risk. Am. J. Cardiol. 2022, 178, 26–34. [Google Scholar] [CrossRef]
- Chen, H.-C.; Liu, Y.-W.; Chang, K.-C.; Wu, Y.-W.; Chen, Y.-M.; Chao, Y.-K.; You, M.-Y.; Lundy, D.J.; Lin, C.-J.; Hsieh, M.L.; et al. Gut Butyrate-Producers Confer Post-Infarction Cardiac Protection. Nat. Commun. 2023, 14, 7249. [Google Scholar] [CrossRef]
- Coutinho-Wolino, K.S.; de, F. Cardozo, L.F.M.; de Oliveira Leal, V.; Mafra, D.; Stockler-Pinto, M.B. Can Diet Modulate Trimethylamine N-Oxide (TMAO) Production? What Do We Know so Far? Eur J Nutr 2021, 60, 3567–3584. [Google Scholar] [CrossRef]
- Liyanage, T.; Ninomiya, T.; Wang, A.; Neal, B.; Jun, M.; Wong, M.G.; Jardine, M.; Hillis, G.S.; Perkovic, V. Effects of the Mediterranean Diet on Cardiovascular Outcomes-A Systematic Review and Meta-Analysis. PLoS ONE 2016, 11, e0159252. [Google Scholar] [CrossRef] [PubMed]
- Carbone, S.; Billingsley, H.E.; Abbate, A. The Mediterranean Diet to Treat Heart Failure: A Potentially Powerful Tool in the Hands of Providers. JACC Heart Fail. 2018, 6, 264. [Google Scholar] [CrossRef] [PubMed]
- Levitan, E.B.; Lewis, C.E.; Tinker, L.F.; Eaton, C.B.; Ahmed, A.; Manson, J.E.; Snetselaar, L.G.; Martin, L.W.; Trevisan, M.; Howard, B.V.; et al. Mediterranean and DASH Diet Scores and Mortality in Women with Heart Failure: The Women’s Health Initiative. Circ. Heart Fail. 2013, 6, 1116–1123. [Google Scholar] [CrossRef] [PubMed]
- Costanza, A.C.; Moscavitch, S.D.; Faria Neto, H.C.C.; Mesquita, E.T. Probiotic Therapy with Saccharomyces Boulardii for Heart Failure Patients: A Randomized, Double-Blind, Placebo-Controlled Pilot Trial. Int. J. Cardiol. 2015, 179, 348–350. [Google Scholar] [CrossRef]
- Chambers, E.S.; Byrne, C.S.; Morrison, D.J.; Murphy, K.G.; Preston, T.; Tedford, C.; Garcia-Perez, I.; Fountana, S.; Serrano-Contreras, J.I.; Holmes, E.; et al. Dietary Supplementation with Inulin-Propionate Ester or Inulin Improves Insulin Sensitivity in Adults with Overweight and Obesity with Distinct Effects on the Gut Microbiota, Plasma Metabolome and Systemic Inflammatory Responses: A Randomised Cross-over Trial. Gut 2019, 68, 1430–1438. [Google Scholar] [CrossRef]
- Roberts, A.B.; Gu, X.; Buffa, J.A.; Hurd, A.G.; Wang, Z.; Zhu, W.; Gupta, N.; Skye, S.M.; Cody, D.B.; Levison, B.S.; et al. Development of a Gut Microbe–Targeted Nonlethal Therapeutic to Inhibit Thrombosis Potential. Nat. Med. 2018, 24, 1407–1417. [Google Scholar] [CrossRef]
- Wang, G.; Kong, B.; Shuai, W.; Fu, H.; Jiang, X.; Huang, H. 3,3-Dimethyl-1-Butanol Attenuates Cardiac Remodeling in Pressure-Overload-Induced Heart Failure Mice. J. Nutr. Biochem. 2020, 78, 108341. [Google Scholar] [CrossRef]
- Kootte, R.S.; Levin, E.; Salojärvi, J.; Smits, L.P.; Hartstra, A.V.; Udayappan, S.D.; Hermes, G.; Bouter, K.E.; Koopen, A.M.; Holst, J.J.; et al. Improvement of Insulin Sensitivity After Lean Donor Feces in Metabolic Syndrome is Driven by Baseline Intestinal Microbiota Composition. Cell Metab. 2017, 26, 611–619.e6. [Google Scholar] [CrossRef]
- Gagné, M.-A.; Barbeau, C.; Frégeau, G.; Gilbert, K.; Mathieu, O.; Auger, J.; Tompkins, T.A.; Charbonney, E.; Godbout, R.; Rousseau, G. Dysbiotic Microbiota Contributes to the Extent of Acute Myocardial Infarction in Rats. Sci. Rep. 2022, 12, 16517. [Google Scholar] [CrossRef]
- Tang, W.H.W.; Wang, Z.; Levison, B.S.; Koeth, R.A.; Britt, E.B.; Fu, X.; Wu, Y.; Hazen, S.L. Intestinal Microbial Metabolism of Phosphatidylcholine and Cardiovascular Risk. N. Engl. J. Med. 2013, 368, 1575–1584. [Google Scholar] [CrossRef]
- Frantz, S.; Hundertmark, M.J.; Schulz-Menger, J.; Bengel, F.M.; Bauersachs, J. Left Ventricular Remodelling Post-Myocardial Infarction: Pathophysiology, Imaging, and Novel Therapies. Eur. Heart J. 2022, 43, 2549–2561. [Google Scholar] [CrossRef] [PubMed]
- Fertin, M.; Dubois, E.; Belliard, A.; Amouyel, P.; Pinet, F.; Bauters, C. Usefulness of Circulating Biomarkers for the Prediction of Left Ventricular Remodeling After Myocardial Infarction. Am. J. Cardiol. 2012, 110, 277–283. [Google Scholar] [CrossRef] [PubMed]
- Evans, M.; Dai, L.; Avesani, C.M.; Kublickiene, K.; Stenvinkel, P. The Dietary Source of Trimethylamine N-Oxide and Clinical Outcomes: An Unexpected Liaison. Clin. Kidney J. 2023, 16, 1804–1812. [Google Scholar] [CrossRef] [PubMed]
- Wang, Z.; Tang, W.H.W.; O’Connell, T.; Garcia, E.; Jeyarajah, E.J.; Li, X.S.; Jia, X.; Weeks, T.L.; Hazen, S.L. Circulating Trimethylamine N-Oxide Levels Following Fish or Seafood Consumption. Eur. J. Nutr. 2022, 61, 2357–2364. [Google Scholar] [CrossRef]
- Shimizu, M.; Kobayashi, Y.; Hayashi, S.; Aoki, Y.; Yamazaki, H. Variants in the Flavin-Containing Monooxygenase 3 (FMO3) Gene Responsible for Trimethylaminuria in a Japanese Population. Mol. Genet. Metab. 2012, 107, 330–334. [Google Scholar] [CrossRef]
- Lang, R.M.; Badano, L.P.; Mor-Avi, V.; Afilalo, J.; Armstrong, A.; Ernande, L.; Flachskampf, F.A.; Foster, E.; Goldstein, S.A.; Kuznetsova, T.; et al. Recommendations for Cardiac Chamber Quantification by Echocardiography in Adults: An Update from the American Society of Echocardiography and the European Association of Cardiovascular Imaging. J. Am. Soc. Echocardiogr. 2015, 28, 1–39.e14. [Google Scholar] [CrossRef]
- Nagueh, S.F.; Smiseth, O.A.; Appleton, C.P.; Byrd, B.F.; Dokainish, H.; Edvardsen, T.; Flachskampf, F.A.; Gillebert, T.C.; Klein, A.L.; Lancellotti, P.; et al. Recommendations for the Evaluation of Left Ventricular Diastolic Function by Echocardiography: An Update from the American Society of Echocardiography and the European Association of Cardiovascular Imaging. J. Am. Soc. Echocardiogr. 2016, 29, 277–314. [Google Scholar] [CrossRef]
- Garcia-Garcia, H.M.; McFadden, E.P.; Farb, A.; Mehran, R.; Stone, G.W.; Spertus, J.; Onuma, Y.; Morel, M.-A.; van Es, G.-A.; Zuckerman, B.; et al. Standardized End Point Definitions for Coronary Intervention Trials: The Academic Research Consortium-2 Consensus Document. Circulation 2018, 137, 2635–2650. [Google Scholar] [CrossRef]


| Baseline Characteristic | Overall (n = 204) | No Primary Endpoint (n = 157) | Group 4 FLVR or Grade II Diastolic Dysfunction (n = 47) | p-Value |
|---|---|---|---|---|
| Sex (Female) | 81 (39.7) | 52 (33.1) | 29 (61.7) | 0.001 |
| Age (years) | 65.00 [57.00, 76.00] | 66.00 [57.00, 76.00] | 63.00 [57.50, 76.00] | 0.550 |
| Body mass index (kg/m2) | 27.46 [24.60, 30.68] | 27.44 [24.77, 31.02] | 27.68 [24.23, 29.64] | 0.366 |
| Body surface area (m2) | 1.93 [1.81, 2.10] | 1.93 [1.79, 2.09] | 1.97 [1.85, 2.11] | 0.460 |
| Primary Diagnosis | 0.999 | |||
| Anterior STEMI | 115 (56.37%) | 88 (56.05%) | 27 (57.45%) | |
| Inferior STEMI | 115 (56.37%) | 69 (43.95%) | 20 (42.55%) | |
| Arterial hypertension | 120 (58.8) | 92 (58.6) | 28 (59.6) | 1 |
| History of coronary artery disease | 55 (27.0) | 41 (26.1) | 14 (29.8) | 0.756 |
| History of PCI | 24 (11.8) | 18 (11.5) | 6 (12.8) | 1 |
| History of stroke | 27 (13.2) | 17 (10.8) | 10 (21.3) | 0.108 |
| History of diabetes mellitus | 49 (24.0) | 31 (19.7) | 18 (38.3) | 0.016 |
| History of dyslipidemia | 117 (57.4) | 90 (57.3) | 27 (57.4) | 1 |
| Smoker (former/current) | 106 (52.0) | 78 (49.7) | 28 (59.6) | 0.306 |
| History of alcohol abuse | 19 (9.3) | 15 (9.6) | 4 (8.5) | 1 |
| KILLIP class | 0.810 | |||
| I | 61 (29.9) | 47 (29.9) | 14 (29.8) | |
| II | 109 (53.4) | 82 (52.2) | 27 (57.4) | |
| III | 26 (12.7) | 22 (14.0) | 4 (8.5) | |
| IV | 8 (3.9) | 6 (3.8) | 2 (4.3) | |
| Baseline medications | ||||
| Beta-blockers | 32 (15.7) | 22 (14.0) | 10 (21.3) | 0.331 |
| Calcium channel blocker | 62 (30.5) | 45 (28.8) | 17 (36.2) | 0.438 |
| ACEI/ARB | 40 (19.6) | 32 (20.4) | 8 (17.0) | 0.764 |
| Aldosterone antagonists | 2 (1.0) | 1 (0.6) | 1 (2.1) | 0.947 |
| Statins | 35 (17.2) | 28 (17.8) | 7 (14.9) | 0.804 |
| Aspirin | 42 (20.7) | 29 (18.6) | 13 (27.7) | 0.254 |
| 3-month follow-up medications | ||||
| Beta-blockers | 176 (86.3) | 134 (85.4) | 42 (89.4) | 0.646 |
| Calcium channel blocker | 194 (95.1) | 147 (93.6) | 47 (100.0) | 0.165 |
| ACEI/ARB | 11 (5.4) | 8 (5.1) | 3 (6.4) | 1 |
| Aldosterone antagonists | 39 (19.1) | 28 (17.8) | 11 (23.4) | 0.522 |
| Statins | 197 (96.6) | 150 (95.5) | 47 (100.0) | 0.309 |
| Aspirin | 204 (100.0) | 157 (100.0) | 47 (100.0) | 1 |
| Ticagrelor | 177 (86.8) | 138 (87.9) | 39 (83.0) | 0.530 |
| Clopidogrel | 29 (14.2) | 20 (12.7) | 9 (19.1) | 0.387 |
| Procedure Characteristics | ||||
| Pain-to-door time (minutes) | 314.00 [109.25, 597.00] | 322.00 [104.00, 597.00] | 262.00 [134.00, 502.50] | 0.884 |
| Door-to-balloon (minutes) | 40.00 [29.75, 51.25] | 40.00 [29.00, 51.00] | 40.00 [32.50, 55.00] | 0.419 |
| Pre-PCI TIMI flow | 0.220 | |||
| 0 | 126 (61.8) | 91 (58.0) | 35 (74.5) | |
| 1 | 7 (3.4) | 6 (3.8) | 1 (2.1) | |
| 2 | 44 (21.6) | 36 (22.9) | 8 (17.0) | |
| 3 | 27 (13.2) | 24 (15.3) | 3 (6.4) | |
| Post-PCI TIMI flow | 0.073 | |||
| 0 | 2 (1.0) | 1 (0.6) | 1 (2.1) | |
| 1 | 1 (0.5) | 1 (0.6) | 0 (0.0) | |
| 2 | 22 (10.8) | 13 (8.3) | 9 (19.1) | |
| 3 | 179 (87.7) | 142 (90.4) | 37 (78.7) | |
| Culprit Vessel Territory | 0.482 | |||
| LAD | 117 (57.4) | 89 (56.7) | 28 (59.6) | |
| LCX | 47 (23.0) | 39 (24.8) | 8 (17.0) | |
| RCA | 40 (19.6) | 29 (18.5) | 11 (23.4) | |
| Number of diseased vessels | 0.916 | |||
| 2-Vessel Disease | 118 (57.84%) | 90 (57.32%) | 28 (59.57%) | |
| 3-Vessel Disease | 86 (42.2) | 67 (42.7) | 19 (40.4) |
| Parameters | Overall (n =204) | No Primary Endpoint (n = 157) | Group 4 FLVR or Grade II Diastolic Dysfunction (n =47) | p-Value |
|---|---|---|---|---|
| Baseline laboratory test | ||||
| Hemoglobin (g/L) | 134.56 ± 20.48 | 133.93 ± 19.94 | 136.66 ± 22.27 | 0.453 |
| White Blood Cell Count (109/L) | 9.86 [8.28, 12.09] | 9.77 [8.20, 11.97] | 10.18 [8.40, 13.26] | 0.350 |
| Platelets (×109/L) | 240.50 [203.75, 271.50] | 238.00 [204.00, 265.00] | 255.00 [202.00, 300.00] | 0.121 |
| Total cholesterol (mmol/L) | 4.67 [3.83, 5.80] | 4.69 [3.79, 5.81] | 4.56 [3.85, 5.67] | 0.869 |
| Low-density lipoprotein (mmol/L) | 2.94 [2.13, 3.93] | 2.94 [2.16, 3.92] | 3.00 [1.87, 4.07] | 0.910 |
| High-density lipoprotein (mmol/L) | 1.12 [0.95, 1.35] | 1.12 [0.95, 1.35] | 1.13 [0.94, 1.35] | 0.901 |
| Triglycerides (mmol/L) | 1.17 [0.83, 1.65] | 1.17 [0.82, 1.64] | 1.14 [0.84, 1.77] | 0.642 |
| Creatinine Clearance (ml/min) | 39.40 [34.88, 47.50] | 40.20 [35.10, 48.20] | 37.40 [34.15, 45.25] | 0.125 |
| Baseline Troponin I (µg/L) | 2.21 [0.84, 3.71] | 2.22 [0.77, 3.87] | 2.19 [0.89, 3.01] | 0.890 |
| Peak Troponin I (µg/L) | 47.00 [27.75, 64.25] | 44.00 [27.00, 61.00] | 50.00 [29.00, 67.50] | 0.333 |
| High-sensitivity CRP (mg/L) | 3.73 [1.82, 10.51] | 4.14 [2.02, 11.14] | 2.81 [1.69, 6.72] | 0.181 |
| Baseline TMAO | 0.94 [0.62, 1.95] | 0.94 [0.62, 1.87] | 1.12 [0.45, 1.98] | 0.627 |
| 3-month follow-up laboratory test | ||||
| 3-month TMAO (µM) | 2.91 [1.66, 4.71] | 2.47 [1.36, 3.85] | 4.28 [2.56, 7.43] | <0.001 |
| TMAO increase from baseline to 3 months | 1.44 [0.51, 3.36] | 1.34 [0.47, 2.40] | 3.72 [1.39, 6.00] | <0.001 |
| 3-month hs-CRP (mg/L) | 4.25 [2.31, 6.32] | 3.98 [1.98, 6.14] | 5.74 [3.91, 6.78] | 0.006 |
| 3-month BNP (ng/L) | 37.00 [27.00, 64.25] | 36.00 [27.00, 51.00] | 69.00 [32.50, 88.00] | <0.001 |
| 12-month follow-up laboratory test | ||||
| 12-month TMAO (µM) | 2.44 [1.35, 4.02] | 2.14 [1.18, 3.14] | 5.74 [3.00, 8.02] | <0.001 |
| Parameters | Overall (n = 204) | No Primary Endpoint (n = 157) | Group 4 FLVR or Grade II Diastolic Dysfunction (n = 47) | p-Value |
|---|---|---|---|---|
| (Post-PCI) | ||||
| LVEF (%) | 40.00 [36.00, 45.25] | 40.00 [35.00, 45.00] | 44.00 [40.00, 48.00] | 0.096 |
| LVEDV (mL) | 85.40 [68.80, 107.17] | 85.20 [68.80, 107.60] | 86.60 [69.50, 103.60] | 0.729 |
| E/A ratio | 0.93 [0.70, 1.37] | 0.84 [0.68, 1.32] | 1.30 [1.00, 1.53] | <0.001 |
| average e’ | 8.00 [6.00, 10.00] | 8.00 [6.00, 10.00] | 8.00 [7.00, 10.00] | 0.424 |
| E/e’ | 8.70 [7.00, 10.77] | 8.50 [6.80, 10.67] | 9.38 [8.05, 11.08] | 0.112 |
| TRpV | 2.59 [2.38, 2.80] | 2.60 [2.40, 2.80] | 2.50 [2.30, 2.75] | 0.282 |
| LA volume index | 26.07 [22.67, 31.18] | 26.17 [22.77, 30.47] | 26.01 [22.25, 32.27] | 0.816 |
| LV diastolic dysfunction | 0.286 | |||
| Grade 1 | 190 (93.1) | 146 (93.0) | 44 (93.6) | |
| Grade 2 | 7 (3.4) | 6 (3.8) | 1 (2.1) | |
| Grade 3 | 6 (2.9) | 5 (3.2) | 1 (2.1) | |
| NA | 1 (0.5) | 0 (0.0) | 1 (2.1) | |
| (at 12-month follow-up) | ||||
| LVEF (%) | 45.00 [40.00, 50.00] | 48.00 [40.00, 55.00] | 36.00 [30.50, 43.50] | <0.001 |
| LVEDV (mL) | 89.05 [70.88, 107.75] | 85.70 [70.50, 100.80] | 97.60 [83.60, 119.80] | 0.012 |
| E/A ratio | 1.23 [0.77, 1.41] | 1.29 [1.12, 1.44] | 0.74 [0.69, 0.78] | <0.001 |
| average e’ | 8.00 [5.00, 10.00] | 9.00 [7.00, 10.00] | 4.00 [4.00, 5.00] | <0.001 |
| E/e’ | 9.78 [7.74, 12.65] | 8.64 [7.10, 10.62] | 15.18 [14.41, 16.00] | <0.001 |
| TRpV | 2.60 [2.40, 2.90] | 2.46 [2.30, 2.60] | 3.10 [2.90, 3.45] | <0.001 |
| LA volume index (mL/m2) | 27.19 [23.02, 35.83] | 26.78 [22.77, 31.38] | 37.92 [25.59, 43.68] | <0.001 |
| LV diastolic dysfunction | <0.001 | |||
| Grade 1 | 163 (79.9) | 157 (100.0) | 6 (12.8) | |
| Grade 2 | 40 (19.6) | 0 (0.0) | 40 (85.1) | |
| Grade 3 | 0 (0) | 0 (0) | 0 (0) | |
| LVEF change (%) | 5.00 [0.00, 10.00] | 8.00 [0.00, 10.00] | −10.00 [−13.50, 0.00] | <0.001 |
| LVEDV change | 0.03 [−0.07, 0.11] | −0.01 [−0.07, 0.08] | 0.14 [0.05, 0.31] | <0.001 |
| FLVR | <0.001 | |||
| Group 1 | 148 (72.5) | 135 (86.0) | 13 (27.7) | |
| Group 2 | 24 (11.8) | 10 (6.4) | 14 (29.8) | |
| Group 3 | 17 (8.3) | 12 (7.6) | 5 (10.6) | |
| Group 4 | 15 (7.4) | 0 (0.0) | 15 (31.9) | |
| Variable | Univariable | Multivariable | ||
|---|---|---|---|---|
| Odds Ratio | p-Value | Odds Ratio | p-Value | |
| Age (years) | 1.00 (0.96–1.05) | 0.909 | ||
| Sex (Female) | 4.67 (1.43–15.24) | 0.011 | 2.46 (1.12–5.54) | 0.027 |
| Body mass index (kg/m2) | 0.98 (0.88–1.09) | 0.696 | ||
| Arterial hypertension | 1.44 (0.47–4.37) | 0.523 | ||
| History of coronary artery disease | 0.39 (0.09–1.81) | 0.231 | ||
| History of PCI | Not converge | 0.990 | ||
| History of stroke | 1.72 (0.45–6.54) | 0.427 | ||
| History of diabetes mellitus | 5.59 (1.88–16.63) | 0.002 | 1.31 (0.54–3.04) | 0.537 |
| History of dyslipidemia | 1.12 (0.38–3.29) | 0.830 | ||
| Smoker (former/current) | 1.06 (0.37–3.04) | 0.912 | ||
| History of alcohol abuse | 1.56 (0.32–7.48) | 0.581 | ||
| KILLIP class | 0.53 (0.18–1.59) | 0.256 | ||
| Hemoglobin (g/L) | 0.99 (0.97–1.02) | 0.509 | ||
| White Blood Cell Count (109/L) | 0.95 (0.79–1.15) | 0.595 | ||
| Platelets (×109/L) | 1.01 (1.00–1.01) | 0.088 | ||
| Total cholesterol (mmol/L) | 1.26 (0.91–1.76) | 0.165 | ||
| Low-density lipoprotein (mmol/L) | 1.42 (0.98–2.07) | 0.066 | ||
| High-density lipoprotein (mmol/L) | 0.90 (0.19–4.34) | 0.900 | ||
| Triglycerides (mmol/L) | 0.74 (0.35–1.58) | 0.440 | ||
| Creatinine Clearance (mL/min) | 0.96 (0.91–1.02) | 0.227 | ||
| Baseline Troponin I (µg/L) | 1.00 (0.91–1.10) | 0.929 | ||
| Peak Troponin I (µg/L) | 1.00 (0.98–1.02) | 0.878 | ||
| Baseline High-sensitivity CRP (mg/L) | 1.00 (0.98–1.02) | 0.893 | ||
| 3-month High-sensitivity CRP (mg/L) | 1.32 (1.10–1.59) | 0.003 | 1.12 (0.97–1.3) | 0.13 |
| 3-month BNP (ng/L) | 1.02 (1.01–1.02) | <0.001 | 0.874 | 0.874 |
| 3-month TMAO | 1.34 (1.14–1.58) | <0.001 | 1.28 (1.12–1.47) | <0.001 |
| Post-PCI LVEF (%) | 1.04 (0.96–1.13) | 0.32 | ||
| Post-PCI LVEDV | 1.00 (0.98–1.02) | 0.853 | ||
| Post-PCI LAVI (ml/m2) | 1.02 (0.94–1.11) | 0.635 | ||
| Post-PCI E/A ratio | 4.39 (1.36–14.12) | 0.013 | 3.82 (1.55–9.76) | 0.004 |
| Post-PCI E/e’ | 1.03 (0.86–1.24) | 0.738 | ||
| Post-PCI TRpV | 1.26 (0.29–5.41) | 0.76 | ||
| Pain-to-door time (minutes) | 1.00 (1.00–1.00) | 0.398 | ||
| Door-to-balloon (minutes) | 1.00 (0.97–1.03) | 0.805 | ||
| Culprit Vessel | 0.60 (0.16–2.22) | 0.441 | ||
| Number of diseased vessels | 0.47 (0.15–1.54) | 0.216 | ||
| Stent diameter (millimeters) | 2.10 (0.77–5.69) | 0.146 | ||
| Stent length (millimeters) | 1.08 (0.97–1.20) | 0.152 | ||
| Variable | Univariable | Multivariable | ||
|---|---|---|---|---|
| Odds Ratio | p-Value | Odds Ratio | p-Value | |
| Age (years) | 0.98 (0.96–1.01) | 0.275 | ||
| Sex (Female) | 2.87 (1.41–5.83) | 0.004 | 2.46 (1.12–5.54) | 0.027 |
| Body mass index (kg/m2) | 0.96 (0.89–1.03) | 0.255 | ||
| Arterial hypertension | 1.07 (0.53–2.17) | 0.843 | ||
| History of coronary artery disease | 1.60 (0.76–3.36) | 0.212 | ||
| History of PCI | 1.42 (0.52–3.85) | 0.489 | ||
| History of stroke | 2.34 (0.96–5.69) | 0.061 | ||
| History of diabetes mellitus | 1.76 (0.82–3.77) | 0.145 | 1.31 (0.54–3.04) | 0.537 |
| History of dyslipidemia | 0.90 (0.45–1.80) | 0.760 | ||
| Smoker (former/current) | 1.34 (0.66–2.69) | 0.415 | ||
| History of alcohol abuse | 0.45 (0.10–2.04) | 0.302 | ||
| KILLIP class | 1.30 (0.59–2.88) | 0.519 | ||
| Hemoglobin (g/L) | 1.01 (0.99–1.03) | 0.171 | ||
| White Blood Cell Count (109/L) | 1.13 (1.01–1.27) | 0.032 | ||
| Platelets (×109/L) | 1.01 (1.00–1.01) | 0.03 | 1.01 (1.00–1.01) | 0.096 |
| Total cholesterol (mmol/L) | 0.92 (0.72–1.16) | 0.477 | ||
| Low-density lipoprotein (mmol/L) | 0.96 (0.73–1.25) | 0.747 | ||
| High-density lipoprotein (mmol/L) | 0.62 (0.21–1.83) | 0.389 | ||
| Triglycerides (mmol/L) | 0.84 (0.55–1.29) | 0.425 | ||
| Creatinine Clearance (mL/min) | 0.96 (0.93–1.00) | 0.056 | ||
| Baseline Troponin I (µg/L) | 0.98 (0.91–1.06) | 0.626 | ||
| Peak Troponin I (µg/L) | 1.00 (0.99–1.01) | 0.523 | ||
| Baseline High-sensitivity CRP (mg/L) | 0.99 (0.97–1.01) | 0.284 | ||
| 3-month High-sensitivity CRP (mg/L) | 1.17 (1.03–1.34) | 0.017 | 1.14 (0.98–1.33) | 0.093 |
| 3-month BNP (ng/L) | 1.01 (1.00–1.01) | 0.06 | ||
| 3-month TMAO | 1.28 (1.13–1.45) | <0.001 | 1.29 (1.13–1.50) | <0.001 |
| Post-PCI LVEF (%) | 1.07 (1.01–1.14) | 0.015 | 1.07 (1.00–1.15) | 0.057 |
| Post-PCI LVEDV | 1.00 (0.98–1.01) | 0.605 | ||
| Post-PCI LAVI (mL/m2) | 1.01 (0.96–1.07) | 0.657 | ||
| Post-PCI E/A ratio | 3.18 (1.44–6.99) | 0.004 | 4.11 (1.61–10.98) | 0.004 |
| Post-PCI E/e’ | 1.08 (0.96–1.22) | 0.19 | ||
| Post-PCI TRpV | 0.69 (0.25–1.92) | 0.482 | ||
| Pain-to-door time (minutes) | 1.00 (1.00–1.00) | 0.233 | ||
| Door-to-balloon (minutes) | 1.01 (0.99–1.02) | 0.599 | ||
| Culprit Vessel | 0.47 (0.17–1.33) | 0.154 | ||
| Number of diseased vessels | 1.01 (0.50–2.03) | 0.985 | ||
| Stent diameter (millimeters) | 0.89 (0.41–1.94) | 0.773 | ||
| Stent length (millimeters) | 1.04 (0.98–1.11) | 0.239 | ||
Disclaimer/Publisher’s Note: The statements, opinions and data contained in all publications are solely those of the individual author(s) and contributor(s) and not of MDPI and/or the editor(s). MDPI and/or the editor(s) disclaim responsibility for any injury to people or property resulting from any ideas, methods, instructions or products referred to in the content. |
© 2025 by the authors. Licensee MDPI, Basel, Switzerland. This article is an open access article distributed under the terms and conditions of the Creative Commons Attribution (CC BY) license (https://creativecommons.org/licenses/by/4.0/).
Share and Cite
Tsai, T.-Y.; Aldujeli, A.; Haq, A.; Murphy, P.; Unikas, R.; Sharif, F.; Garg, S.; Brilakis, E.S.; Onuma, Y.; Serruys, P.W. Trimethylamine N-Oxide as a Biomarker for Left Ventricular Diastolic Dysfunction and Functional Remodeling After STEMI. Int. J. Mol. Sci. 2025, 26, 3400. https://doi.org/10.3390/ijms26073400
Tsai T-Y, Aldujeli A, Haq A, Murphy P, Unikas R, Sharif F, Garg S, Brilakis ES, Onuma Y, Serruys PW. Trimethylamine N-Oxide as a Biomarker for Left Ventricular Diastolic Dysfunction and Functional Remodeling After STEMI. International Journal of Molecular Sciences. 2025; 26(7):3400. https://doi.org/10.3390/ijms26073400
Chicago/Turabian StyleTsai, Tsung-Ying, Ali Aldujeli, Ayman Haq, Paddy Murphy, Ramunas Unikas, Faisal Sharif, Scot Garg, Emmanouil S. Brilakis, Yoshinobu Onuma, and Patrick W. Serruys. 2025. "Trimethylamine N-Oxide as a Biomarker for Left Ventricular Diastolic Dysfunction and Functional Remodeling After STEMI" International Journal of Molecular Sciences 26, no. 7: 3400. https://doi.org/10.3390/ijms26073400
APA StyleTsai, T.-Y., Aldujeli, A., Haq, A., Murphy, P., Unikas, R., Sharif, F., Garg, S., Brilakis, E. S., Onuma, Y., & Serruys, P. W. (2025). Trimethylamine N-Oxide as a Biomarker for Left Ventricular Diastolic Dysfunction and Functional Remodeling After STEMI. International Journal of Molecular Sciences, 26(7), 3400. https://doi.org/10.3390/ijms26073400