
Implementation of FRET Spectrometry Using Temporally Resolved Fluorescence: A Feasibility Study


 and
and
Abstract
1. Introduction
2. Results and Discussion
3. Materials and Methods
3.1. Sample Preparation
3.2. Imaging
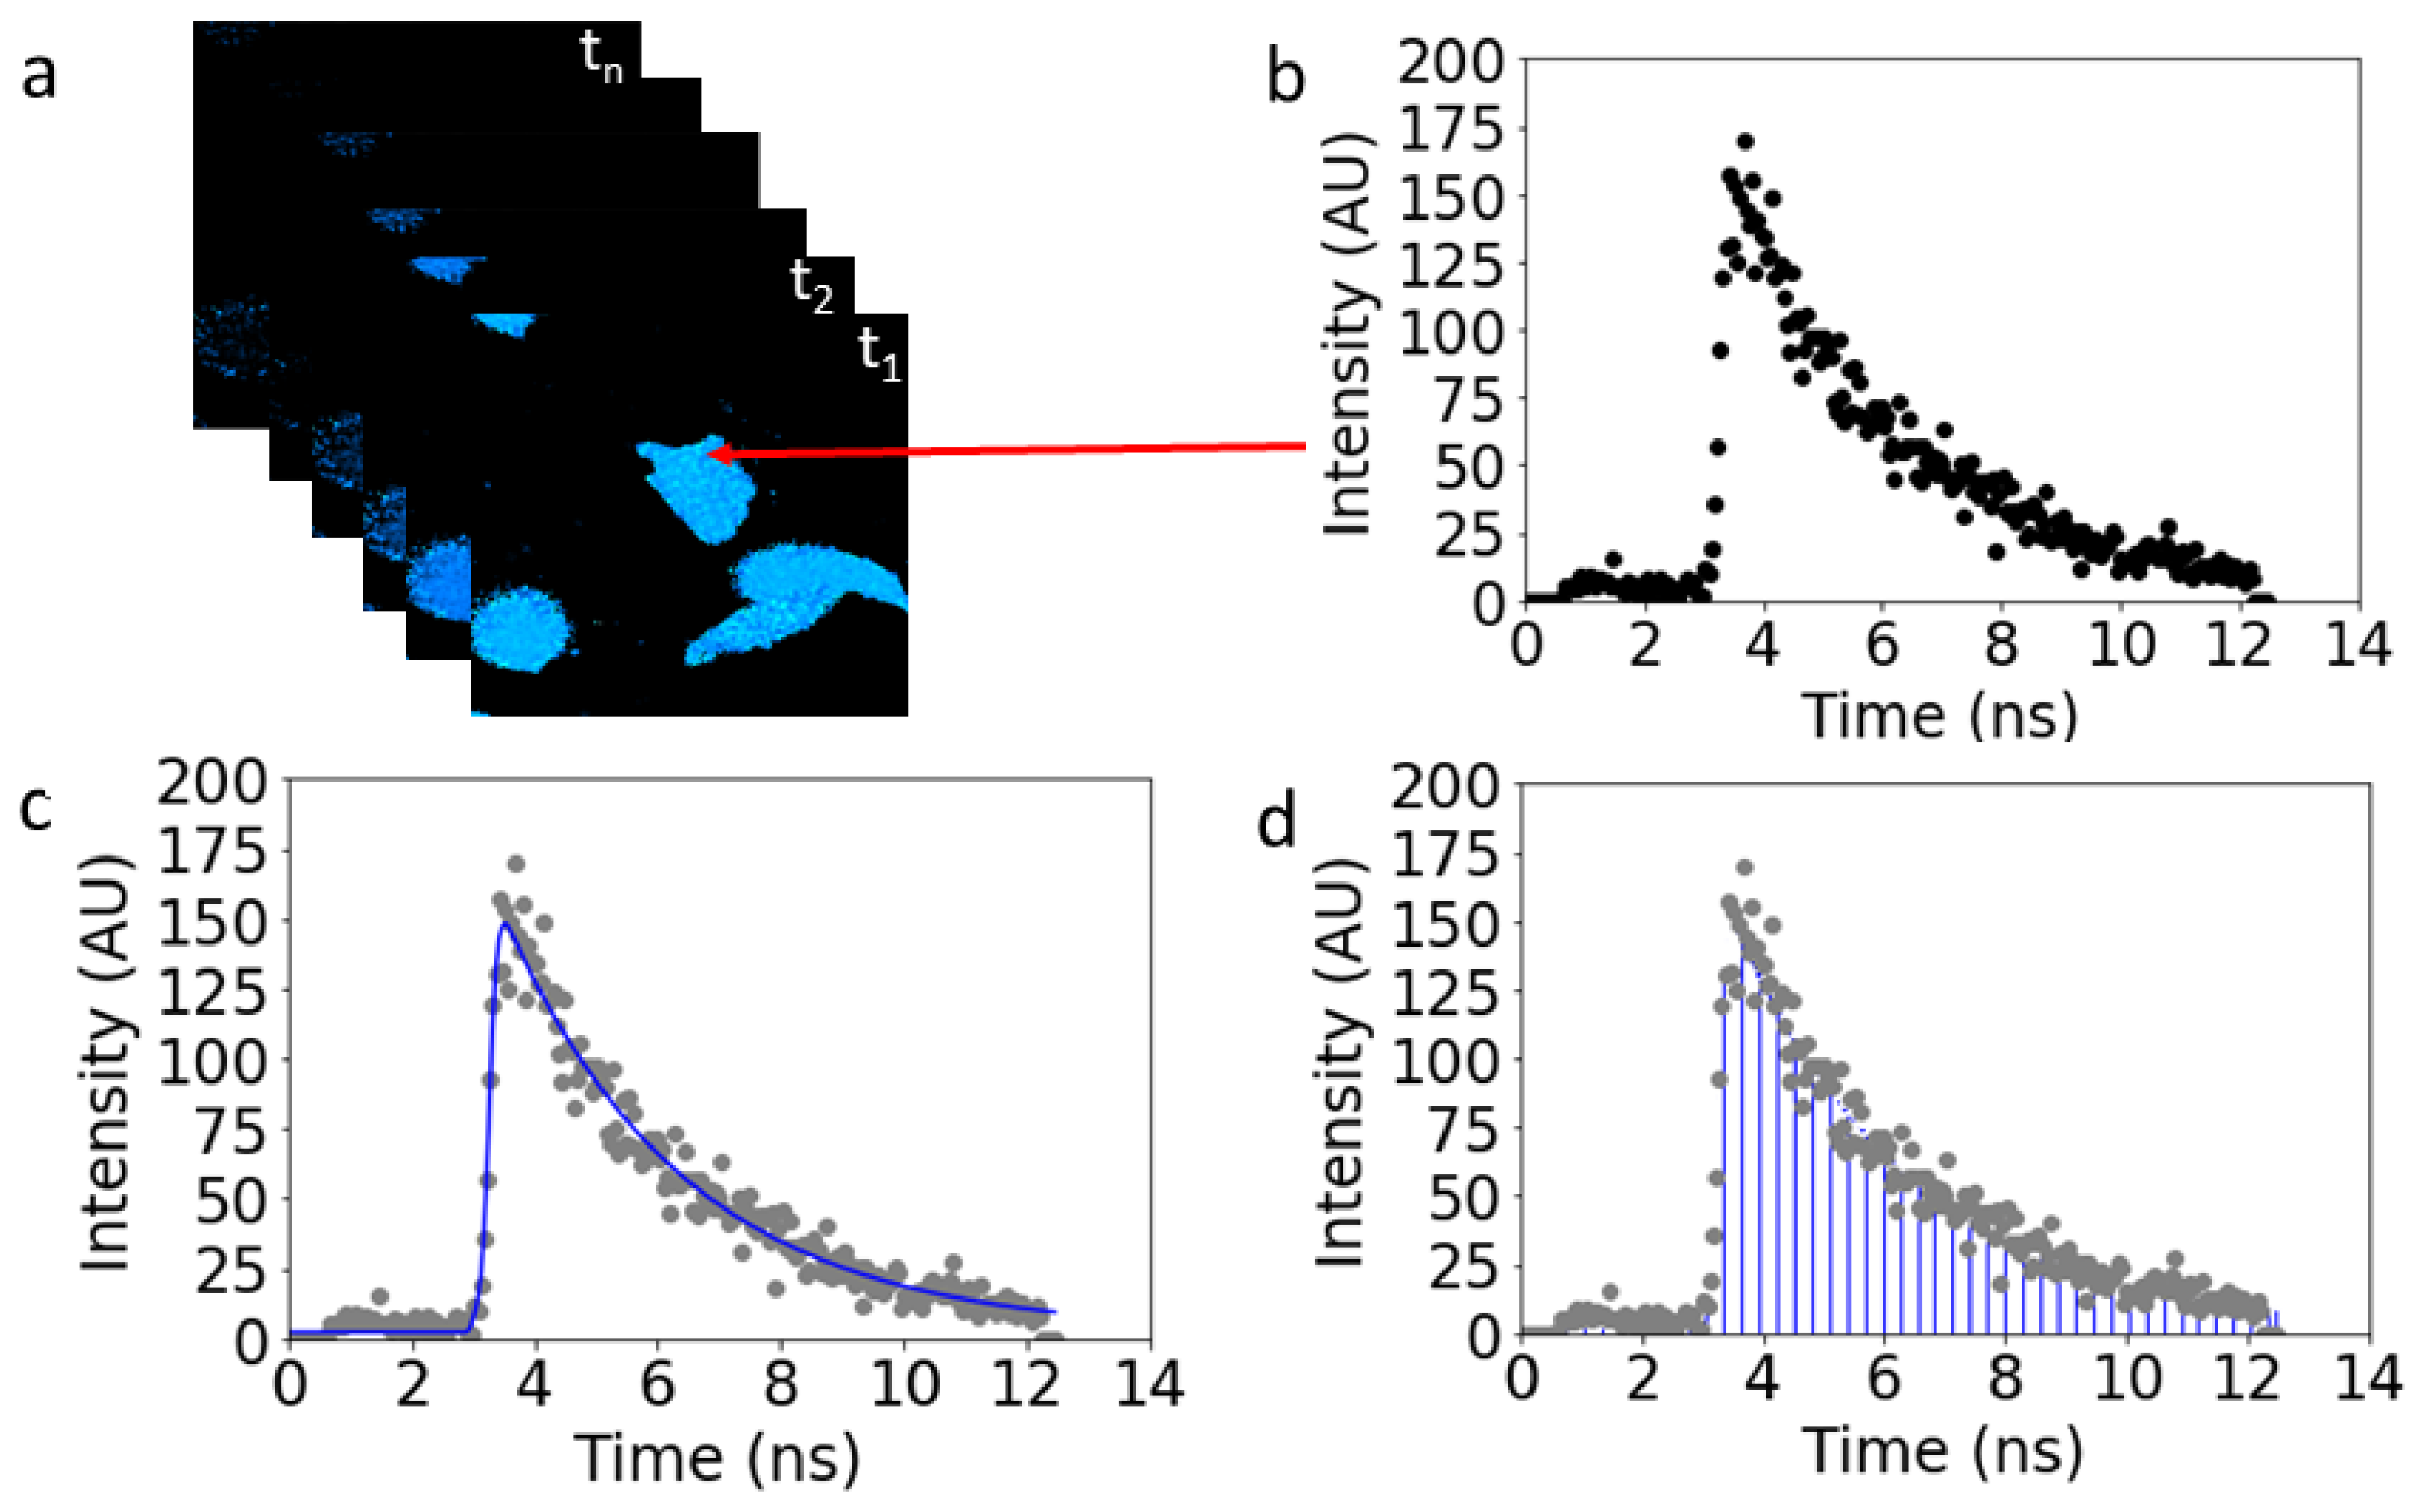
3.3. Data Reduction
3.4. Image Segmentation and FRET Meta-Histogram Construction
4. Conclusions
Supplementary Materials
Author Contributions
Funding
Institutional Review Board Statement
Informed Consent Statement
Data Availability Statement
Conflicts of Interest
References
- Lostao, A.; Lim, K.; Pallarés, M.C.; Ptak, A.; Marcuello, C. Recent advances in sensing the inter-biomolecular interactions at the nanoscale—A comprehensive review of AFM-based force spectroscopy. Int. J. Biol. Macromol. 2023, 238, 124089. [Google Scholar] [CrossRef]
- Verweij, E.W.E.; Bosma, R.; Gao, M.; van den Bor, J.; Al Araaj, B.; de Munnik, S.M.; Ma, X.; Leurs, R.; Vischer, H.F. BRET-Based Biosensors to Measure Agonist Efficacies in Histamine H1 Receptor-Mediated G Protein Activation, Signaling and Interactions with GRKs and β-Arrestins. Int. J. Mol. Sci. 2022, 23, 3184. [Google Scholar] [CrossRef]
- Zimmermann, T.; Rietdorf, J.; Girod, A.; Georget, V.; Pepperkok, R. Spectral imaging and linear un-mixing enables improved FRET efficiency with a novel GFP2-YFP FRET pair. Febs Lett. 2002, 531, 245–249. [Google Scholar] [CrossRef]
- Jares-Erijman, E.A.; Jovin, T.M. FRET imaging. Nat. Biotechnol. 2003, 21, 1387–1395. [Google Scholar] [CrossRef]
- Stoneman, M.R.; Raicu, V. Fluorescence-Based Detection of Proteins and Their Interactions in Live Cells. J. Phys. Chem. B 2023, 127, 4708–4721. [Google Scholar] [CrossRef] [PubMed]
- King, C.; Hristova, K. Direct measurements of VEGF-VEGFR2 binding affinities reveal the coupling between ligand binding and receptor dimerization. J. Biol. Chem. 2019, 294, 9064–9075. [Google Scholar] [CrossRef]
- Raicu, V.; Jansma, D.B.; Miller, R.J.D.; Friesen, J.D. Protein interaction quantified in vivo by spectrally resolved fluorescence resonance energy transfer. Biochem. J. 2005, 385, 265–277. [Google Scholar] [CrossRef]
- Hoppe, A.D.; Swanson, J.A. Cdc42, Rac1, and Rac2 display distinct patterns of activation during phagocytosis. Mol. Biol. Cell 2004, 15, 3509–3519. [Google Scholar] [CrossRef] [PubMed]
- Padilla-Parra, S.; Audugé, N.; Lalucque, H.; Mevel, J.C.; Coppey-Moisan, M.; Tramier, M. Quantitative Comparison of Different Fluorescent Protein Couples for Fast FRET-FLIM Acquisition. Biophys. J. 2009, 97, 2368–2376. [Google Scholar] [CrossRef] [PubMed]
- Margineanu, A.; Chan, J.J.; Kelly, D.J.; Warren, S.C.; Flatters, D.; Kumar, S.; Katan, M.; Dunsby, C.W.; French, P.M.W. Screening for protein-protein interactions using Forster resonance energy transfer (FRET) and fluorescence lifetime imaging microscopy (FLIM). Sci. Rep. 2016, 6, 28186. [Google Scholar] [CrossRef]
- Stoneman, M.R.; Paprocki, J.D.; Biener, G.; Yokoi, K.; Shevade, A.; Kuchin, S.; Raicu, V. Quaternary structure of the yeast pheromone receptor Ste2 in living cells. Biochim. Et Biophys. Acta-Biomembr. 2017, 1859, 1456–1464. [Google Scholar] [CrossRef]
- Patowary, S.; Pisterzi, L.F.; Biener, G.; Holz, J.D.; Oliver, J.A.; Wells, J.W.; Raicu, V. Experimental Verification of the Kinetic Theory of FRET Using Optical Microspectroscopy and Obligate Oligomers. Biophys. J. 2015, 108, 1613–1622. [Google Scholar] [CrossRef] [PubMed]
- McKenzie, D.M.; Wirth, D.; Pogorelov, T.; Hristova, K. Utility of FRET in studies of membrane protein oligomerization: The concept of the effective dissociation constant. Biophys. J. 2023, 122, 4113–4120. [Google Scholar] [CrossRef] [PubMed]
- Raicu, V.; Singh, D.R. FRET Spectrometry: A New Tool for the Determination of Protein Quaternary Structure in Living Cells. Biophys. J. 2013, 105, 1937–1945. [Google Scholar] [CrossRef]
- Patowary, S.; Alvarez-Curto, E.; Xu, T.R.; Holz, J.D.; Oliver, J.A.; Milligan, G.; Raicu, V. The muscarinic M acetylcholine receptor exists as two differently Sized complexes at the plasma membrane. Biochem. J. 2013, 452, 303–312. [Google Scholar] [CrossRef] [PubMed]
- Singh, D.R.; Mohammad, M.M.; Patowary, S.; Stoneman, M.R.; Oliver, J.A.; Movileanu, L.; Raicu, V. Determination of the quaternary structure of a bacterial ATP-binding cassette (ABC) transporter in living cells. Integr. Biol. 2013, 5, 312–323. [Google Scholar] [CrossRef] [PubMed]
- Mishra, A.K.; Gragg, M.; Stoneman, M.R.; Biener, G.; Oliver, J.A.; Miszta, P.; Filipek, S.; Raicu, V.; Park, P.S.H. Quaternary structures of opsin in live cells revealed by FRET spectrometry. Biochem. J. 2016, 473, 3819–3836. [Google Scholar] [CrossRef] [PubMed]
- Singh, D.R.; Raicu, V. Comparison between Whole Distribution- and Average-Based Approaches to the Determination of Fluorescence Resonance Energy Transfer Efficiency in Ensembles of Proteins in Living Cells. Biophys. J. 2010, 98, 2127–2135. [Google Scholar] [CrossRef] [PubMed]
- Raicu, V. Extraction of information on macromolecular interactions from fluorescence micro-spectroscopy measurements in the presence and absence of FRET. Spectrochim. Acta A 2018, 199, 340–348. [Google Scholar] [CrossRef] [PubMed]
- Stoneman, M.R.; Raicu, N.; Biener, G.; Raicu, V. Fluorescence-based Methods for the Study of Protein-Protein Interactions Modulated by Ligand Binding. Curr. Pharm. Des. 2020, 26, 5668–5683. [Google Scholar] [CrossRef]
- Becker, W. Fluorescence lifetime imaging—Techniques and applications. J. Microsc. 2012, 247, 119–136. [Google Scholar] [CrossRef]
- Szulczewski, J.M.; Inman, D.R.; Entenberg, D.; Ponik, S.M.; Aguirre-Ghiso, J.; Castracane, J.; Condeelis, J.; Eliceiri, K.W.; Keely, P.J. Visualization of Stromal Macrophages via label-free FLIM-based metabolite imaging. Sci. Rep. 2016, 6. [Google Scholar] [CrossRef] [PubMed]
- Provenzano, P.P.; Eliceiri, K.W.; Keely, P.J. Multiphoton microscopy and fluorescence lifetime imaging microscopy (FLIM) to monitor metastasis and the tumor microenvironment. Clin. Exp. Metastasis 2009, 26, 357–370. [Google Scholar] [CrossRef] [PubMed]
- van Munster, E.B.; Gadella, T.W.J. Fluorescence lifetime imaging microscopy (FLIM). Microsc. Tech. 2005, 95, 143–175. [Google Scholar]
- Wallrabe, H.; Periasamy, A. Imaging protein molecules using FRET and FLIM microscopy. Curr. Opin. Biotechnol. 2005, 16, 19–27. [Google Scholar] [CrossRef] [PubMed]
- Chacko, J.V.; Eliceiri, K.W. Autofluorescence lifetime imaging of cellular metabolism: Sensitivity toward cell density, pH, intracellular, and intercellular heterogeneity. Cytom. Part A 2019, 95, 56–69. [Google Scholar] [CrossRef]
- Chen, H.T.; Holst, G.; Gratton, E. Modulated CMOS Camera for Fluorescence Lifetime Microscopy. Microsc. Res. Tech. 2015, 78, 1075–1081. [Google Scholar] [CrossRef]
- Chen, Y.; Mills, J.D.; Periasamy, A. Protein localization in living cells and tissues using FRET and FLIM. Differentiation 2003, 71, 528–541. [Google Scholar] [CrossRef]
- Hinde, E.; Digman, M.A.; Welch, C.; Hahn, K.M.; Gratton, E. Millisecond Spatiotemporal Dynamics of FRET Biosensors by the Pair Correlation Function and the Phasor Approach to FLIM. Biophys. J. 2012, 102, 198a–199a. [Google Scholar] [CrossRef]
- Sun, Y.S.; Hays, N.M.; Periasamy, A.; Davidson, M.W.; Day, R.N. Monitoring Protein Interactions in Living Cells with Fluorescence Lifetime Imaging Microscopy. Imaging Spectrosc. Anal. Living Cells Opt. Spectrosc. Tech. 2012, 504, 371–391. [Google Scholar] [CrossRef]
- Duncan, R.R.; Bergmann, A.; Cousin, M.A.; Apps, D.K.; Shipston, M.J. Multi-dimensional time-correlated single photon counting (TCSPC) fluorescence lifetime imaging microscopy (FLIM) to detect FRET in cells. J. Microsc. 2004, 215, 1–12. [Google Scholar] [CrossRef] [PubMed]
- Raicu, V. Efficiency of resonance energy transfer in homo-oligomeric complexes of proteins. J. Biol. Phys. 2007, 33, 109–127. [Google Scholar] [CrossRef]
- Raicu, V. Ab inito derivation of the FRET equations resolves old puzzles and suggests measurement strategies. Biophys. J. 2019, 116, 1313–1327. [Google Scholar] [CrossRef] [PubMed]
- Koushik, S.V.; Chen, H.; Thaler, C.; Puhl, H.L.; Vogel, S.S. Cerulean, Venus, and Venus(Y67C) FRET reference standards. Biophys. J. 2006, 91, L99–L101. [Google Scholar] [CrossRef]
- Paprocki, J.; Biener, G.; Stoneman, M.; Raicu, V. In-Cell Detection of Conformational Substates of a G Protein-Coupled Receptor Quaternary Structure: Modulation of Substate Probability by Cognate Ligand Binding. J. Phys. Chem. B 2020, 124, 10062–10076. [Google Scholar] [CrossRef]
- Adhikari, D.P.; Stoneman, M.R.; Raicu, V. Impact of photobleaching of fluorescent proteins on FRET measurements under two-photon excitation conditions. bioRxiv 2024. [Google Scholar]
- LeBert, D.C.; Squirrell, J.M.; Huttenlocher, A.; Eliceiri, K.W. Second harmonic generation microscopy in zebrafish. Zebrafish: Cell. Dev. Biol. Pt A Cell. Biol. 2016, 133, 55–68. [Google Scholar] [CrossRef] [PubMed]
- Marino, K.M.; Squirrell, J.M.; Chacko, J.V.; Watters, J.W.; Eliceiri, K.W.; Ulland, T.K. Metabolic response of microglia to amyloid deposition during Alzheimer’s disease progression in a mouse model. bioRxiv 2023. [Google Scholar] [CrossRef]
- Stoneman, M.R.; Biener, G.; Ward, R.J.; Pediani, J.D.; Badu, D.; Eis, A.; Popa, I.; Milliagn, G.; Raicu, V. A general method to quantify lignad-driven oligomerization from fluorescence-based images. Nat. Methods 2019, 16, 493–496. [Google Scholar] [CrossRef]
- Demachy, I.; Ridard, J.; Laguitton-Pasquier, H.; Durnerin, E.; Vallverdu, G.; Archirel, P.; Lévy, B. Cyan fluorescent protein:: Molecular dynamics, simulations, and electronic absorption spectrum. J. Phys. Chem. B 2005, 109, 24121–24133. [Google Scholar] [CrossRef]
- Malo, G.D.; Pouwels, L.J.; Wang, M.T.; Weichsel, A.; Montfort, W.R.; Rizzo, M.A.; Piston, D.W.; Wachter, R.M. X-ray structure of cerulean GFP: A tryptophan-based chromophore useful for fluorescence lifetime imaging. Biochemistry 2007, 46, 9865–9873. [Google Scholar] [CrossRef] [PubMed]
- Eggeling, C.; Widengren, J.; Brand, L.; Schaffer, J.; Felekyan, S.; Seidel, C.A.M. Analysis of photobleaching in single-molecule multicolor excitation and forster resonance energy transfer measurement. J. Phys. Chem. A 2006, 110, 2979–2995. [Google Scholar] [CrossRef] [PubMed]
- Kong, X.X.; Nir, E.; Hamadani, K.; Weiss, S. Photobleaching pathways in single-molecule FRET experiments. J. Am. Chem. Soc. 2007, 129, 4643–4654. [Google Scholar] [CrossRef] [PubMed]
- Warren, S.C.; Margineanu, A.; Katan, M.; Dunsby, C.; French, P.M.W. Homo-FRET Based Biosensors and Their Application to Multiplexed Imaging of Signalling Events in Live Cells. Int. J. Mol. Sci. 2015, 16, 14695–14716. [Google Scholar] [CrossRef]


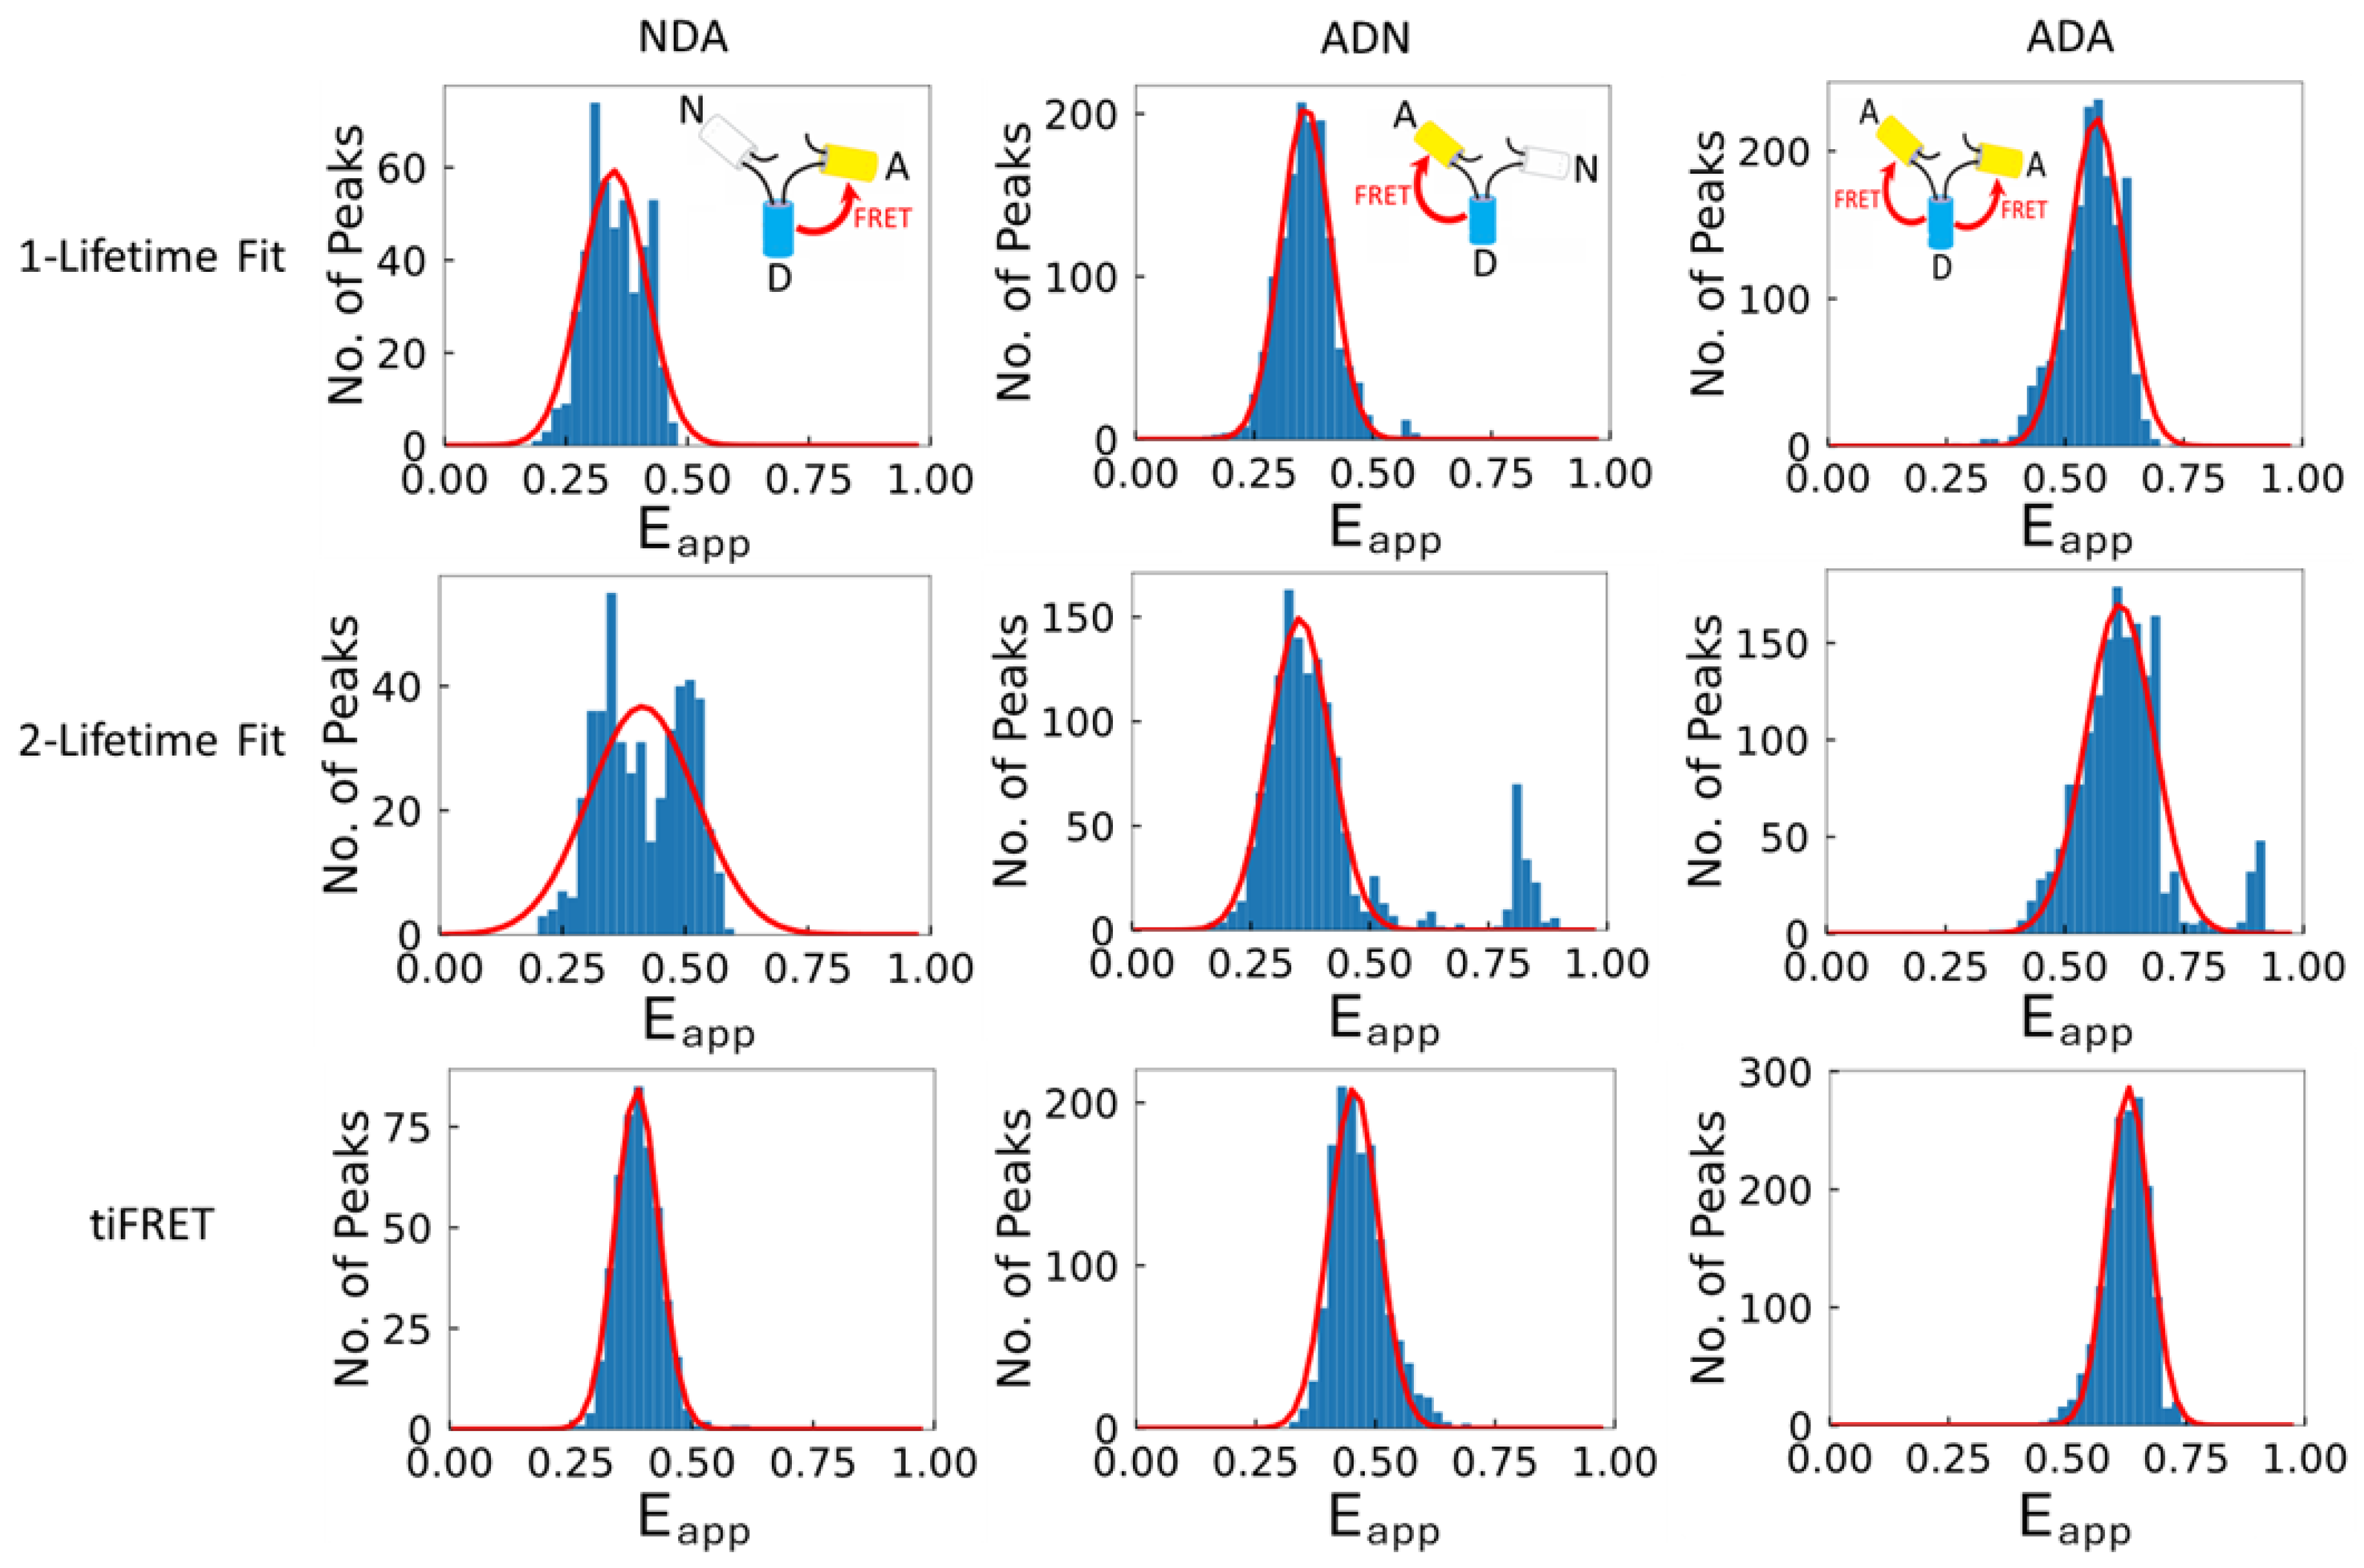
| Method | Construct | ||
|---|---|---|---|
| NDA | ADN | ADA | |
| 1-Lifetime Fit | 0.33 ± 0.03 | 0.32 ± 0.02 | 0.56 ± 0.02 |
| 2-Lifetime Fit | 0.43 ± 0.05 | 0.40 ± 0.04 | 0.60 ± 0.02 |
| tiFRET | 0.36 ± 0.02 | 0.39 ± 0.02 | 0.62 ± 0.02 |
Disclaimer/Publisher’s Note: The statements, opinions and data contained in all publications are solely those of the individual author(s) and contributor(s) and not of MDPI and/or the editor(s). MDPI and/or the editor(s) disclaim responsibility for any injury to people or property resulting from any ideas, methods, instructions or products referred to in the content. |
© 2024 by the authors. Licensee MDPI, Basel, Switzerland. This article is an open access article distributed under the terms and conditions of the Creative Commons Attribution (CC BY) license (https://creativecommons.org/licenses/by/4.0/).
Share and Cite
Trujillo, J.; Khan, A.S.; Adhikari, D.P.; Stoneman, M.R.; Chacko, J.V.; Eliceiri, K.W.; Raicu, V. Implementation of FRET Spectrometry Using Temporally Resolved Fluorescence: A Feasibility Study. Int. J. Mol. Sci. 2024, 25, 4706. https://doi.org/10.3390/ijms25094706
Trujillo J, Khan AS, Adhikari DP, Stoneman MR, Chacko JV, Eliceiri KW, Raicu V. Implementation of FRET Spectrometry Using Temporally Resolved Fluorescence: A Feasibility Study. International Journal of Molecular Sciences. 2024; 25(9):4706. https://doi.org/10.3390/ijms25094706
Chicago/Turabian StyleTrujillo, Justin, Aliyah S. Khan, Dhruba P. Adhikari, Michael R. Stoneman, Jenu V. Chacko, Kevin W. Eliceiri, and Valerica Raicu. 2024. "Implementation of FRET Spectrometry Using Temporally Resolved Fluorescence: A Feasibility Study" International Journal of Molecular Sciences 25, no. 9: 4706. https://doi.org/10.3390/ijms25094706
APA StyleTrujillo, J., Khan, A. S., Adhikari, D. P., Stoneman, M. R., Chacko, J. V., Eliceiri, K. W., & Raicu, V. (2024). Implementation of FRET Spectrometry Using Temporally Resolved Fluorescence: A Feasibility Study. International Journal of Molecular Sciences, 25(9), 4706. https://doi.org/10.3390/ijms25094706