
A Brazilian Rare-Disease Center’s Experience with Glucosylsphingosine (lyso-Gb1) in Patients with Gaucher Disease: Exploring a Novel Correlation with IgG Levels in Plasma and a Biomarker Measurement in CSF

 , , ,
, , ,  ,
,  and
and
Abstract
1. Introduction
2. Results
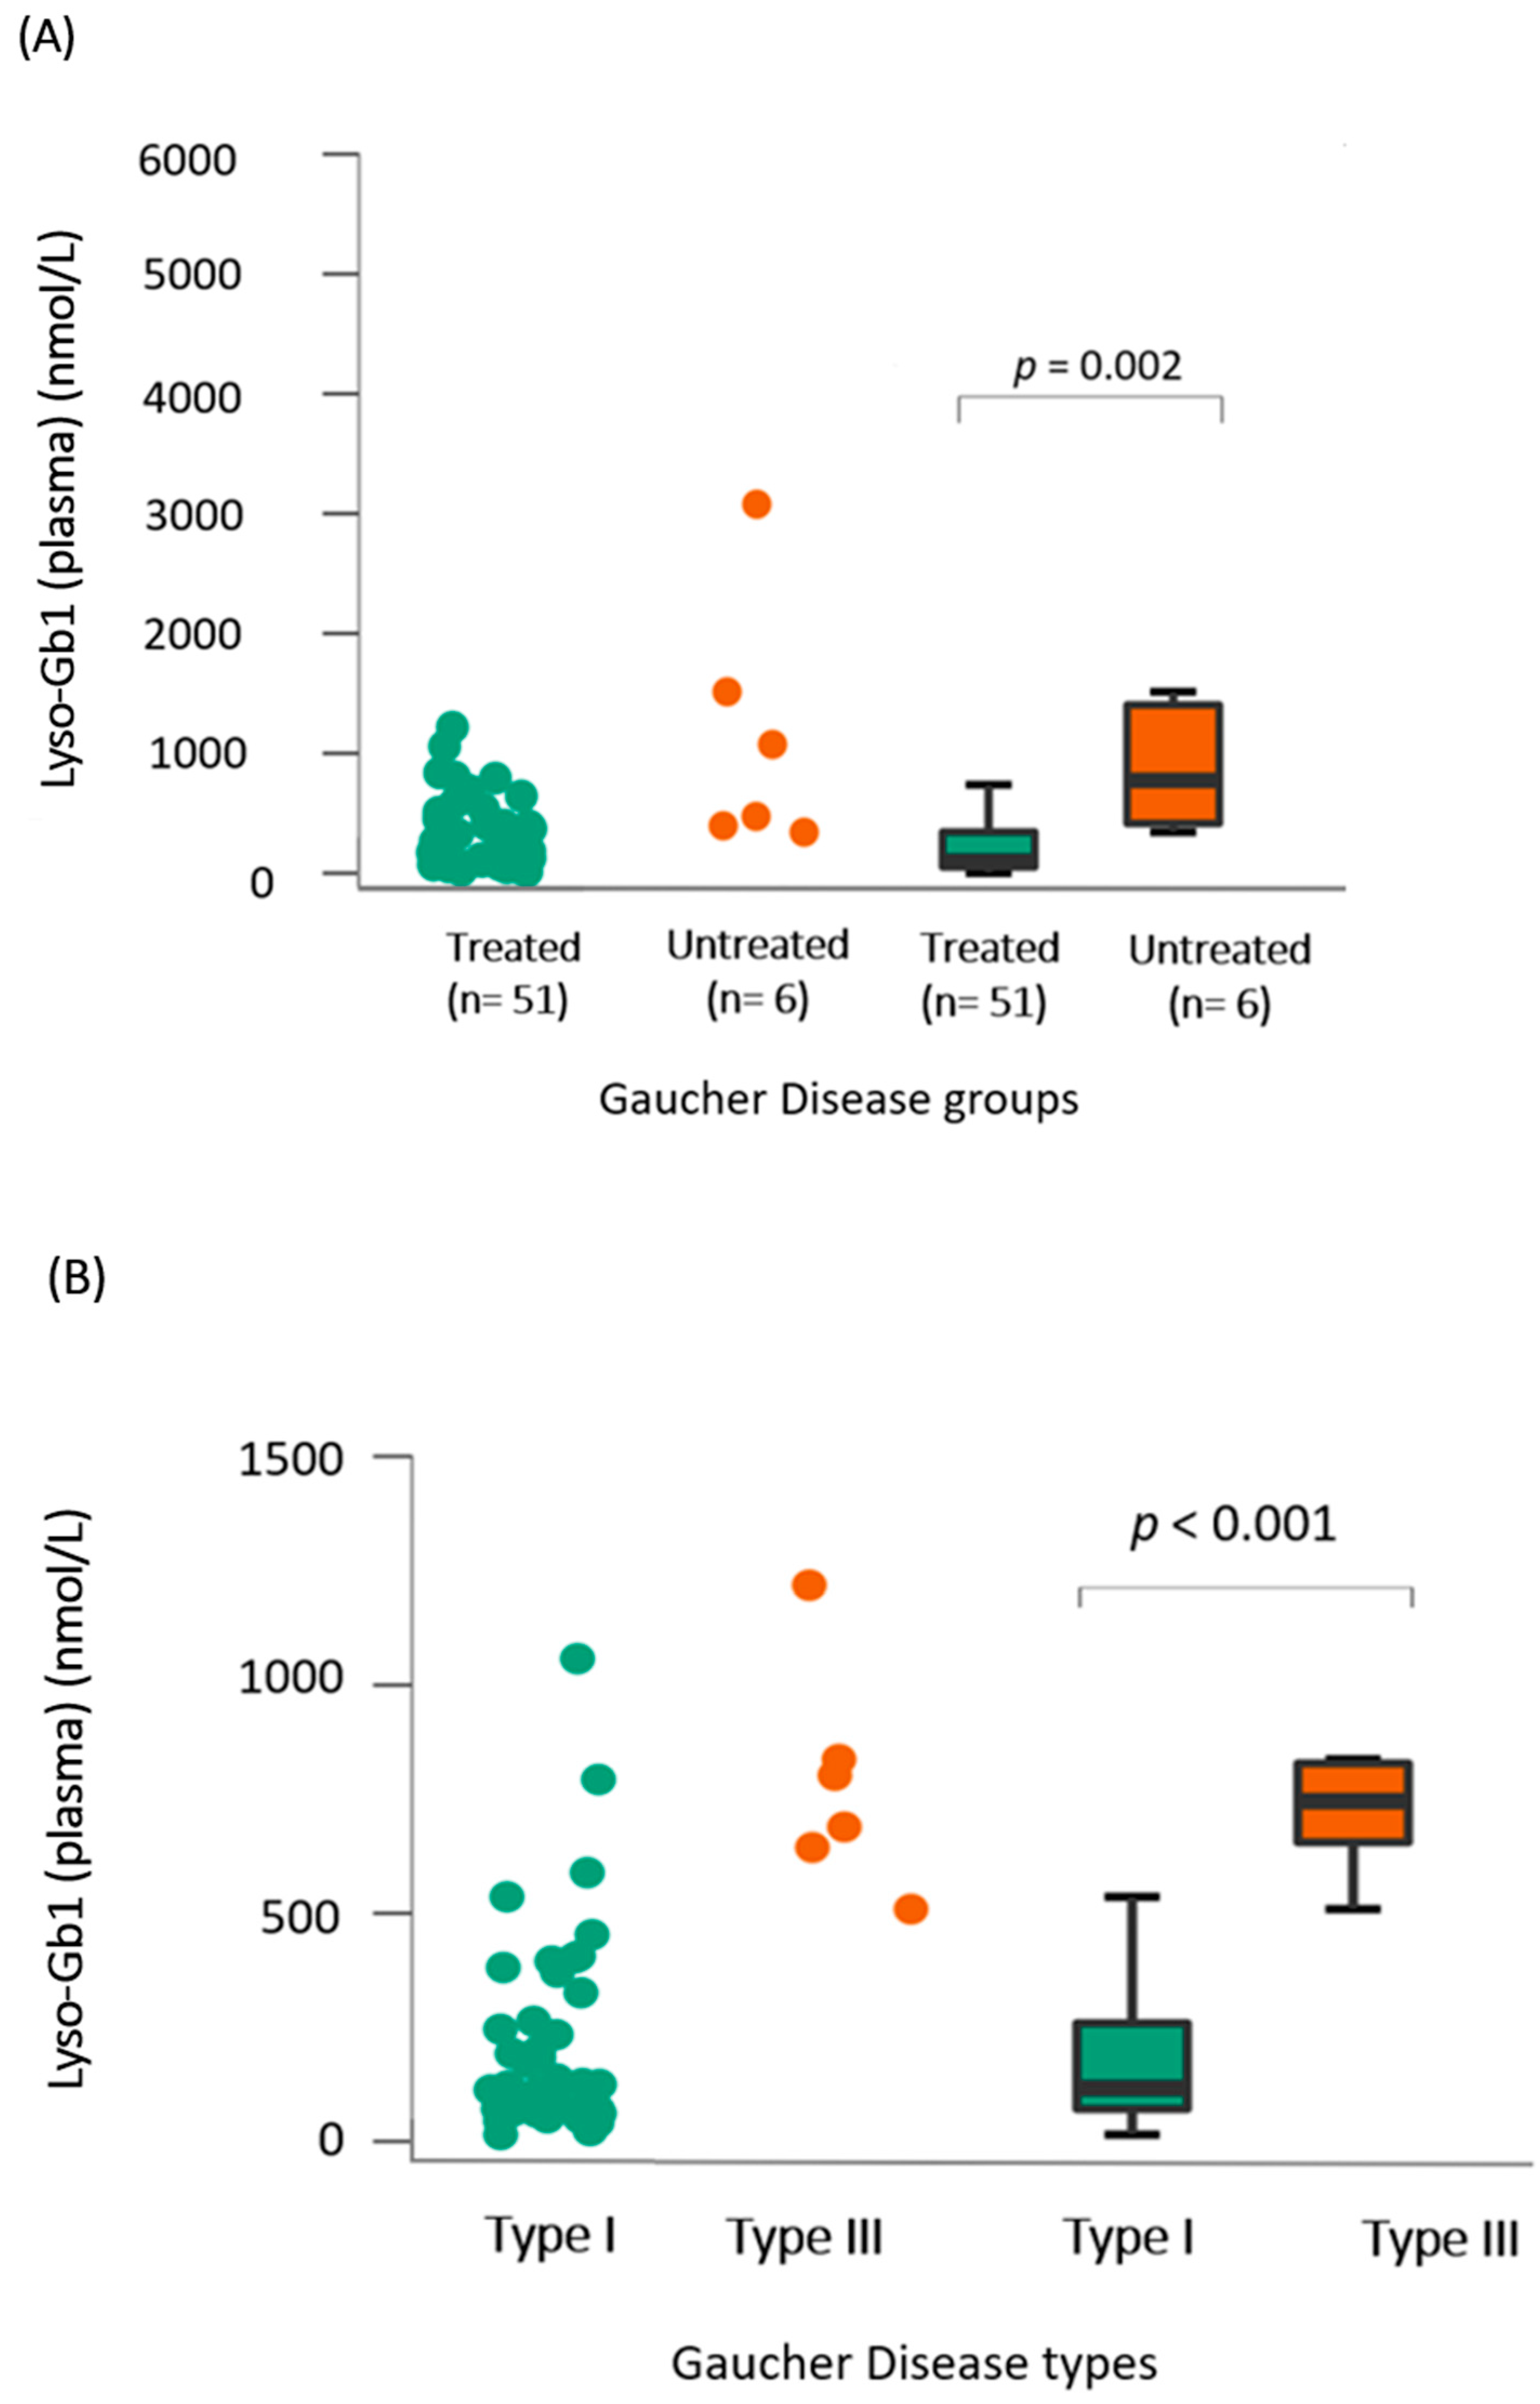
- (A)
- Lyso-Gb1 levels in dried blood spots showed a positive correlation with the treatment status and type of Gaucher disease
- (B)
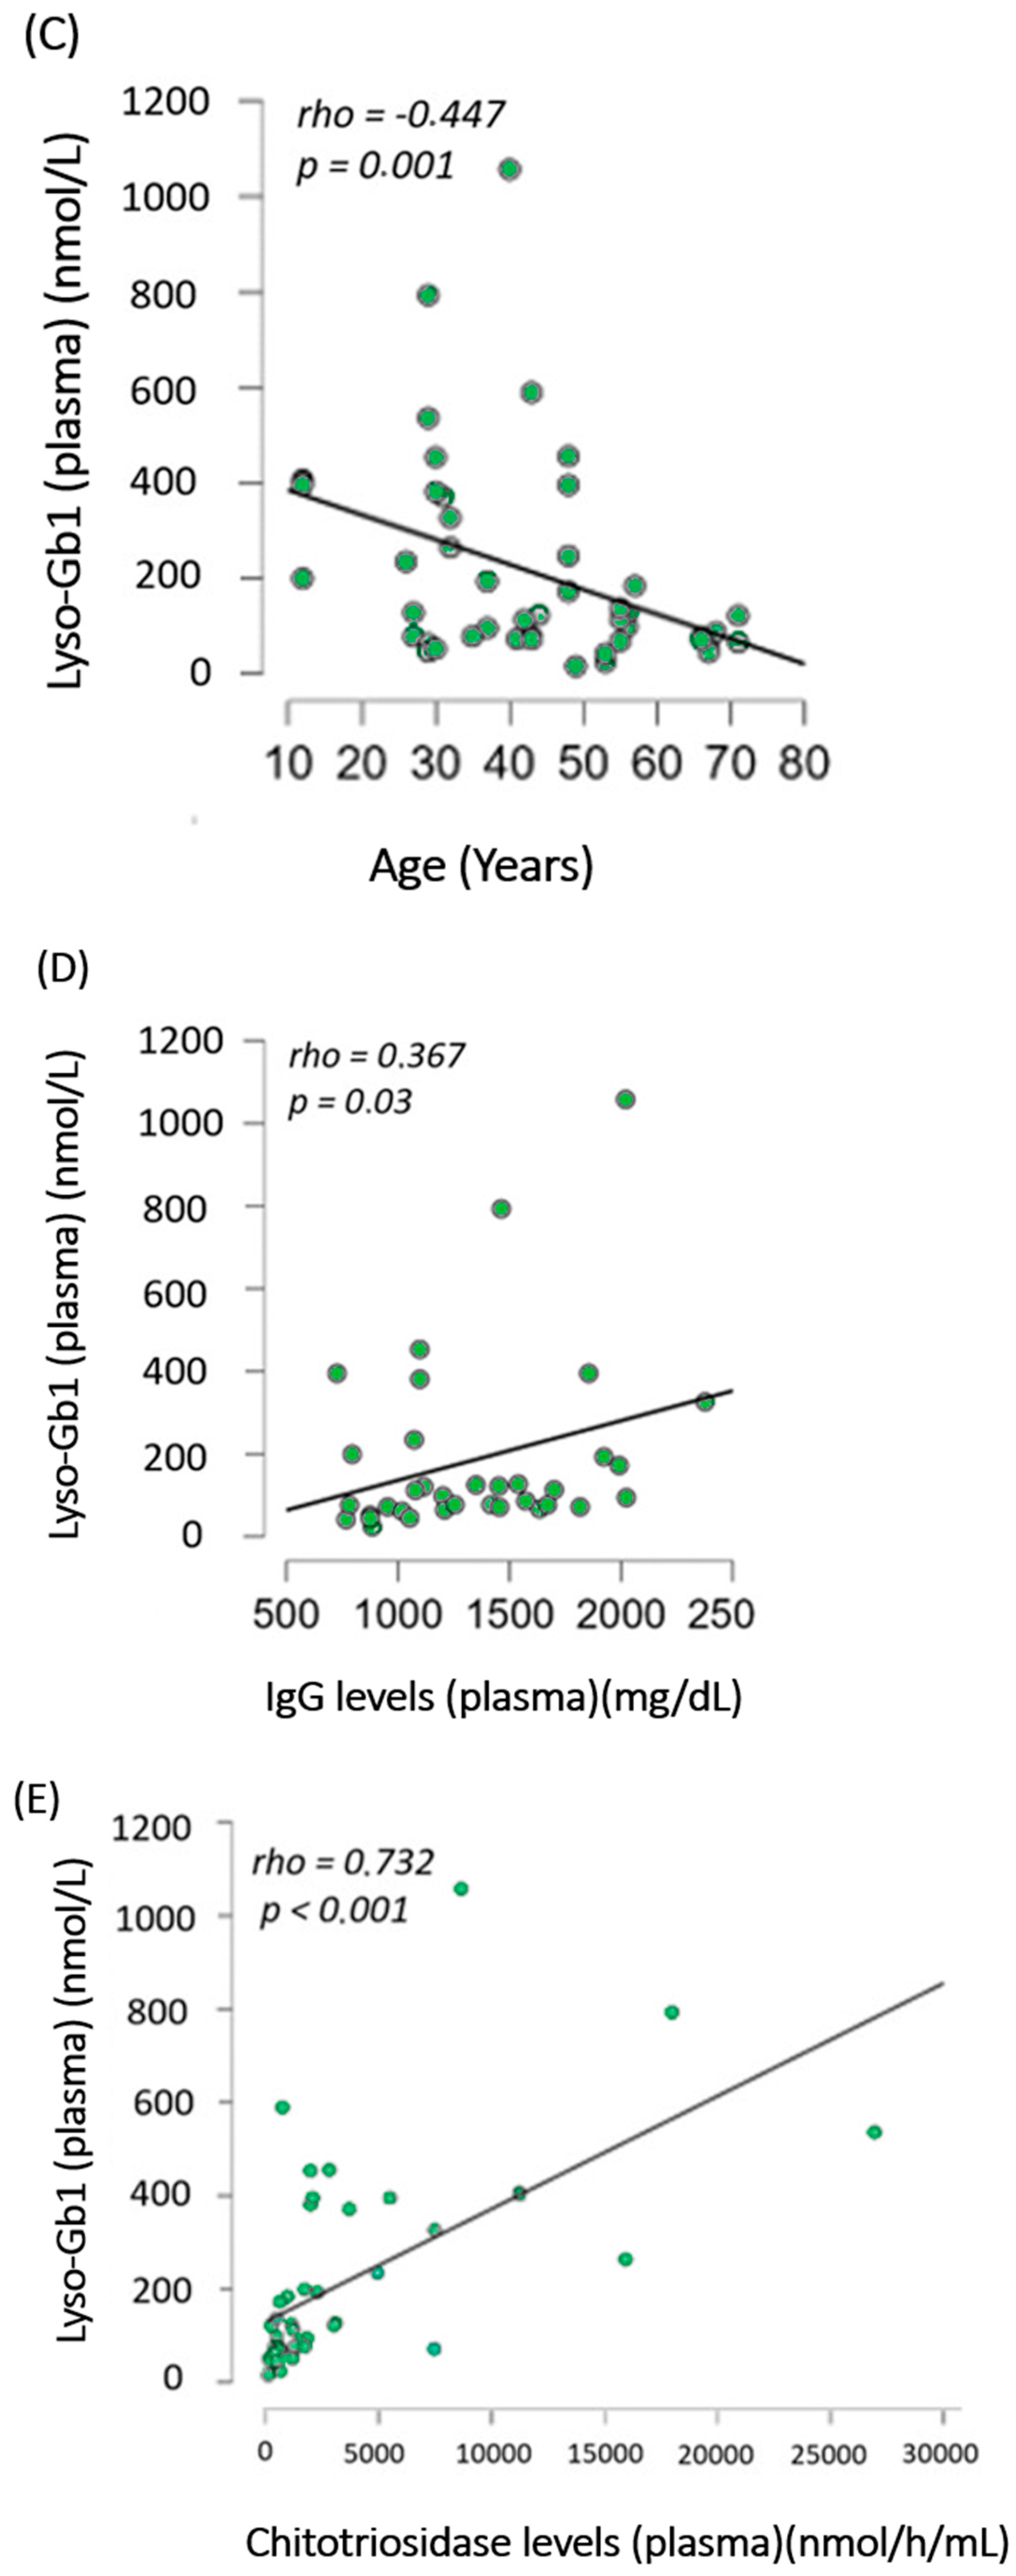
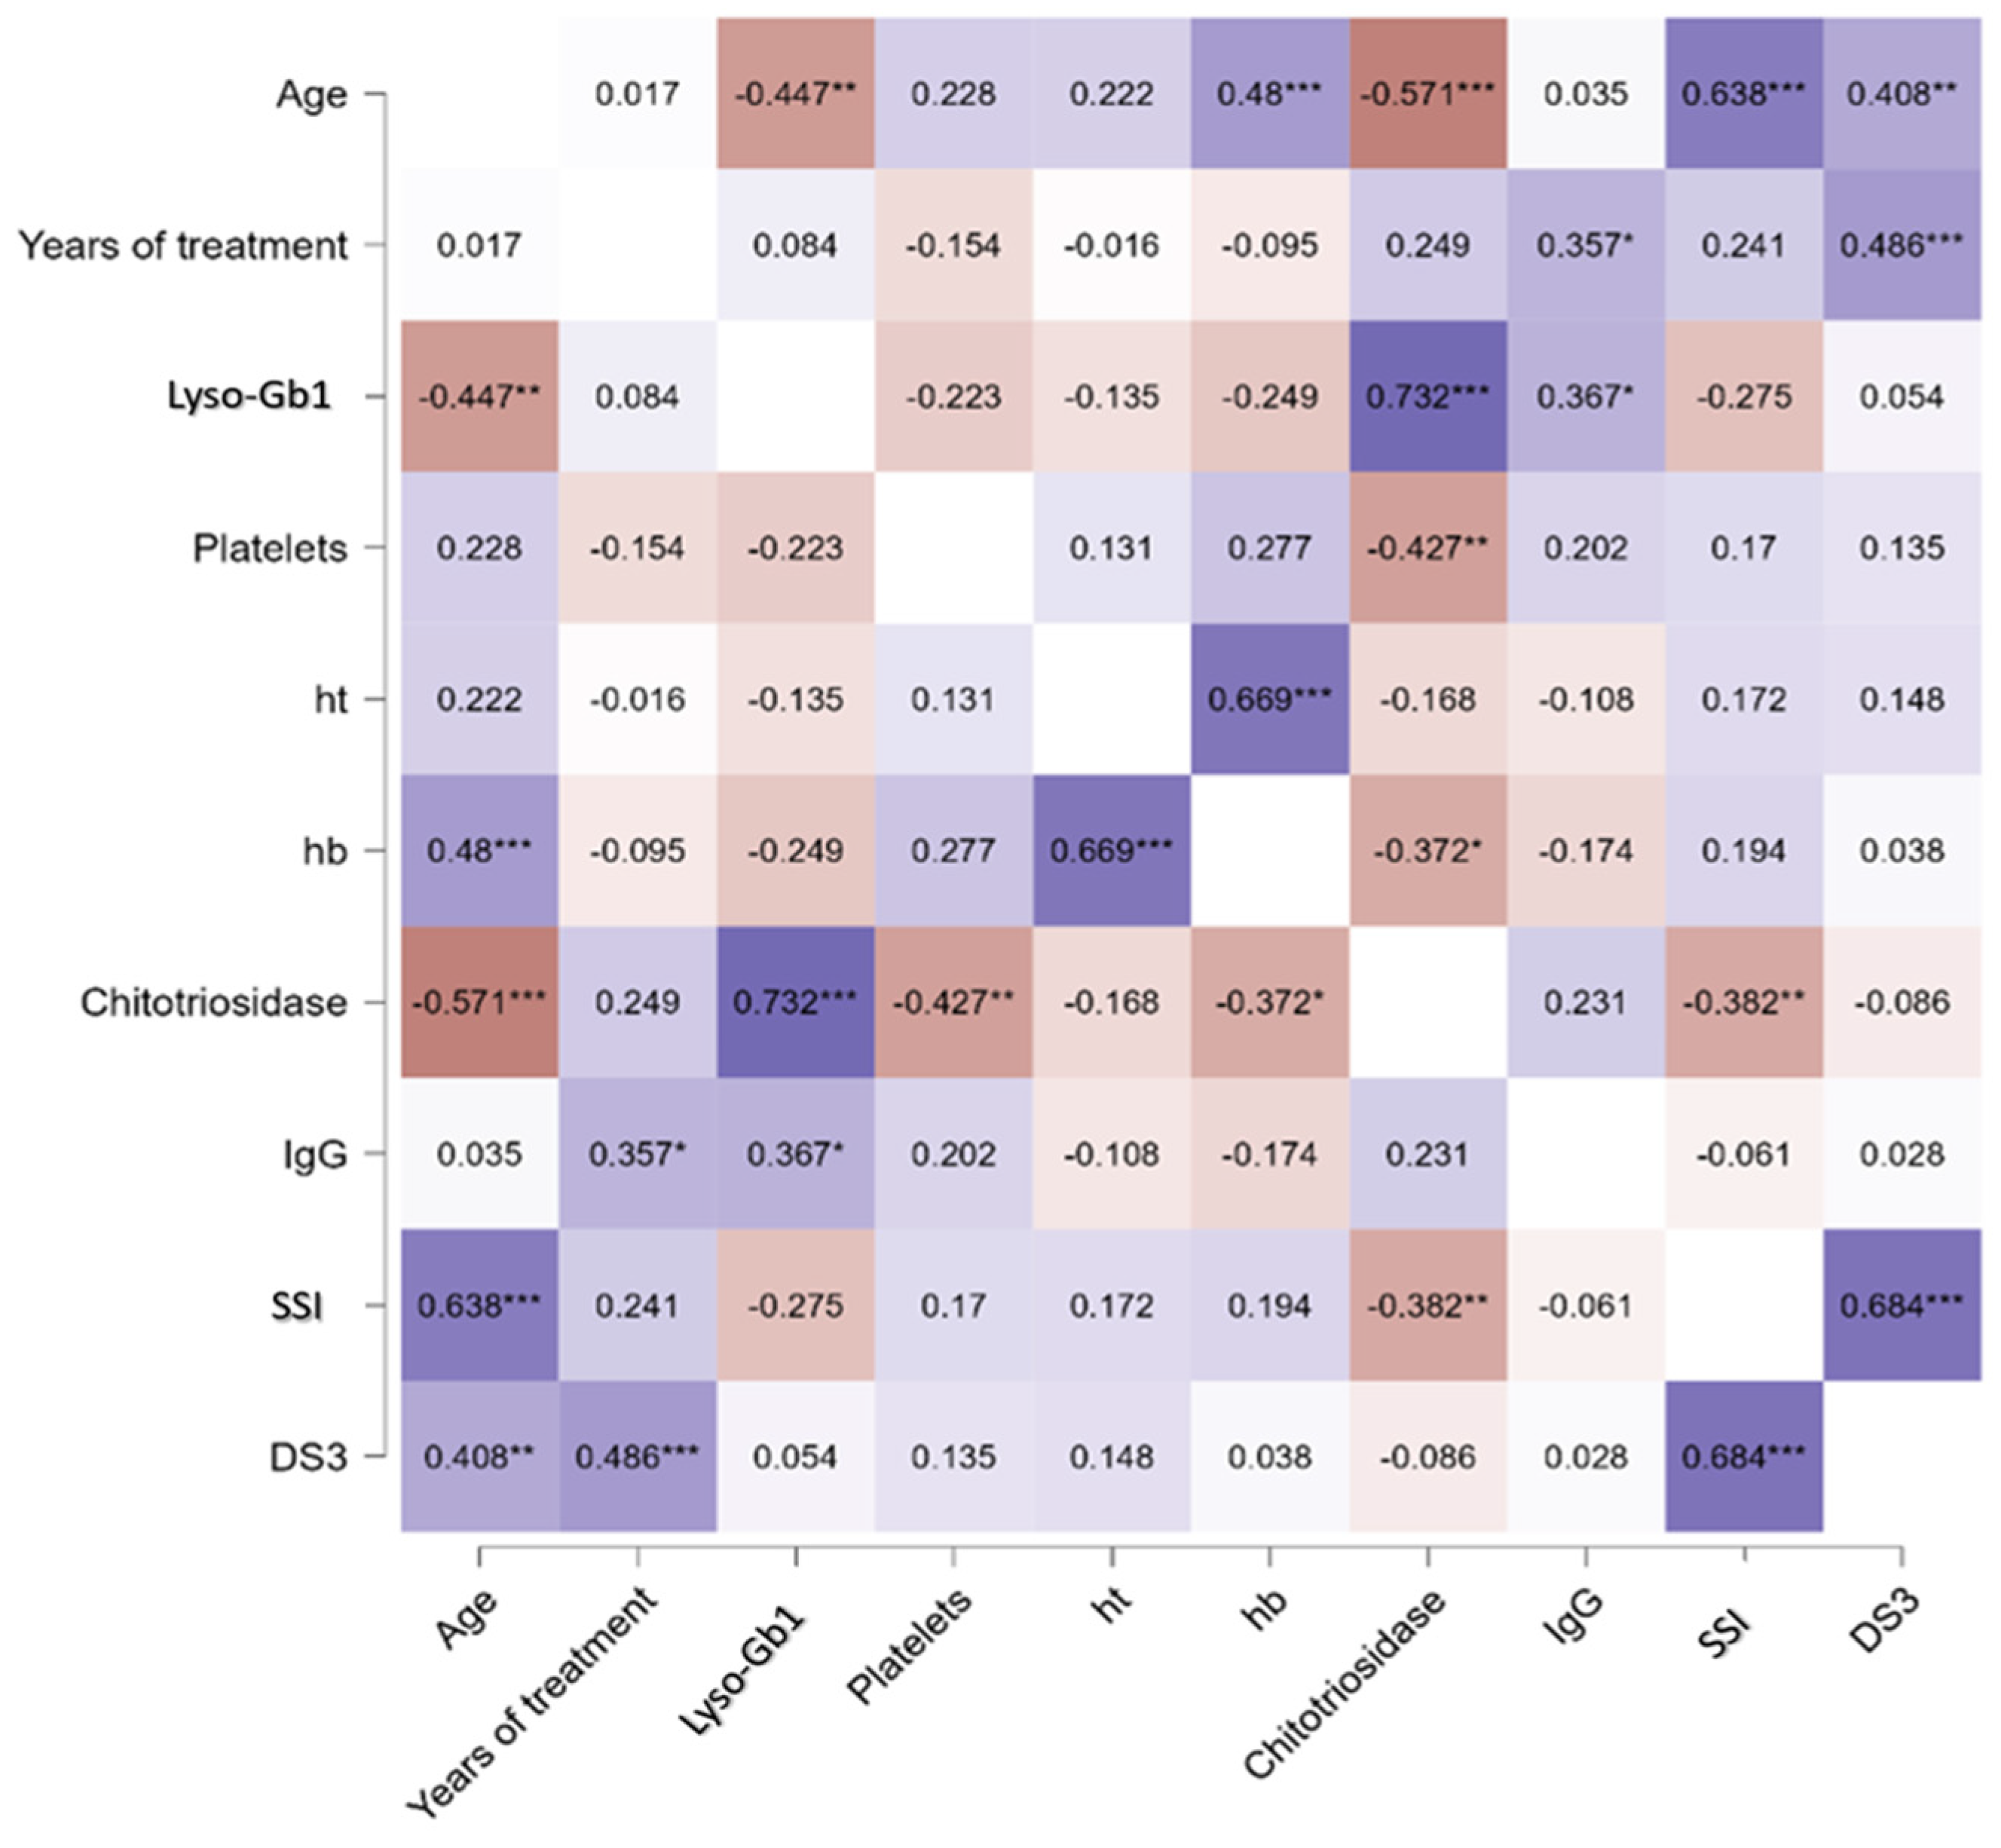
- Lyso-Gb1 levels correlated with IgG, age, and chitotriosidase in treated patients with Gaucher disease type 1
- (C)
- Lyso-Gb1 Levels in cerebrospinal fluid were higher in GD1 patients than in controls
- (D)
- Lyso-Gb1 levels followed the trend of chitotriosidase decrease after treatment in treatment-naïve patients with Gaucher disease
3. Discussion
4. Materials and Methods
4.1. Ethics
4.2. Lyso-Gb1 Quantification in Dried Blood Spots
4.3. Cerebrospinal Fluid Collection
4.4. Lyso-Gb1 Quantification in Cerebrospinal Fluid
4.5. Lysosomal Enzymes’ Activity in Cerebrospinal Fluid
4.6. Statistics
5. Conclusions
Supplementary Materials
Author Contributions
Funding
Institutional Review Board Statement
Informed Consent Statement
Data Availability Statement
Acknowledgments
Conflicts of Interest
Abbreviations
| α-syn | α-synuclein |
| α-man | α-mannosidase |
| β-glu | β-glucuronidase |
| β-hexo | β-hexosaminidase |
| ChT | chitotriosidase |
| CSF | cerebrospinal fluid |
| ERT | Enzyme-replacement therapy |
| GCase | β-glucocerebrosidase |
| GD | Gaucher disease |
| GD1 | Gaucher disease type 1 |
| GD2 | Gaucher disease type 2 |
| GD3 | Gaucher disease type 3 |
| LSD | Lysosomal Storage Disorders |
| Lyso-Gb1 | glucosylsphingosine |
| MLD | Metachromatic Leukodystrophy. |
| MPS | Mucopolysaccharidosis |
| NMS | Non-motor symptoms |
| PD | Parkinson’s disease |
| SRT | Substrate-reduction therapy |
References
- Revel-Vilk, S.; Fuller, M.; Zimran, A. Value of Glucosylsphingosine (Lyso-Gb1) as a Biomarker in Gaucher Disease: A Systematic Literature Review. Int. J. Mol. Sci. 2020, 21, 7159. [Google Scholar] [CrossRef]
- Pastores, G.M.; Hughes, D.A. Gaucher Disease. In GeneReviews®; Adam, M.P., Everman, D.B., Mirzaa, G.M., Pagon, R.A., Wallace, S.E., Bean, L.J., Gripp, K.W., Amemiya, A., Eds.; University of Washington: Seattle, DC, USA, 1993. Available online: http://www.ncbi.nlm.nih.gov/books/NBK1269/ (accessed on 17 September 2022).
- Wilke, M.V.M.B.; Poswar, F.; Borelli, W.V.; Tirelli, K.M.; Randon, D.N.; Lopes, F.F.; Pasetto, F.B.; Sebastião, F.M.; Iop, G.D.; Faqueti, L.; et al. Follow-up of pre-motor symptoms of Parkinson’s disease in adult patients with Gaucher disease type 1 and analysis of their lysosomal enzyme profiles in the CSF. Orphanet J. Rare Dis. 2023, 18, 309. [Google Scholar] [CrossRef]
- Wilke, M.V.M.B.; Dornelles, A.D.; Schuh, A.S.; Vairo, F.P.; Basgalupp, S.P.; Siebert, M.; Nalin, T.; Piltcher, O.B.; Schwartz, I.V.D. Evaluation of the frequency of non-motor symptoms of Parkinson’s disease in adult patients with Gaucher disease type 1. Orphanet J. Rare Dis. 2019, 14, 103. [Google Scholar] [CrossRef]
- Kim, E.N.; Do, H.S.; Jeong, H.; Kim, T.; Heo, S.H.; Kim, Y.; Cheon, C.K.; Lee, Y.; Choi, Y.; Choi, I.H.; et al. Identification of a novel therapeutic target underlying atypical manifestation of Gaucher disease. Clin. Transl. Med. 2022, 12, e862. [Google Scholar] [CrossRef]
- Stiles, A.R.; Huggins, E.; Fierro, L.; Jung, S.H.; Balwani, M.; Kishnani, P.S. The role of glucosylsphingosine as an early indicator of disease progression in early symptomatic type 1 Gaucher disease. Mol. Genet. Metab. Rep. 2021, 27, 100729. [Google Scholar] [CrossRef]
- Lukas, J.; Cozma, C.; Yang, F.; Kramp, G.; Meyer, A.; Neßlauer, A.-M.; Eichler, S.; Böttcher, T.; Witt, M.; Bräuer, A.U.; et al. Glucosylsphingosine Causes Hematological and Visceral Changes in Mice-Evidence for a Pathophysiological Role in Gaucher Disease. Int. J. Mol. Sci. 2017, 18, 2192. [Google Scholar] [CrossRef] [PubMed]
- Giraldo, P.; de Frutos, L.L.; Cebolla, J.J. Biomarker combination is necessary for the assessment of Gaucher disease? Ann. Transl. Med. 2018, 6 (Suppl. S1), S81. [Google Scholar] [CrossRef] [PubMed]
- Zimran, A.; Ruchlemer, R.; Revel-Vilk, S. A patient with Gaucher disease and plasma cell dyscrasia: Bidirectional impact. Hematol. Am. Soc. Hematol. Educ. Program 2020, 2020, 389–394. [Google Scholar] [CrossRef] [PubMed]
- Abell, K.; Chadwell, S.E.; Burrow, T.A.; Becker, A.P.P.; Bailey, L.; Steele, P.; Zhang, X.; Islas-Ohlmayer, M.; Bittencourt, R.; Schwartz, I.V.D.; et al. Outcomes of screening for gammopathies in children and adults with Gaucher disease type 1 in a cohort from Brazil and the United States. Am. J. Med. Genet. C Semin. Med. Genet. 2020, 184, 1052–1059. [Google Scholar] [CrossRef] [PubMed]
- Elstein, D.; Mellgard, B.; Dinh, Q.; Lan, L.; Qiu, Y.; Cozma, C.; Eichler, S.; Böttcher, T.; Zimran, A. Reductions in glucosylsphingosine (lyso-Gb1) in treatment-naïve and previously treated patients receiving velaglucerase alfa for type 1 Gaucher disease: Data from phase 3 clinical trials. Mol. Genet. Metab. 2017, 122, 113–120. [Google Scholar] [CrossRef] [PubMed]
- Murugesan, V.; Chuang, W.L.; Liu, J.; Lischuk, A.; Kacena, K.; Lin, H.; Pastores, G.M.; Yang, R.; Keutzer, J.; Zhang, K.; et al. Glucosylsphingosine is a key biomarker of Gaucher disease. Am. J. Hematol. 2016, 91, 1082–1089. [Google Scholar] [CrossRef] [PubMed]
- Rasmussen, C.A.; Quadri, A.; Vucko, E.; Kim, K.; Hickey, R.; Baker, J.J.; Charrow, J.; Prada, C.E. Treatment-naive and post-treatment glucosylsphingosine (lyso-GL1) levels in a cohort of pediatric patients with Gaucher disease. Mol. Genet. Metab. 2023, 141, 107736. [Google Scholar] [CrossRef]
- Rolfs, A.; Giese, A.K.; Grittner, U.; Mascher, D.; Elstein, D.; Zimran, A.; Böttcher, T.; Lukas, J.; Hübner, R.; Gölnitz, U.; et al. Glucosylsphingosine Is a Highly Sensitive and Specific Biomarker for Primary Diagnostic and Follow-Up Monitoring in Gaucher Disease in a Non-Jewish, Caucasian Cohort of Gaucher Disease Patients. PLoS ONE 2013, 8, e79732. [Google Scholar] [CrossRef] [PubMed]
- Hurvitz, N.; Dinur, T.; Becker-Cohen, M.; Cozma, C.; Hovakimyan, M.; Oppermann, S.; Demuth, L.; Rolfs, A.; Abramov, A.; Zimran, A.; et al. Glucosylsphingosine (lyso-Gb1) as a Biomarker for Monitoring Treated and Untreated Children with Gaucher Disease. Int. J. Mol. Sci. 2019, 20, 3033. [Google Scholar] [CrossRef]
- Gholamreza, B.; Ghasem, M.A. Hemophagocytic Lymphohistiocytosis Syndrome Associated with Gaucher Disease Type 2. Turk. J. Hematol. 2014, 31, 307–308. [Google Scholar] [CrossRef]
- Anderson, H.E.; Taylor, M.R.G. Consequences of treatment for hemophagocytic lymphohistiocytosis in a patient with undiagnosed Gaucher disease Type 1. Am. J. Med. Genet. A 2020, 182, 2988–2993. [Google Scholar] [CrossRef]
- Smith, L.; Schapira, A.H.V. GBA Variants and Parkinson Disease: Mechanisms and Treatments. Cells 2022, 11, 1261. [Google Scholar] [CrossRef] [PubMed]
- Narita, A.; Shirai, K.; Itamura, S.; Matsuda, A.; Ishihara, A.; Matsushita, K.; Fukuda, C.; Kubota, N.; Takayama, R.; Shigematsu, H.; et al. Ambroxol chaperone therapy for neuronopathic Gaucher disease: A pilot study. Ann. Clin. Transl. Neurol. 2016, 3, 200–215. [Google Scholar] [CrossRef]
- Nilsson, O.; Grabowski, G.A.; Ludman, M.D.; Desnick, R.J.; Svennerholm, L. Glycosphingolipid studies of visceral tissues and brain from type 1 Gaucher disease variants. Clin. Genet. 1985, 27, 443–450. [Google Scholar] [CrossRef]
- Taguchi, Y.V.; Liu, J.; Ruan, J.; Pacheco, J.; Zhang, X.; Abbasi, J.; Keutzer, J.; Mistry, P.K.; Chandra, S.S. Glucosylsphingosine Promotes α-Synuclein Pathology in Mutant GBA-Associated Parkinson’s Disease. J. Neurosci. Off. J. Soc. Neurosci. 2017, 37, 9617–9631. [Google Scholar] [CrossRef]
- Rocha, E.M.; Smith, G.A.; Park, E.; Cao, H.; Graham, A.-R.; Brown, E.; McLean, J.R.; Hayes, M.A.; Beagan, J.; Izen, S.C.; et al. Sustained Systemic Glucocerebrosidase Inhibition Induces Brain α-Synuclein Aggregation, Microglia and Complement C1q Activation in Mice. Antioxid. Redox Signal. 2015, 23, 550–564. [Google Scholar] [CrossRef] [PubMed]
- Mistry, P.K.; Taddei, T.; vom Dahl, S.; Rosenbloom, B.E. Gaucher disease and malignancy: A model for cancer pathogenesis in an inborn error of metabolism. Crit. Rev. Oncog. 2013, 18, 235–246. [Google Scholar] [CrossRef] [PubMed]
- Corre, J.; Munshi, N.; Avet-Loiseau, H. Genetics of multiple myeloma: Another heterogeneity level? Blood 2015, 125, 1870–1876. [Google Scholar] [CrossRef] [PubMed]
- Available online: http://antigo-conitec.saude.gov.br/images/Relatorios/2017/PCDT_Doen%C3%A7a_de_Gaucher_n278_2017.pdf (accessed on 24 July 2023).
- de Fost, M.; Out, T.A.; de Wilde, F.A.; Tjin, E.P.M.; Pals, S.T.; van Oers, M.H.J.; Boot, R.G.; Aerts, J.F.M.G.; Maas, M.; Dahl, S.V.; et al. Immunoglobulin and free light chain abnormalities in Gaucher disease type I: Data from an adult cohort of 63 patients and review of the literature. Ann. Hematol. 2008, 87, 439–449. [Google Scholar] [CrossRef] [PubMed]
- Nguyen, Y.; Stirnemann, J.; Lautredoux, F.; Cador, B.; Bengherbia, M.; Yousfi, K.; Hamroun, D.; Astudillo, L.; de Villemeur, T.B.; Brassier, A.; et al. Immunoglobulin Abnormalities in Gaucher Disease: An Analysis of 278 Patients Included in the French Gaucher Disease Registry. Int. J. Mol. Sci. 2020, 21, 1247. [Google Scholar] [CrossRef]
- Andrade-Campos, M.M.; de Frutos, L.L.; Cebolla, J.J.; Serrano-Gonzalo, I.; Medrano-Engay, B.; Roca-Espiau, M.; Gomez-Barrera, B.; Pérez-Heredia, J.; Iniguez, D.; Giraldo, P. Identification of risk features for complication in Gaucher’s disease patients: A machine learning analysis of the Spanish registry of Gaucher disease. Orphanet J. Rare Dis. 2020, 15, 256. [Google Scholar] [CrossRef]
- Nair, S.; Branagan, A.R.; Liu, J.; Boddupalli, C.S.; Mistry, P.K.; Dhodapkar, M.V. Clonal Immunoglobulin against Lysolipids in the Origin of Myeloma. N. Engl. J. Med. 2016, 374, 555–561. [Google Scholar] [CrossRef]
- Polo, G.; Burlina, A.P.; Ranieri, E.; Colucci, F.; Rubert, L.; Pascarella, A.; Duro, G.; Tummolo, A.; Padoan, A.; Plebani, M.; et al. Plasma and dried blood spot lysosphingolipids for the diagnosis of different sphingolipidoses: A comparative study. Clin. Chem. Lab. Med. CCLM 2019, 57, 1863–1874. [Google Scholar] [CrossRef] [PubMed]
- Hollak, C.E.; van Weely, S.; van Oers, M.H.; Aerts, J.M. Marked elevation of plasma chitotriosidase activity. A novel hallmark of Gaucher disease. J. Clin. Investig. 1994, 93, 1288–1292. [Google Scholar] [CrossRef] [PubMed]
- Sleiffer, D. Introducing JASP 0.16.3: Quality Control, GLMs, Bayesian State Space Models, Improvements to Bayesian ANOVA, and More. Available online: https://jasp-stats.org/2022/06/16/introducing-jasp-0-16-3-quality-control-glms-bayesian-state-space-models-improvements-to-bayesian-anova-and-more/ (accessed on 22 February 2024).

| Patient | Gaucher Type | Gender | Age (Years) | Genotype (NM_000157.3) | Treatment Duration (Years) | Current Treatment | Adherence to Treatment * | Severity Scores | Platelet (/mcL) | Hb (g/dL) | Lyso-Gb1 DBS (ng/mL) | ChT Plasma (nmol/h/mL) | IgG Plasma (mg/dL) | |
|---|---|---|---|---|---|---|---|---|---|---|---|---|---|---|
| SSI | DS3 | |||||||||||||
| 1 | I | F | 12 | [c.(1226A>G)];[c. (721G>A)] [p.(Asn409Ser)]; [p.(Gly241Arg)] | 4 | ERT | Y | 0 | 0 | 266,000 | 13.8 | 199 | 1724 | 795 |
| 2 | I | M | 26 | [c.(1226A>G)];[c. (721G>A)] [p.(Asn409Ser)]; [p.(Gly241Arg)] | 18 | ERT | Y | 0 | 0.66 | 171,000 | 14.9 | 234.1 | 4951 | 1073 |
| 3 | I | F | 27 | [c.(1226A>G)];(RecNciI) [p. (Asn409Ser)];(RecNciI) | 19 | ERT | N | 0 | 0.16 | 239,000 | 12.5 | 76.7 | 400 | 1670 |
| 4 | I | F | 27 | [c.(1226A>G)];[c. (1448T>C)] [p. (Asn409Ser)];[p. (Leu483Pro)] | 6 | ERT | Y | 1 | 0 | 225,000 | 12.5 | 127 | 3095 | 1539 |
| 5 | I | F | 29 | [c.(1226A>G)];[c. (1448T>C)] [p. (Asn409Ser)];[p. (Leu483Pro)] | 13 | ERT | Y | 1 | 0 | 166,000 | 11.5 | 61.6 | 425 | 1018 |
| 6 | I | F | 29 | [c.(1226A>G)];[c.(1226A>)] [p.(Asn409Ser)];[p.(Asn409Ser)] | 20 | ERT | N | 1 | 3.75 | 154,000 | 12.2 | 793 | 17,979 | 1463 |
| 7 | I | M | 30 | [c.(1226A>G)];[c c.1388+1G>A)] [p.(Asn409Ser)];[p. ?] | 19 | ERT | Y | 3 | 1.2 | 149,000 | 15.4 | 453 | 1988 | 1018 |
| 8 | I | M | 32 | [c.(1226A>G)];[c.(1448T>G)] [p.(Asn409Ser)];[p.(Leu483Arg)] | 27 | ERT | NA | 1 | 2.5 | 157,000 | 13.3 | 263.4 | 15,917 | 1463 |
| 9 | I | F | 32 | [c.(1226A>G)];(RecNciI) [p. (Asn409Ser)];(RecNciI) | 22 | SRT | Y | 0 | 2.5 | 146,000 | 11.6 | 371 | 3699 | 1098 |
| 10 | I | M | 35 | [c.(1226A>G)];(RecNciI) [p. (Asn409Ser)];(RecNciI) | 21 | ERT | Y | 3 | 1 | 212,000 | 16.1 | 77 | 1243 | NA |
| 11 | I | F | 37 | [c.(1226A>G)];[c. (1448T>C)] [p. (Asn409Ser)];[p. (Leu483Pro)] | 19 | ERT | Y | 0 | 0 | 182,000 | 13.3 | 192.7 | 2306 | NA |
| 12 | I | F | 40 | [c.(1226A>G)];(RecNciI) [p. (Asn409Ser)];(RecNciI) | 27 | ERT | N | NA | NA | 141,000 | NA | 1057.7 | 8657 | 1255 |
| 13 | I | F | 41 | [c.(1226A>G)];[c. (1448T>C)] [p. (Asn409Ser)];[p. (Leu483Pro)] | 13 | ERT | N | 9 | 2.9 | 148,000 | 10.7 | 71.6 | 7464 | 1923 |
| 14 | I | M | 42 | [c.(1226A>G)];[c. (1448T>C)] [p. (Asn409Ser)];[p. (Leu483Pro)] | 11 | ERT | Y | 0 | 0 | 142,000 | 14.4 | 112 | 1194 | 2020 |
| 15 | I | F | 43 | [c.(1226A>G)];(RecNciI) [p. (Asn409Ser)];(RecNciI) | 7 | ERT | Y | 2 | 1 | 221,000 | 13 | 589 | 736 | 954 |
| 16 | I | F | 44 | [c.(1226A>G)];[c. (1448T>C)] [p. (Asn409Ser)];[p. (Leu483Pro)] | 14 | ERT | Y | 1 | 0.7 | 171,000 | 15 | 122 | 3022 | 1078 |
| 17 | I | F | 48 | [c.(1226A>G)];[c.(1226A>G)] [p.(Asn409Ser)];[p.(Asn409Ser)] | 1 | ERT | NA | NA | NA | NA | NA | 246 | NA | NA |
| 18 | I | M | 49 | [c.(1226A>G)];[c. (1448T>C)] [p. (Asn409Ser)];[p. (Leu483Pro)] | 10 | ERT | Y | 5 | 0.4 | 199,000 | 14.4 | 15 | 116 | NA |
| 19 | I | F | 53 | [c.(1162G>A)];[c.(1214G>A)] [p.(Glu388Lys)];[p.(Ser405Asn)] | 10 | ERT | Y | 3 | 1.8 | 285,000 | 14.7 | 23.57 | 643 | 885 |
| 20 | I | F | 55 | [c.(1226A>G)];(RecNciI) [p. (Asn409Ser)];(RecNciI) | 20 | ERT | Y | 5.7 | 13 | 405,000 | 14.7 | 113 | 1216 | 1700 |
| 21 | I | F | 56 | [c.(1162G>A)];[c.(1214G>A)] [p.(Glu388Lys)];[p.(Ser405Asn)] | 8 | ERT | Y | 4 | 0.4 | 248,000 | 13,4 | 98 | 492 | 1202 |
| 22 | I | M | 57 | [c.(1226A>G)];(RecNciI)] [p. (Asn409Ser)];(RecNciI)] | 11 | ERT | Y | 2 | 0.5 | 141,000 | 14.9 | 183.5 | 965 | NA |
| 23 | I | M | 61 | [c.(1226A>G)];(RecNciI)] [p. (Asn409Ser)];(RecNciI)] | 10 | ERT | Y | 3 | 0 | 160,000 | 16.1 | 64.56 | 1170 | 1209 |
| 24 | I | F | 66 | [c.(1226A>G)];(RecNciI)] [p. (Asn409Ser)];(RecNciI)] | 24 | ERT | Y | 23 ¥ | 1 | 127,000 | 12.8 | 76 | 1741 | 783 |
| 25 | I | F | 67 | [c.(1226A>G)];(RecNciI)] [p. (Asn409Ser)];(RecNciI)] | 10 | ERT | Y | 4 | 4.5 | 143,000 | 14.8 | 52 | 146 | 876 |
| 26 | I | M | 67 | [c.(1226A>G)];(RecNciI)] [p. (Asn409Ser)];(RecNciI)] | 14 | ERT | Y | 8 | 2.1 | 213,000 | 14.5 | 71.58 | 401 | 1816 |
| 27 | I | M | 68 | [c.(1226A>G)];[c.(1226A>G)] [p.(Asn409Ser)];[p.(Asn409Ser)] | 12 | ERT | Y | 0 | 0.5 | 160,000 | 14.2 | 85.86 | 1529 | 1573 |
| 28 | I | F | 71 | [c.(1226A>G)];[c.(1448T>G)] [p.(Asn409Ser)];[p.(Leu483Arg)] | 11 | ERT | Y | 10 | 4.5 | 309,000 | 13.9 | 120.57 | 257 | 1116 |
| 29 | III | M | 25 | [c. (1448T>C)]; [c. (1448T>C)] [p. (Leu483Pro)];[ p. (Leu483Pro)] | 23 | ERT | Y | 20 ¥ | 0 | 184,000 | 15.7 | 837 | 4365 | 1561 |
| 30 | III | M | 30 | [c. (1448T>C)]; [c. (1448T>C)] [p. (Leu483Pro)];[ p. (Leu483Pro)] | 16 | ERT | Y | NA | 19.5 | 586,000 | 12.5 | 802 | 11,801 | NA |
| 31 | III | F | 33 | [c. (1448T>C)]; [c. (1448T>C)] [p. (Leu483Pro)];[ p. (Leu483Pro)] | 18 | ERT | Y | 25 ¥ | 0.6 | 401,000 | 12.4 | 689 | 12,560 | 1458 |
| Patient | Lyso-Gb1 (pmol/L) | Cht (nmol/h/mL) | β-hexo A (nmol/h/mL) | β-hexo B (nmol/h/mL) | Total β-hexo (nmol/h/mL) | % β-hexo A | β-glu (nmol/h/mL) | α-man (nmol/h/mL) | NMD (n) |
|---|---|---|---|---|---|---|---|---|---|
| 7 | 109.04 | 102 | 104 | 3 | 107 | 97 | 3.3 | 2.2 | 2 |
| 10 | 83.49 | 97 | 81 | 107 | 188 | 43 | 5.5 | 0.8 | 1 |
| 13 | 57.13 | 19 | 105 | 15 | 120 | 88 | 7 | 0.9 | 2 |
| 16 | 154.87 | 81 | 190 | 59 | 249 | 76 | 8.5 | 4.7 | 0 |
| 19 | 66.43 | 17 | 36 | 28 | 65 | 56 | 5 | 0.25 | 3 |
Disclaimer/Publisher’s Note: The statements, opinions and data contained in all publications are solely those of the individual author(s) and contributor(s) and not of MDPI and/or the editor(s). MDPI and/or the editor(s) disclaim responsibility for any injury to people or property resulting from any ideas, methods, instructions or products referred to in the content. |
© 2024 by the authors. Licensee MDPI, Basel, Switzerland. This article is an open access article distributed under the terms and conditions of the Creative Commons Attribution (CC BY) license (https://creativecommons.org/licenses/by/4.0/).
Share and Cite
Vernet Machado Bressan Wilke, M.; Iop, G.D.; Faqueti, L.; Lemos da Silva, L.A.; Kubaski, F.; Poswar, F.O.; Michelin-Tirelli, K.; Randon, D.; Borelli, W.V.; Giugliani, R.; et al. A Brazilian Rare-Disease Center’s Experience with Glucosylsphingosine (lyso-Gb1) in Patients with Gaucher Disease: Exploring a Novel Correlation with IgG Levels in Plasma and a Biomarker Measurement in CSF. Int. J. Mol. Sci. 2024, 25, 2870. https://doi.org/10.3390/ijms25052870
Vernet Machado Bressan Wilke M, Iop GD, Faqueti L, Lemos da Silva LA, Kubaski F, Poswar FO, Michelin-Tirelli K, Randon D, Borelli WV, Giugliani R, et al. A Brazilian Rare-Disease Center’s Experience with Glucosylsphingosine (lyso-Gb1) in Patients with Gaucher Disease: Exploring a Novel Correlation with IgG Levels in Plasma and a Biomarker Measurement in CSF. International Journal of Molecular Sciences. 2024; 25(5):2870. https://doi.org/10.3390/ijms25052870
Chicago/Turabian StyleVernet Machado Bressan Wilke, Matheus, Gabrielle Dineck Iop, Larissa Faqueti, Layzon Antonio Lemos da Silva, Francyne Kubaski, Fabiano O. Poswar, Kristiane Michelin-Tirelli, Dévora Randon, Wyllians Vendramini Borelli, Roberto Giugliani, and et al. 2024. "A Brazilian Rare-Disease Center’s Experience with Glucosylsphingosine (lyso-Gb1) in Patients with Gaucher Disease: Exploring a Novel Correlation with IgG Levels in Plasma and a Biomarker Measurement in CSF" International Journal of Molecular Sciences 25, no. 5: 2870. https://doi.org/10.3390/ijms25052870
APA StyleVernet Machado Bressan Wilke, M., Iop, G. D., Faqueti, L., Lemos da Silva, L. A., Kubaski, F., Poswar, F. O., Michelin-Tirelli, K., Randon, D., Borelli, W. V., Giugliani, R., & Schwartz, I. V. D. (2024). A Brazilian Rare-Disease Center’s Experience with Glucosylsphingosine (lyso-Gb1) in Patients with Gaucher Disease: Exploring a Novel Correlation with IgG Levels in Plasma and a Biomarker Measurement in CSF. International Journal of Molecular Sciences, 25(5), 2870. https://doi.org/10.3390/ijms25052870