Article

Genome-Wide Identification and Characterization of Tomato Fatty Acid β-Oxidase Family Genes KAT and MFP

College of Horticulture, Gansu Agricultural University, Yinmen Village, Anning District, Lanzhou 730070, China
*
Author to whom correspondence should be addressed.
Int. J. Mol. Sci. 2024, 25(4), 2273; https://doi.org/10.3390/ijms25042273
Submission received: 13 January 2024 / Revised: 8 February 2024 / Accepted: 12 February 2024 / Published: 14 February 2024

Abstract

:
Fatty acids and their derivatives play a variety of roles in living organisms. Fatty acids not only store energy but also comprise membrane lipids and act as signaling molecules. There are three main proteins involved in the fatty acid β-oxidation pathway in plant peroxisomes, including acyl-CoA oxidase (ACX), multifunctional protein (MFP), and 3-ketolipoyl-CoA thiolase (KAT). However, genome-scale analysis of KAT and MFP has not been systemically investigated in tomatoes. Here, we conducted a bioinformatics analysis of KAT and MFP genes in tomatoes. Their physicochemical properties, protein secondary structure, subcellular localization, gene structure, phylogeny, and collinearity were also analyzed. In addition, a conserved motif analysis, an evolutionary pressure selection analysis, a cis-acting element analysis, tissue expression profiling, and a qRT-PCR analysis were conducted within tomato KAT and MFP family members. There are five KAT and four MFP family members in tomatoes, which are randomly distributed on four chromosomes. By analyzing the conserved motifs of tomato KAT and MFP family members, we found that both KAT and MFP members are highly conserved. In addition, the results of the evolutionary pressure selection analysis indicate that the KAT and MFP family members have evolved mainly from purifying selection, which makes them more structurally stable. The results of the cis-acting element analysis show that SlKAT and SlMFP with respect may respond to light, hormones, and adversity stresses. The tissue expression analysis showed that KAT and MFP family members have important roles in regulating the development of floral organs as well as fruit ripening. The qRT-PCR analysis revealed that the expressions of SlKAT and SlMFP genes can be regulated by ABA, MeJA, darkness, NaCl, PEG, UV, cold, heat, and H2O2 treatments. These results provide a basis for the involvement of the SlKAT and SlMFP genes in tomato floral organ development and abiotic stress response, which lay a foundation for future functional study of SlKAT and SlMFP in tomatoes.

1. Introduction

Peroxisomes are multifunctional organelles essential for eukaryotic development and growth and are highly dynamic in both morphology and metabolism [1,2]. The plant peroxisome has a variety of physiological roles, including phytohormone biosynthesis, lipolytic metabolism, and reactive oxygen species metabolism, which are essential for plant development [1,3,4,5]. Fatty acid, which is composed of carbon, hydrogen, and oxygen elements, is ubiquitous in plants, animals, and microorganisms. The catabolism of fatty acids takes place in organisms mainly through the β-oxidation pathway, which, in plants and fungal species, occurs exclusively in peroxisomes [1,6,7,8]. β-oxidation sustains plant growth by degrading fatty acids to acetyl-CoA, which is further metabolized through the glyoxylate cycle [9]. The energy released during these processes can support plant growth activities before the cotyledons turn green to conduct photosynthesis [9]. In addition, fatty acid β-oxidation affects jasmonic acid (JA) synthesis from the precursor linolenic acid [10]. Furthermore, fatty acid β-oxidation also has important roles in the remobilization of reserved energy in the survival of senescence and extended periods of darkness.
The central steps of the fatty acid β-oxidation pathway in the peroxisomes of plants are accomplished by acyl coenzyme oxidase (ACX), multifunctional protein (MFP), and 3-ketoacyl coenzyme a thiolase (KAT) [10]. ACX family members may specifically recognize distinct chain lengths of fatty acids and catalyze the first step of peroxisomal fatty acid β-oxidation to converse fatty acyl-CoAs to trans-2-enoyl CoAs [7,11]. This step is thought to be critical in controlling the rate of carbon flux in the β-oxidation pathway [12]. In addition, different ACX isozymes can target distinct lengths of substrates to promote the efficient utilization of various fatty acids, including long-chain (C14:0 to C20:0), medium-chain (C8:0 to C14:0), short-chain (C4:0 to C8:0), and very-long-chain (C22:0 to C26:0) fatty acids [13]. This diversity plays a role in plant adaptation to different environmental conditions and response to changes in lipid supply. MFP proteins conduct four kinds of enzyme activities, such as 2-transenoyl-CoA hydratase, L-3-hydroxyacyl-CoA dehydrogenase, D-3-hydroxyacyl-CoA epimerase, and Δ3, Δ2-enoyl-CoA isomerase [12]. Moreover, the activities of 2-trans-enoyl-CoA hydratase and L-3-hydroxyacetyl-CoA dehydrogenase are core steps required for the catabolism of all fatty acids [14,15]. KAT members catalyze the final step of fatty acid β-oxidation. As a kind of thiolase, KAT cleaves acetyl-CoA from the fatty acyl chain, resulting in the formation of a new fatty acyl-CoA two carbons shorter than the original substrate [16].
In plants, many MFP and KAT family members have been found. In A. thaliana, there are two MFP genes involved in β-oxidation, namely, AIM1 and AtMFP2 [15]. The corresponding MFP proteins exhibit both 2-trans-enoyl-coenzyme hydratase and L-3-hydroxyacyl-coenzyme dehydrogenase activities [14]. Among them, AIM1 favors short-chain substrates, while the hydratase activity of AtMFP2 favors longer-chain fatty acids. Previous studies also found an MFP gene in cucumber, and the function of the corresponding protein is unknown [14]. In fungi, there also exist MFP proteins. As a rice blast fungus, Magnaporthe grisea MFP1 (MG06148.4) protein is located in peroxisome-like bodies. M. grisea MFP1 is required for lipid utilization and fungal virulence. Mutants lacking MFP1 are unable to use lipids or fatty acids as their sole carbon source, resulting in reduced virulence in plants [17]. In addition, MFP1 is also required for the formation of fully functional adherents, which further affects the appressorium function of the rice blast fungus during the infection of plants. As for KAT, there are three genes encoding KAT in A. thaliana, including AtKAT1, AtKAT2, and AtKAT5 [18]. AtKAT2 is located on chromosome 2 of A. thaliana, which encodes a peroxisomal thiolase and mediates seedling morphogenesis during early seedling growth [12,19]. Additionally, AtKAT2 is an important component of timely senescence in leaves and is responsible for JA biosynthesis in A. thaliana [6,20]. Furthermore, AtKAT2-derived β-oxidase influences ABA singalongs and ABA-induced ROS generation [1]. AtKAT5 takes part in producing peroxisomal proteins and cell membrane proteins by alternating transcriptional levels of the related genes [18]. Moreover, AtKAT5 plays a vital role in flower and seed predevelopment. AtKAT1 is produced through the replication of AtKAT2 [18], and the function of AtKAT1 as the fatty acid β-oxidation regulator is largely unknown. However, there exist rare studies concerning the members of MFP and KAT in other plants.
The tomato is an important staple and economic crop worldwide, which is also a vital experimental model plant. KAT- and MFP-derived fatty acid β-oxidation has an important role in plant biosynthesis, but their family members have not been well studied in tomatoes. To better understand the role of the KAT and MFP family genes in tomatoes, we performed secondary structure analysis, conserved motifs, cis-acting elements, specific expression in different tissues, evolutionary pressure selection, and covariance analysis. Meanwhile, the expression patterns of KAT and MFP family members in tomatoes under different treatments of plant hormones and abiotic stresses were investigated. Our study will extend the molecular biological functions of the KAT and MFP families in plants and suggest potential roles for KAT and MFP family members’ abiotic stress and phytohormone responses.

2. Results

2.1. Genome-Wide Identification of SlKAT and SlMFP Genes in Tomatoes

In our study, five tomato KAT genes and four tomato MFP genes were obtained after homologous matching, which were named SlKAT1-SlKAT5 and SlMFP1-SlMFP4 based on the location of the genes on different chromosomes (Table 1).
Amino acid lengths of tomato KAT proteins range between 39,128.82 (SlKAT2) and 50,588.34 (SlKAT4) Da. The amino acid size of the tomato MFP transcription factor family is between 606 aa (SlMFP1) and 723 aa (SlMFP2). The molecular weight is between 67,336.01 (SlMFP1) and 77,793.88 (SlMFP4) Da. By predicting the physicochemical properties, we found that SlKAT1, SlKAT4, and SlKAT5 are basic proteins (PI > 7), and SlKAT2 and SlKAT3 are acidic proteins (PI < 7). In addition, only the GRAVY index of SlKAT5 is below 0 (−0.023). Thus, SlKAT5 is a hydrophilic protein, and the other KAT proteins are hydrophobic. In the MFP family, all the members are basic proteins except for SlMFP3. Moreover, all the MFP family proteins are hydrophobic proteins (Table 1).

2.2. Analysis of Conserved Motifs and Gene Structure of the SlKAT and SlMFP Family Genes in Tomatoes

It can be seen from Figure 1 that different members of the KAT and MFP family genes have different numbers of exons and introns. In the family of KAT genes, there are 12 exons and 14 introns in SlKAT1 and 13 exons and 15 introns in SlKAT2. As for SlKAT3, SlKAT4, and SlKAT5, there exist 14 exons and 13 introns. In the family of MFP genes, there are 13 exons and 16 introns in SlMFP1, 17 exons and 18 introns in SlMFP2, 17 exons and 17 introns in SlMFP3, and 18 exons and 17 introns in SlMFP4 (Figure 1).
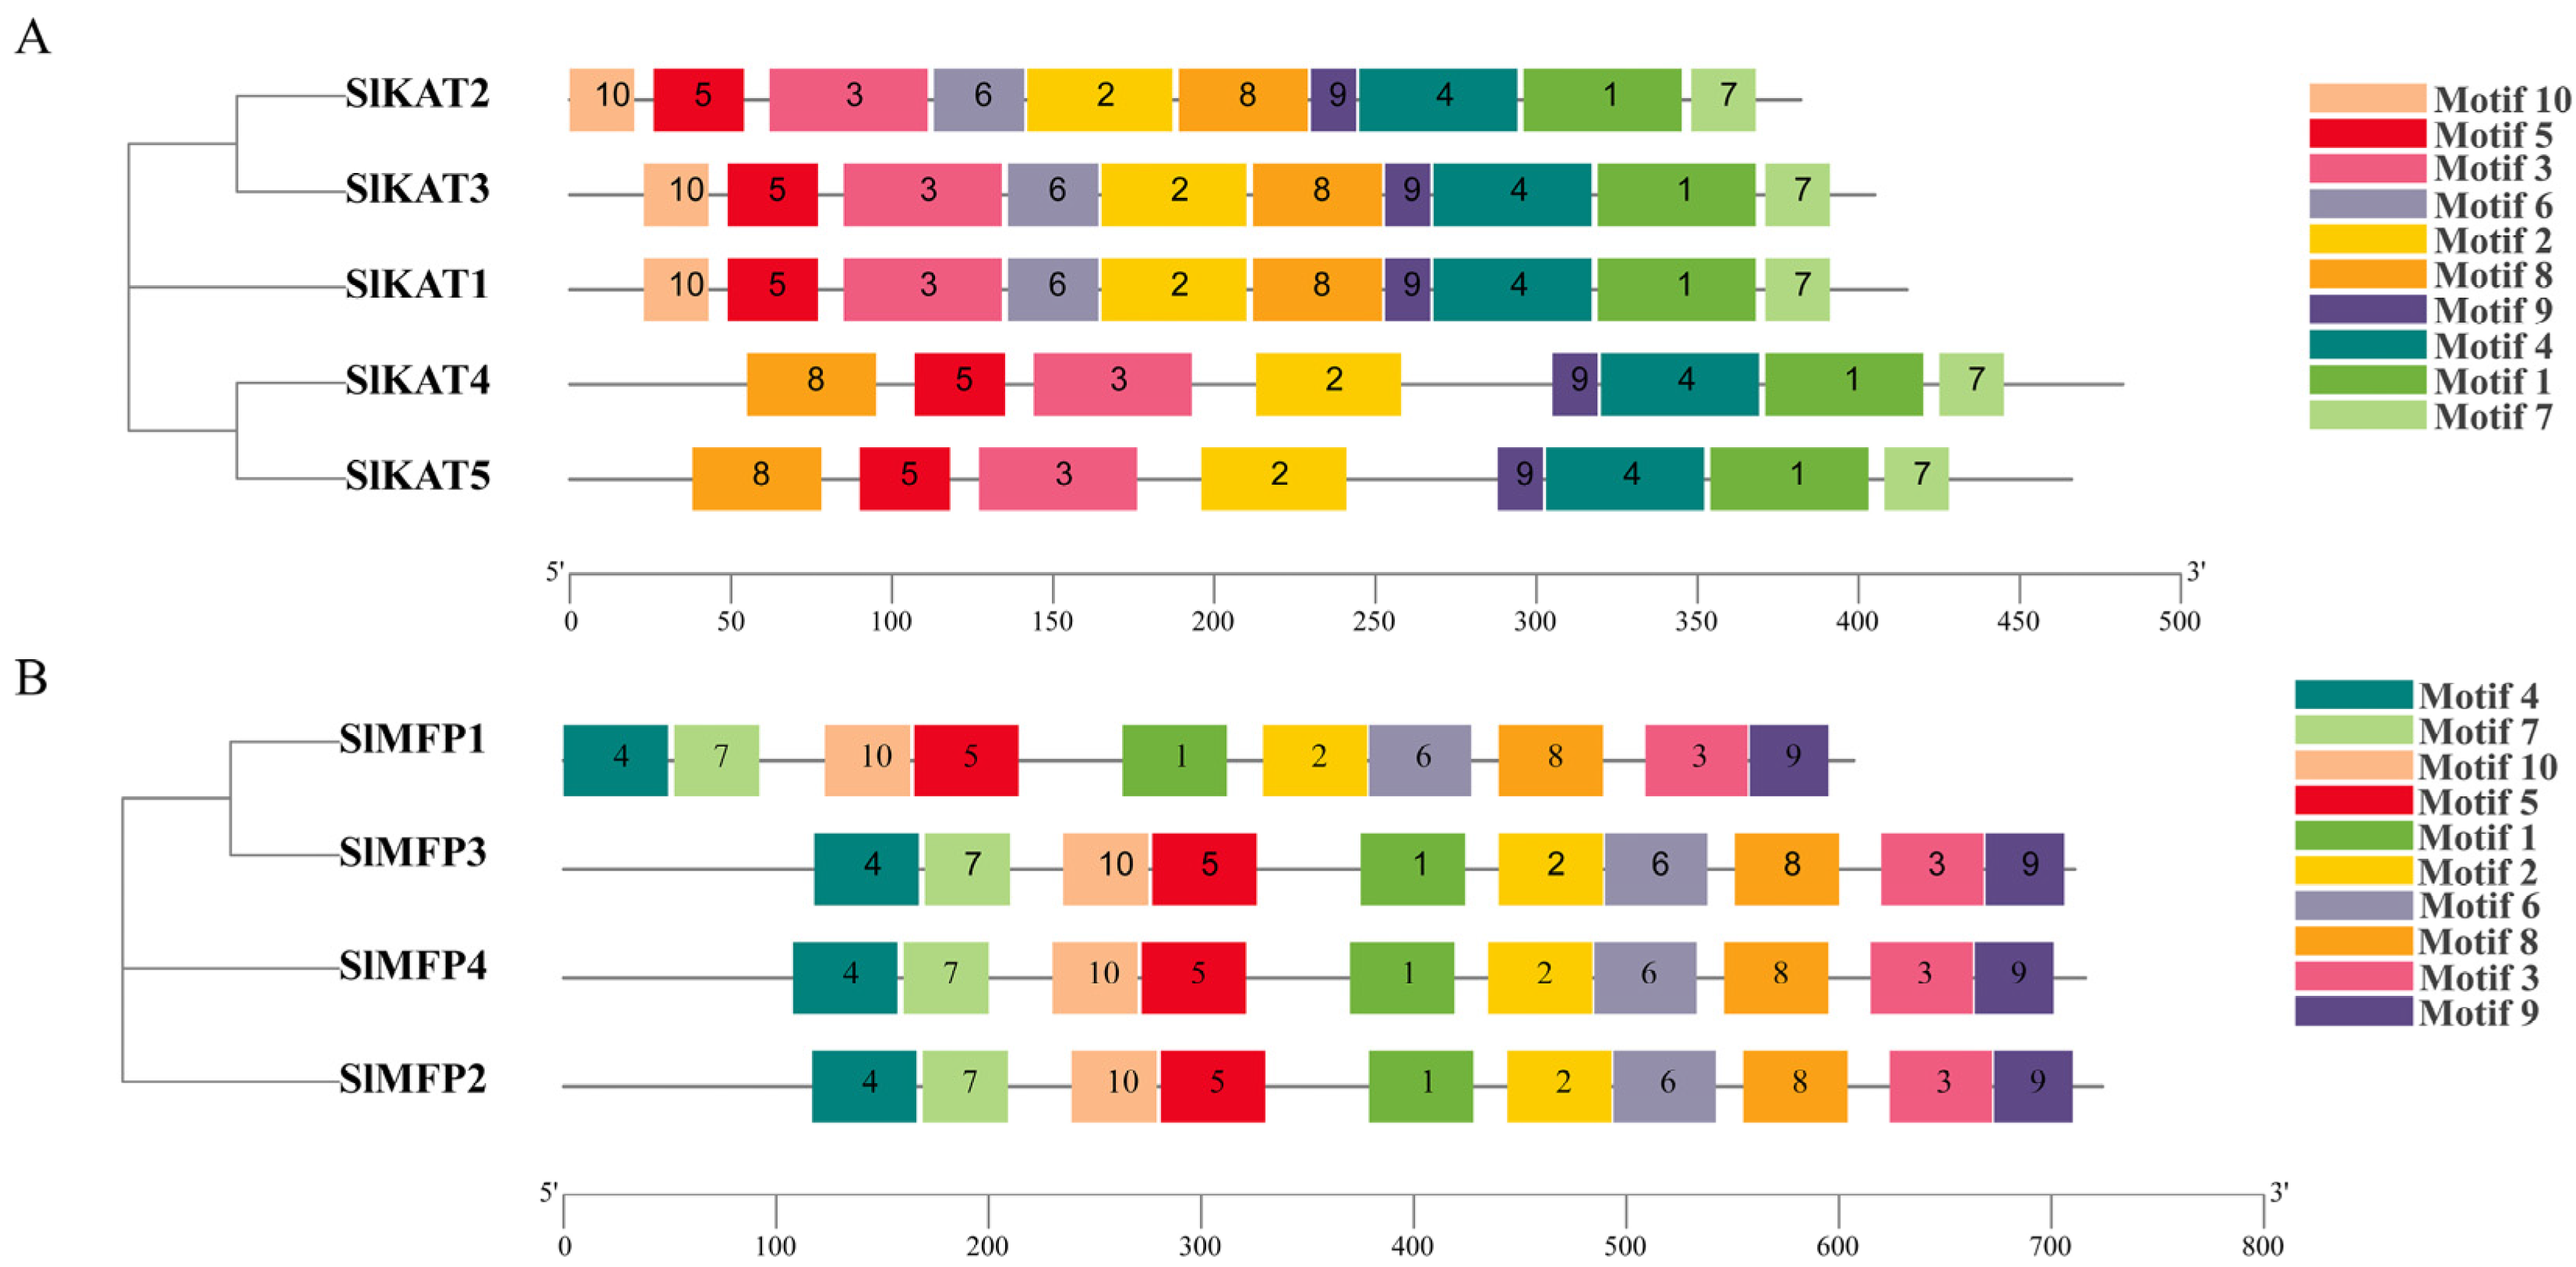
As a result of the analysis in Figure 2, 10 conserved motifs were identified in tomato KAT proteins. The length of the motifs is between 15 and 50 amino acids (Table 2). All the 10 conserved motifs are presented in SlKAT1, SlKAT2, and SlKAT3. However, motif6 and motif10 are absent in SlKAT4 and SlKAT5. We identified 10 conserved motifs in tomato MFP proteins. The length of the motifs is between 38 and 50 amino acids (Table 3). In contrast to KAT proteins, all the tomato MFP members identically contain 10 conserved motifs.

2.3. Phylogenetic Analysis of KAT and MFP Family Members

In order to further understand the phylogenetic relationships between the KAT and MFP family genes in tomatoes, we compared the KAT and MFP protein sequences of tomato, A. thaliana, cucumber, and P. tomentosa to jointly construct a phylogenetic tree, respectively (Figure 3). The protein sequences of KAT included three from A. thaliana, 12 from cucumber, 10 from P. tomentosa, and five from tomato. We categorized 30 KAT proteins into four groups (Figure 3). Group A has 6 members, Group B has 7 members, Group C has 4 members, and Group D has 13 members. Among them, SlKAT1 belongs to Group B, SlKAT2 and SlKAT3 belong to Group A, and SlKAT4 and SlKAT5 belong to Group D. Additionally, SlKAT2 has the closest evolutionary relationship with SlKAT3. The protein sequences of MFP included two from A. thaliana, seven from cucumber, 21 from P. tomentosa, and four from tomato (Figure 3). We found 33 MFP proteins and categorized these proteins into four groups. Group A has nine members, Group B has seven members, Group C has nine members, and Group D has eight members. The protein SlMFP1 belongs to Group A, and SlMFP2, SlMFP3, and SlMFP4 belong to Group B.

2.4. Protein Secondary Structure Analysis and Subcellular Localization of Tomato KAT and MFP Family Members

We analyzed the secondary structure of tomato KAT and MFP members (Table 4). The secondary structures in tomato KAT members were composed of the alpha helix (39.71–49.61%), beta turn (7.53–9.45%), and random coil (26.77–36.17%). In addition, the MFP family mainly included the alpha helix, random coil, and beta turn with percentages of 49.37~52.31%, 6.99~7.75%, and 31.67~33.85%, respectively.
The predicted subcellular localization of the tomato showed that the KAT and MFP genes were mainly distributed in the nucleus, chloroplasts, cytosol, peroxisomes, plasma membrane, and endoplasmic reticulum (Table 5). However, the distribution of each member in different cellular parts was different. SlKAT5, SlKAT1, SlMFP3, and SlMFP2 were expressed in the nucleus. These genes may be associated with the replication of genetic material. All genes except SlMFP2 were localized in chloroplasts. Genes localized in chloroplasts may be involved in photosynthesis in tomatoes. In the cytosol, only SlKAT5 and SlMFP4 were not involved in expression. SlKAT1 was not expressed in the peroxisome. Genes other than SlKAT1 may be involved in some physiological activities of the plant peroxisome. SlKAT5 and SlMFP4 were localized in the plasma membrane. In addition, SlMFP3 and SlMFP4 were expressed in the endoplasmic reticulum.

2.5. Chromosomal Localization of SlKAT and SlMFP Genes in Tomatoes

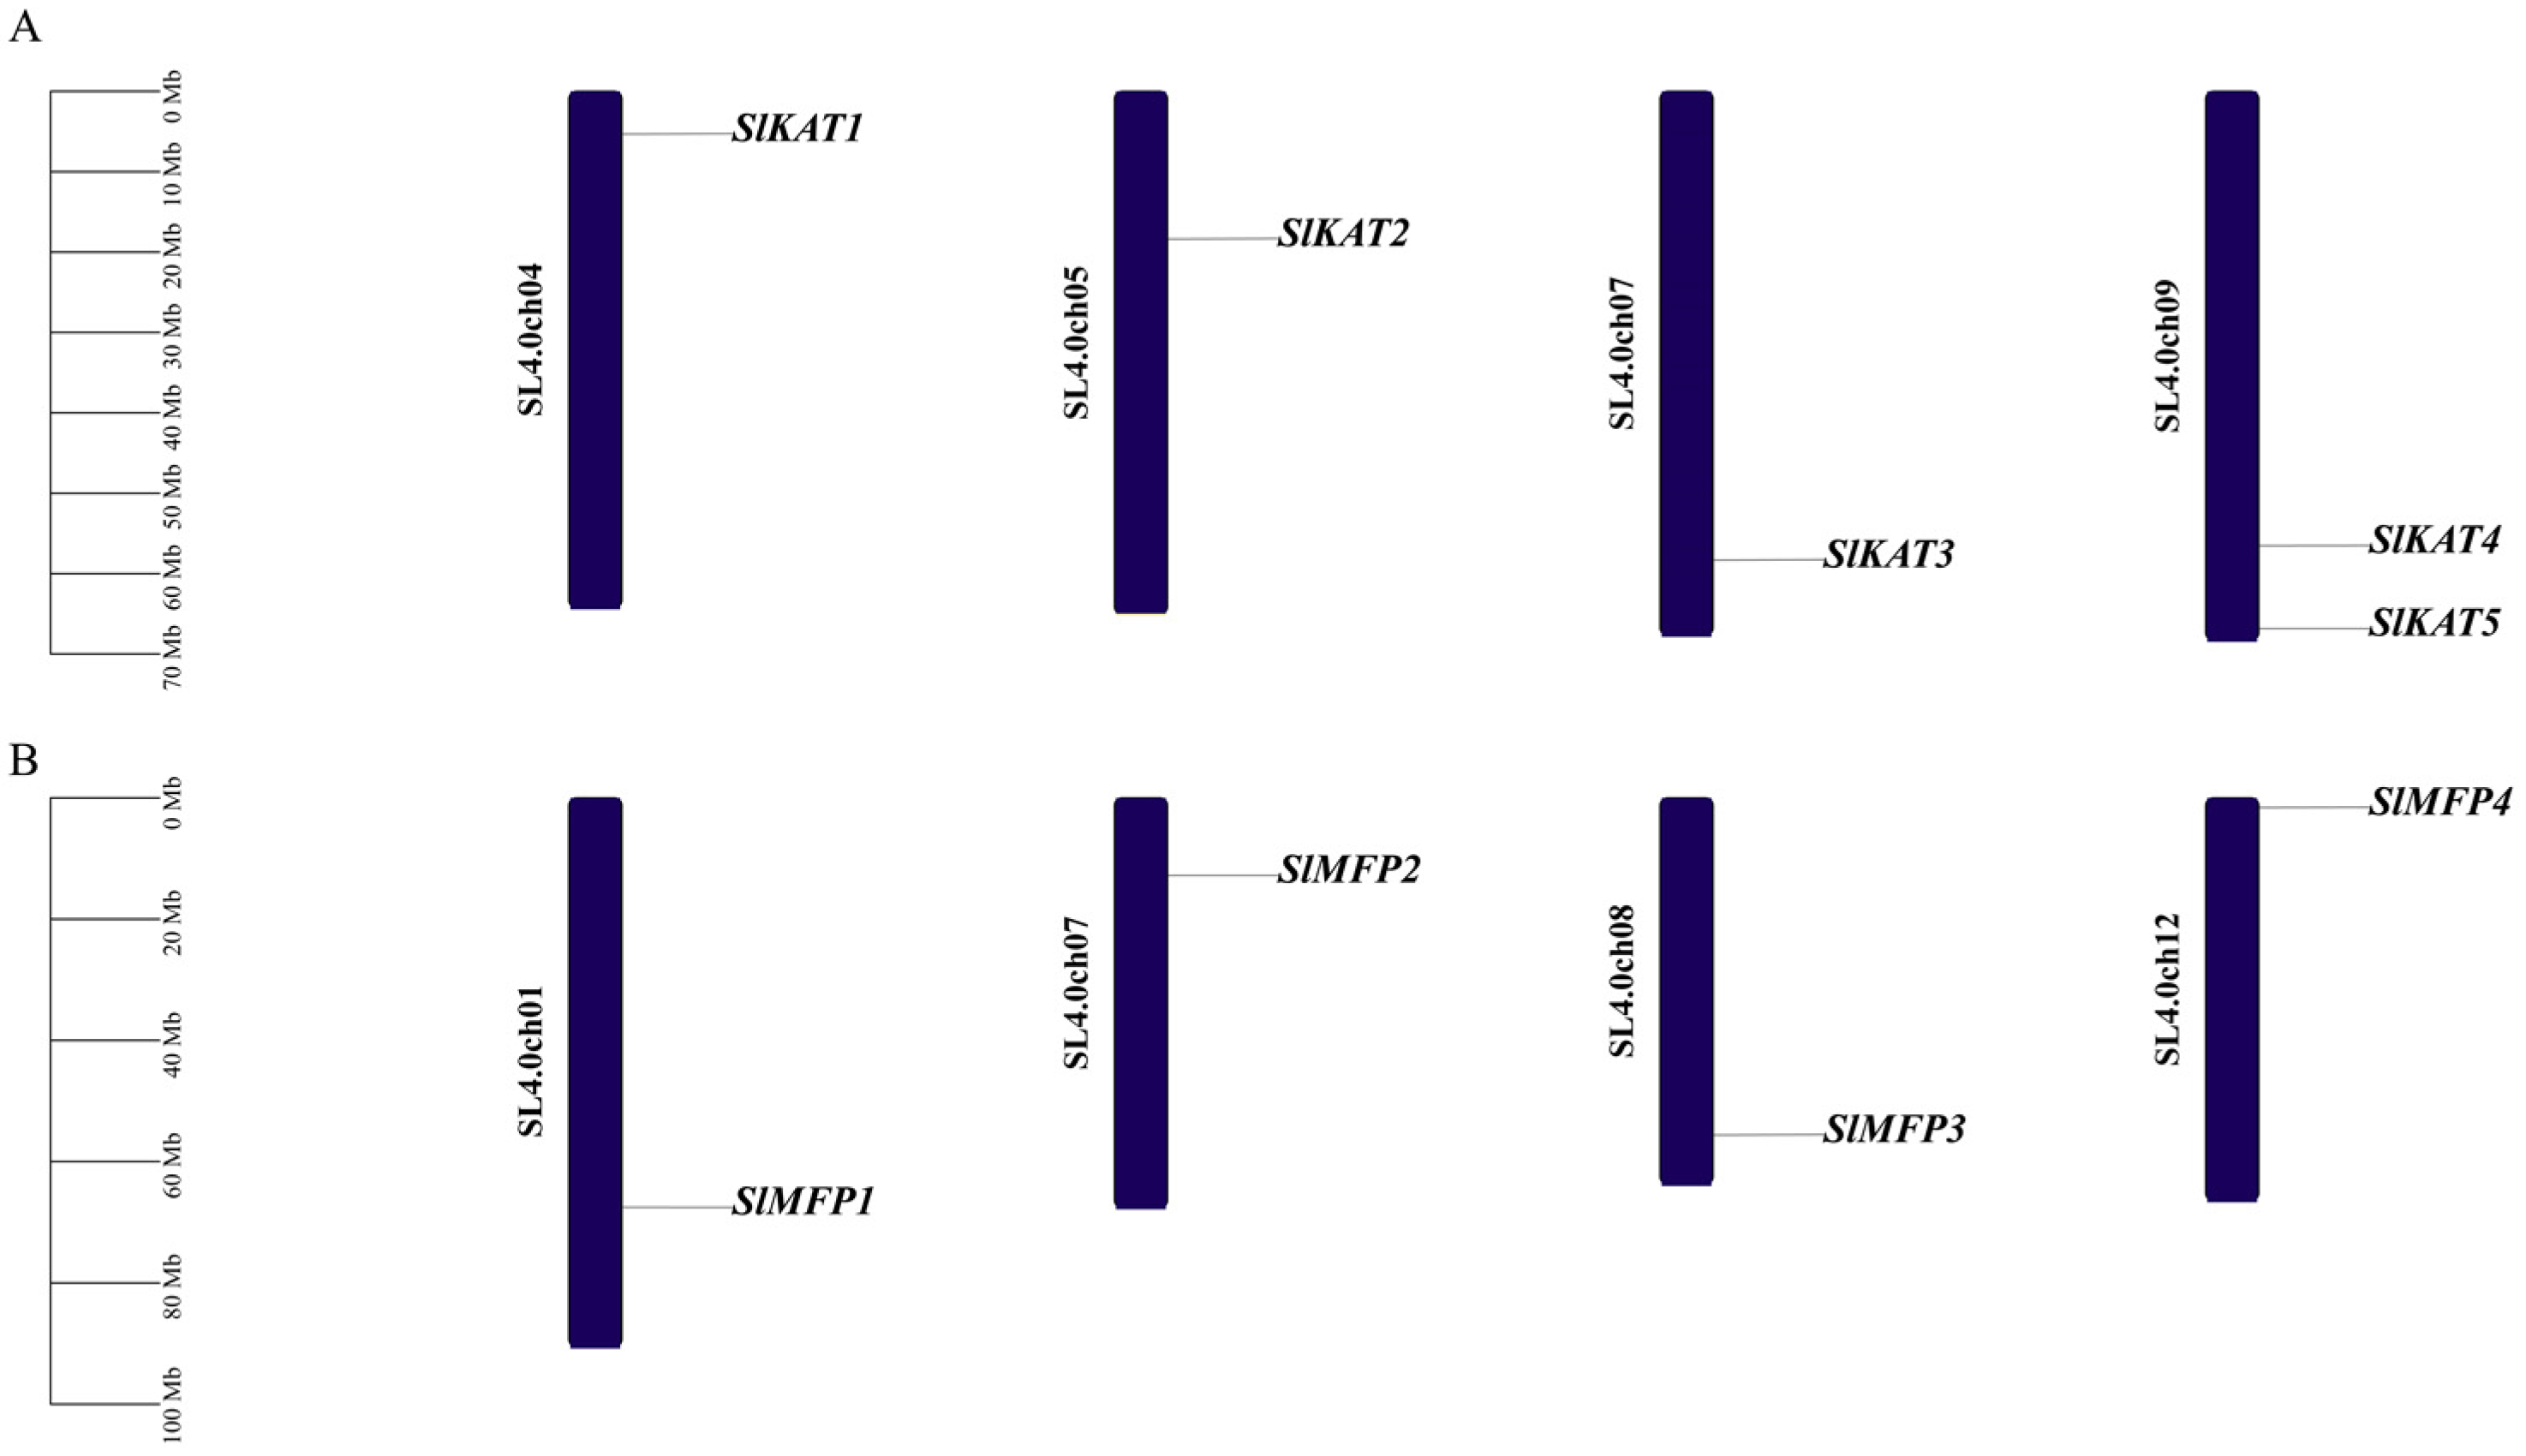
Using tomato genome annotation information and TBtools software (v2.034), we visualized the chromosomal distribution of tomato SlKAT and SlMFP family members. We found that the genes for tomato SlKAT and SlMFP are unevenly distributed on the chromosomes (Figure 4). Among them, SlKAT1 is located on chromosome 4, SlKAT2 is located on chromosome 5, SlKAT3 is located on chromosome 7, and SlKAT4 and SlKAT5 are located on chromosome 9. SlMFP1 is located on chromosome 1, SlMFP4 is located on chromosome 7, SlMFP3 is located on chromosome 8, and SlMFP4 is located on chromosome 12.

2.6. Analysis of Cis-Acting Elements of the Tomato SlKAT and SlMFP Family Genes

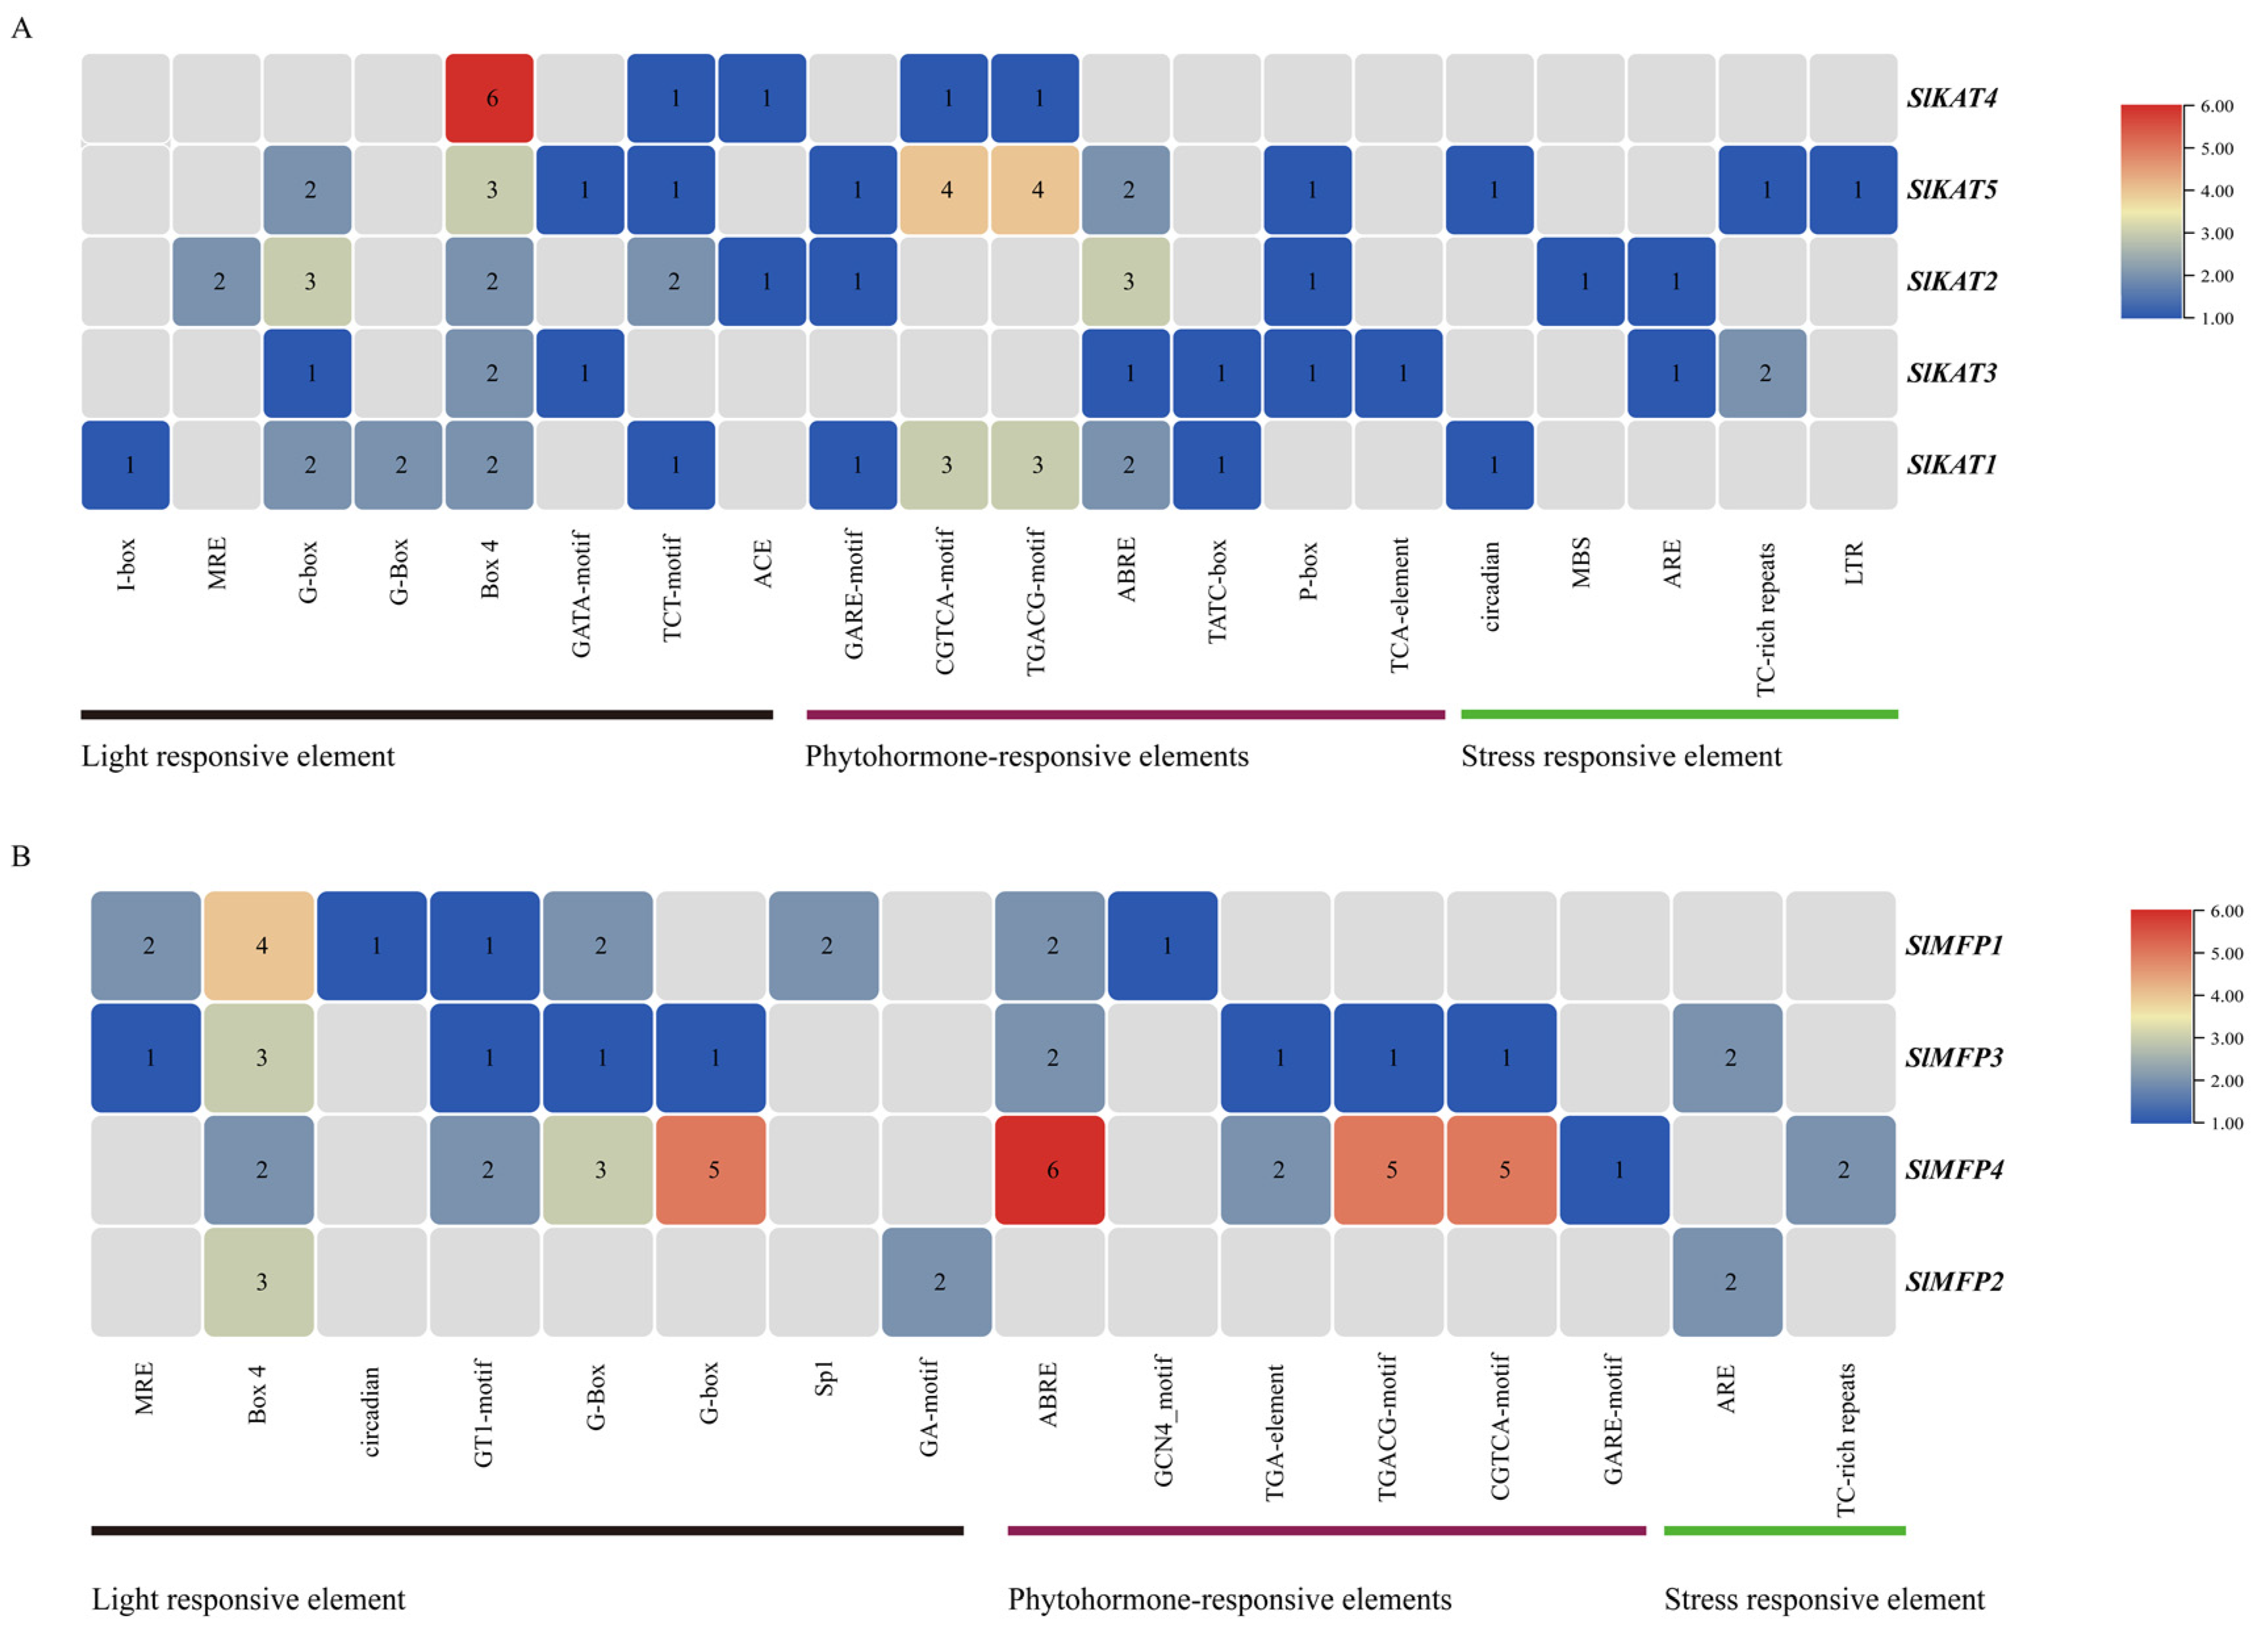
We analyzed promoter sequences (from −2000 bp to −1 bp) of five SlKAT genes and four SlMFP genes to detect the cis-acting elements (Figure 5). There were 20 major cis-acting elements in the promoter regions of tomato KAT family members. The light-responsive elements included I-box, MRE, G-box, G-Box, Box 4, GATA-motif, TCT-motif, and ACE. The hormone response elements included GARE-motif, CGTCA-motif, TGACG-motif, ABRE, TATC-box, P-box, and TCA-element. The stress response components included circadian, MBS, ARE, TC-rich repeats, and LTR. Within the MFP family, we identified 16 major cis-acting elements. Among them, MRE, Box 4, circadian, GT1-motif, G-Box, G-box, Sp1, and GA-motif belonged to the light-responsive elements. ABRE, GCN4_motif, TGA-element, TGACG-motif, CGTCA-motif, and GARE-motif belonged to hormone-responsive elements. ARE and TC-rich repeats belonged to the stress-responsive elements.
As can be seen in Figure 6, in the SlKAT family, Box 4 elements are present in all members. SlKAT4 responded most significantly to the Box 4 element. SlKAT5 responded most significantly to the CGTCA-motif and TGACG-motif elements. SlKAT2 responded most significantly to the G-box and ABRE elements. SlKAT1 responded most significantly to the CGTCA-motif and TGACG-motif elements. In addition, in the SlMFP family, Box 4 elements are present in all members. SlMFP1 and SlMFP3 primarily respond to Box 4 elements. SlMFP4 responds more significantly to G-box, ABRE, TGACG-motif, and CGTCA-motif elements. SlMFP2 primarily responds to Box 4 elements. The results of the cis-acting elements indicate that tomato SlKAT and SlMFP family members function in light-responsive elements, hormone-responsive elements, and stress-responsive elements.

2.7. Tissue Expression Analysis of Tomato SlKAT and SlMFP Family Genes

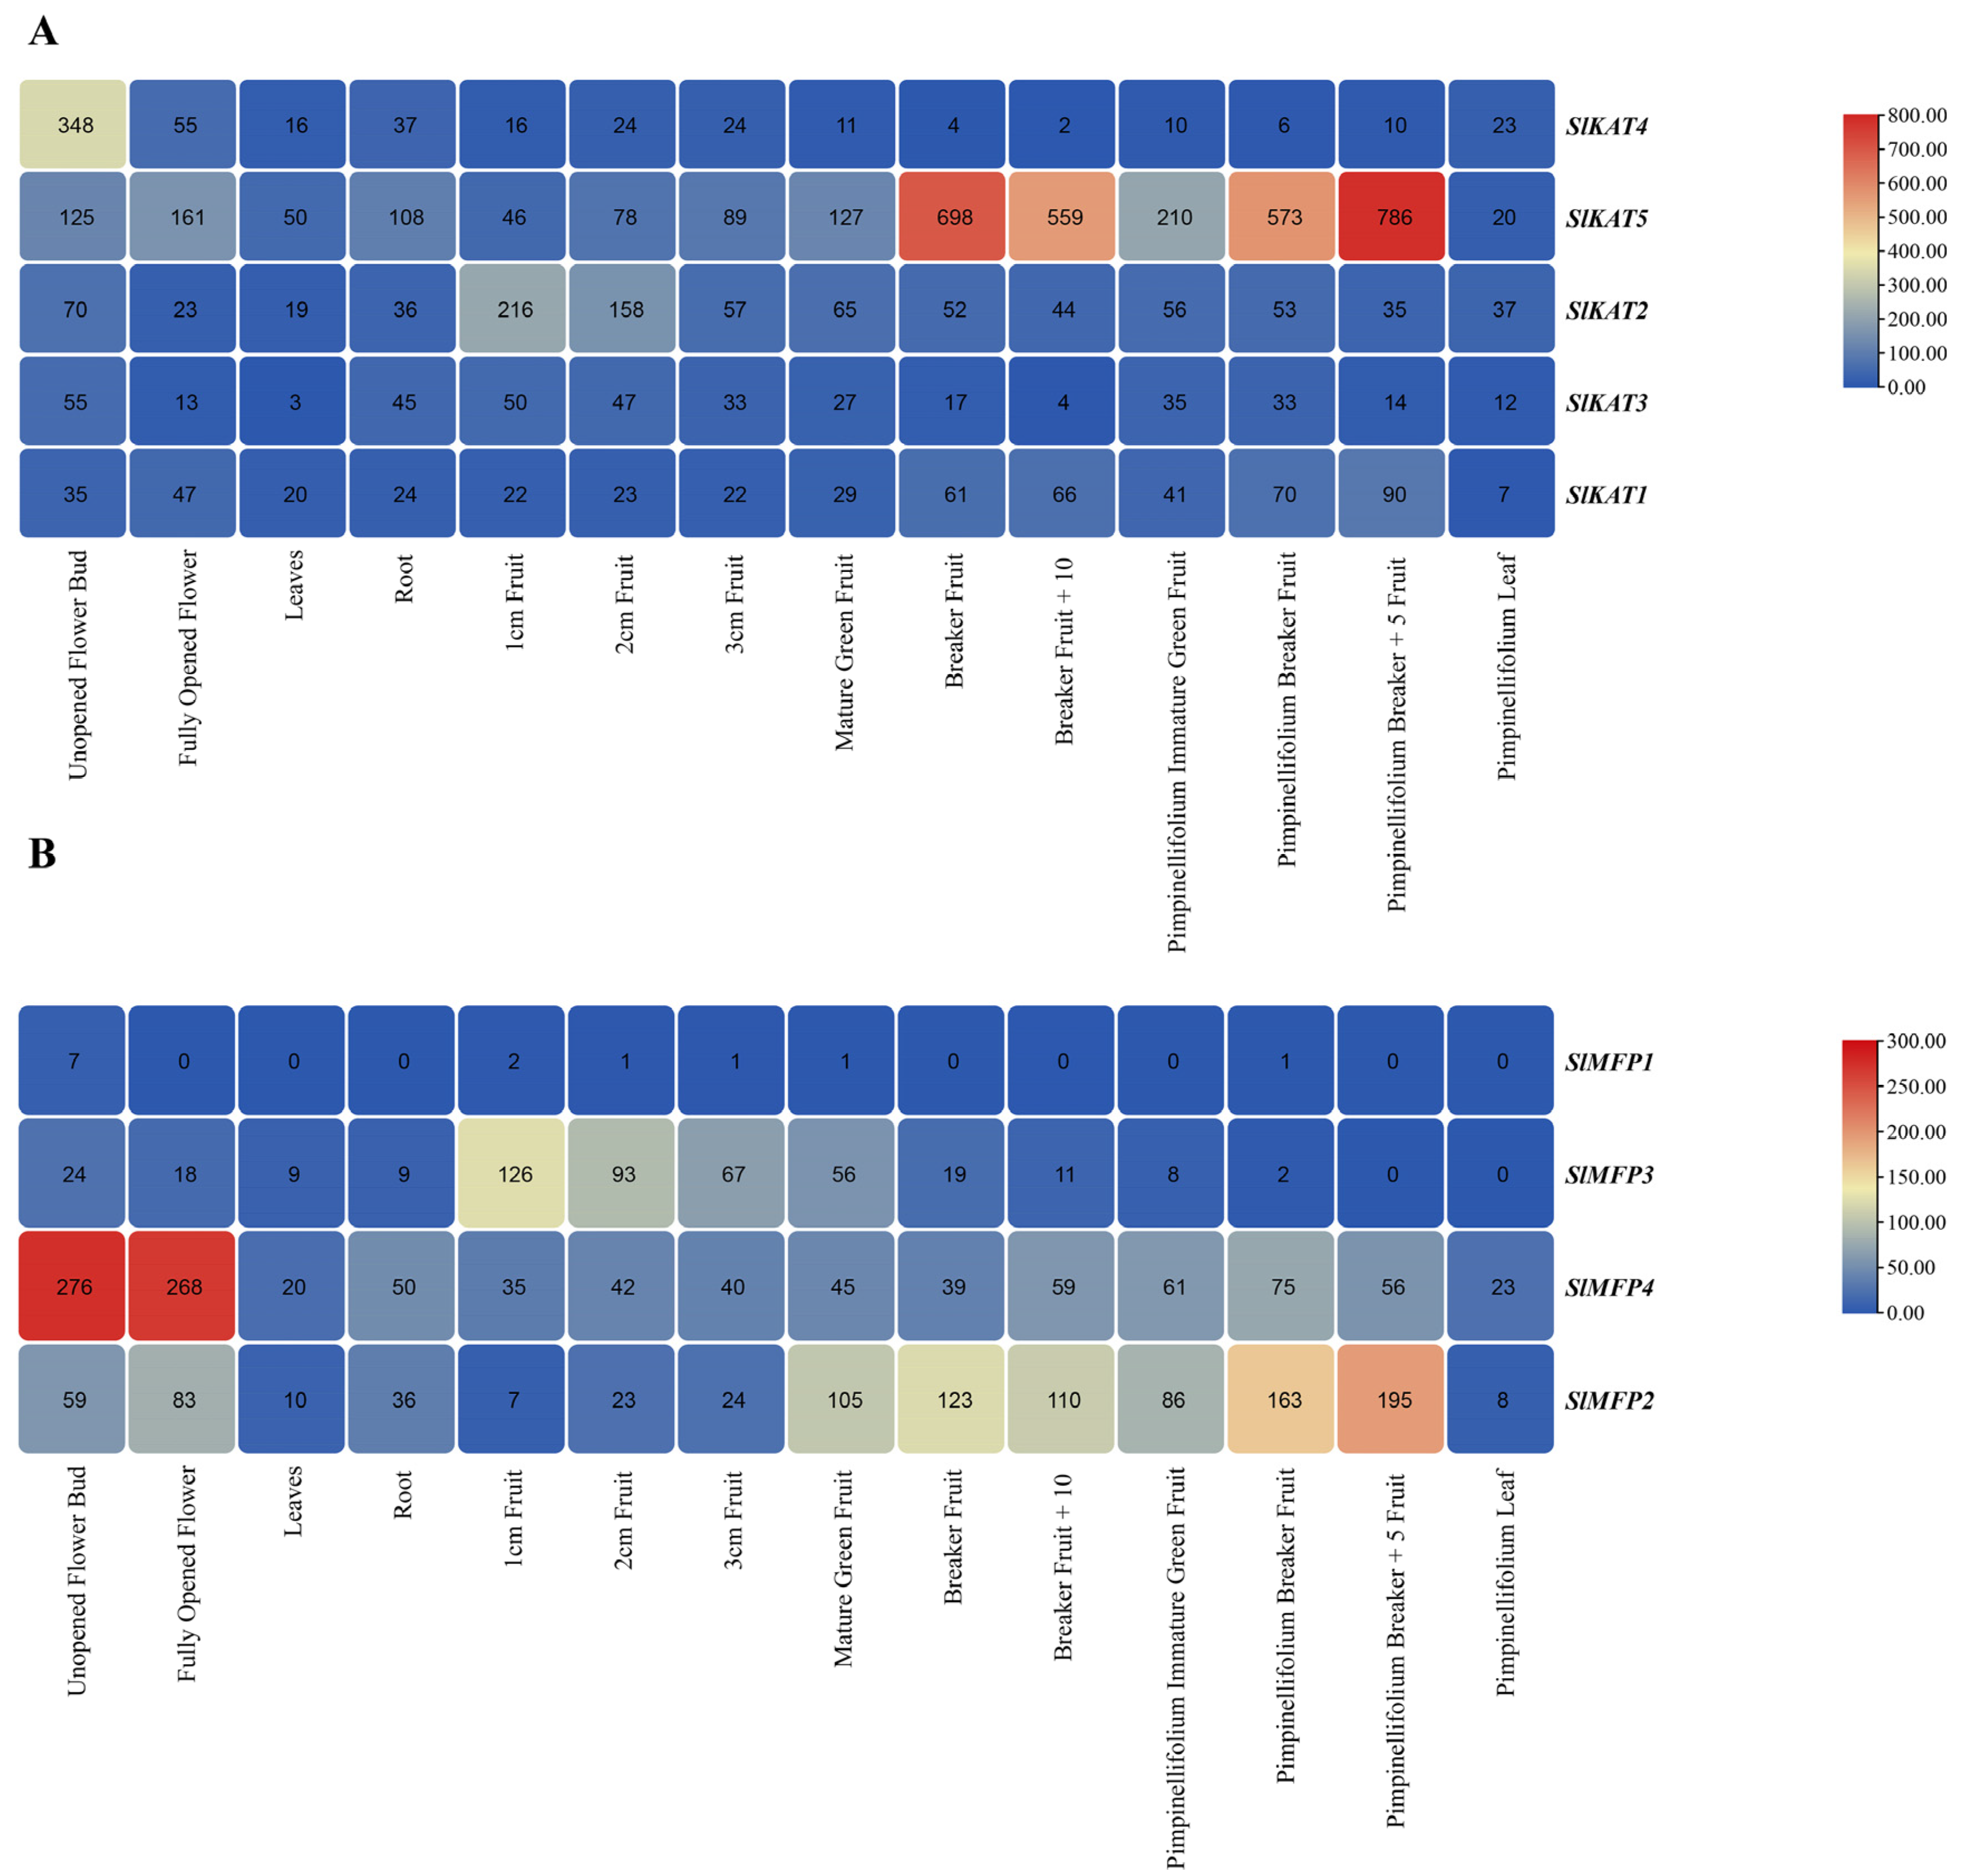
In order to investigate the role of the SlKAT and SlMFP genes in various tomato tissues during various growth stages, the expression levels of the SlKAT and SlMFP genes in 14 tomato tissues were analyzed, including Unopened Flower Bud, Fully Opened Flower, Leaf, Root, 1 cm Fruit, 2 cm Fruit, 3 cm Fruit, Mature Green Fruit, Breaker Fruit, Breaker Fruit + 10, Pimpinellifolium Immature Green Fruit, Pimpinellifolium Breaker Fruit, Pimpinellifolium Breaker + 5 Fruit, and Pimpinellifolium Leaf (Figure 7). Among them, SlKAT5 and SlMFP4 were highly expressed in all the detected tissues. In addition, the transcript abundance of SlKAT5 was most abundant in Pimpinellifolium Breaker + 5 Fruit. SlMFP4 was highly expressed in Unopened Flower Bud and Fully Opened Flowers. SlKAT4 expression was higher in Unopened Flower Bud, whereas SlKAT2 and SlMFP3 expression was higher in 1 cm Fruit and 2 cm Fruit. The expression of SlKAT3, SlKAT1, and SlMFP1 was low in the other tissues. SlMFP2 expression was higher in Mature Green Fruit, Breaker Fruit, Breaker Fruit + 10, Pimpinellifolium Breaker Fruit, and Pimpinellifolium Breaker + 5 Fruit.

2.8. Gene Duplication and Collinearity Analysis of the SlKAT and SlMFP Genes

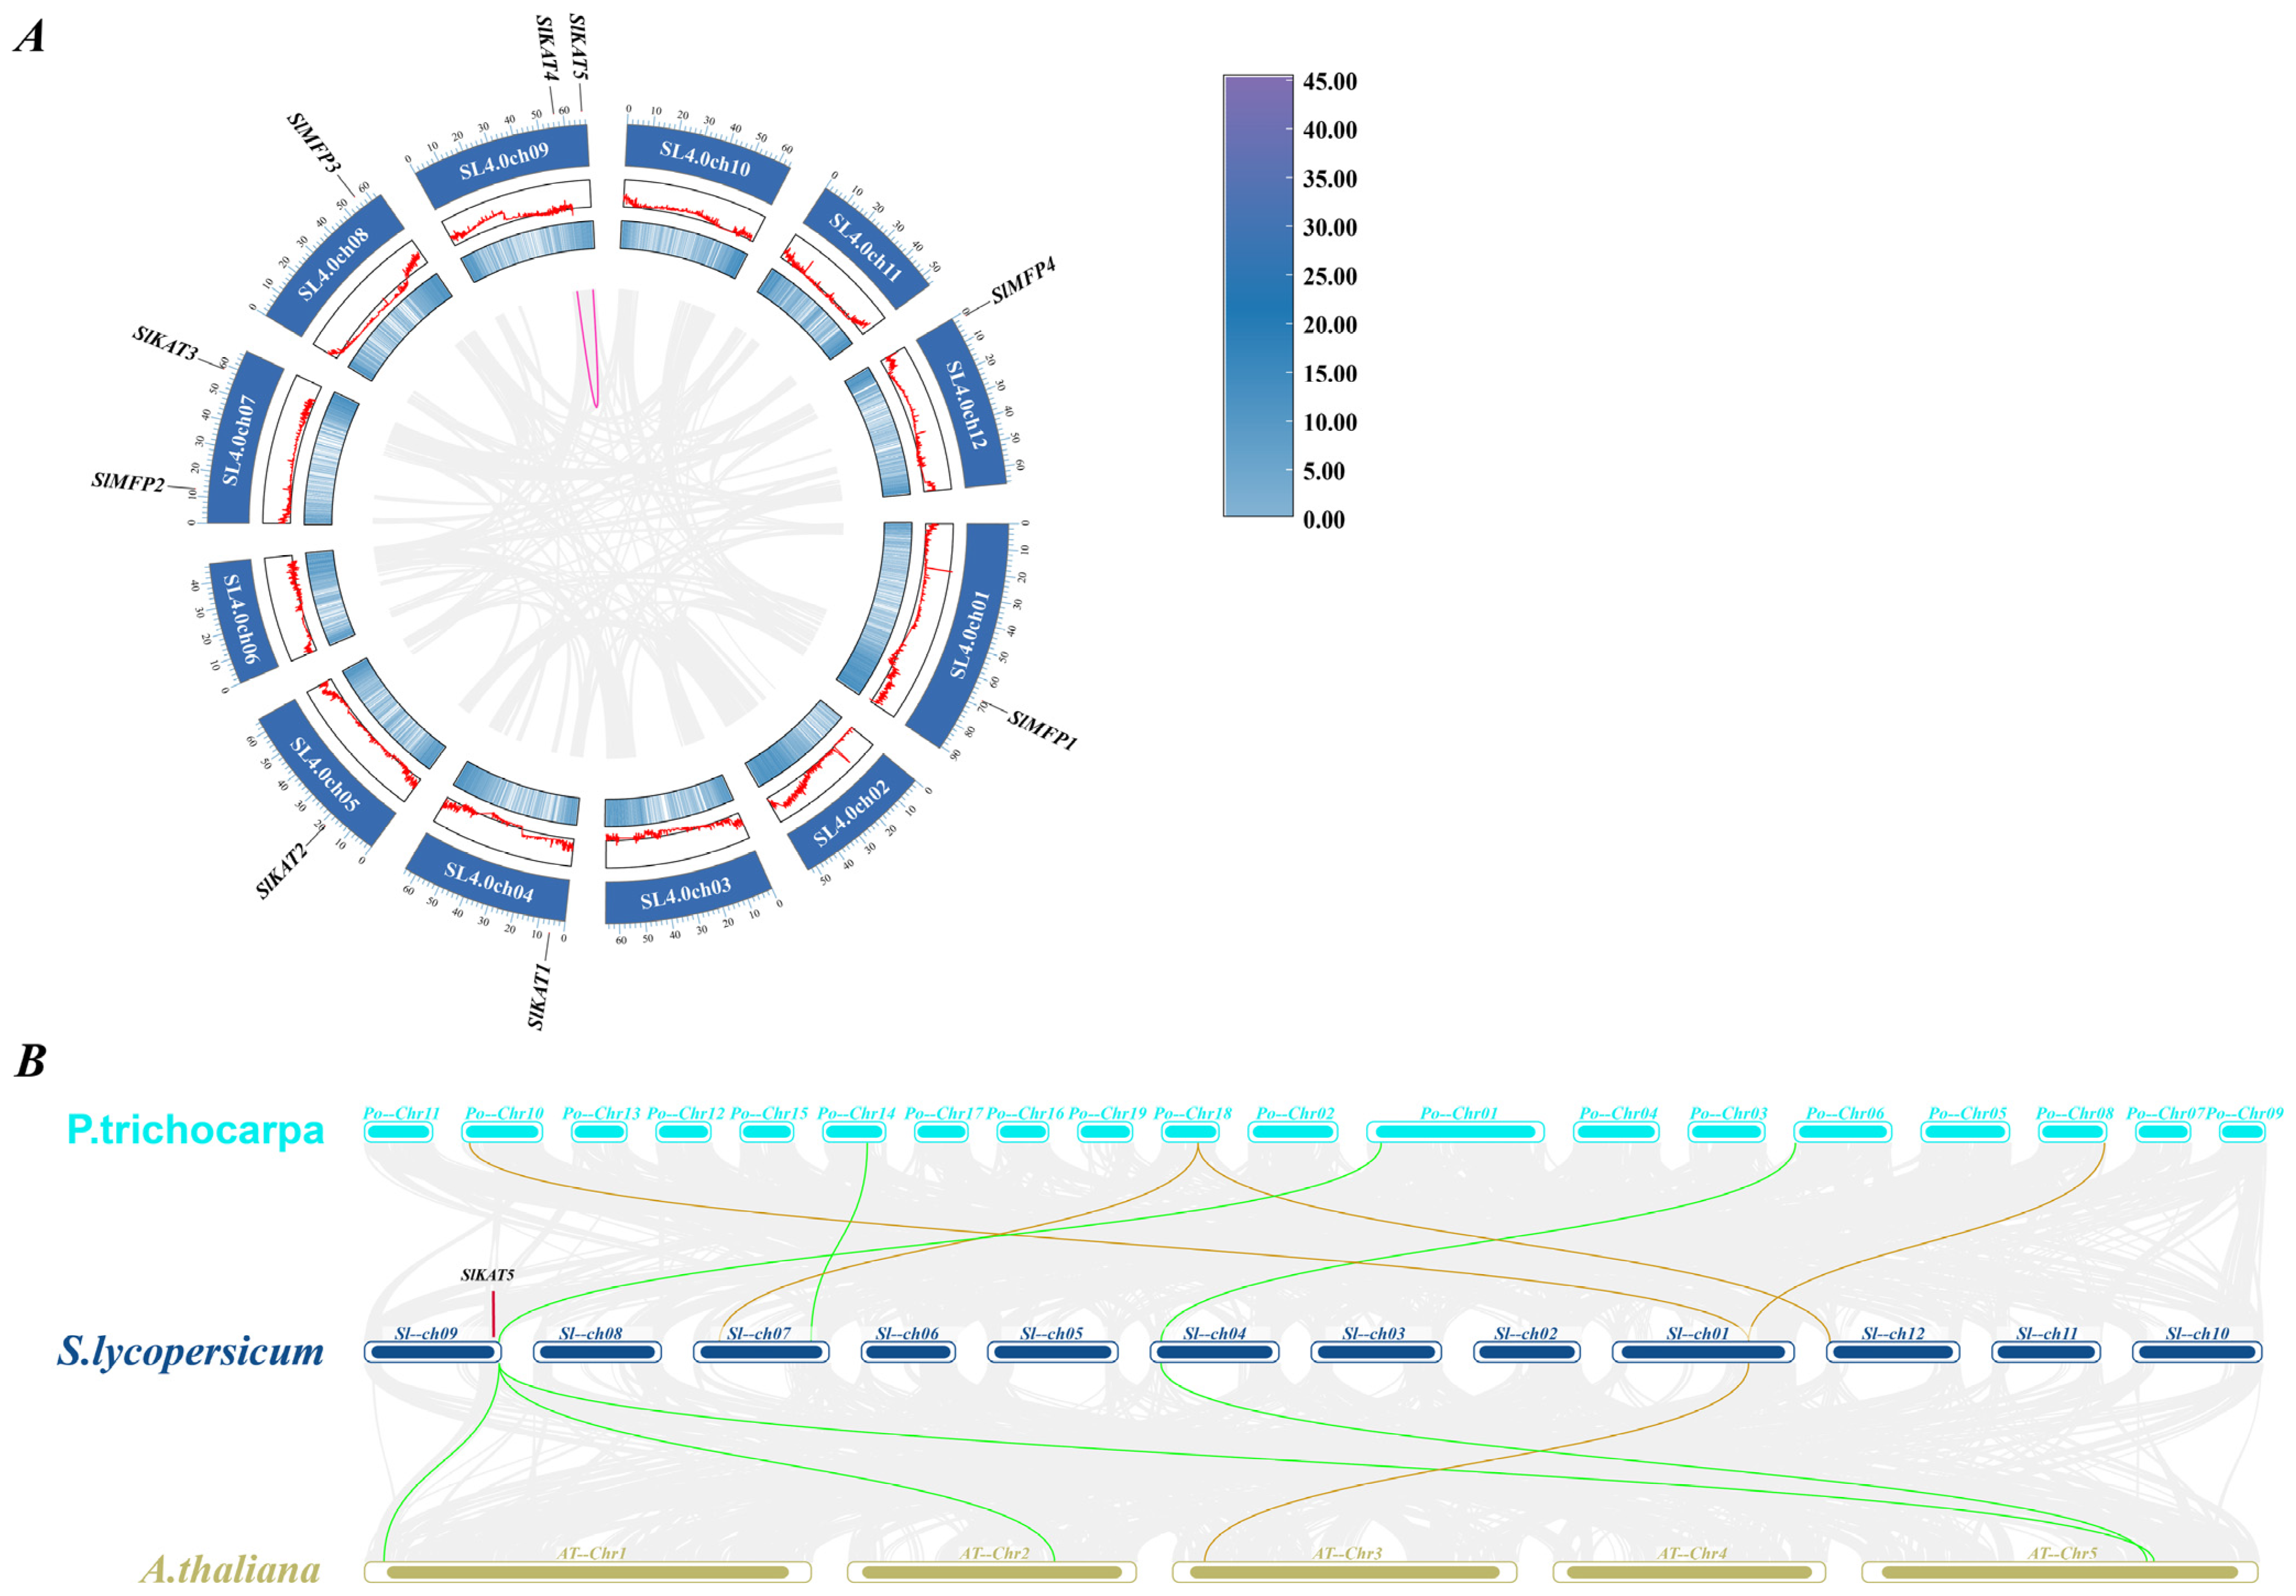
In order to understand the amplification mechanism of the KAT and MFP family genes, we investigated the covariance of KAT and MFP in the tomato, A. thaliana, and P. tomentosa (Figure 8). We found that tandem duplicate events occurred for SlKAT4 and SlKAT5. This can impact the level and pattern of gene expression as well as lead to genetic instability. To investigate the evolutionary relationship between the KAT and MFP family genes among species, we analyzed the homology of the KAT and MFP genes in the tomato, A. thaliana, and P. tomentosa. Among the KAT gene family, four genes were linearly related between tomato and P. tomentosa. One gene in A. thaliana was covariantly related to tomato. Three genes were linearly related between P. tomentosa and tomato. Four genes were linearly related between A. thaliana and tomato. The SlKAT5 gene was co-localized in both P. tomentosa and A. thaliana. This indicates that the SlKAT5 gene was present before the differentiation of tomato, A. thaliana, and P. tomentosa (Figure 8A).

2.9. Evolutionary Selection Pressure Analysis of SlKAT and SlMFP Genes

Ka denotes the non-synonymous substitution rate, which is the incidence of non-synonymous mutations in the gene sequence. Ks denotes the synonymous substitution rate, which is the incidence of synonymous mutations in a gene sequence [21]. The Ka/Ks values can be used to measure the relative frequency of nonsynonymous and synonymous mutations, thus reflecting the selective pressure on genes during evolution [22]. It has an important role in the evolutionary analysis of family genes. Here, we performed Ka/Ks analysis on the SlKAT and SlMFP family genes, and we found that the Ka/Ks values in both SlKAT and SlMFP genes were less than 1 (Figure 9). This indicates that the selective pressure for the evolution of the SlKAT and SlMFP family genes in tomato species stems mainly from purifying selection.

2.10. Expression Profile Analysis of the SlKAT and SlMFP Genes in Response to Hormone and Abiotic Stresses

To explore the response patterns in the SlKAT and SlMFP genes to different hormones, we investigated the expression levels of five SlKAT genes and four SlMFP genes in the tomato under ABA and MeJA. In SlKAT family members, the expression levels of SlKAT1 and SlKAT2 were significantly suppressed by the ABA treatment. However, the expression levels of SlKAT3, SlKAT4, and SlKAT5 were increased by the 6–24 h ABA treatment. Under the MeJA treatment, the expression levels of SlKAT1 and SlKAT4 were significantly down-regulated. Also, the 24 h MeJA treatment restrained the expression abundance of SlKAT2. However, the expression levels of SlKAT3 and SlKAT5 were enhanced to 2.04-fold and 2.98-fold, respectively, under the 12 h MeJA treatment. As for the SlMFP family genes, the expression of SlMFP1, SlMFP2, and SlMFP3 were increased by the 12 h ABA treatment (Figure 10). In addition, the 6 and 24 h MeJA treatments significantly repressed the transcriptional levels of SlMFP genes.
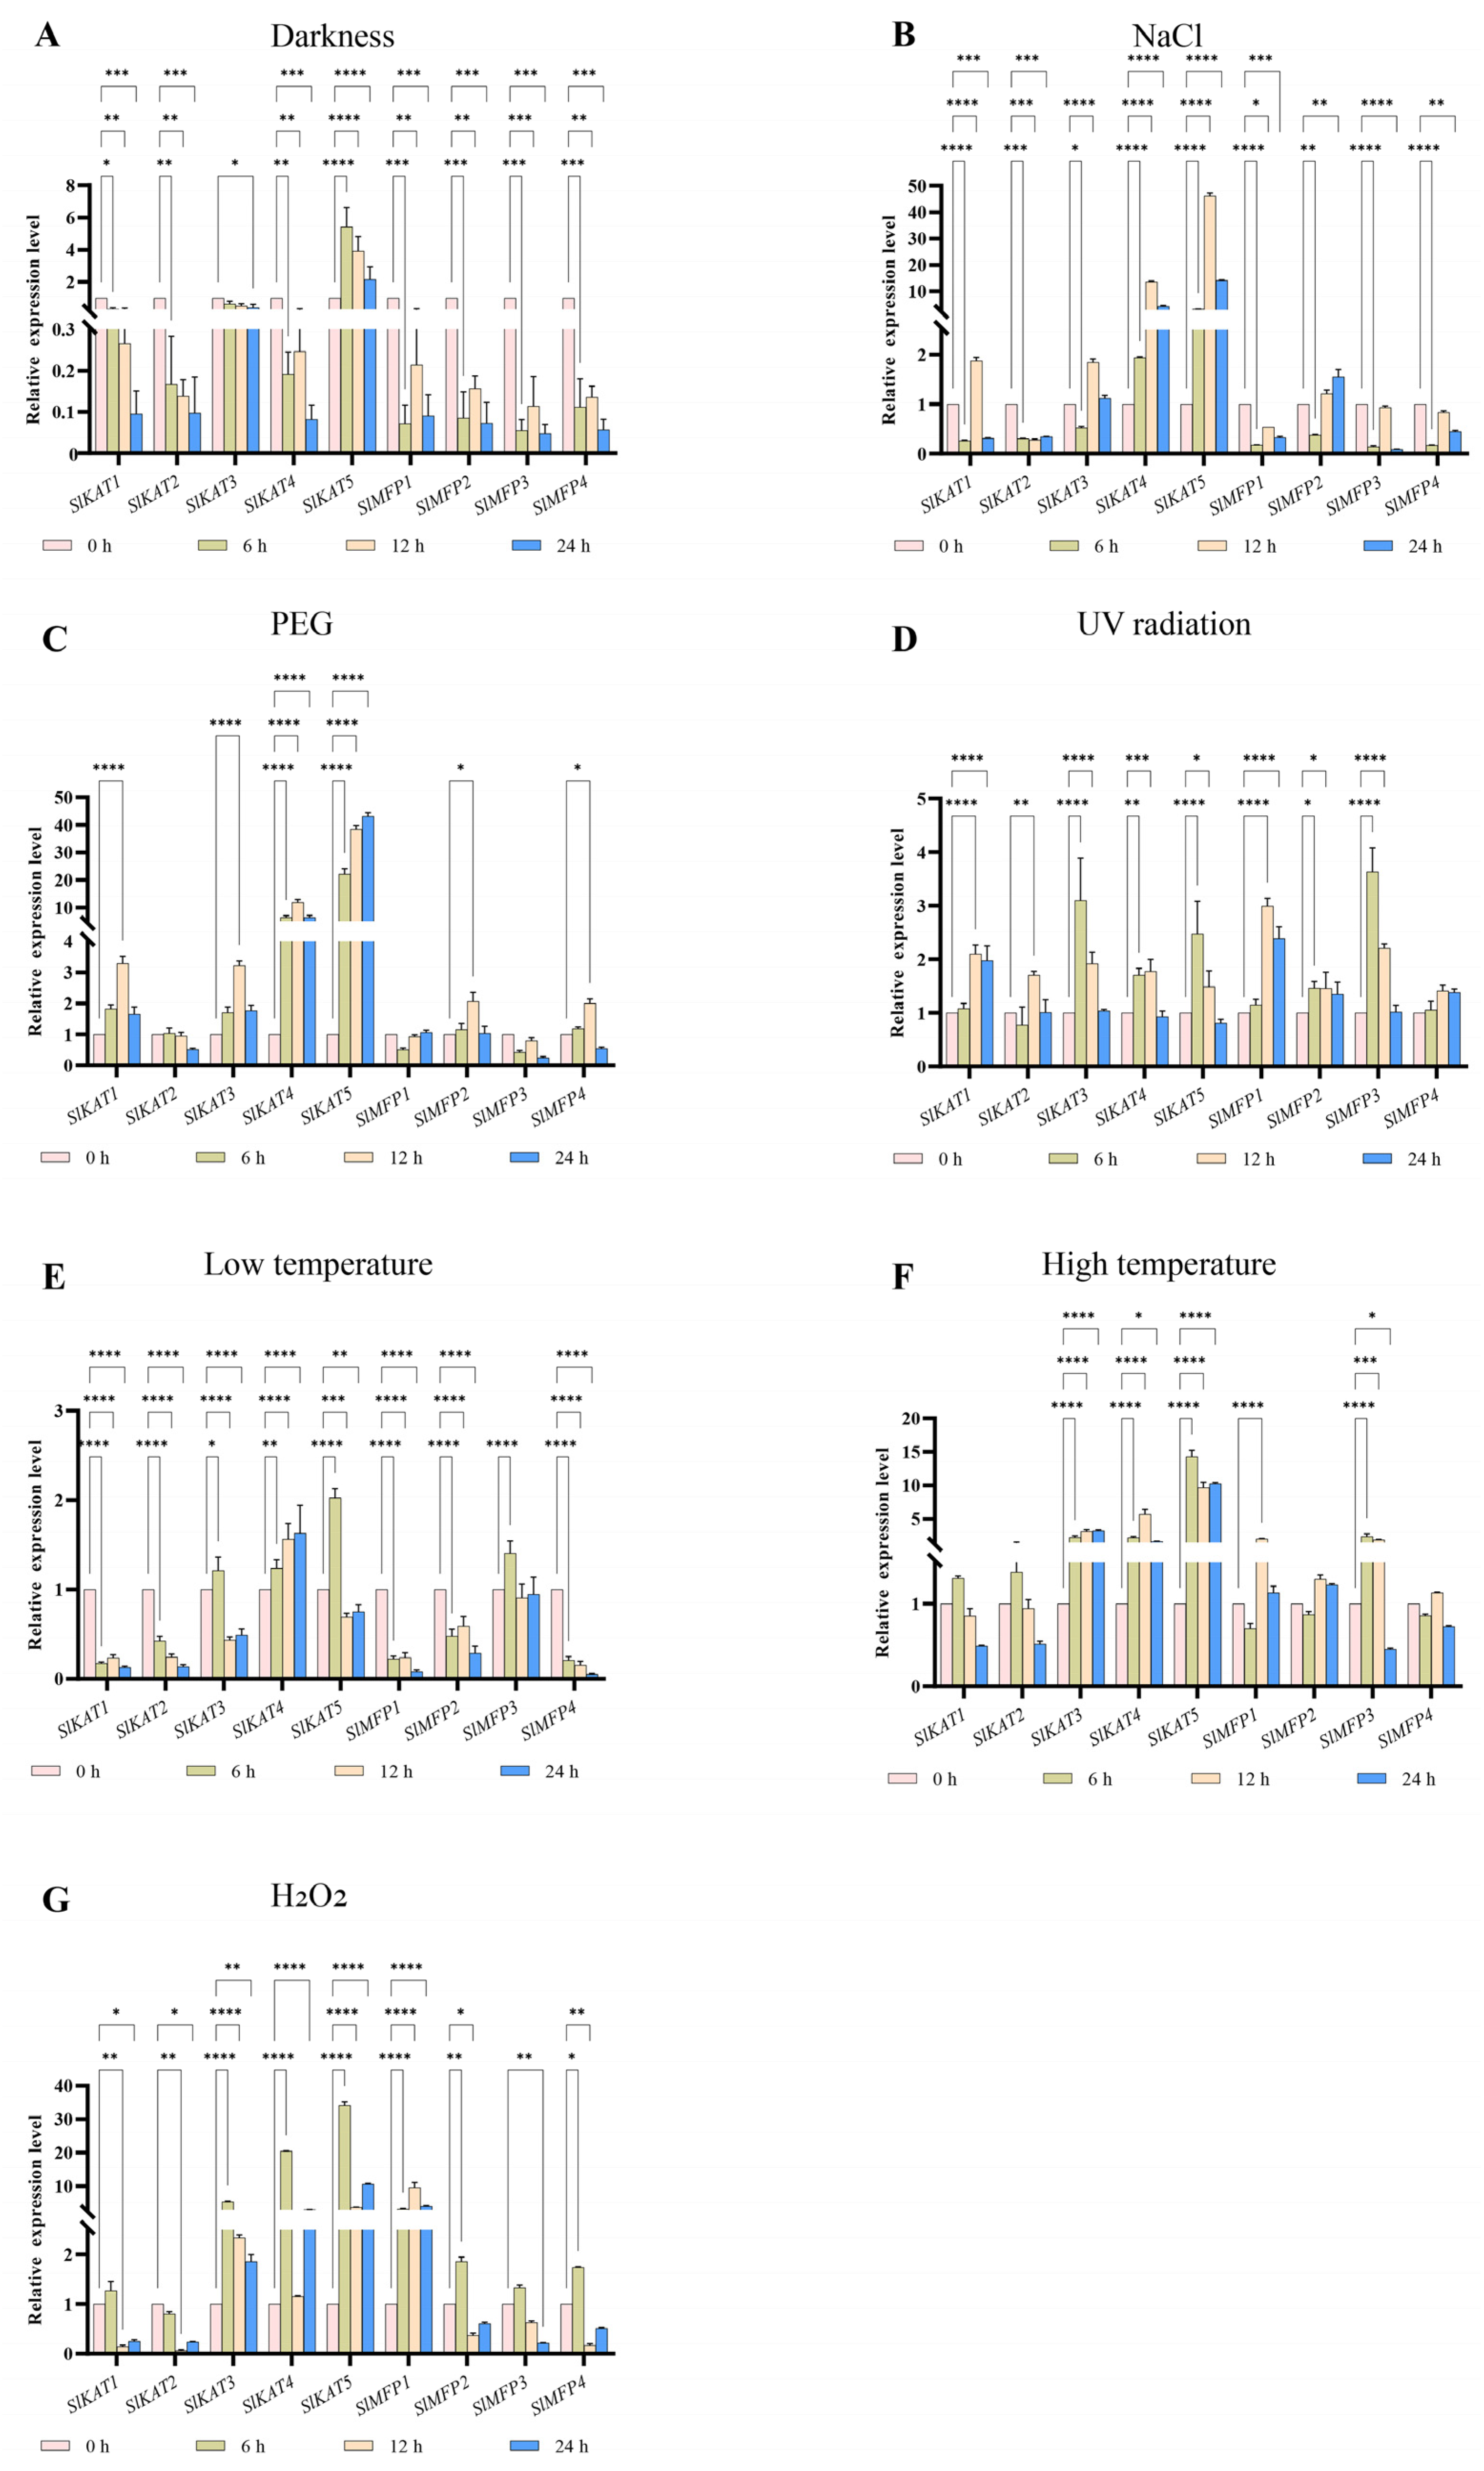
The expressions of the SlKAT and SlMFP genes were also detected under darkness, NaCl, PEG, UV, cold, heat, and H2O2 treatments (Figure 11). In the SlKAT family, the expression levels of SlKAT1 and SlKAT4 were down-regulated after dark treatment. However, the expression levels of SlKAT3 and SlKAT5 reached a peak at 12 h of dark treatment. The expression levels of SlKAT1, SlKAT3, SlKAT4, and SlKAT5 were up-regulated by NaCl treatment, in which expressions of SlKAT1 and SlKAT3 were highest at 12 h of NaCl treatment. However, the transcriptional levels of SlKAT2 were down-regulated by NaCl treatment. Similarly, the expression levels of SlKAT1, SlKAT3, SlKAT4, and SlKAT5 were up-regulated under PEG conditions. UV treatment resulted in up-regulation of the expression levels of SlKAT3, SlKAT4, and SlKAT5 at 6 h and 12 h. The expression levels of SlKAT1 were up-regulated at 12 h and 24 h of UV treatment, and SlKAT2 peaked at 12 h of UV treatment. Under cold treatment, the expression levels of SlKAT1 and SlKAT2 were down-regulated, whereas the transcriptional levels of SlKAT4 were up-regulated. The highest expression levels of SlKAT3 and SlKAT5 were observed after 6 h of cold treatment. Heat treatment caused the expression of SlKAT3, SlKAT4, and SlKAT5 to be up-regulated. The expression levels of SlKAT1 and SlKAT2 were highest at 6 h of heat treatment. The result of the H2O2 treatment led to a down-regulation of SlKAT2 expression. The expression levels of SlKAT1, SlKAT3, SlKAT4, and SlKAT5 peaked as a result of 6 h of H2O2 treatment. In the SlMFP family, the transcriptional levels of all the SlMFPs were down-regulated after dark treatment. After treatment with NaCl, the expression levels of SlMFP1 were down-regulated, and SlMFP2 had the lowest expression at 6 h. The expression levels of SlMFP2 and SlMFP4 were highest at 12 h under PEG treatment. UV treatment up-regulated the transcript abundances of all SlMFPs genes. The expression levels of SlMFP1, SlMFP2, and SlMFP4 were down-regulated under cold treatment. Under heat treatment, SlMFP1 and SlMFP3 had the highest expression at 6 h. Under H2O2 conditions, the transcriptional level of SlMFP1 was highest at 12 h, whereas the expression levels of SlMFP2, SlMFP3, and SlMFP4 were highest at 6 h.

3. Discussion

There exist three key proteins involved in the fatty acid β-oxidation pathway in plant peroxisomes, including ACX, MFP, and KAT. Together, these enzymes catalyze the complete degradation of both saturated and unsaturated long-chain fatty acyl-CoAs to acetyl-CoA via the repeated cleavage of acetate units from the thiol end of fatty acids [23,24]. In previous studies, KAT and MFP genes were synergistically expressed during seed germination in A. thaliana and shared a common regulatory mechanism [10]. Alternatively, KAT and MFP can affect photosynthetic capacity by influencing sucrose conversion during photosynthesis [10]. The present study was conducted to analyze the tomato SlKAT and SlMFP family genes bioinformatically, and a total of five SlKAT genes and four SlMFP genes were identified (Table 1). Nevertheless, there are only three KAT genes and two MFP genes in A. thaliana [15,18]. Genome-wide replication multiplies the number of genes, which in turn leads to a multiplication of gene family members [25,26,27]. Hence, the enhanced numbers of SlKAT and SlMFP families may be caused by genome-wide replication. Moreover, the KAT and MFP genes were randomly distributed in tomato and A. thaliana chromosomes (Figure 4). As the differences in genome size across different species may lead to variations in the number of gene families, the enhanced members of the SlKAT and SlMFP families may be also caused by the larger genome size of the tomato than A. thaliana [25]. Meanwhile, SlKAT4 and SlKAT5 are located on the same chromosome and have the same number of motifs with similar distributions (Figure 2 and Figure 4). In addition, the results of the analysis of collinearity indicated a linear relationship between SlKAT4 and SlKAT5 (Figure 8A). Therefore, the increase in SlKAT genes may be related to gene duplication, which is similar to a previous study [25]. The collinearity analysis of the genes revealed that SlKAT5 is homologous in both A. thaliana and Populus tomentosa, which indicates that the SlKAT5 gene may have been inherited from an earlier plant, similar to a previous study (Figure 8B). Meanwhile, we analyzed the phylogenetic relationships within SlKAT and SlMFP members, respectively. The universal phylogenetic tree not only spans all extant life, but its root and earliest branching represent stages in the evolutionary process before modern cell types came into being [28]. We found that two SlKAT proteins (SlKAT2 and SlKAT3) and two SlMFP proteins (SlMFP2 and SlMFP4), respectively, clustered on the same branch of the phylogenetic tree (Figure 3), suggesting that these proteins are closely related.
In A. thaliana, AtMFP2 is a 79-kDa protein composed of three domains and a linker helix [14]. It forms a stable monomeric structure and resembles the mammalian peroxisomal MFE-1 in domain organization and size [14]. Nevertheless, the secondary structures of the SlKAT and SlMFP families in this study are predominantly α-helices (Table 4). In proteins, the α-helix plays a role in supporting and stabilizing the molecular structure [29,30]. Thus, the α-helices may lead to greater structural stability within the SlKAT and SlMFP family members. Genetic selection pressures contribute to understanding evolutionary relationships. Ka denotes the non-synonymous substitution rate, which is the incidence of non-synonymous mutations in the gene sequence [21]. Ks denotes the synonymous substitution rate, which is the incidence of synonymous mutations in a gene sequence [21]. Ka/Ks values can be used to measure the relative frequency of nonsynonymous and synonymous mutations, thus reflecting the selective pressure on genes during evolution [22]. Ka/Ks values less than 1 represent genes mainly from purification selection. We performed Ka/Ks analysis on the SlKAT and SlMFP family genes, and we found that the Ka/Ks values in both the SlKAT and SlMFP genes were less than 1 (Figure 9). This indicates that the SlKAT and SlMFP family genes in tomato species stem mainly from purifying selection, which makes them more evolutionarily conserved, structurally stable, and potentially more functionally consistent. Thus, SlKAT and SlMFP members are more evolutionarily conserved and structurally stable, suggesting that they may be functionally aligned. In the analysis of conserved motifs in tomato SlKAT and SlMFP proteins, we found that the 10 conserved motifs identified were neatly aligned from n-terminal to c-terminal and fixed in position (Figure 2). Hence, SlKAT and SlMFP members may be highly conserved. As for gene structure, the SlKAT genes and the SlMFP genes have a similar exon–intron structure within their family members in tomatoes (Figure 1). In previous studies, the gene structures of MFP family members were found to be highly conserved in A. thaliana [15]. Moreover, AIM1 and AtMFP2 have both 2-trans-enoyl-coenzyme hydrogenase and L-3-hydroxyacetyl-coenzyme dehydrogenase activities in A. thaliana. In cucumber, the CsMFPa gene shares 56% sequence identity with AtMFP2, as well as 75% sequence identity with AIM1 over its gene sequence [14]. Similarly, CsMFPa possesses similar enzyme activities as AIM1 and AtMFP2 [14]. Hence, the similar gene sequences of the SlKAT and SlMFP genes suggest a similar protein function in SlKAT and SlMFP members, respectively, which need further identification.
According to the results of tissue-specific expression, the SlKAT and SlMFP family genes were expressed in all the detected tomato tissues, including the leaves, roots, flowers, and fruits of different developmental stages, except for SlMFP1 (Figure 7). There are three genes encoding KAT in A. thaliana, including AtKAT1, AtKAT2, and AtKAT5. In particular, AtKAT2 is highly expressed throughout the life cycle, especially in the later stages of flower and seed development [18]. Among the SlKAT family members, SlKAT5 was highly expressed in various fruit development stages, including Breaker Fruit, Breaker Fruit + 10, Pimpinellifolium Breaker Fruit and Pimpinellifolium Breaker + 5 Fruit (Figure 7). ABA has an important effect on the accumulation of flavonoids and carotenoids during tomato fruit ripening [31]. In addition, the presence of ABA increases fruit firmness by modifying the tomato cell wall [32], and AtKAT2 has a positive regulatory effect on ABA signaling [33]. In our study, SlKAT5 was significantly up-regulated in response to ABA treatment. Thus, SlKAT5 may take part in plant reproductive development, which may imply the role of SlKAT5 in tomato yield regulation. However, whether SlKAT5 regulates fruit ripening by directly participating in the ABA response needs to be uncovered in the future. In addition, the expression level of A. thaliana AtKAT5 is high in young flowers [18]. In our study, the transcriptional level of SlKAT4 was the most abundant in unopened flower buds (Figure 7). Thus, the physiological functions of tomato SlKAT4 and A. thaliana AtKAT5 in the development of floral organs may be identical, which needs to be studied further. In A. thaliana, the functional deletion of AIM1 resulted in abnormal inflorescence development and abnormal formation of inflorescence meristem organization [15]. In our study, the expression level of SlMFP4 was the most abundant in Unopened Flower Buds and Fully Opened Flowers (Figure 7), suggesting a similar role of SlMFP4 and AIM1 in plant floral organ development. In addition, whether the absence of the SlMFP4 gene will lead to abnormal development of tomato floral organs, thereby affecting plant fertility, requires further in-depth research. It should be noted that the flowering and fruiting of plants are complex processes regulated by various factors such as light, temperature, water, and nutrients. In practical applications, it is necessary to consider the plant’s growth environment and physiological status, as well as the complexity of gene regulation, in order to better achieve the goal of increasing yield. However, the accurate activities of SlKAT and SlMFP family members within leaves, roots, flowers, and fruits during tomato growth and development still need to be investigated.
The β-oxidation enzyme KAT2 has been reported to promote ABA responses, including inhibition of seed germination, post-germinative growth arrest, and stomatal closure in A. thaliana [1]. In plants, β-oxidation is a source of H2O2 in peroxisomes, and ROS (including H2O2) are known to be involved in ABA signaling [1]. In addition, ABA negatively regulates KAT2-mediated ROS generation [33]. In the studied tomatoes, the expression levels of SlKAT3, SlKAT4, and SlKAT5 were significantly up-regulated under ABA treatment (Figure 10A). Thus, SlKAT may be regulated by ABA during tomato seedling growth. It is known that fatty acid β-oxidation is involved in the synthesis of the lipid signaling molecule MeJA from acrylic acid [16,19,34]. MeJA is a methyl-esterified product of JA, which is mainly involved in regulating insect resistance and responses to adverse stress in plants [6,20,35]. In the present study, the results of the cis-acting elements showed that SlKAT5 and SlMFP4 responded most significantly to MeJA (Figure 6). However, we found that the expressions of SlKAT with SlMFP family members were not up-regulated under MeJA treatment, except for SlKAT3 and SlKAT5 under 12 h of treatment. (Figure 10B). The results of MeJA treatment were not consistent with those of the cis-acting element. Therefore, the role of SlKAT and SlMFP in the regulation of MeJA in tomatoes remains to be investigated.
By now, the role of SlKAT and SlMFP members in abiotic stresses has not been thoroughly studied in tomatoes. In the present article, the influences of various abiotic stresses on the transcript abundance of SlKAT and SlMFP genes were detected. Light is crucial for plant life, and the perception of light dictates plant growth, morphology, and developmental changes [36]. In our study, there were eight cis-acting components in the SlKAT and SlMFP families, respectively, that deal with light response. Except for SlKAT5, the expression of other genes in tomato SlKAT and SlMFP was down-regulated under dark conditions (Figure 11A). Hence, we hypothesize that under dark conditions, the expressions of the SlKAT and SlMFP genes are reduced, which may lead to a decrease in fatty acid β-oxidation activities [37]. Salt stress decreases the photosynthesis and respiration rates of plants [38]. Drought is one of the major constraints limiting crop production worldwide [39]. Enhanced fatty acid β-oxidation induces ROS production, which can negatively affect plant survival in unfavorable environments [37]. Increased fatty acid access to the β-oxidation pathway decreases plant resistance to salt stress. We found that SlKAT4 and SlKAT5 were significantly induced by NaCl (Figure 11B) and drought stress (Figure 11C). Thus, we hypothesize that SlKAT4 and SlKAT5 play a great role in responding to salt stress and drought stress in tomatoes. There are three proteins (ACX, MFP, and KAT) that are involved in fatty acid β-oxidation, and it is known that UV treatment up-regulates ACX gene expression [24]. While ACX genes function to alleviate UV stress, SlKAT and SlMFP family members may have the same response pattern to UV. This conjecture can be verified by Figure 11D, which shows that all gene expressions except SlKAT2 were up-regulated. Tomato plants have limited ability to acclimatize to temperature changes [40]. Under cold treatment conditions (Figure 11E), the expressions of the SlKAT1/2 and SlMFP4 were up-regulated. In contrast, under heat-treated conditions (Figure 11F), the expression of the SlKAT3/4/5 and SlMFP3 was up-regulated. As the expression patterns of SlKAT and SlMFP were opposite under the cold and heat treatments, we conclude that the KAT and MFP family genes in tomatoes may be involved in physiological activities under low-temperature environments and have some mitigating effect on high-temperature stress. However, the specific functions of SlKAT and SlMFP under cold- and high-temperature stress need to be investigated further. The fatty acid β-oxidation pathway is the main source of H2O2 in peroxisomes [2,5,10]. Catalase plays a role in the production of hydrogen peroxide by peroxisomes, and three genes encoding catalases have been identified in A. thaliana and other plants, of which CAT1 is associated with fatty acid β-oxidation [41]. The activity of the fatty acid β-oxidases KAT and MFP may affect the expression of the CAT1 gene, which in turn affects catalase activity and hence, hydrogen peroxide production. The expression of SlKAT3, SlKAT4, SlKAT5, and SlMFP1 was up-regulated under H2O2 treatment (Figure 11G). We hypothesize that these four genes play a role in alleviating H2O2 stress. In addition, ACX4, KAT2, and MFP2 proteins involved in fatty acid β-oxidation are also involved in the ROS1-mediated DNA demethylation process in A. thaliana [42]. What is more, DNA demethylation in plants plays a role in many important processes, including fruit ripening and biotic and abiotic stress responses [43]. In our study, the results of the tomato tissue expression analysis showed that SlKAT5 genes were highly expressed in fruits (Figure 7), while the expression of SlKAT4, SlKAT5, and SlMFP1 was obviously altered under the salt stress treatment (Figure 10). Thus, our study may provide some theoretical basis for KAT and MFP genes in tomato fruit development and the mitigation of salt stress. However, whether KAT and MFP proteins regulate fruit development and the salt stress response through DNA demethylation still needs to be discovered. It is well known that understanding the intricate relationship between light conditions, gene expression, and physiological responses in plants is essential for optimizing growth conditions and enhancing crop productivity. By investigating these interactions, we can gain valuable insights into the molecular mechanisms underlying plant responses to environmental stimuli, ultimately contributing to strategies for improving biomass and yield in agricultural settings. Thus, the mechanism by which tomato SlKAT and SlMFP respond to light may be important for fruit yield and needs to be further uncovered. Meanwhile, the tomato SlKAT and SlMFP gene families have important potential functions in hormonal and abiotic stress responses. This may be a focus for future research, but the specific functions of these genes remain to be investigated by further studies.

4. Materials and Methods

4.1. Genome-Wide Identification of MFP and KAT Gene Family Members in Tomatoes

Firstly, the tomato genome sequence and ITG4.0 annotation information were downloaded from the online database Phytozome v13 (https://phytozome.jgi.doe.gov/pz/ (accessed on 6 May 2023)), [44]. Then, tomato KAT and MFP protein sequences were extracted by using ‘GXF sequence extract’ and ‘Batch Translate CDS’ in TBtools (Toolbox for ecological battle) v2.034 software. The A. thaliana KAT and MFP protein sequences were downloaded from the online database TAIR (https://www.arabidopsis.org/index.jsp (accessed on 6 May 2023)). The collected tomato and A. thaliana protein sequences were then subjected to unidirectional BLAST using the ‘BLAST GUI Wrapper’ function in TBtools software (v2.034), and the corresponding bidirectional BLAST was performed using the NCBI database (https://www.ncbi.nlm.nih.gov/ (accessed on 6 May 2023)). Next, the ‘Blast Xml to Table’ function in TBtools software (v2.034) was utilized to obtain the possible gene family members of tomato SlMFP and SlKAT. In detail, the structural domains of the MFP and KAT proteins of the tomato were verified using the SMART database (http://smart.embl-heidelberg.de/ (accessed on 6 May 2023)), and the tomato SlMFP and SlKAT gene family members were screened according to the conserved structural domains [45,46].

4.2. Gene Structure and Chromosomal Localization

Firstly, we analyzed the gene structures of each member of SlKAT and SlMFP using the ‘Visualize Gene Structure (from GTF/GFF3 File)’ function in TBtools software (v2.034) [47,48]. Then, the gene location was visualized by using the ‘Gene Location Visualize from GTF/GFF file’ function in Tbtools software (v2.034). Finally, the chromosomal location of each tomato SlKAT and SlMFP gene member was mapped to the tomato genome and renamed based on the chromosomal distribution.

4.3. Gene Structure and Protein Conserved Domain Analysis

The gene structure of each member in the SlKAT and SlMFP families was analyzed using the ‘Visualize Gene Structure (from GTF/GFF3 File)’ function in TBtools software (v2.034). All the protein sequences of tomato SlKAT and SlMFP were entered using the MEME (http://meme-suite.org/tools/meme (accessed on 13 May 2023)) online program and analyzed for conserved motifs of the tomato SlKAT and SlMFP family genes [49,50]. Finally, the conserved motifs of tomato SlKAT and SlMFP members were visualized and analyzed by the ‘Gene Structure View (Advances)’ function in TBtools software (v2.034).

4.4. Phylogenetic Analysis

The KAT and MFP protein sequences of A. thaliana, cucumber, and Populus tomentosa were downloaded via the online database TAIR and Phytozome v13 (https://phytozome.jgi.doe.gov/pz/ (accessed on 13 May 2023)). The phylogenetic trees containing 30 KAT protein sequences and 33 MFP protein sequences were, respectively, constructed using the neighbor-joining method in MEGA 7.0 software (v7.0.26) (Bootstrap parameter set to 1000) [51]. Additionally, the EvolView (https://evolgenius.info//evolview-v2/#login (accessed on 13 May 2023)) website was used to beautify the evolutionary trees.

4.5. Cis-Acting Element Analysis of the Tomato SlKAT and SlMFP Genes

We extracted and analyzed promoter sequences 2000 bp upstream of the tomato SlKAT and SlMFP genes. The sequences were analyzed for cis-acting elements through the Plant CARE online website (http://bioinformatics.psb.ugent.be/webtools/plantcare/html/(accessed on 18 May 2023)) and visualized using Tbtools [52].

4.6. Characterization of SlKAT and SlMFP Genes in Tomatoes

The data on chromosomal location, amino acid length, molecular weight, electric point, molecular formula, and other physicochemical characteristics of the tomato KAT and MFP protein sequences were studied through the online website Expasy (https://web.expasy.org/protparam/ (accessed on 18 May 2023)). The prediction of subcellular locations of the tomato KAT and MFP genes was analyzed online using WoLFPSORT (https://wolfpsort.hgc.jp/ (accessed on 18 May 2023)). The secondary structures of tomato KAT and MFP family proteins were examined using the online website prabi (http://www.prabi.fr/ (accessed on 18 May 2023)), and the relevant data were exported and imaged [47,48].

4.7. Analysis of Tissue Expression of SlKAT and SlMFP Genes in Tomatoes

Tissue expression information for the tomato SlKAT and SlMFP genes was obtained from the eFP (http://bar.utoronto.ca/efp/cgi-bin/efpWeb.cgi (accessed on 1 July 2023)) database. The eFP (http://bar.utoronto.ca/efp/cgi-bin/efpWeb.cgi (accessed on 1 July 2023)) database was searched for the IDs of the SlKAT and SlMFP genes. We obtained tissue-specific expression analysis information from the eFP database using the tomato SlKAT and SlMFP gene IDs. We organized data on the expression of SlKAT and SlMFP in different tissues of tomato and then used Tbtools to map the expression patterns of SlKAT and SlMFP in different tissues.

4.8. Ka (Nonsynonymous)/Ks (Synonymous) Analysis and Colinearity Analysis

The relationship between Ka (non-synonymous substitution rate) and Ks (synonymous substitution rate) was calculated using the CDS sequences and protein sequences of tomato KAT and MFP by using the ‘Simple Ka/Ks calculator (NG)’ function in TBtools software (v2.034) [47,48]. The online database Phytozome v13 (https://phytozome.jgi.doe.gov/pz/ (accessed on 1 July 2023)) was used to download genome files and annotation files for tomatoes and A. thaliana. The covariance between tomato and A. thaliana was then analyzed using the ‘One Step MCScanX’ function in Tbtools. Finally, the covariance between tomato and A. thaliana was visualized using the Advanced Circus function in Tbtools [22].

4.9. Plant Materials, Growth Conditions, and Stress Treatments

‘Micro-Tom’ is a tomato variety widely used in scientific research. ‘Micro-Tom’ is characterized by its small size, short growth cycle, small fruits, and a high degree of self-fertilization [53]. Here, ‘Micro-Tom’ tomato seeds with full grains and consistent sizes were selected and put into a 50 mL centrifuge tube and were surface sterilized with 1% NaClO solution for 10 min. The sterilized seeds were put into a 250 mL conical flask filled with 100 mL sterile water and then placed in a HYG-C type shaker and cultured at a rotation speed of 180 r min−1 at 25 °C for 3 days. The sterile water was changed once a day. The germinated tomato seeds were planted in a hole dish containing nutrient soil and placed in a growth chamber. The light intensity in the growth chamber was 250 mol photons m−2 s−1, and the temperature was 26 ± 2 °C for 16 h during the day and 20 ± 2 °C for 8 h at night. The relative humidity was 60%. Plant material was grown for a fortnight and then transplanted from soil to nutrient solution for hydroponics. Then, 21-day-old seedlings with uniform size were used for the subsequent treatments.
For the salt, ABA, H2O2, MeJA, and drought stress treatments, the selected seedlings were transferred to 1/2 nutrient solution containing 200 mM NaCl, 100 mM ABA, 10% (w/v) (2.94 M) hydrogen peroxide (H2O2), 100 mM MeJA, and 20% (w/v) PEG6000, respectively. All the seedlings were grown in the same conditions as the growth chamber. For the cold and heat treatments, the seedlings were grown in the same 1/2 nutrient solution and were put into growth chambers at 4 °C and 40 °C, respectively. For the dark treatment, the seedlings were moved into a dark growth chamber with the same growth condition as above. For the UV treatment, the selected seedlings were transferred to a growth chamber equipped with 253.7 nm UV-C radiation by a UV-C lamp (Philips Corporation, Poland), and the other growth conditions were the same as the control. After 6, 12, and 24 h, the aboveground parts of the treated seedlings in each replication were harvested separately, frozen with liquid nitrogen, and then stored at −80 °C, respectively. The plants in the 0 h treatment of each treated group were used as controls. The materials for the control group and the experimental group were stored in the same manner. Each treatment of each treated time contained three biological replicates, and each replicate consisted of eight seedlings. All the plants were tested at the same seedling stage to ensure that treatment effects were assessed at the same physiological stage. The experimental groups varied in their different treatments and treatment times.

4.10. RNA Isolation and qRT-PCR

Total RNA was extracted from the samples using TRIzol reagent (Invitrogen, Carlsbad, CA, USA) [26,27]. The purity and concentration of RNA were then examined by a Pultton P100+ ultra-micro spectrophotometer (Wuzhou Dongfang, Beijing, China). The A260/A280 ratios of the RNA samples between 2.0 and 2.1 were chosen for the subsequent experiments. Then, the FastQuant First Strand cDNA Synthesis Kit (Tianen, Beijing, China) was used to synthesize cDNA. These reactions were executed under the following conditions: 37 °C for 15 min, 85 °C for 5 s, and then finally ended at 4 °C. The SYBR Green Premix Pro Taq HS Premix kit was used for qRT-PCR with a LightCycler 480 Real-Time PCR System (Roche Applied Science, Penzberg, Germany). The qRT-PCR reaction system contained 10 μL 2 × SYBR Green Pro Taq HS Premix, 0.4 μL primer F, 0.4 μL primer R, 2 μL cDNA, and 7.2 μL ddH2O. The primers used in qRT-PCR were designed with Primer Premier 5.0 (Premier Biosoft Corporation, USA), and the internal reference was SlActin (NC015447.3), which showed a stable expression level among all the samples tested in our previous study [45]. The sequences of the above primers are listed in Table S1. The 2−∆∆CT calculation method was used to quantify the relative expression of each gene as described in Schnittger, T.D. [54]. The relative expression values of each gene under each treatment at different treated times were calculated by comparing them with those at 0 h. All experiments in our study were repeated three times independently to ensure the reliability and statistical significance of the results.

5. Conclusions

In this study, we identified a total of five KAT and four MFP genes in tomatoes and analyzed their physicochemical properties, secondary structure, conserved motifs, cis-acting elements, evolutionary relationships, covariance, evolutionary selection pressures, and expression patterns. We found that tomato KAT and MFP genes are highly conserved and have important roles in mitigating adversity stresses and hormone responses. Our research proposes the roles of KAT and MFP genes in tomato growth and adversity stress responses, providing a theoretical foundation for further exploration of fatty acid β-oxidases in tomato plants.

Supplementary Materials

The following are available online at https://www.mdpi.com/article/10.3390/ijms25042273/s1.

Author Contributions

Conceptualization L.L. and Z.L.; collection and analysis of the bibliography, X.P., K.Y. and Y.W.; writing—original draft preparation, X.P. and L.L.; writing original draft, W.L., T.Y., L.L., G.H. and C.W. All authors have read and agreed to the published version of the manuscript.

Funding

This work was supported by the National Natural Science Foundation of China (32102370); the Fuxi Young Talents Fund of Gansu Agricultural University (Gaufx-03Y07); the Natural Science Foundation of Gansu Province, China (No. 23JRRA1406); and the Key Research and Development Program of Gansu Province, China (No. 21YF5WA096).

Institutional Review Board Statement

Not applicable.

Informed Consent Statement

Not applicable.

Data Availability Statement

All data, tables, and figures in this manuscript are original, and are contained within the article and Supplementary Materials.

Conflicts of Interest

The authors declare no conflicts of interest.

References

  1. Pan, R.; Liu, J.; Hu, J. Peroxisomes in plant reproduction and seed-related development. J. Integr. Plant Biol. 2019, 61, 784–802. [Google Scholar] [CrossRef]
  2. Charlton, W.L.; Johnson, B.; Graham, I.A.; Baker, A. Non-coordinate expression of peroxisome biogenesis, β-oxidation and glyoxylate cycle genes in mature Arabidopsis plants. Plant Cell Rep. 2004, 23, 647–653. [Google Scholar] [CrossRef] [PubMed]
  3. Cassin-Ross, G.; Hu, J. Systematic Phenotypic Screen of Arabidopsis Peroxisomal Mutants Identifies Proteins Involved in β-Oxidation. Plant Physiol. 2014, 166, 1546–1559. [Google Scholar] [CrossRef]
  4. Kaur, N.; Reumann, S.; Hu, J. Peroxisome Biogenesis and Function. Arab. Book 2009, 7, e0123. [Google Scholar] [CrossRef] [PubMed]
  5. Eastmond, P.J.; Hooks, M.; Graham, I.A. The Arabidopsis acyl-CoA oxidase gene family. Biochem. Soc. Trans. 2000, 28, 755–757. [Google Scholar] [CrossRef]
  6. Wasternack, C.; Parthier, B. Jasmonate-signalled plant gene expression. Trends Plant Sci. 1997, 2, 302–307. [Google Scholar] [CrossRef]
  7. Holtman, W.L.; Heistek, J.C.; Mattern, K.A.; Bakhuizen, R.; Douma, A.C. β-oxidation of fatty acids is linked to the glyoxylate cycle in the aleurone but not in the embryo of germinating barley. Plant Sci. 1994, 99, 43–53. [Google Scholar] [CrossRef]
  8. Fosså, A.; Beyer, A.; Pfitzner, E.; Wenzel, B.; Kunau, W.H. Molecular cloning, sequencing and sequence analysis of the fox-2 gene of Neurospora crassa encoding the multifunctional β-oxidation protein. Mol. Gen. Genet. 1995, 247, 95–104. [Google Scholar] [CrossRef] [PubMed]
  9. Castillo, M.C.; Martínez, C.; Buchala, A.; Métraux, J.-P.; León, J. Gene-Specific Involvement of β-Oxidation in Wound-Activated Responses in Arabidopsis. Plant Physiol. 2004, 135, 85–94. [Google Scholar] [CrossRef]
  10. Eastmond, P.J.; Graham, I.A. The multifunctional protein At MFP2 is co-ordinately expressed with other genes of fatty acid β-oxidation during seed germination in Arabidopsis thaliana (L.) Heynh. Biochem. Soc. Trans. 2000, 28, 95–99. [Google Scholar] [CrossRef]
  11. Chu, C.; Mao, L.F.; Schulz, H. Estimation of peroxisomal β-oxidation in rat heart by a direct assay of acyl-CoA oxidase. Biochem. J. 1994, 302, 23–29. [Google Scholar] [CrossRef]
  12. Pinfield-Wells, H.; Rylott, E.L.; Gilday, A.D.; Graham, S.; Job, K.; Larson, T.R.; Graham, I.A. Sucrose rescues seedling establishment but not germination of Arabidopsis mutants disrupted in peroxisomal fatty acid catabolism. Plant J. 2005, 43, 861–872. [Google Scholar] [CrossRef] [PubMed]
  13. Rylott, E.L.; Rogers, C.A.; Gilday, A.D.; Edgell, T.; Larson, T.R.; Graham, I.A. Arabidopsis Mutants in Short- and Medium-chain Acyl-CoA Oxidase Activities Accumulate Acyl-CoAs and Reveal That Fatty Acid β-Oxidation Is Essential for Embryo Development. J. Biol. Chem. 2003, 278, 21370–21377. [Google Scholar] [CrossRef] [PubMed]
  14. Arent, S.; Christensen, C.E.; Pye, V.E.; Nørgaard, A.; Henriksen, A. The Multifunctional Protein in Peroxisomal β-Oxidation. J. Biol. Chem. 2010, 285, 24066–24077. [Google Scholar] [CrossRef] [PubMed]
  15. Richmond, T.A.; Bleecker, A.B. A Defect in β-Oxidation Causes Abnormal Inflorescence Development in Arabidopsis. Plant Cell 1999, 11, 1911–1923. [Google Scholar] [PubMed]
  16. Afitlhile, M.M.; Fukushige, H.; Nishimura, M.; Hildebrand, D.F. A defect in glyoxysomal fatty acid β-oxidation reduces jasmonic acid accumulation in Arabidopsis. Plant Physiol. Biochem. 2005, 43, 603–609. [Google Scholar] [CrossRef] [PubMed]
  17. Wang, Z.-Y.; Soanes, D.M.; Kershaw, M.J.; Talbot, N.J. Functional Analysis of Lipid Metabolism in Magnaporthe grisea Reveals a Requirement for Peroxisomal Fatty Acid β-Oxidation During Appressorium-Mediated Plant Infection. Mol. Plant-Microbe Interact. 2007, 20, 475–491. [Google Scholar] [CrossRef] [PubMed]
  18. Wiszniewski, A.A.G.; Smith, S.M.; Bussell, J.D. Conservation of two lineages of peroxisomal (Type I) 3-ketoacyl-CoA thiolases in land plants, specialization of the genes in Brassicaceae, and characterization of their expression in Arabidopsis thaliana. J. Exp. Bot. 2012, 63, 6093–6103. [Google Scholar] [CrossRef] [PubMed]
  19. Castillo, M.C.; León, J. Expression of the β-oxidation gene 3-ketoacyl-CoA thiolase 2 (KAT2) is required for the timely onset of natural and dark-induced leaf senescence in Arabidopsis. J. Exp. Bot. 2008, 59, 2171–2179. [Google Scholar] [CrossRef]
  20. Theodoulou, F.L.; Job, K.; Slocombe, S.P.; Footitt, S.; Holdsworth, M.; Baker, A.; Larson, T.R.; Graham, I.A. Jasmonic Acid Levels Are Reduced in COMATOSE ATP-Binding Cassette Transporter Mutants. Implications for Transport of Jasmonate Precursors into Peroxisomes. Plant Physiol. 2005, 137, 835–840. [Google Scholar] [CrossRef]
  21. Xing, Y.; Lee, C. Assessing the application of Ka/Ks ratio test to alternatively spliced exons. Bioinformatics 2005, 21, 3701–3703. [Google Scholar] [CrossRef] [PubMed]
  22. Guo, L.; Lu, S.; Liu, T.; Nai, G.; Ren, J.; Gou, H.; Chen, B.; Mao, J. Genome-Wide Identification and Abiotic Stress Response Analysis of PP2C Gene Family in Woodland and Pineapple Strawberries. Int. J. Mol. Sci. 2023, 24, 4049. [Google Scholar] [CrossRef] [PubMed]
  23. Moerkercke, A.V.; Schauvinhold, I.; Pichersky, E.; Haring, M.A.; Schuurink, R.C. A plant thiolase involved in benzoic acid biosynthesis and volatile benzenoid production. Plant J. 2009, 60, 292–302. [Google Scholar] [CrossRef]
  24. Rylott, E.L.; Eastmond, P.J.; Gilday, A.D.; Slocombe, S.P.; Larson, T.R.; Baker, A.; Graham, I.A. The Arabidopsis thaliana multifunctional protein gene (MFP2) of peroxisomal β-oxidation is essential for seedling establishment. Plant J. 2006, 45, 930–941. [Google Scholar] [CrossRef] [PubMed]
  25. Gao, R.; Luo, Y.; Pan, X.; Wang, C.; Liao, W. Genome-wide identification of SHMT family genes in cucumber (Cucumis sativus L.) and functional analyses of CsSHMTs in response to hormones and abiotic stresses. 3 Biotech 2022, 12, 305. [Google Scholar] [CrossRef] [PubMed]
  26. Pan, X.; Wang, C.; Liu, Z.; Gao, R.; Feng, L.; Li, A.; Yao, K.; Liao, W. Identification of ABF/AREB gene family in tomato (Solanum lycopersicum L.) and functional analysis of ABF/AREB in response to ABA and abiotic stresses. PeerJ 2023, 11, e15310. [Google Scholar] [CrossRef]
  27. Liu, Z.; Pan, X.; Wang, C.; Yun, F.; Huang, D.; Yao, Y.; Gao, R.; Ye, F.; Liu, X.; Liao, W. Genome-wide identification and expression analysis of serine hydroxymethyltransferase (SHMT) gene family in tomato (Solanum lycopersicum). PeerJ 2022, 10, e12943. [Google Scholar] [CrossRef]
  28. Woese, C.R. Interpreting the universal phylogenetic tree. Proc. Natl. Acad. Sci. USA 2000, 97, 8392–8396. [Google Scholar] [CrossRef]
  29. Ptitsyn, O.B.; Finkelstein, A.V. Theory of protein secondary structure and algorithm of its prediction. Biopolymers 2004, 22, 15–25. [Google Scholar] [CrossRef]
  30. Srinivasan, R.; Rose, G.D. A physical basis for protein secondary structure. Proc. Natl. Acad. Sci. USA 1999, 96, 14258–14263. [Google Scholar] [CrossRef] [PubMed]
  31. Fenn, M.A.; Giovannoni, J.J. Phytohormones in fruit development and maturation. Plant J. 2021, 105, 446–458. [Google Scholar] [CrossRef]
  32. Kou, X.; Zhou, J.; Wu, C.E.; Yang, S.; Liu, Y.; Chai, L.; Xue, Z. The interplay between ABA/ethylene and NAC TFs in tomato fruit ripening: A review. Plant Mol. Biol. 2021, 106, 223–238. [Google Scholar] [CrossRef] [PubMed]
  33. Jiang, T.; Zhang, X.-F.; Wang, X.-F.; Zhang, D.-P. Arabidopsis 3-Ketoacyl-CoA Thiolase-2 (KAT2), an Enzyme of Fatty Acid β-Oxidation, is Involved in ABA Signal Transduction. Plant Cell Physiol. 2011, 52, 528–538. [Google Scholar] [CrossRef] [PubMed]
  34. Pietrocola, F.; Galluzzi, L.; Bravo-San Pedro, J.M.; Madeo, F.; Kroemer, G. Acetyl Coenzyme A: A Central Metabolite and Second Messenger. Cell Metab. 2015, 21, 805–821. [Google Scholar] [CrossRef] [PubMed]
  35. Yu, M.; Shen, L.; Fan, B.; Zhao, D.; Zheng, Y.; Sheng, J. The effect of MeJA on ethylene biosynthesis and induced disease resistance to Botrytis cinerea in tomato. Postharvest Biol. Technol. 2009, 54, 153–158. [Google Scholar] [CrossRef]
  36. de Wit, M.; Galvão, V.C.; Fankhauser, C. Light-Mediated Hormonal Regulation of Plant Growth and Development. Annu. Rev. Plant Biol. 2016, 67, 513–537. [Google Scholar] [CrossRef] [PubMed]
  37. Yu, L.; Fan, J.; Xu, C. Peroxisomal fatty acid β-oxidation negatively impacts plant survival under salt stress. Plant Signal. Behav. 2019, 14, 1561121. [Google Scholar] [CrossRef] [PubMed]
  38. Jouyban, Z. The effects of salt stress on plant growth. Tech. J. Eng. Appl. Sci. 2012, 2, 7–10. [Google Scholar]
  39. Farooq, M.; Hussain, M.; Wahid, A.; Siddique, K.H.M. Drought Stress in Plants: An Overview. In Plant Responses to Drought Stress: From Morphological to Molecular Features; Aroca, R., Ed.; Springer: Berlin/Heidelberg, Germany, 2012; pp. 1–33. [Google Scholar]
  40. Adams, S. Effect of Temperature on the Growth and Development of Tomato Fruits. Ann. Bot. 2001, 88, 869–877. [Google Scholar] [CrossRef]
  41. del Río, L.A.; López-Huertas, E. ROS Generation in Peroxisomes and its Role in Cell Signaling. Plant Cell Physiol. 2016, 57, 1364–1376. [Google Scholar] [CrossRef]
  42. Le, T.-N.; Schumann, U.; Smith, N.A.; Tiwari, S.; Au, P.C.K.; Zhu, Q.-H.; Taylor, J.M.; Kazan, K.; Llewellyn, D.J.; Zhang, R.; et al. DNA demethylases target promoter transposable elements to positively regulate stress responsive genes in Arabidopsis. Genome Biol. 2014, 15, 458. [Google Scholar] [CrossRef]
  43. Wang, L.; Wang, C.; Liu, X.; Cheng, J.; Li, S.; Zhu, J.-K.; Gong, Z. Peroxisomal β-oxidation regulates histone acetylation and DNA methylation in Arabidopsis. Proc. Natl. Acad. Sci. USA 2019, 116, 10576–10585. [Google Scholar] [CrossRef] [PubMed]
  44. Goodstein, D.M.; Shu, S.; Howson, R.; Neupane, R.; Hayes, R.D.; Fazo, J.; Mitros, T.; Dirks, W.; Hellsten, U.; Putnam, N.; et al. Phytozome: A comparative platform for green plant genomics. Nucleic Acids Res. 2012, 40, D1178–D1186. [Google Scholar] [CrossRef]
  45. Yao, K.; Yao, Y.; Ding, Z.; Pan, X.; Zheng, Y.; Huang, Y.; Zhang, Z.; Li, A.; Wang, C.; Li, C.; et al. Characterization of the FLA Gene Family in Tomato (Solanum lycopersicum L.) and the Expression Analysis of SlFLAs in Response to Hormone and Abiotic Stresses. Int. J. Mol. Sci. 2023, 24, 16063. [Google Scholar] [CrossRef] [PubMed]
  46. Li, Z.; Shen, J.; Liang, J. Genome-Wide Identification, Expression Profile, and Alternative Splicing Analysis of the Brassinosteroid-Signaling Kinase (BSK) Family Genes in Arabidopsis. Int. J. Mol. Sci. 2019, 20, 1138. [Google Scholar] [CrossRef] [PubMed]
  47. Chen, C.; Chen, H.; Zhang, Y.; Thomas, H.R.; Frank, M.H.; He, Y.; Xia, R. TBtools: An Integrative Toolkit Developed for Interactive Analyses of Big Biological Data. Mol. Plant 2020, 13, 1194–1202. [Google Scholar] [CrossRef] [PubMed]
  48. Chen, J.; Huang, X.Y.; Salt, D.E.; Zhao, F.J. Mutation in OsCADT1 enhances cadmium tolerance and enriches selenium in rice grain. New Phytol. 2020, 226, 838–850. [Google Scholar] [CrossRef]
  49. Liu, Y.; Wen, H.; Qi, X.; Zhang, X.; Zhang, K.; Fan, H.; Tian, Y.; Hu, Y.; Li, Y. Genome-wide identification of the Na+/H+ exchanger gene family in Lateolabrax maculatus and its involvement in salinity regulation. Comp. Biochem. Physiol. Part D Genom. Proteom. 2019, 29, 286–298. [Google Scholar] [CrossRef]
  50. Liu, K.; Yuan, C.; Li, H.; Lin, W.; Yang, Y.; Shen, C.; Zheng, X. Genome-wide identification and characterization of auxin response factor (ARF) family genes related to flower and fruit development in papaya (Carica papaya L.). BMC Genom. 2015, 16, 901. [Google Scholar] [CrossRef]
  51. Kumar, S.; Stecher, G.; Tamura, K. MEGA7: Molecular Evolutionary Genetics Analysis Version 7.0 for Bigger Datasets. Mol. Biol. Evol. 2016, 33, 1870–1874. [Google Scholar] [CrossRef]
  52. Song, Z.; Pan, F.; Lou, X.; Wang, D.; Yang, C.; Zhang, B.; Zhang, H. Genome-wide identification and characterization of Hsp70 gene family in Nicotiana tabacum. Mol. Biol. Rep. 2019, 46, 1941–1954. [Google Scholar] [CrossRef] [PubMed]
  53. Marti, E. Genetic and physiological characterization of tomato cv. Micro-Tom. J. Exp. Bot. 2006, 57, 2037–2047. [Google Scholar] [CrossRef] [PubMed]
  54. Schmittgen, T.D.; Livak, K.J. Analyzing real-time PCR data by the comparative C(T) method. Nat. Protoc. 2008, 3, 1101–1108. [Google Scholar] [CrossRef] [PubMed]
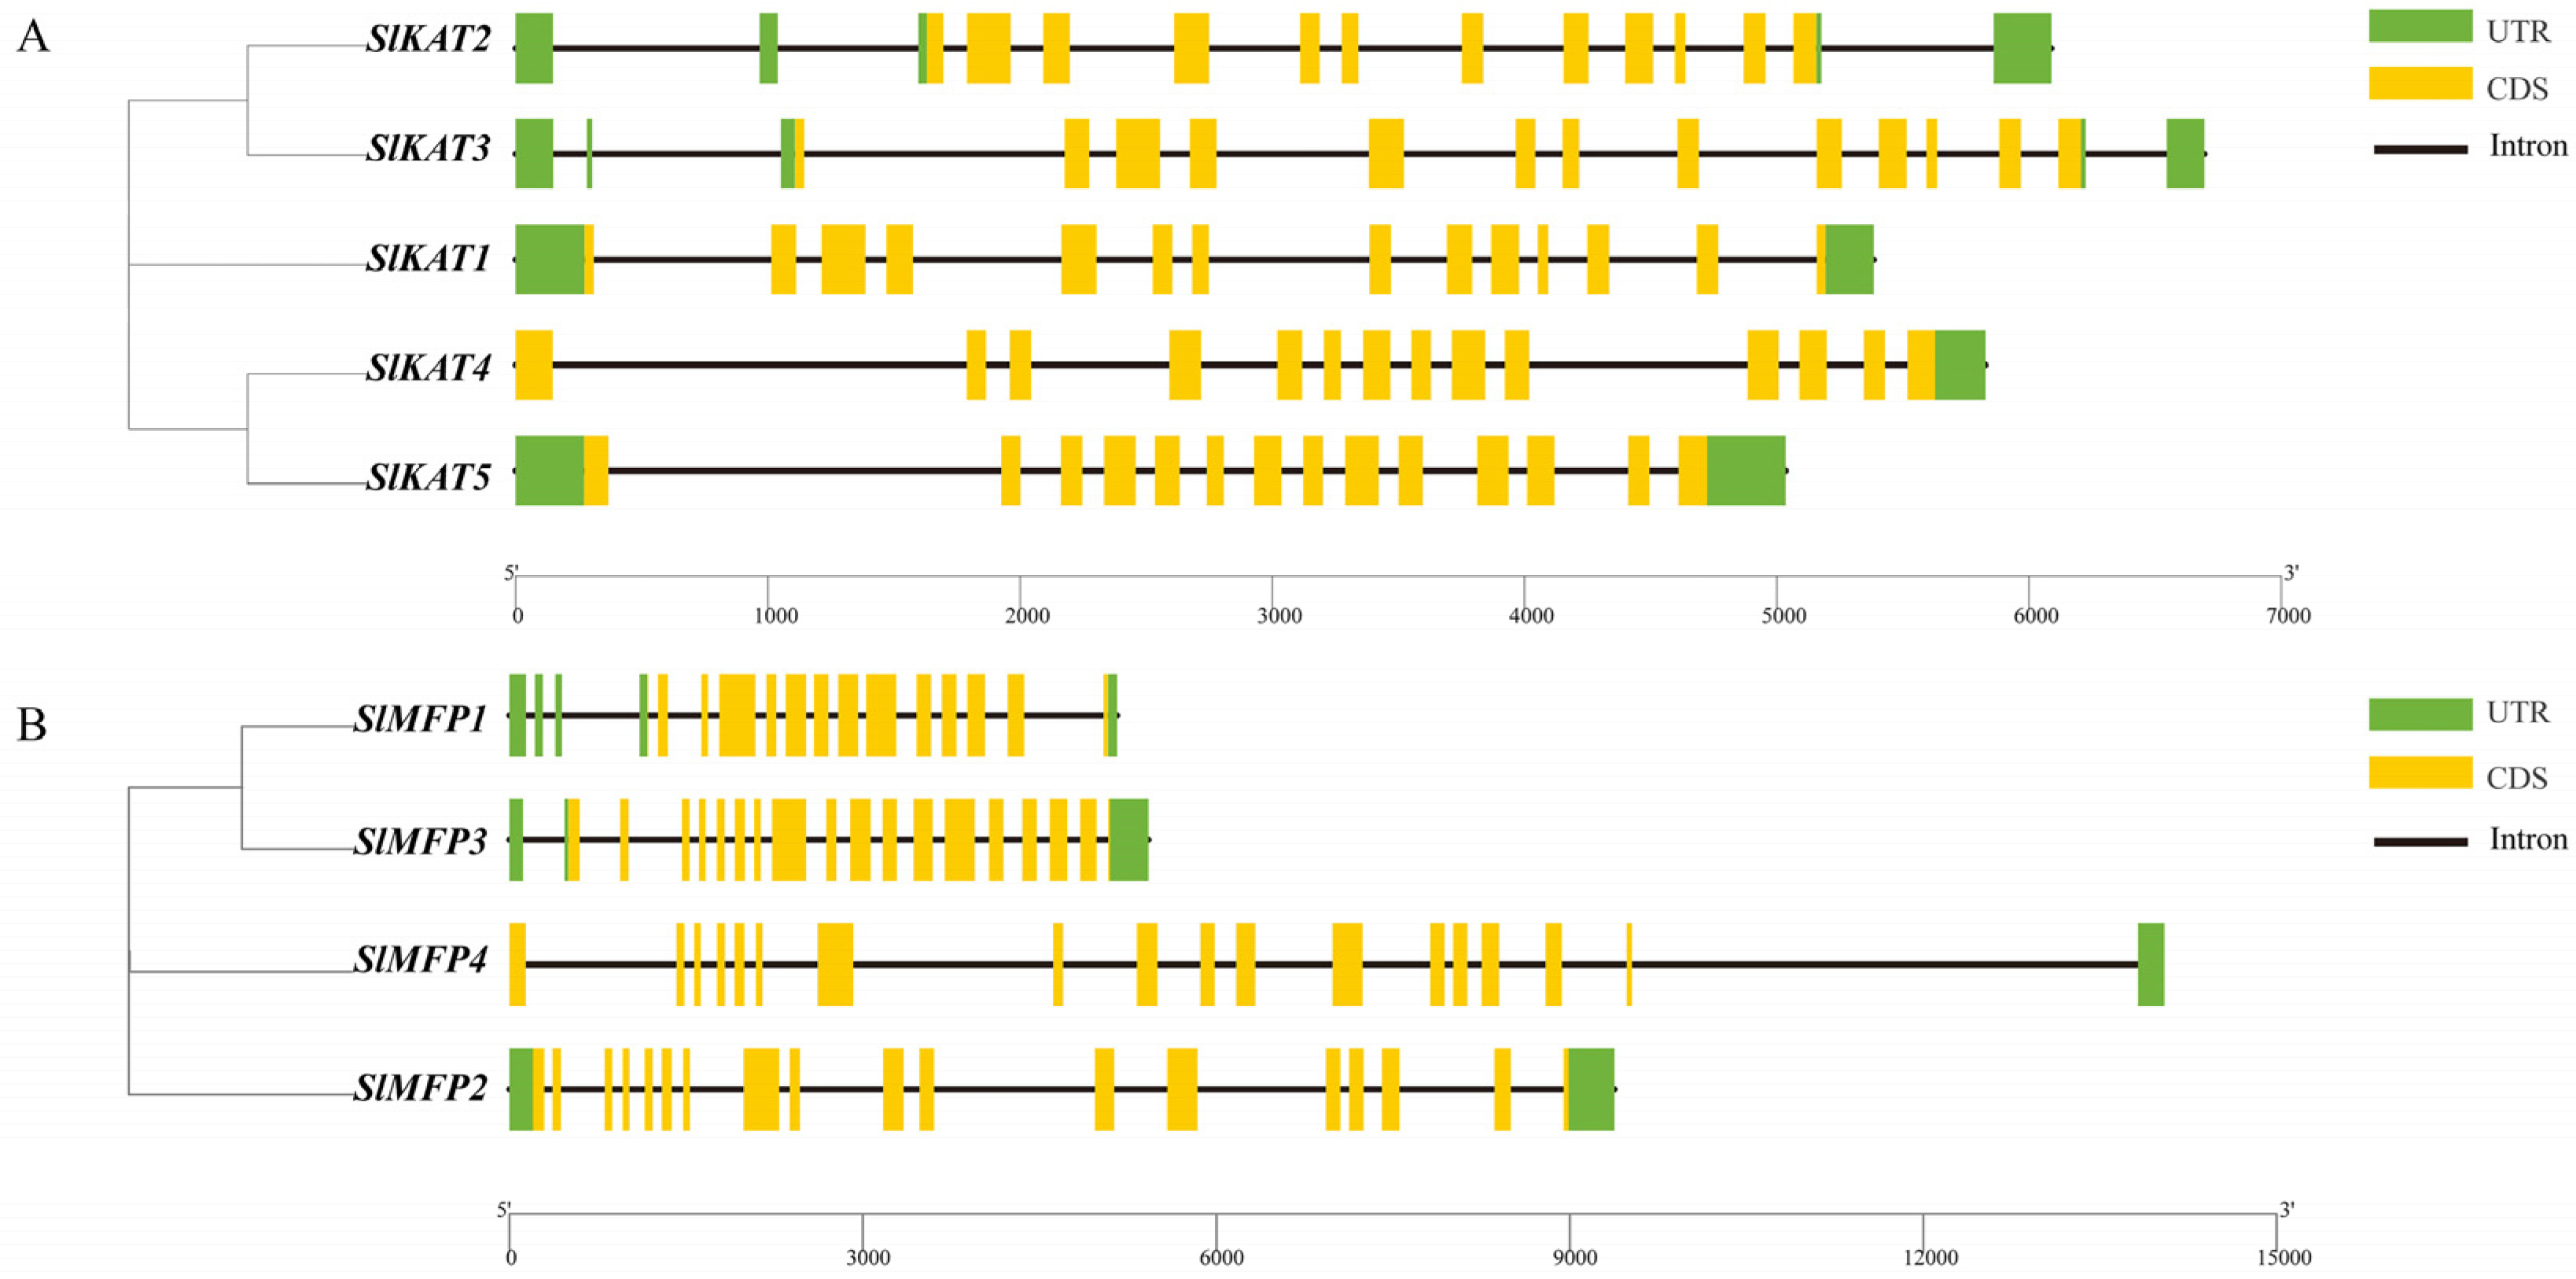
Figure 1. Exon–intron structure of tomato SlKAT and SlMFP genes. (A) The exon–intron mapping of tomato KAT genes using TBtools. Green rectangles represent exons and orange rectangles represent upstream and downstream noncoding regions of genes. Black solid lines represent introns. (B) The exon–intron mapping of tomato MFP genes using TBtools. Green rectangles represent exons and orange rectangles represent upstream and downstream noncoding regions of genes. Solid black lines represent introns.
Ijms 25 02273 g001
Figure 2. Composition of conserved motifs in tomato KAT and MFP proteins. (A) Sequence analysis of the tomato KAT family. Different colors represent different conserved motifs. (B) Sequence analysis of the tomato MFP family. Different colors represent different conserved motifs.
Ijms 25 02273 g002
Figure 3. Phylogenetic tree of the KAT and MFP family genes in tomato, A. thaliana, P. tomentosa, and cucumber. (A) Phylogenetic tree of KAT members. KAT protein sequences from A. thaliana (3 proteins), cucumber (12 proteins), P. tomentosa (10 proteins), and tomato (5 proteins). The tomato is marked with a red pentagram. (B) Phylogenetic tree of MFP members. MFP protein sequences from A. thaliana (2 proteins), cucumber (7 proteins), P. tomentosa (21 proteins), and tomato (4 proteins). The tomato is marked with a red pentagram. The P. tomentosa is marked with a black square. The A. thaliana is marked with a blue triangle. The cucumber is marked with a green circle.
Ijms 25 02273 g003
Figure 4. Chromosomal distribution of members of the SlKAT and SlMFP family genes in the tomato. (A) Chromosomal localization of KAT genes. (B) Chromosomal localization of MFP genes.
Ijms 25 02273 g004
Figure 5. The distribution of cis-acting elements in the tomato SlKAT and SlMFP genes. Different colors represent different cis-acting elements. (A) The distribution of cis-acting elements in the KAT family genes. (B) The distribution of cis-acting elements in the MFP family genes.
Ijms 25 02273 g005
Figure 6. Analysis of the number of cis-acting elements of the tomato SlKAT and SlMFP genes. (A) Analysis of the number of cis-acting elements of the KAT gene. (B) Analysis of the number of cis-acting elements of the MFP gene.
Ijms 25 02273 g006
Figure 7. Expression patterns of tomato SlKAT and SlMFP in different tissues. The color scale represents the fold change normalized by the log2-transformed data. Different numbers represent the level of significance. Heatmaps are shown in blue/yellow/red for low/medium/high expression, respectively. (A) Expression of tomato SlKAT in different tissues of tomato plants. (B) Expression of tomato SlMFP in different tissues of tomato plants.
Ijms 25 02273 g007
Figure 8. Gene duplication and collinearity analysis of KAT and MFP genes. (A) Covariance analysis of SlKATs with SlMFPs. The blue bars represent chromosomes, the gray lines represent all co-lined genes in tomato, and the pink lines indicate KAT and MFP co-lined genes. The color scale represents the fold change normalized by the log2-transformed data. (B) Covariance of P. tomentosa, tomato, and A. thaliana genes. Yellow lines indicate KAT genes and green lines indicate MFP genes. Gray lines in the background indicate collinear blocks within the P. tomentosa, tomato, and A. thaliana genes.
Ijms 25 02273 g008
Figure 9. Evolutionary selection pressure analysis of the SlKAT and SlMFP homologous gene pairs. The X-axis represents the Ka value, the Y-axis represents the Ks value, and the Z-axis represents the ratio of Ka to Ks. The color scale represents the fold change normalized by the log2-transformed data.
Ijms 25 02273 g009
Figure 10. Expression levels of SlKAT and SlMFP genes under ABA (A) and MeJA (B). The asterisk (*) indicates that the expression level of the stress group is significantly different from that of the control group (* p < 0.05, ** p < 0.01, *** p < 0.001, and **** p < 0.0001, one-way ANOVA, Tukey test). The samples in the 0 h treatment were used as controls.
Ijms 25 02273 g010
Figure 11. Darkness (A), NaCl (B), PEG (C), UV radiation (D), low-temperature (E), high-temperature (F), and H2O2 (G) treatments. The asterisk (*) indicates the corresponding gene that was significantly up- or down-regulated compared with the 0 h status (* p < 0.05, ** p < 0.01, *** p < 0.001, and **** p < 0.0001, one-way ANOVA, Tukey test). The samples in the 0 h treatment were used as controls.
Ijms 25 02273 g011
Table 1. Genomic information on members of the SlKAT and SlMFP family genes in tomatoes.
GeneGene IDGene LocusORF
(bp)
Amino AcidMolecular
Weight (Da)
pIGRAVY
SlKAT1Solyc04g015100.3.1. ITAG4.0Chr04124541442,901.378.870.17
SlKAT2Solyc05g017760.4.1. ITAG4.0Chr05114638139,128.825.730.12
SlKAT3Solyc07g045350.4.1. ITAG4.0Chr07121540441,312.496.470.156
SlKAT4Solyc09g061840.4.1. ITAG4.0Chr09144648150,588.348.670.116
SlKAT5Solyc09g091470.3.1. ITAG4.0Chr09139846549,024.197.97−0.023
SlMFP1Solyc01g066620.4.1. ITAG4.0Chr01182160667,336.019.040.043
SlMFP2Solyc07g019670.4.1. ITAG4.0Chr07217272378,397.79.330.092
SlMFP3Solyc08g068390.3.1. ITAG4.0Chr08213371077,162.225.680.029
SlMFP4Solyc12g007170.3.1. ITAG4.0Chr12214871577,793.889.110.108
Table 2. Detailed information on the 10 conserved motifs of the tomato KAT protein.
MotifWidth
(aa)
Motif Sequence
Motif 150SQIDYYEINEAFAVVALANQKLLGLBPEKINVHGGAVSLGHPLGCSGARI
Motif 246GMGVCAENCAERFKITREEQDQYAVQSFERGIAAQESGAFAWEIVP
Motif 350PNTVICTTVNKVCSSGLKATMLAAQSIQAGFNDIVVAGGMESMSNVPKYL
Motif 450VLVSGEKAIKLGLPVIGKIRGFADAAQEPELFGIAPALAIPKAIKSAGLE
Motif 529KANVDPSLVEEVFFGNVLSANLGQAPARQ
Motif 629EARKGSRLGHDSLVDGMLKDGLTDVYNDC
Motif 721TLLGVLRQKDGKFGVAGVCNG
Motif 841EVSGGRGRPSVIVDKDEGLAKFDGAKLRKLRPSFKDTDGTV
Motif 915TAGNASQISDGAAAL
Motif 1021MGGFLGSLSSLSATKLGSIAI
Table 3. Detailed information on the 10 conserved motifs of the tomato MFP protein.
MotifWidth
(aa)
Motif Sequence
Motif 150LDYEDFKDVDMVIEAVIENVPLKQQIFIDIEKVCPPHCILASNTSTIDLN
Motif 250HFFSPAHVMPLLEIVRTEKTSPQVILDLMAVGKAIKKVPVVVGNCTGFAV
Motif 349EMILFPVVNEACRVLDEGIVVRASDLDIASVLGMSFPSYRGGIVFWADT
Motif 450LGCHARIAAPRAQLGLPELSLGVIPGFGGTQRLPRLIGLSKAVDMMMTSK
Motif 550LVHIFFAQRATSKVPNVTDIGLKPRSIKKVAIIGGGLMGSGIATALILSN
Motif 649NRTFFPYSQGAQLLVNLGVDVYRIDTQITEFGLPMGPFQLQDLAGYGVA
Motif 741MSEEGKELGLIDAIVPSDELLKVARRWALDIAERRKPWMRA
Motif 850DRVFKSPLVDLLIKSGRNGKNNGKGYYIYDKGRKPRPDPSVLPIIEESRR
Motif 938VGAGHIYSSLKKWSEIYGNFFKPSKFLEEKAAKGIPLS
Motif 1041NMPQHLACJDVIEEGIVHGGYNGJLKEAKVFEDLVLSDTSK
Table 4. Secondary structure of KAT and MFP family members in the tomato.
ProteinAlpha Helix (%)Beta Turn (%)Random Coil (%)Distribution of Secondary Structure Elements
SlKAT145.658.9431.64Ijms 25 02273 i001
SlKAT249.619.4526.77Ijms 25 02273 i002
SlKAT346.048.9130.20Ijms 25 02273 i003
SlKAT439.718.1136.17Ijms 25 02273 i004
SlKAT544.527.5332.69Ijms 25 02273 i005
SlMFP152.315.2833.83Ijms 25 02273 i006
SlMFP250.217.7531.67Ijms 25 02273 i007
SlMFP350.007.0432.82Ijms 25 02273 i008
SlMFP449.376.9933.85Ijms 25 02273 i009
Table 5. Prediction of subcellular localization of SlKAT and SlMFP family members in tomatoes.
ProteinNucleusChloroplastCytosolPeroxisomePlasma MembraneEndoplasmic Reticulum
SlKAT4441
SlKAT52.5121
SlKAT2671
SlKAT3373
SlKAT1193
SlMFP1337
SlMFP311614
SlMFP41183
SlMFP21112
Disclaimer/Publisher’s Note: The statements, opinions and data contained in all publications are solely those of the individual author(s) and contributor(s) and not of MDPI and/or the editor(s). MDPI and/or the editor(s) disclaim responsibility for any injury to people or property resulting from any ideas, methods, instructions or products referred to in the content.