Article

Genome-Wide Analysis of MYB Genes in Primulina eburnea (Hance) and Identification of Members in Response to Drought Stress

1
Jiangxi Provincial Key Laboratory of Ex Situ Plant Conservation and Utilization, Lushan Botanical Garden, Chinese Academy of Sciences, Jiujiang 332900, China
2
School of Life Sciences, Nanchang University, Nanchang 330031, China
*
Author to whom correspondence should be addressed.
These authors contributed equally to this work.
Int. J. Mol. Sci. 2024, 25(1), 465; https://doi.org/10.3390/ijms25010465
Submission received: 14 November 2023 / Revised: 24 December 2023 / Accepted: 28 December 2023 / Published: 29 December 2023

Abstract

:
Due to periodic water deficiency in karst environments, Primulina eburnea experiences sporadic drought stress in its habitat. Despite being one of the largest gene families and functionally diverse in terms of plant growth and development, MYB transcription factors in P. eburnea have not been studied. Here, a total of 230 MYB genes were identified in P. eburnea, including 67 1R-MYB, 155 R2R3-MYB, six 3R-MYB, and two 4R-MYB genes. The R2R3-type PebMYB genes could be classified into 16 subgroups, while the remaining PebMYB genes (1R-MYB, 3R-MYB, and 4R-MYB genes) were divided into 10 subgroups. Notably, the results of the phylogenetic analysis were further supported by the motif and gene structure analysis, which showed that individuals in the same subgroup had comparable motif and structure organization. Additionally, gene duplication and synteny analyses were performed to better understand the evolution of PebMYB genes, and 291 pairs of segmental duplicated genes were found. Moreover, RNA-seq analysis revealed that the PebMYB genes could be divided into five groups based on their expression characteristics. Furthermore, 11 PebMYB genes that may be involved in drought stress response were identified through comparative analysis with Arabidopsis thaliana. Notably, seven of these genes (PebMYB3, PebMYB13, PebMYB17, PebMYB51, PebMYB142, PebMYB69, and PebMYB95) exhibited significant differences in expression between the control and drought stress treatments, suggesting that they may play important roles in drought stress response. These findings clarified the characteristics of the MYB gene family in P. eburnea, augmenting our comprehension of their potential roles in drought stress adaptation.

1. Introduction

Abiotic stresses primarily comprise factors such as drought stress, which can negatively impact plant growth and development and even lead to plant mortality [1,2]. Drought stress affects physiological, cellular, and molecular processes that are driven by a complex regulatory network in which transcription factors (TFs), kinases, and abscisic acid (ABA) play key roles in signal transduction [3,4]. Analysis of the genes involved in the drought stress response improves understanding of their function in molecular pathways, which ultimately paves the way for genetically modifying stress tolerance in crops such as rice and maize [5,6].
The MYB family is one of the largest gene families in plants and plays a crucial role in a variety of physiological functions, including signal transduction, primary and secondary metabolism, and stress responses [7,8,9]. MYB TFs in plants can be divided into four primary categories based on the arrangement and number of repetitions: 1R-MYB, 2R-MYB, 3R-MYB, and 4R-MYB with one to four repeats, respectively [10,11]. Each repeat forms a motif fold of the helix-turn-helix (HTH) structure with approximately 50 amino acids, and the regular interval of tryptophan plays a key role in maintaining the configuration of the HTH structure [12,13]. Furthermore, R2R3-MYB (2R-MYB) are predominantly present and widely investigated in plants such as Arabidopsis thaliana, rice, maize, and grape [14,15,16]. In addition, numerous research studies on model plants such as Arabidopsis, rice, and maize demonstrated that MYB genes are implicated in abiotic stress response [17,18,19].
Primulina eburnea (Hance) Yin Z. Wang is an evergreen perennial herb belonging to the family Gesneriaceae that is extensively distributed in southern China among karst landforms [20,21,22]. This contrasts sharply with the endemic distribution of other species in the genus Primulina. The characteristic habitat of P. eburnea in the karst landscape has high calcium content, thin soil, poor water holding capacity, and a shortage of nutrients, as well as a distribution of terrestrial islands [23,24,25]. Notably, P. eburnea stands out as one of the top genetic resources within the genus Primulina due to its excellent adaptability, wide distribution, and horticultural potential [26,27,28]. As a plant resource with broad development potential, P. eburnea was adapted to unpredictable drought stress in the karst landform. The abiotic stress response has been studied in many species. However, the mechanism of the drought stress response in P. eburnea has not been investigated.
In this study, we focused on the genome-wide identification of MYB genes in P. eburnea and investigated members related to drought stress response. A total of 230 genes were identified through a genome-wide survey, and phylogenetic analysis of the PebMYB genes was performed. To gain further insight, a combination of high-throughput expression analysis of genes in different tissues was performed, and the expression patterns of selected genes under drought stress treatments were measured using real-time quantitative PCR (qRT-PCR). Seven PebMYB genes involved in the drought stress response in P. eburnea were finally identified. The aims of this study are to lay a solid foundation for understanding the regulatory mechanism of MYB genes under stress conditions and to provide fresh perspectives on plant conservation in karst landforms.

2. Results

2.1. Identification and Characterization of MYB Genes in P. eburnea

A total of 230 P. eburnea MYB sequences were identified in P. eburnea, and the genes were labeled with the prefix PebMYB for clear designation (Supplemental Table S1, Figure S1). The PebMYB genes were unevenly distributed in the chromosome (Figure S1). Notably, 10 PebMYB genes (PebMYB22, PebMYB32, PebMYB70, PebMYB78, PebMYB89, PebMYB153, PebMYB154, PebMYB155, PebMYB166, and PebMYB167) were not located on any of the 18 assembled chromosomes (Supplemental Table S1). The average gene density across the entire genome of P. eburnea was approximately 39.14 genes per megabase (Mb), whereas the density of the PebMYB gene per Mb was notably lower at 0.28.
The R2R3-PebMYB proteins had an average length of 312.4 amino acid residues, ranging from 162 (PebMYB48) to 868 (PebMYB120). In contrast, the remaining PebMYB proteins displayed a broader span from 75 (PebMYB204, PebMYB218) to 1056 (PebMYB4R2), with an average length of 386. This considerable variation in amino acid length highlights the variation in the PebMYB proteins (Supplemental Table S1). A corresponding variance in relative molecular weight (Mw) was also observed in relation to amino acid length. For instance, the Mw of R2R3-PebMYB proteins ranged from 18,644.97 (PebMYB48) to 99,015.85 (PebMYB139), while that of the other PebMYB proteins ranged from 8645.75 (PebMYB218) to 117,733.6 (PebMYB4R2). Moreover, the isoelectric point (pI) exhibited a range from 4.92 (PebMYB98) to 10.2 (PebMYB145) in R2R3-PebMYB proteins and from 4.18 (PebMYB192) to 10.14 (PebMYB178) for the remaining types, highlighting the differences in the charge properties of the PebMYB proteins.

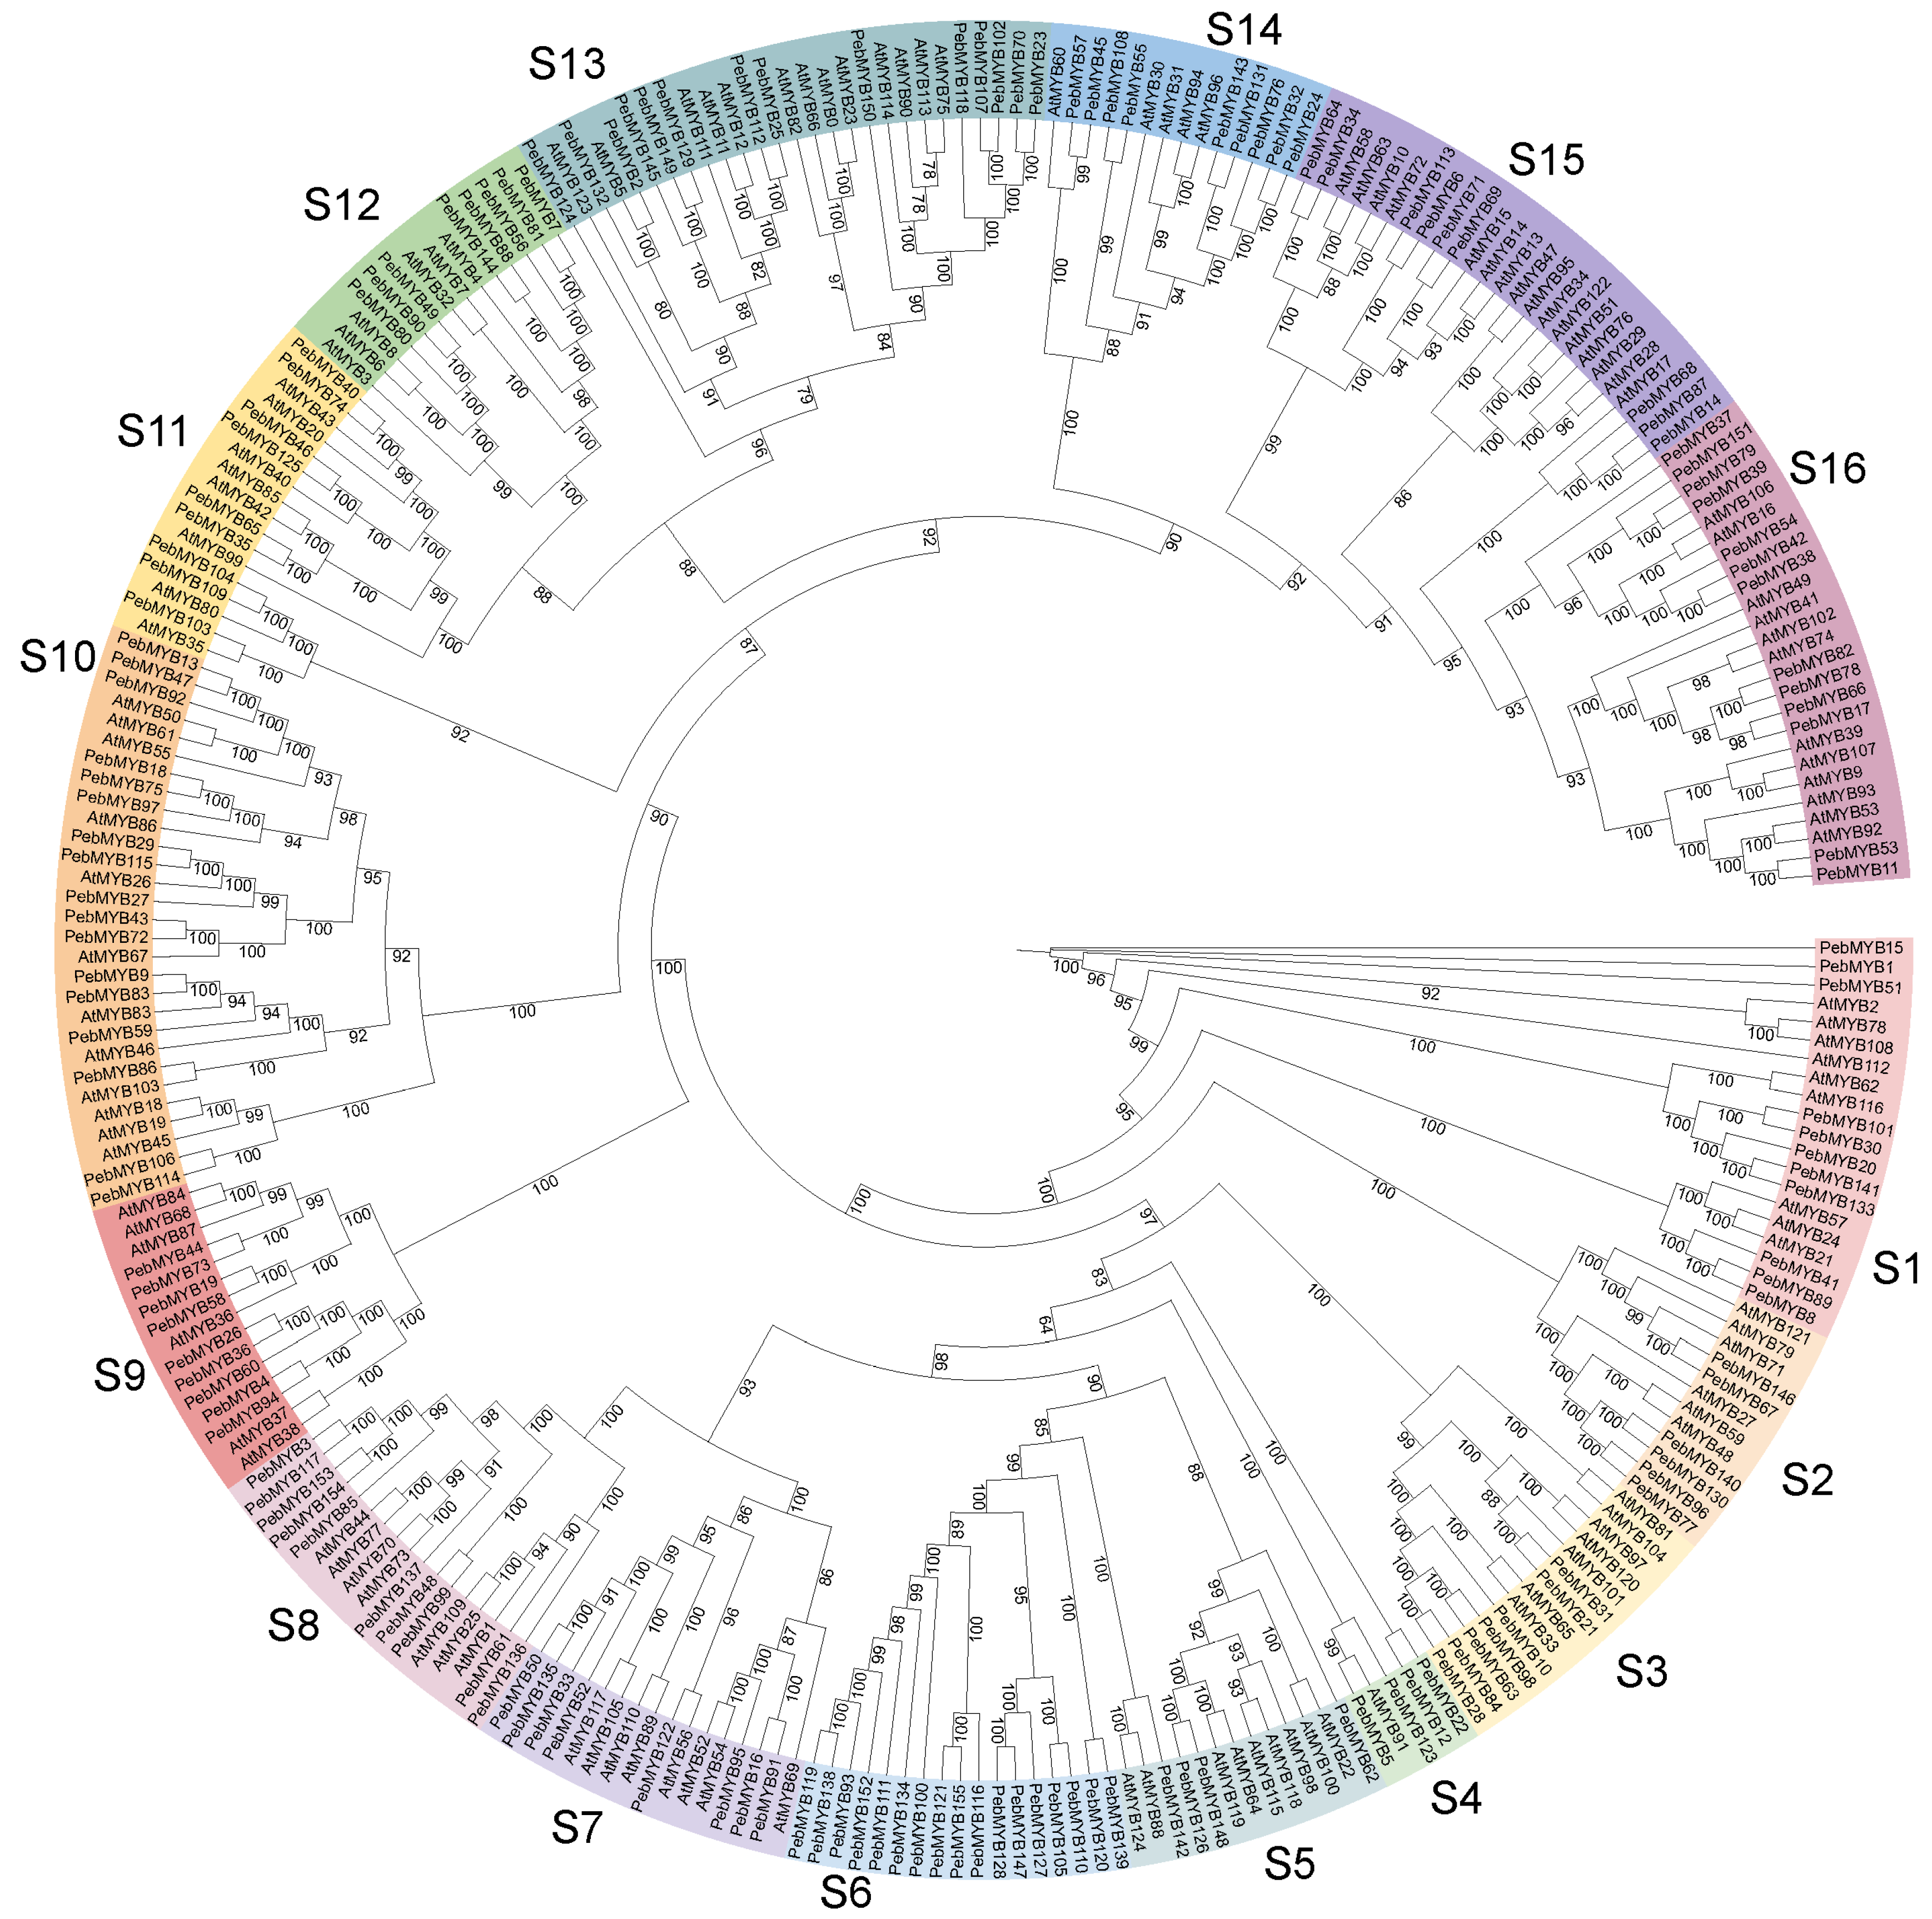
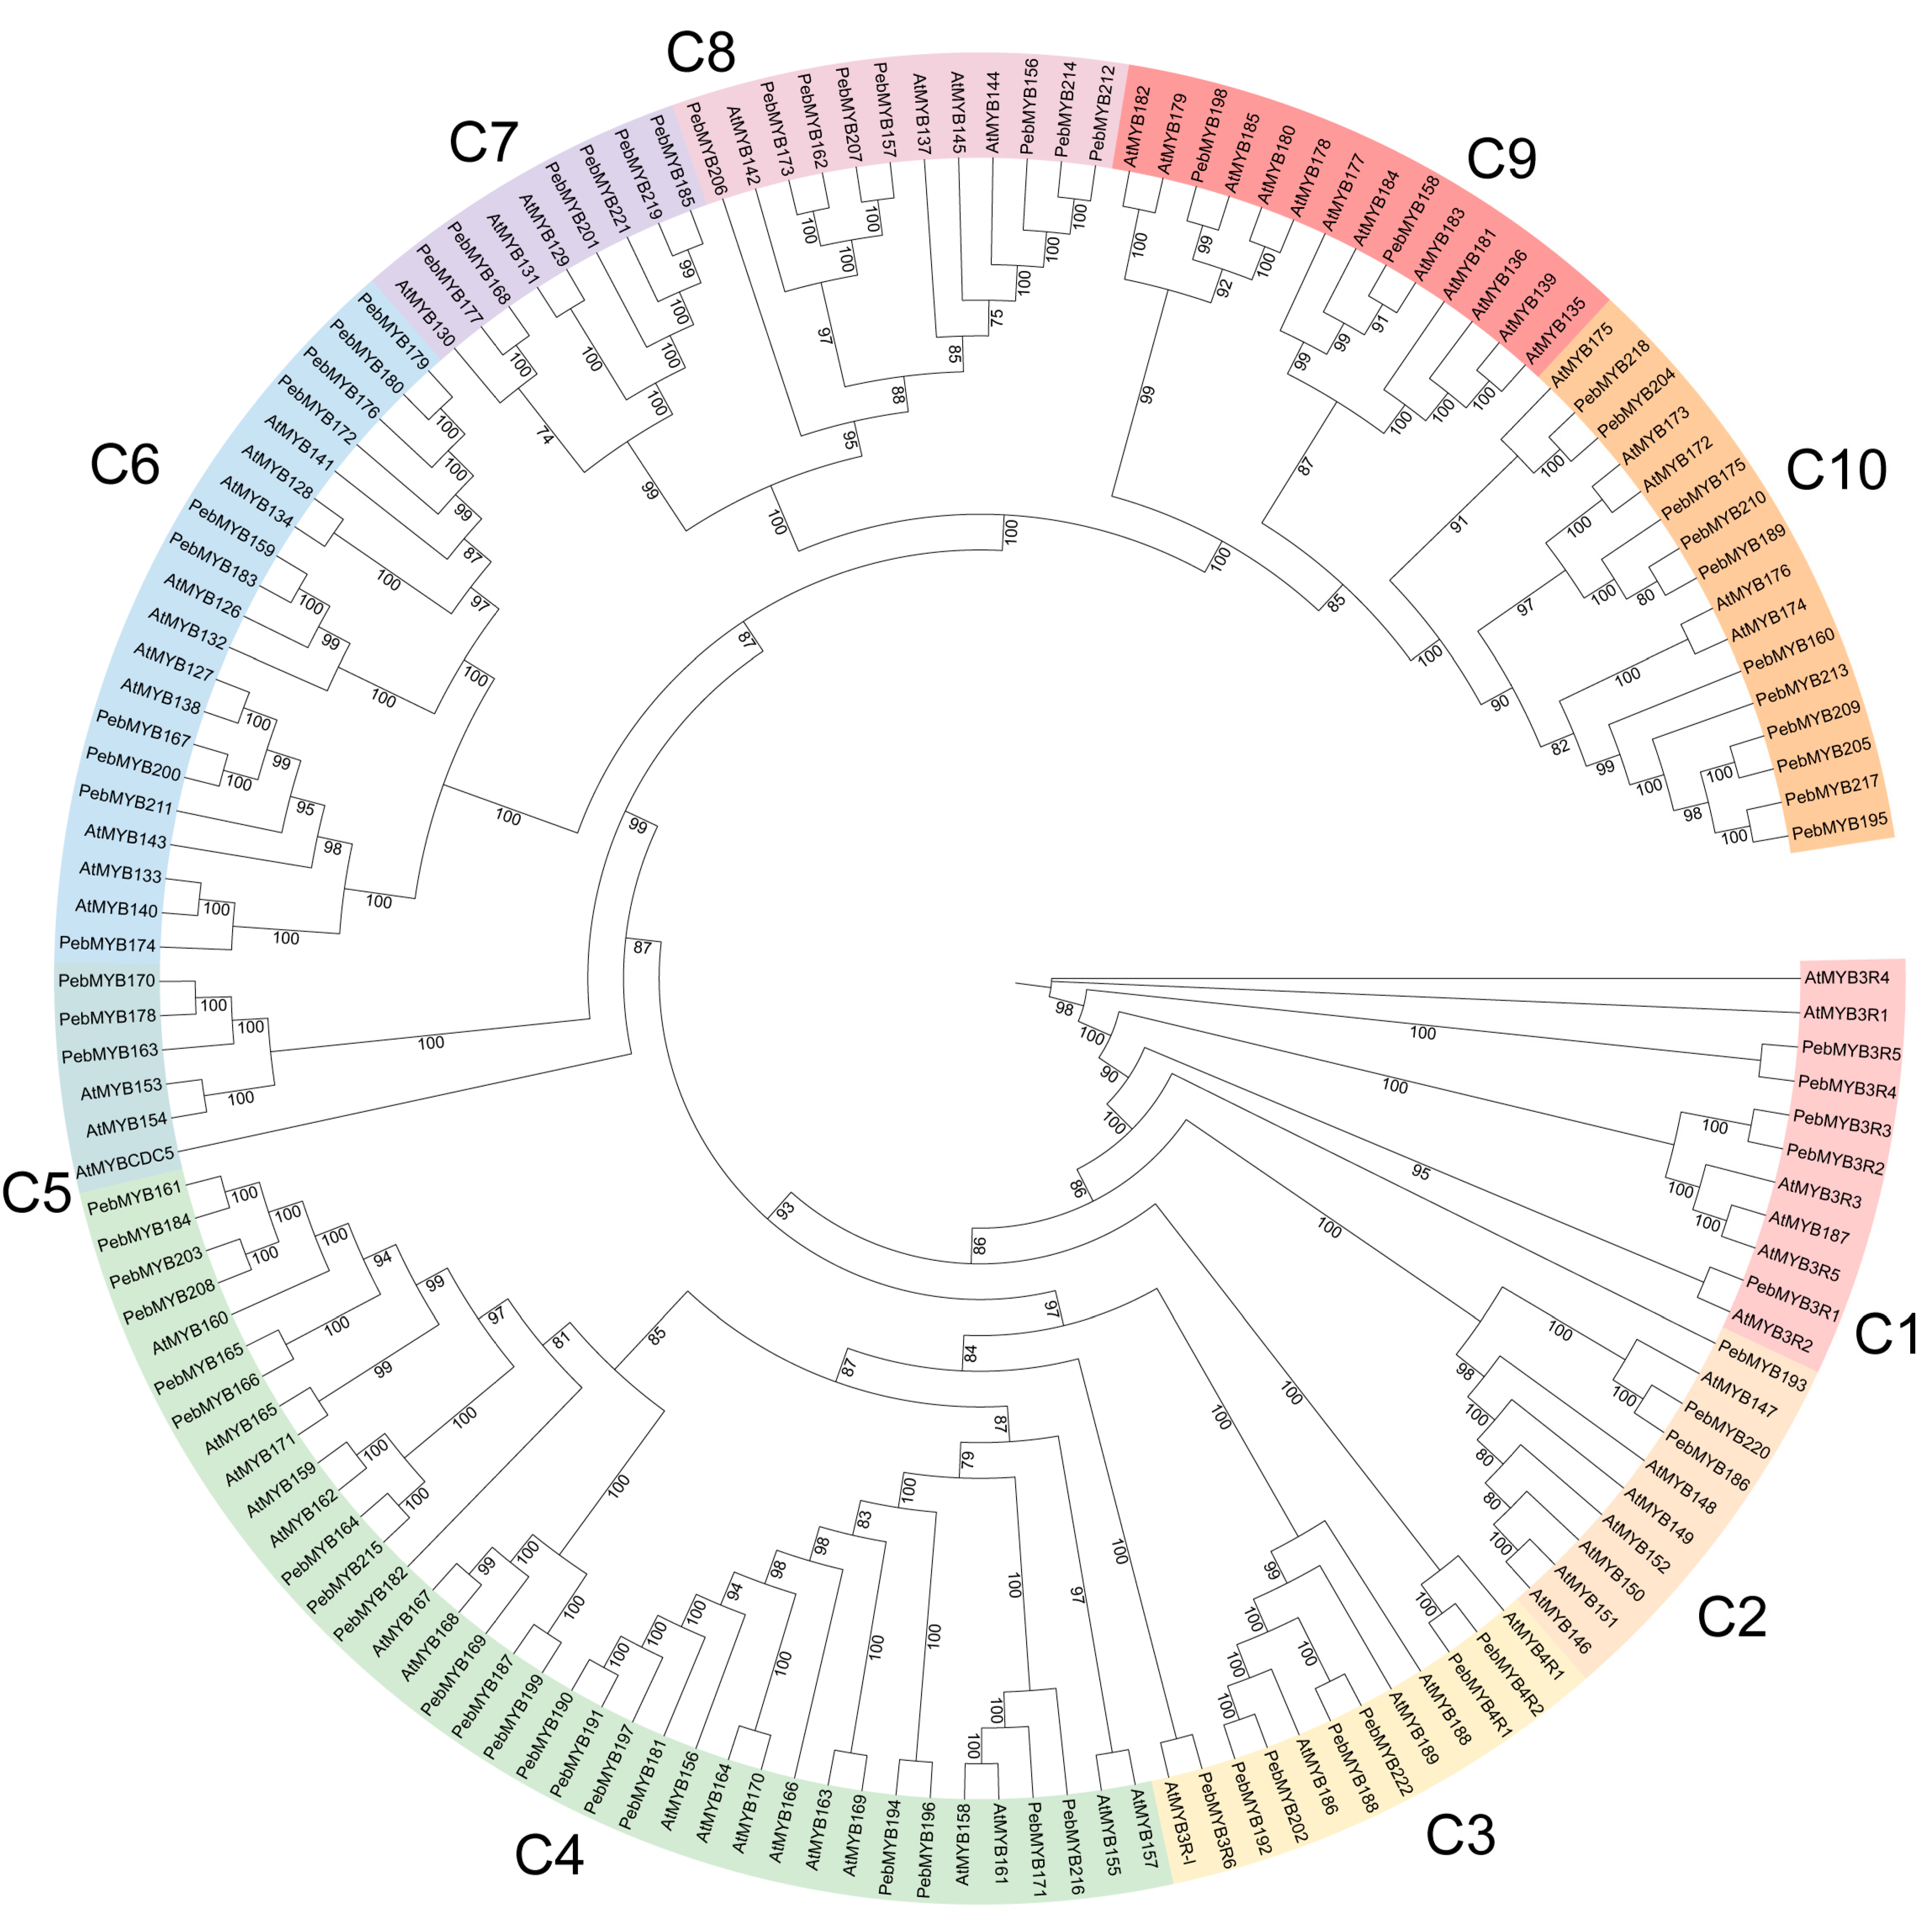
2.2. Phylogenetic Analysis and Classification of PebMYB Genes

To investigate the phylogenetic relationship of the PebMYB and AtMYB genes, ML phylogenetic trees were constructed. The members of the phylogenetic tree were classified into several subgroups based on the topology of the tree and classifications in A. thaliana (Figure 1 and Figure 2).
In the phylogenetic tree of R2R3-MYB genes, 126 A. thaliana protein sequences and 155 P. eburnea sequences were classified into 16 subgroups and designated S1 to S16 (Figure 1). Notably, subgroups S4 and S5 were the smallest group and contained only four PebMYB genes. In contrast, subgroup S6 consisted of 17 PebMYB genes, making it the largest group. Interestingly, all the members in S6 belong to the PebMYB genes (Figure 1). Furthermore, the majority of subgroups contained AtMYB genes with known functions, which will be useful for studying the function of PebMYB genes. For example, members in S13 (AtMYB66, AtMYB114, AtMYB90, etc.) have been shown to play important roles in the biosynthesis of anthocyanin and flavonol, as well as seed germination in A. thaliana, suggesting that PebMYB150 in S13 may also play a crucial role in anthocyanin biosynthesis [29,30,31].
The phylogenetic tree of the other MYB genes (1R-MYB, 3R-MYB, and 4R-MYB) contained 72 protein sequences from A. thaliana (64 1R-MYB, 5 3R-MYB, and 3 4R-MYB genes, respectively) and 75 protein sequences from P. eburnea (67 1R-MYB, 6 3R-MYB, and two 4R-MYB genes, respectively) (Figure 2). The members were classified into 10 categories (C1 to C10). C9, which was the smallest group, contained only two PebMYB genes, whereas the largest group, C4, included 20 members. Most AtMYB genes in C6 belonged to CCA1-like (Circadian Clock Associated 1), suggesting the likelihood that PebMYB genes in C6 may also function in circadian regulation. C2 contained AtMYB genes associated with CPC-like (CAPRICE), indicating that members of PebMYB genes in C2 could be involved in trichome formation and root development. C4 contained A. thaliana members of TBP-like (telomeric DNA-binding protein), which are known to play important roles in enhancing gene expression and cell development. Finally, C9 contained R-R-type MYB-like genes, while C10 contained I-Box-Binding-like genes from A. thaliana [16].

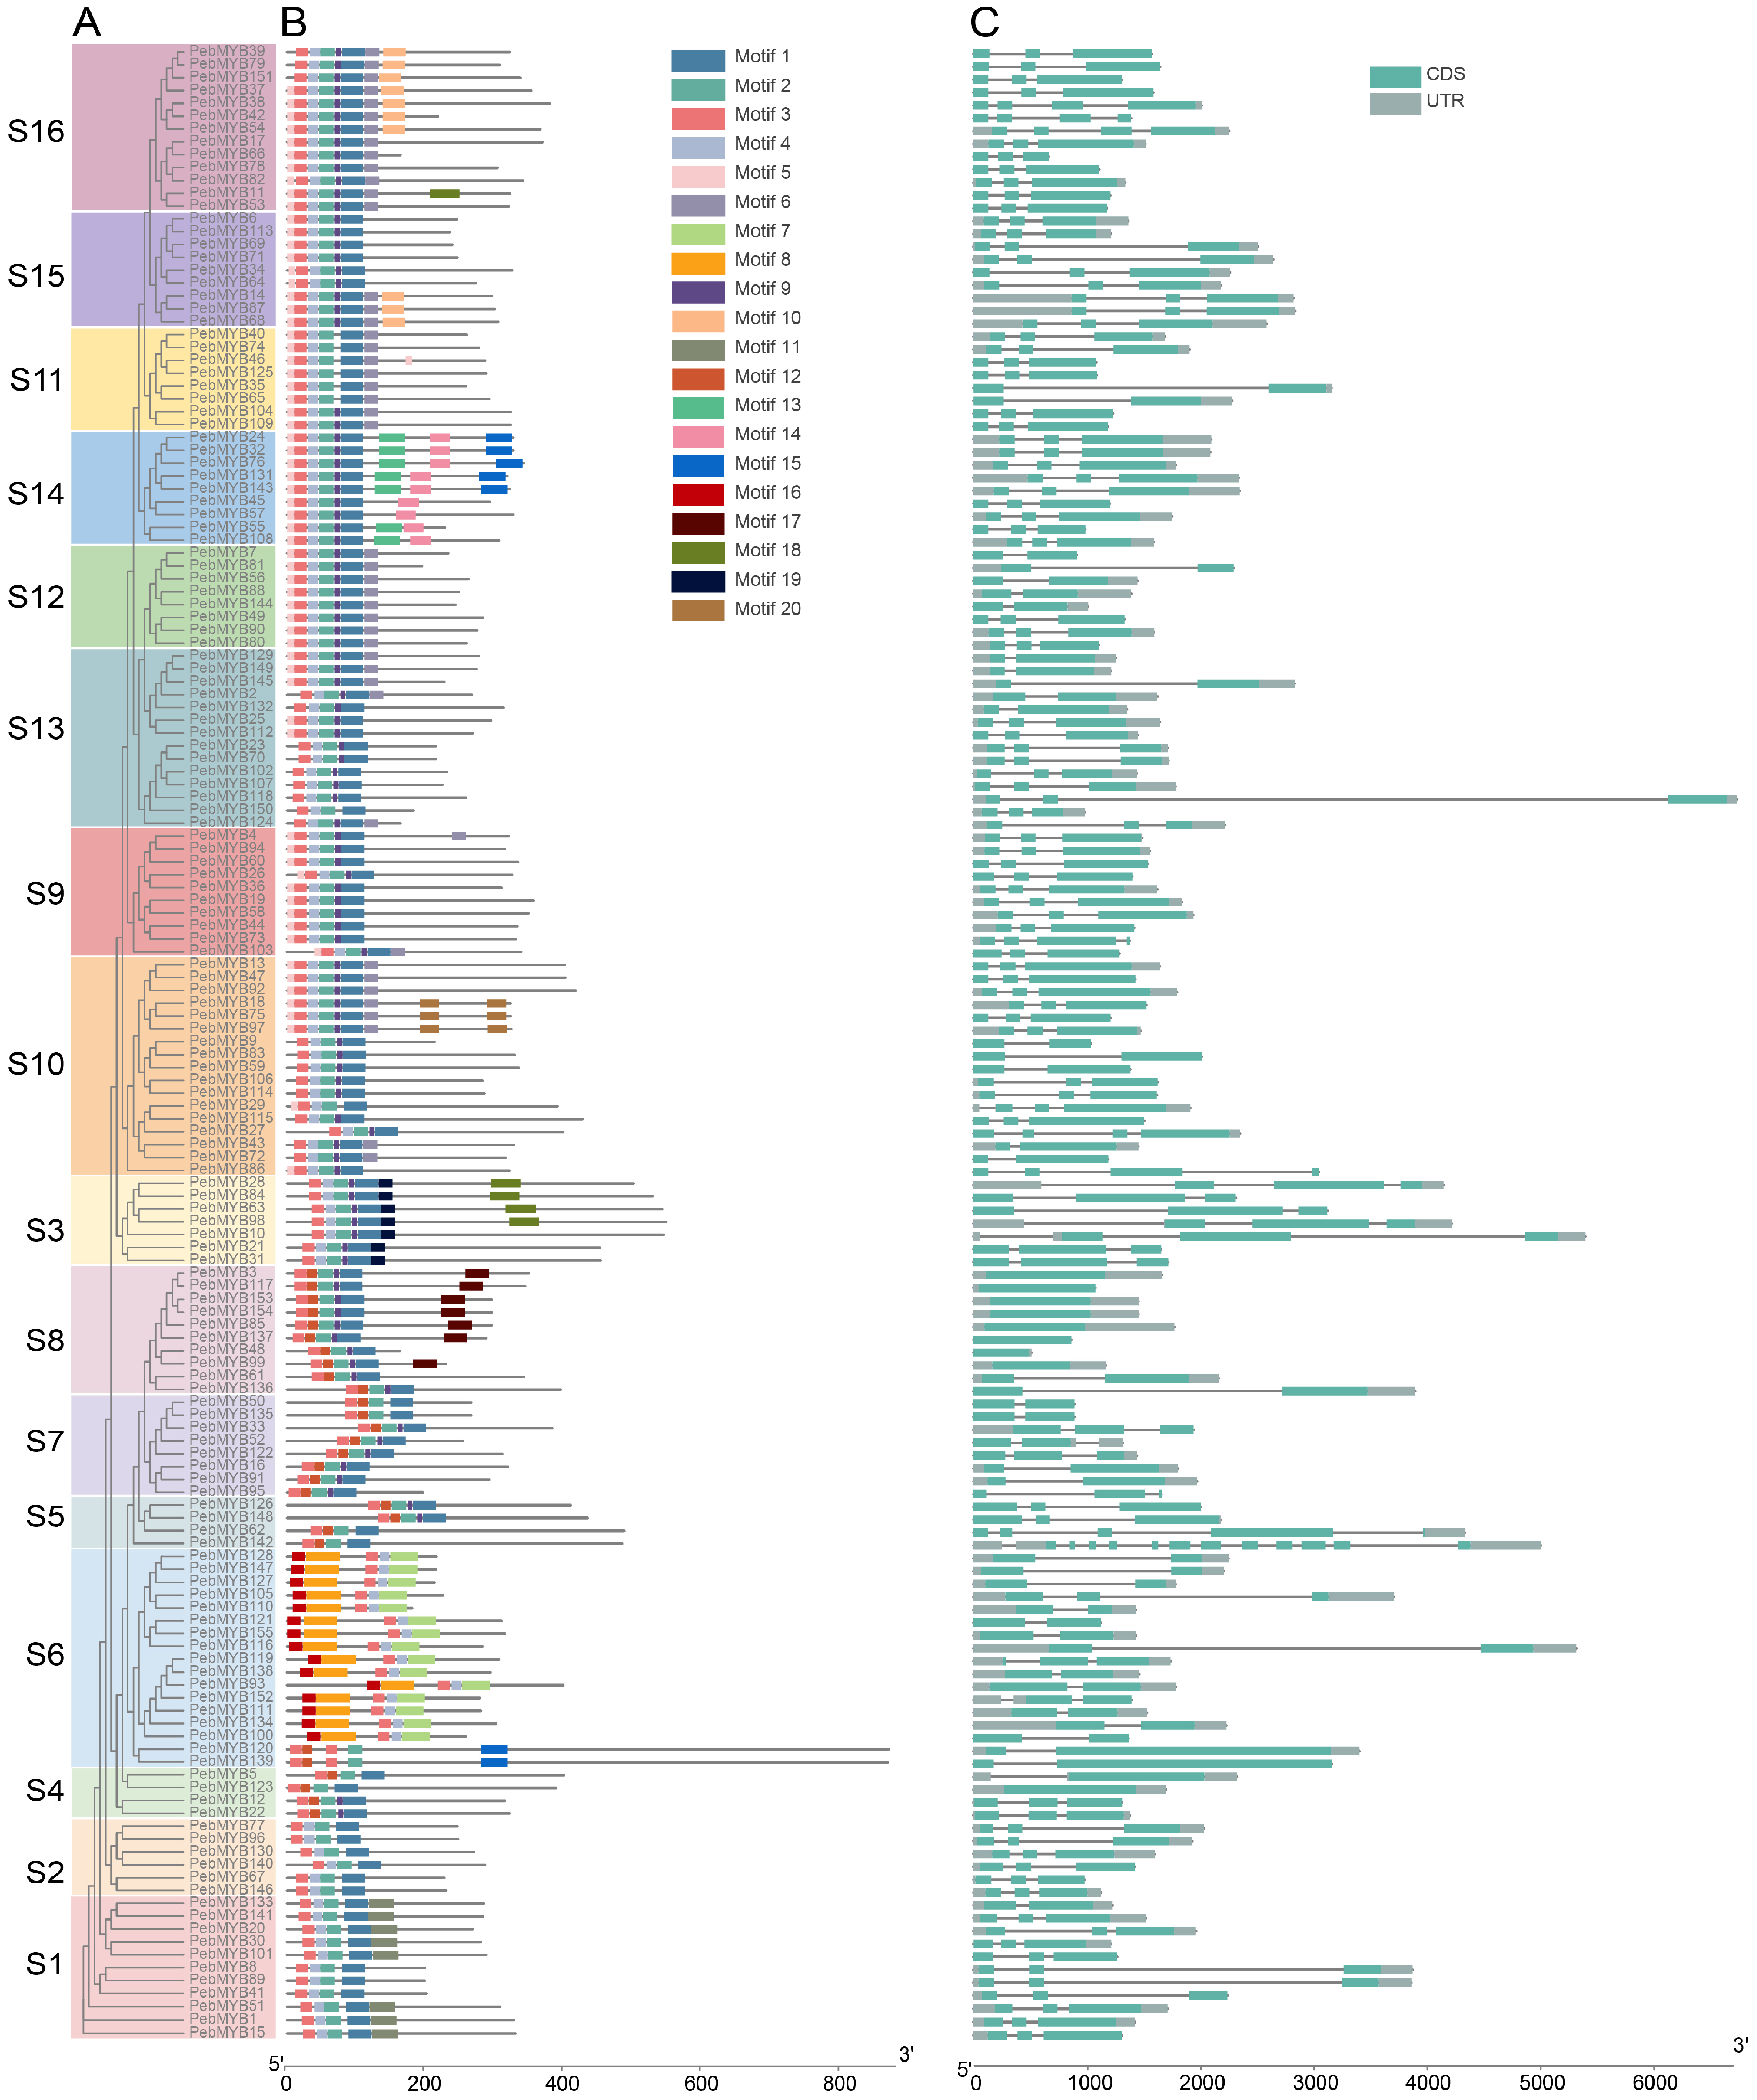
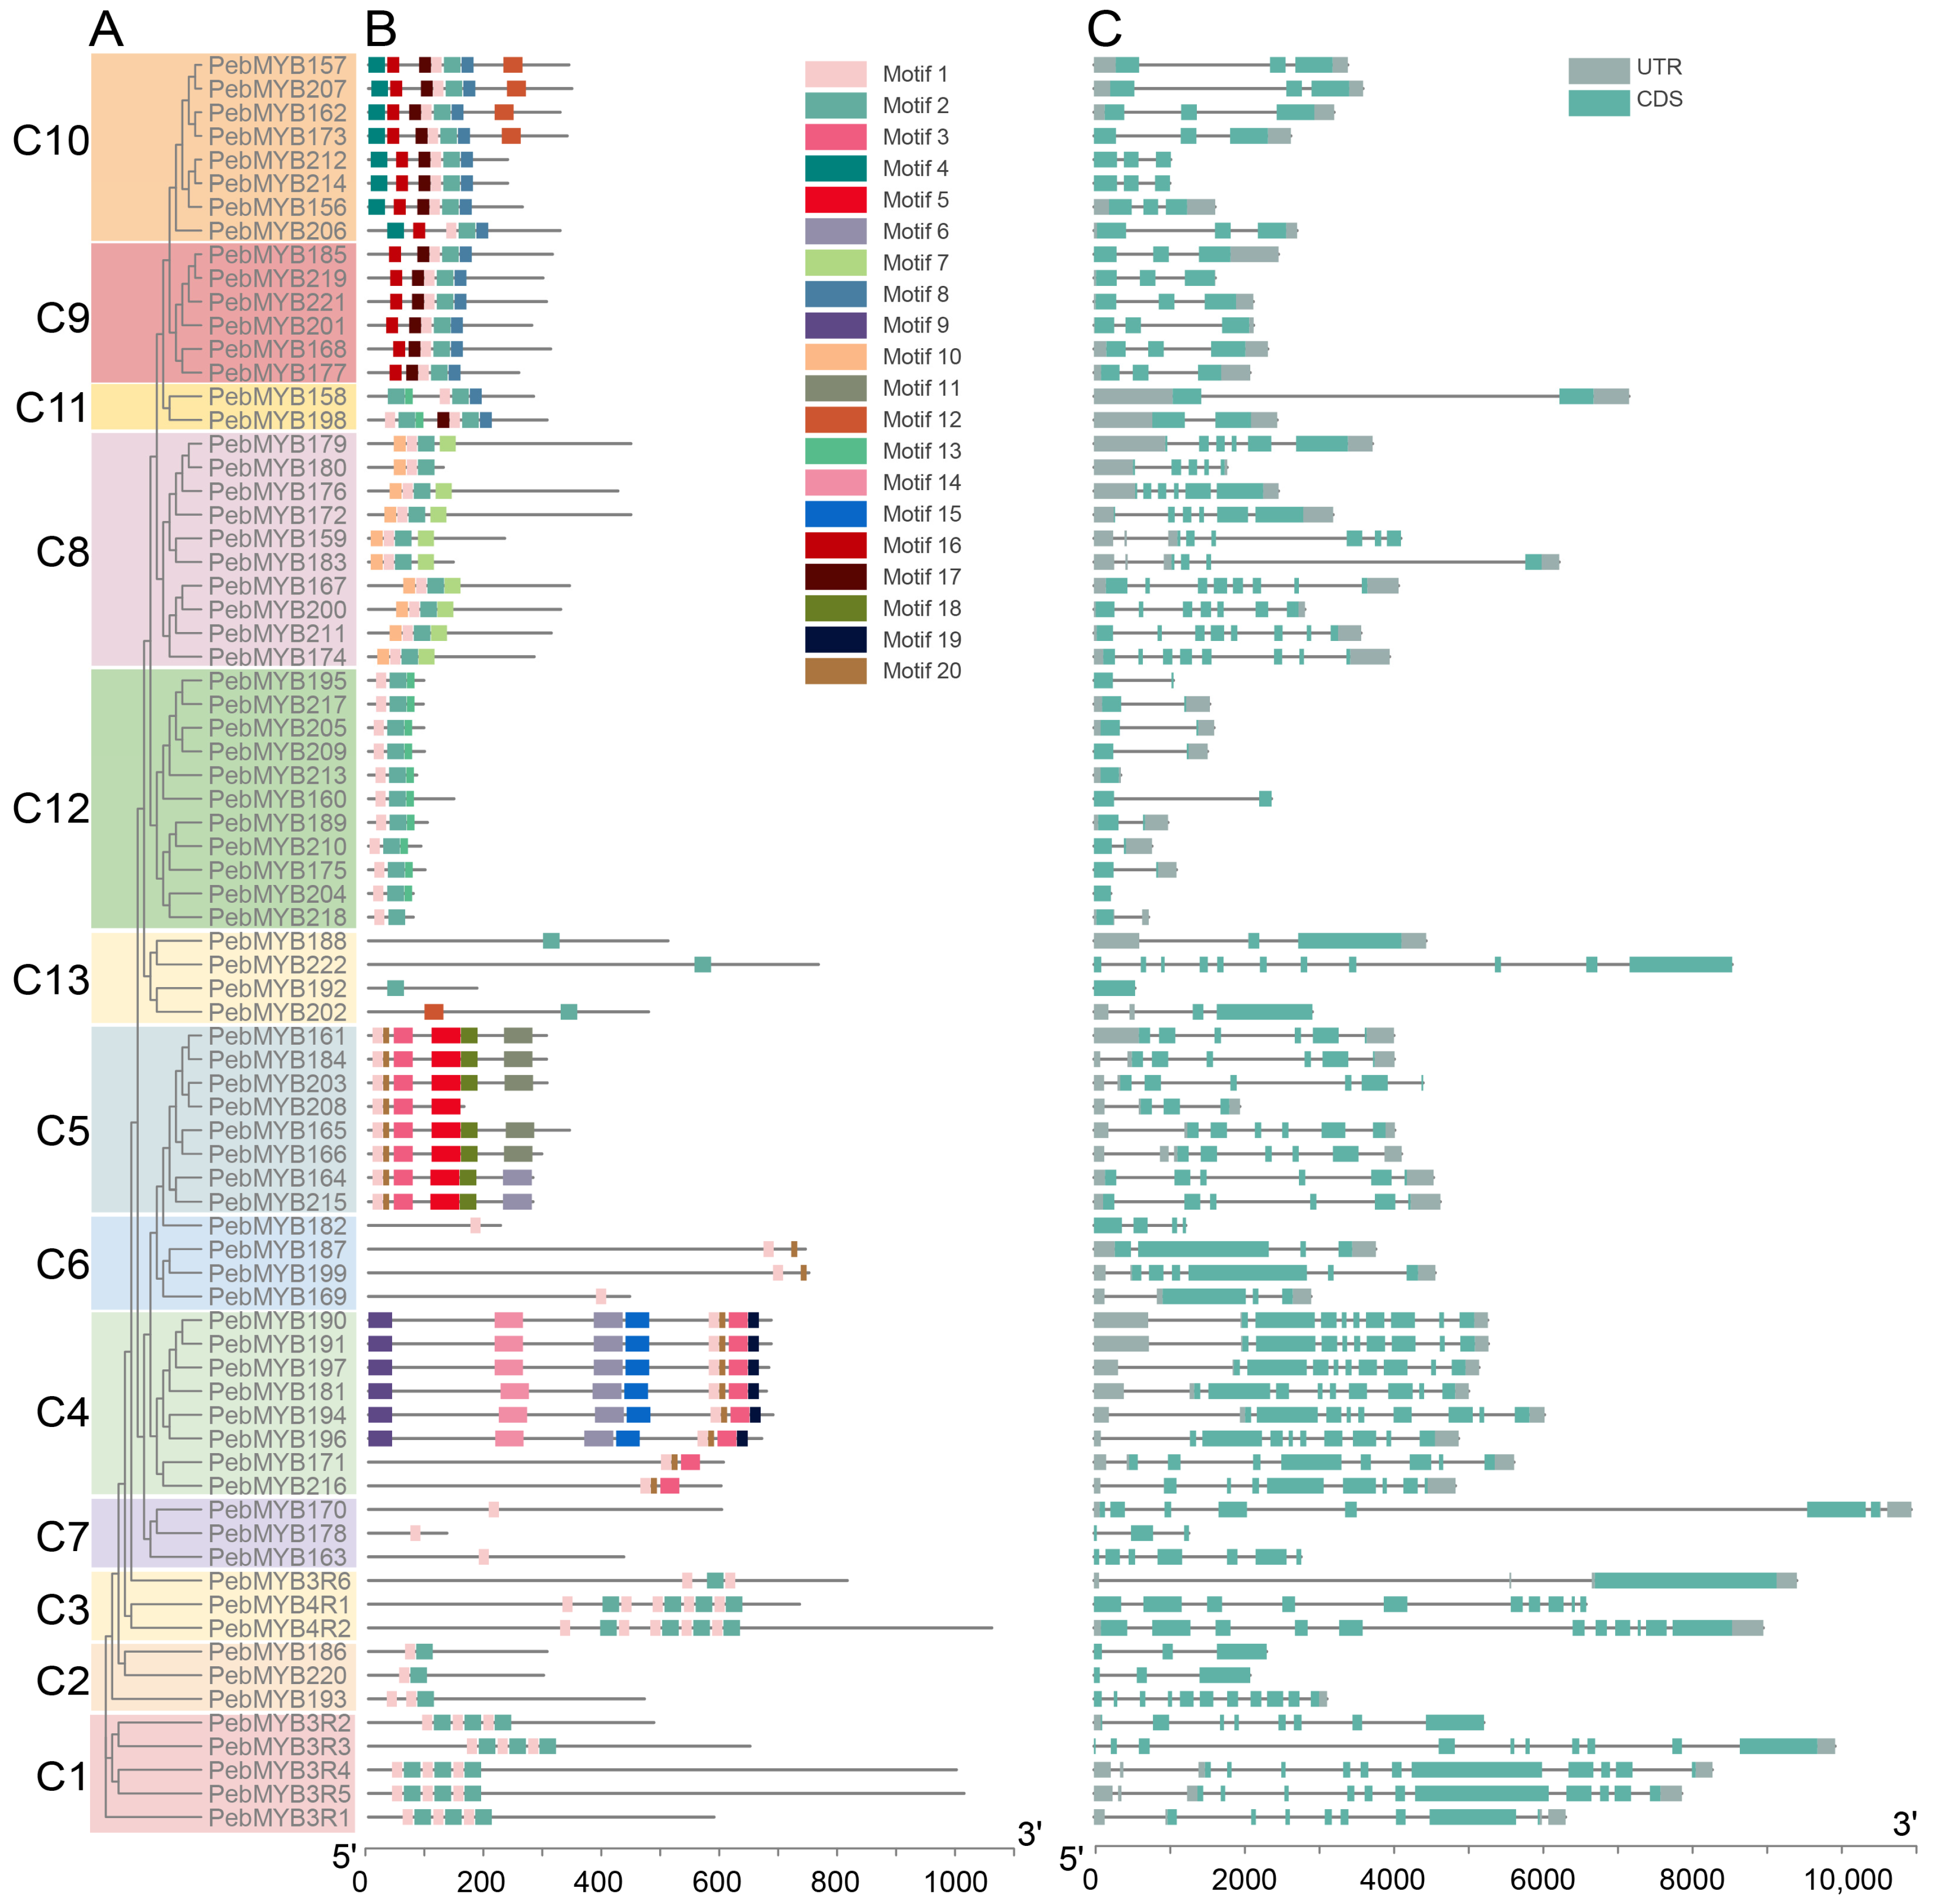
2.3. Motif Analysis and Gene Structure

ML phylogenetic trees of 155 R2R3-PebMYB and 75 remaining PebMYB genes were constructed (Figure 3 and Figure 4). The topology of the phylogenetic tree was similar to the grouping pattern observed in the phylogenetic analysis in Figure 1 and Figure 2, confirming the reliability of the phylogenetic analysis and classification of PebMYB genes. Furthermore, the presence of similar motif compositions within the same subgroup further supported the grouping results.
To gain a comprehensive understanding of the conserved domains in PebMYB genes, motif analysis was performed by the MEME program with a parameter of up to 20 motifs found (Figure 3B and Figure 4B). The most common conserved motifs identified in the motif analysis of R2R3-MYB genes were Motif 1, Motif 2, Motif 3, and Motif 4, which consisted of 34, 22, 18, and 15 amino acids, respectively. The R2 repeat was composed of Motif 3, Motif 4, and Motif 2, while Motif 1 corresponded to the R3 repeat (Supplementary Figure S2A, Table S2). The HTH (helix-turn-helix) structure was formed by regularly spaced tryptophan residues (arrows in Figure S2A), which was consistent with previous studies in other species [32,33].
With only a few exceptions in S5, S6, and S7, the length of the R2R3 domain within the majority of PebMYB genes ranged from 10 to 150 amino acids (Figure 3B). Notably, Motif 1, Motif 2, and Motif 4 were either partially or completely absent in members of S4 and S6. This pattern was particularly evident in all 17 members of S6, which lacked either Motif 1 or Motif 2, separating them from other subgroups. These findings were similar to those found in Chinese jujube and upland cotton, indicating that similar motif compositions are features of the same subgroup and implying potential functional commonalities among members of the same subgroup [34,35]. The analysis of gene structures further revealed variations among subgroups (Figure 3C). For example, the majority of the R2R3-MYB genes in P. eburnea had two (40/155) or three (96/155) exons, only one gene (PebMYB62) had five exons, and one (PebMYB142) had 12 exons. Interestingly, these two genes belonged to S5. In addition, most members of S8 contained only one exon.
In the motif analysis of 1R-MYB, 3R-MYB, and 4R-MYB genes, two predominant motifs (Motif 1 and Motif 2) were identified. Motif 1 consisted of 18 amino acids and was composed of R2 MYB repeats, whereas Motif 2 contained 29 amino acids and was composed of both R1 and R3 repeats (Supplementary Figure S2B, Table S3). Motif 1 existed in most of the 1R-MYB, 3R-MYB, and 4R-MYB genes except for the members in C13, which distinguished them from the other groups. Regarding gene structure, approximately half of the genes (36 out of 75 genes) contained one to three exons, while 19 out of 75 genes exhibited five to seven exons. Notably, five genes contained as many as 11 exons. These findings highlighted a greater variation in gene structure and motif composition among 1R-MYB, 3R-MYB, and 4R-MYB genes compared to R2R3-MYB genes.

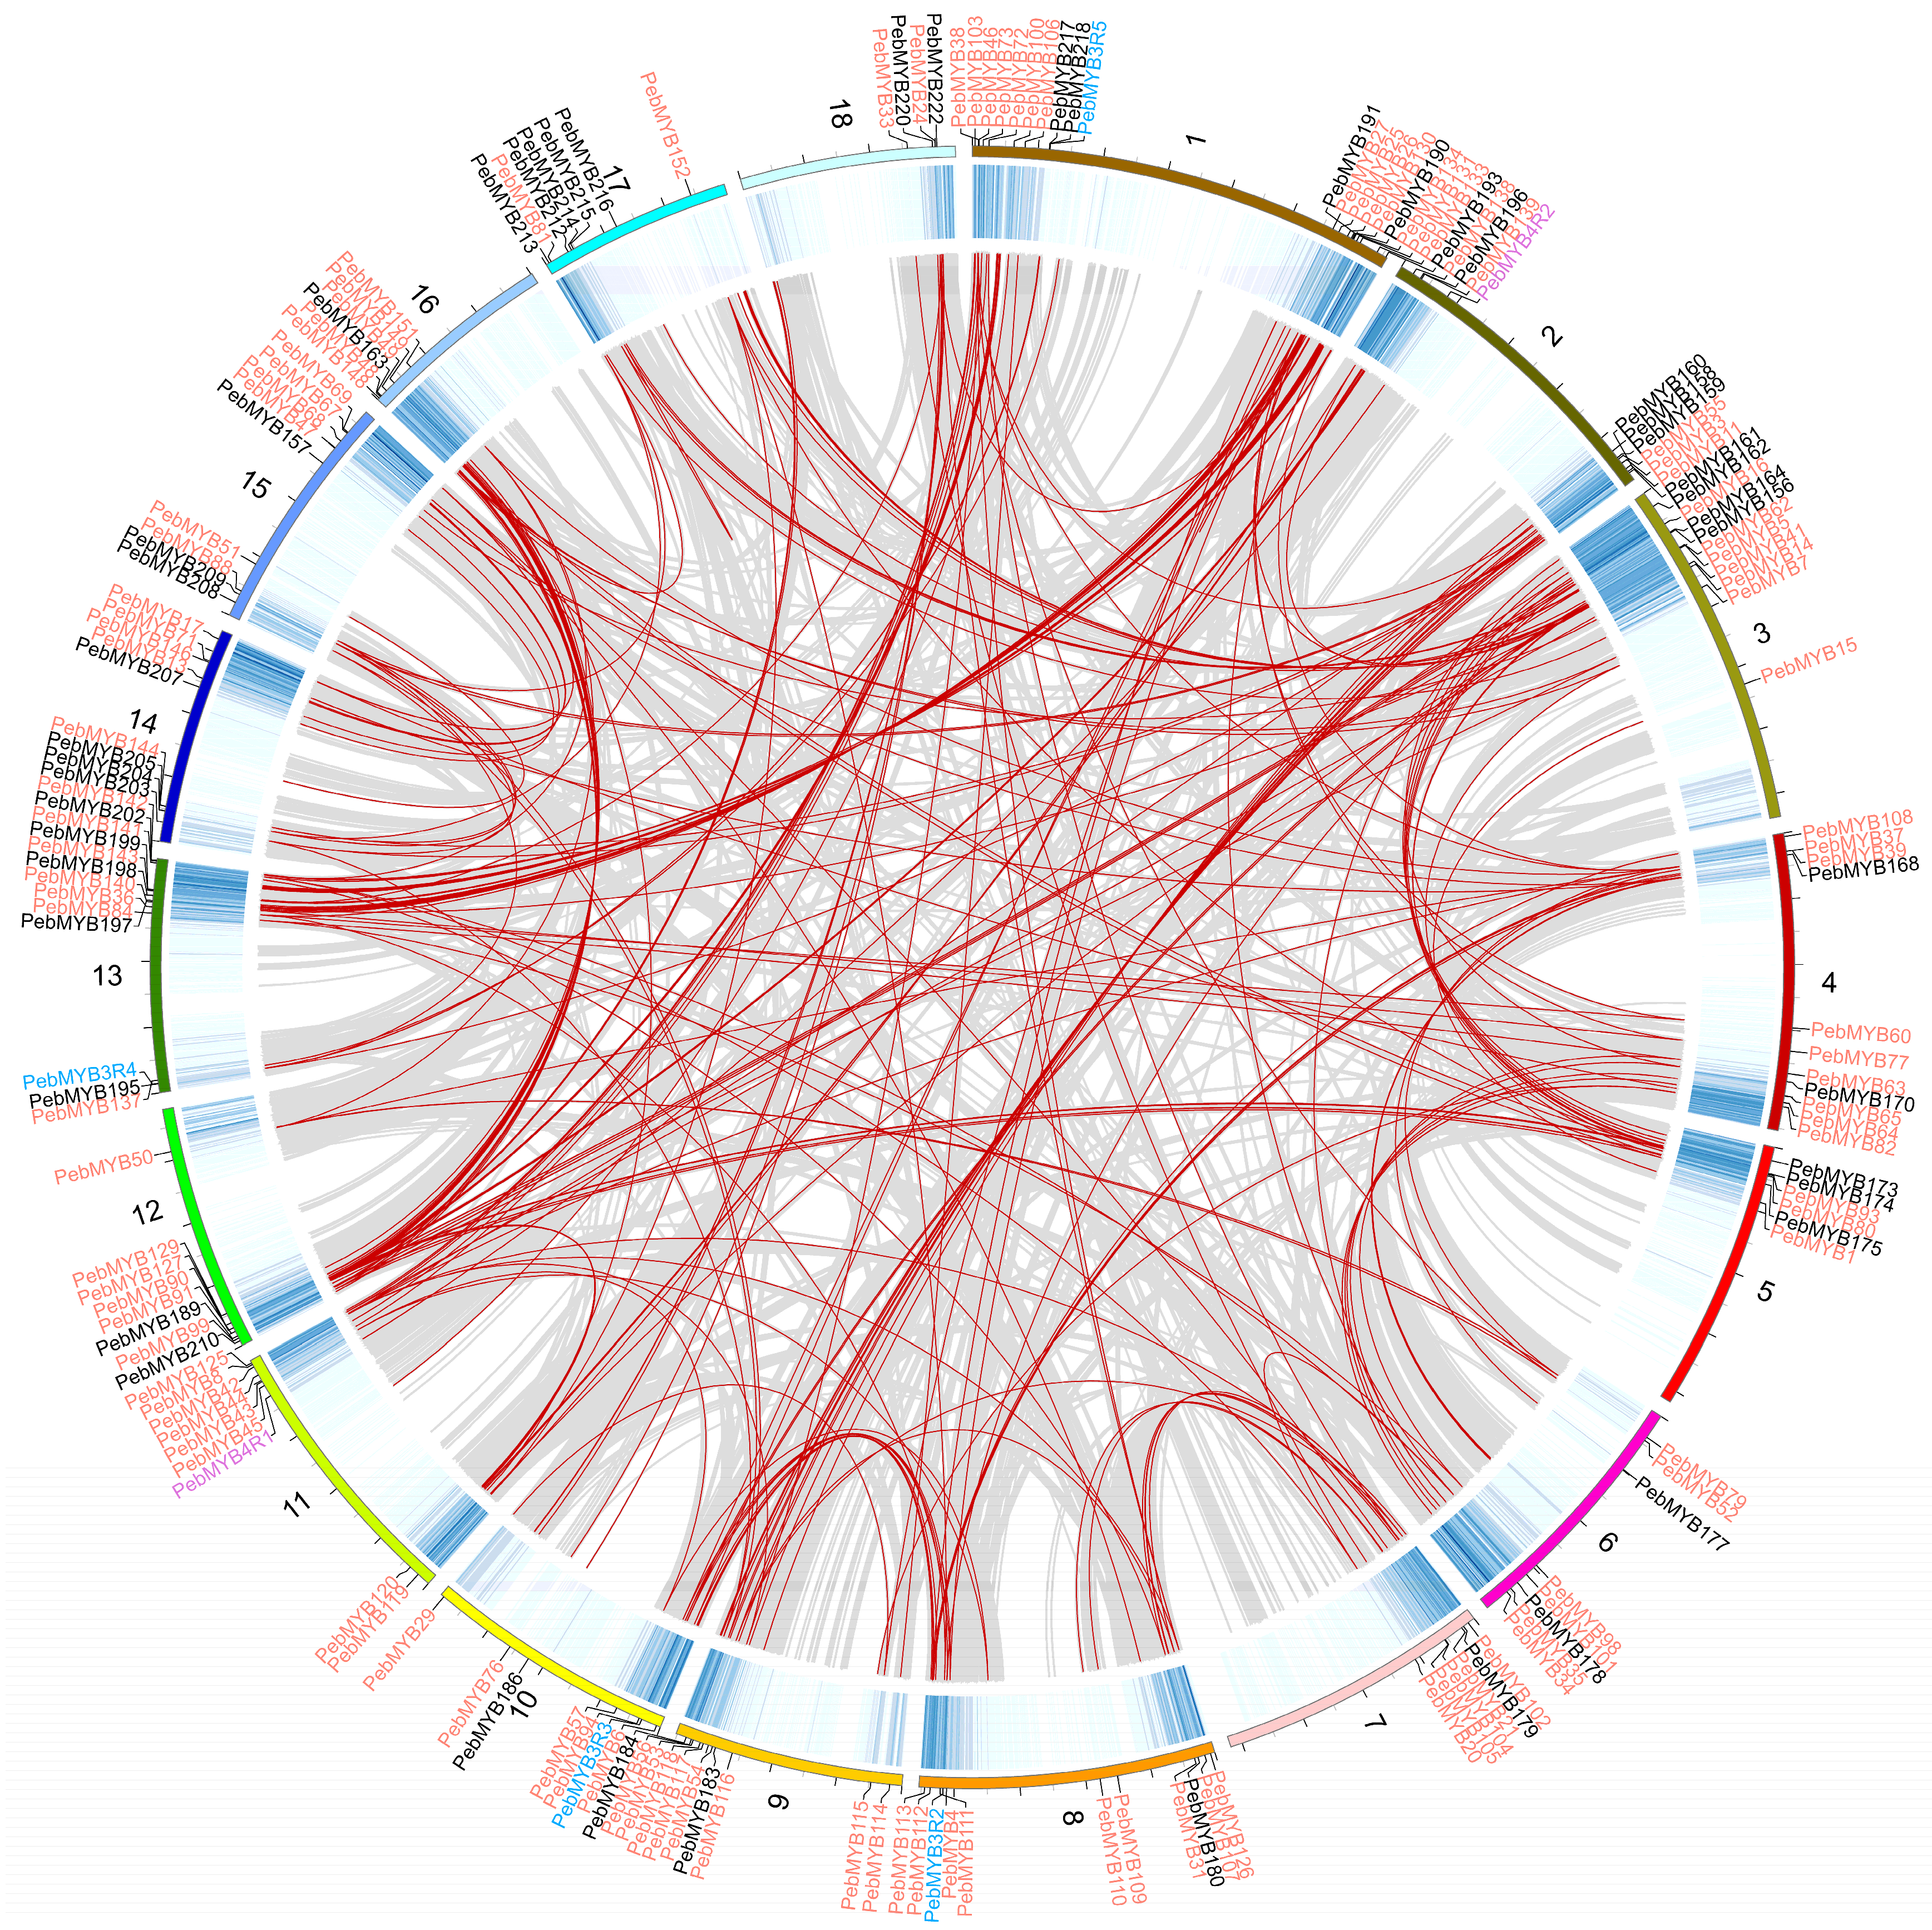
2.4. Gene Duplications and Synteny Analysis of PebMYB Genes

Gene duplication events play a crucial role in the diversity and evolution of gene families. To further understand the evolution and expansion of the PebMYB genes, a duplication analysis was performed. The analysis revealed a total of 291 pairs of segmental duplicated genes, including 176 PebMYB genes (Supplemental Table S4). The nonsynonymous and synonymous substitution ratios (Ka/Ks) values of all segmental duplicated gene pairs were significantly less than 1, suggesting that purifying selection may have played an important role in the evolution of the PebMYB genes. Interestingly, only 3 pairs of tandem duplicated PebMYB genes (PebMYB147, PebMYB195, and PebMYB209) were found.
Most PebMYB genes were located at the ends of chromosomes and were distributed unevenly across these regions (Figure 5 and Figure S1). Additionally, gene duplications were found in all chromosomes (Figure 5).
Synteny analysis of MYB genes between P. eburnea and two species (A. thaliana and Oryza sativa) revealed 234 orthologous gene pairs between P. eburnea and A. thaliana, whereas 35 orthologous gene pairs were found between P. eburnea and O. sativa (Figure S3). The synteny analysis results showed 26 collinear gene pairs across the three species, indicating that 107 collinear pairs between A. thaliana and P. eburnea no longer existed between P. eburnea and O. sativa (Supplemental Table S5).

2.5. Expression Profiles of PebMYB Genes in Different Tissues

The expression patterns of PebMYB genes in stems, roots, buds, and leaves of P. eburnea were studied using RNA-seq data. Twelve PebMYB genes that showed no expression in any of the four tissues were excluded from the expression analysis. The remaining genes could be divided into five groups (I to V) based on their expression profiles. In group I, 30 PebMYB genes were highly expressed in leaf tissue, while 55 genes in group II were predominantly expressed in buds. The members of groups III and V (22 and 77 genes, respectively) showed high expression levels in the stem and root, respectively. Furthermore, the members of group IV (34 genes) showed high expression in both root and stem tissues (Figure 6A, Supplemental Table S6).
Furthermore, the cis-elements present in the promoters of PebMYB genes were analyzed to gain insights into their regulatory mechanisms. The cis-elements were primarily divided into four groups based on their functions: light response, stress response, hormone response, and others (Figure 6B, Supplemental Table S7). Notably, the hormone response and light response cis-elements were particularly abundant among the analyzed genes.
To verify the expression profiles from the RNA-seq data, several genes with high expression levels (fragments per kilobase of exon model per million mapped fragments, FPKM > 2) in at least one tissue were randomly selected, and the expression levels were determined by qRT-PCR. The relative expression levels of the chosen genes (11 genes) determined by qRT-PCR were consistent with the trends observed in the RNA-seq data, further supporting the reliability and accuracy of the RNA-seq results (Supplementary Figure S4, Table S6).

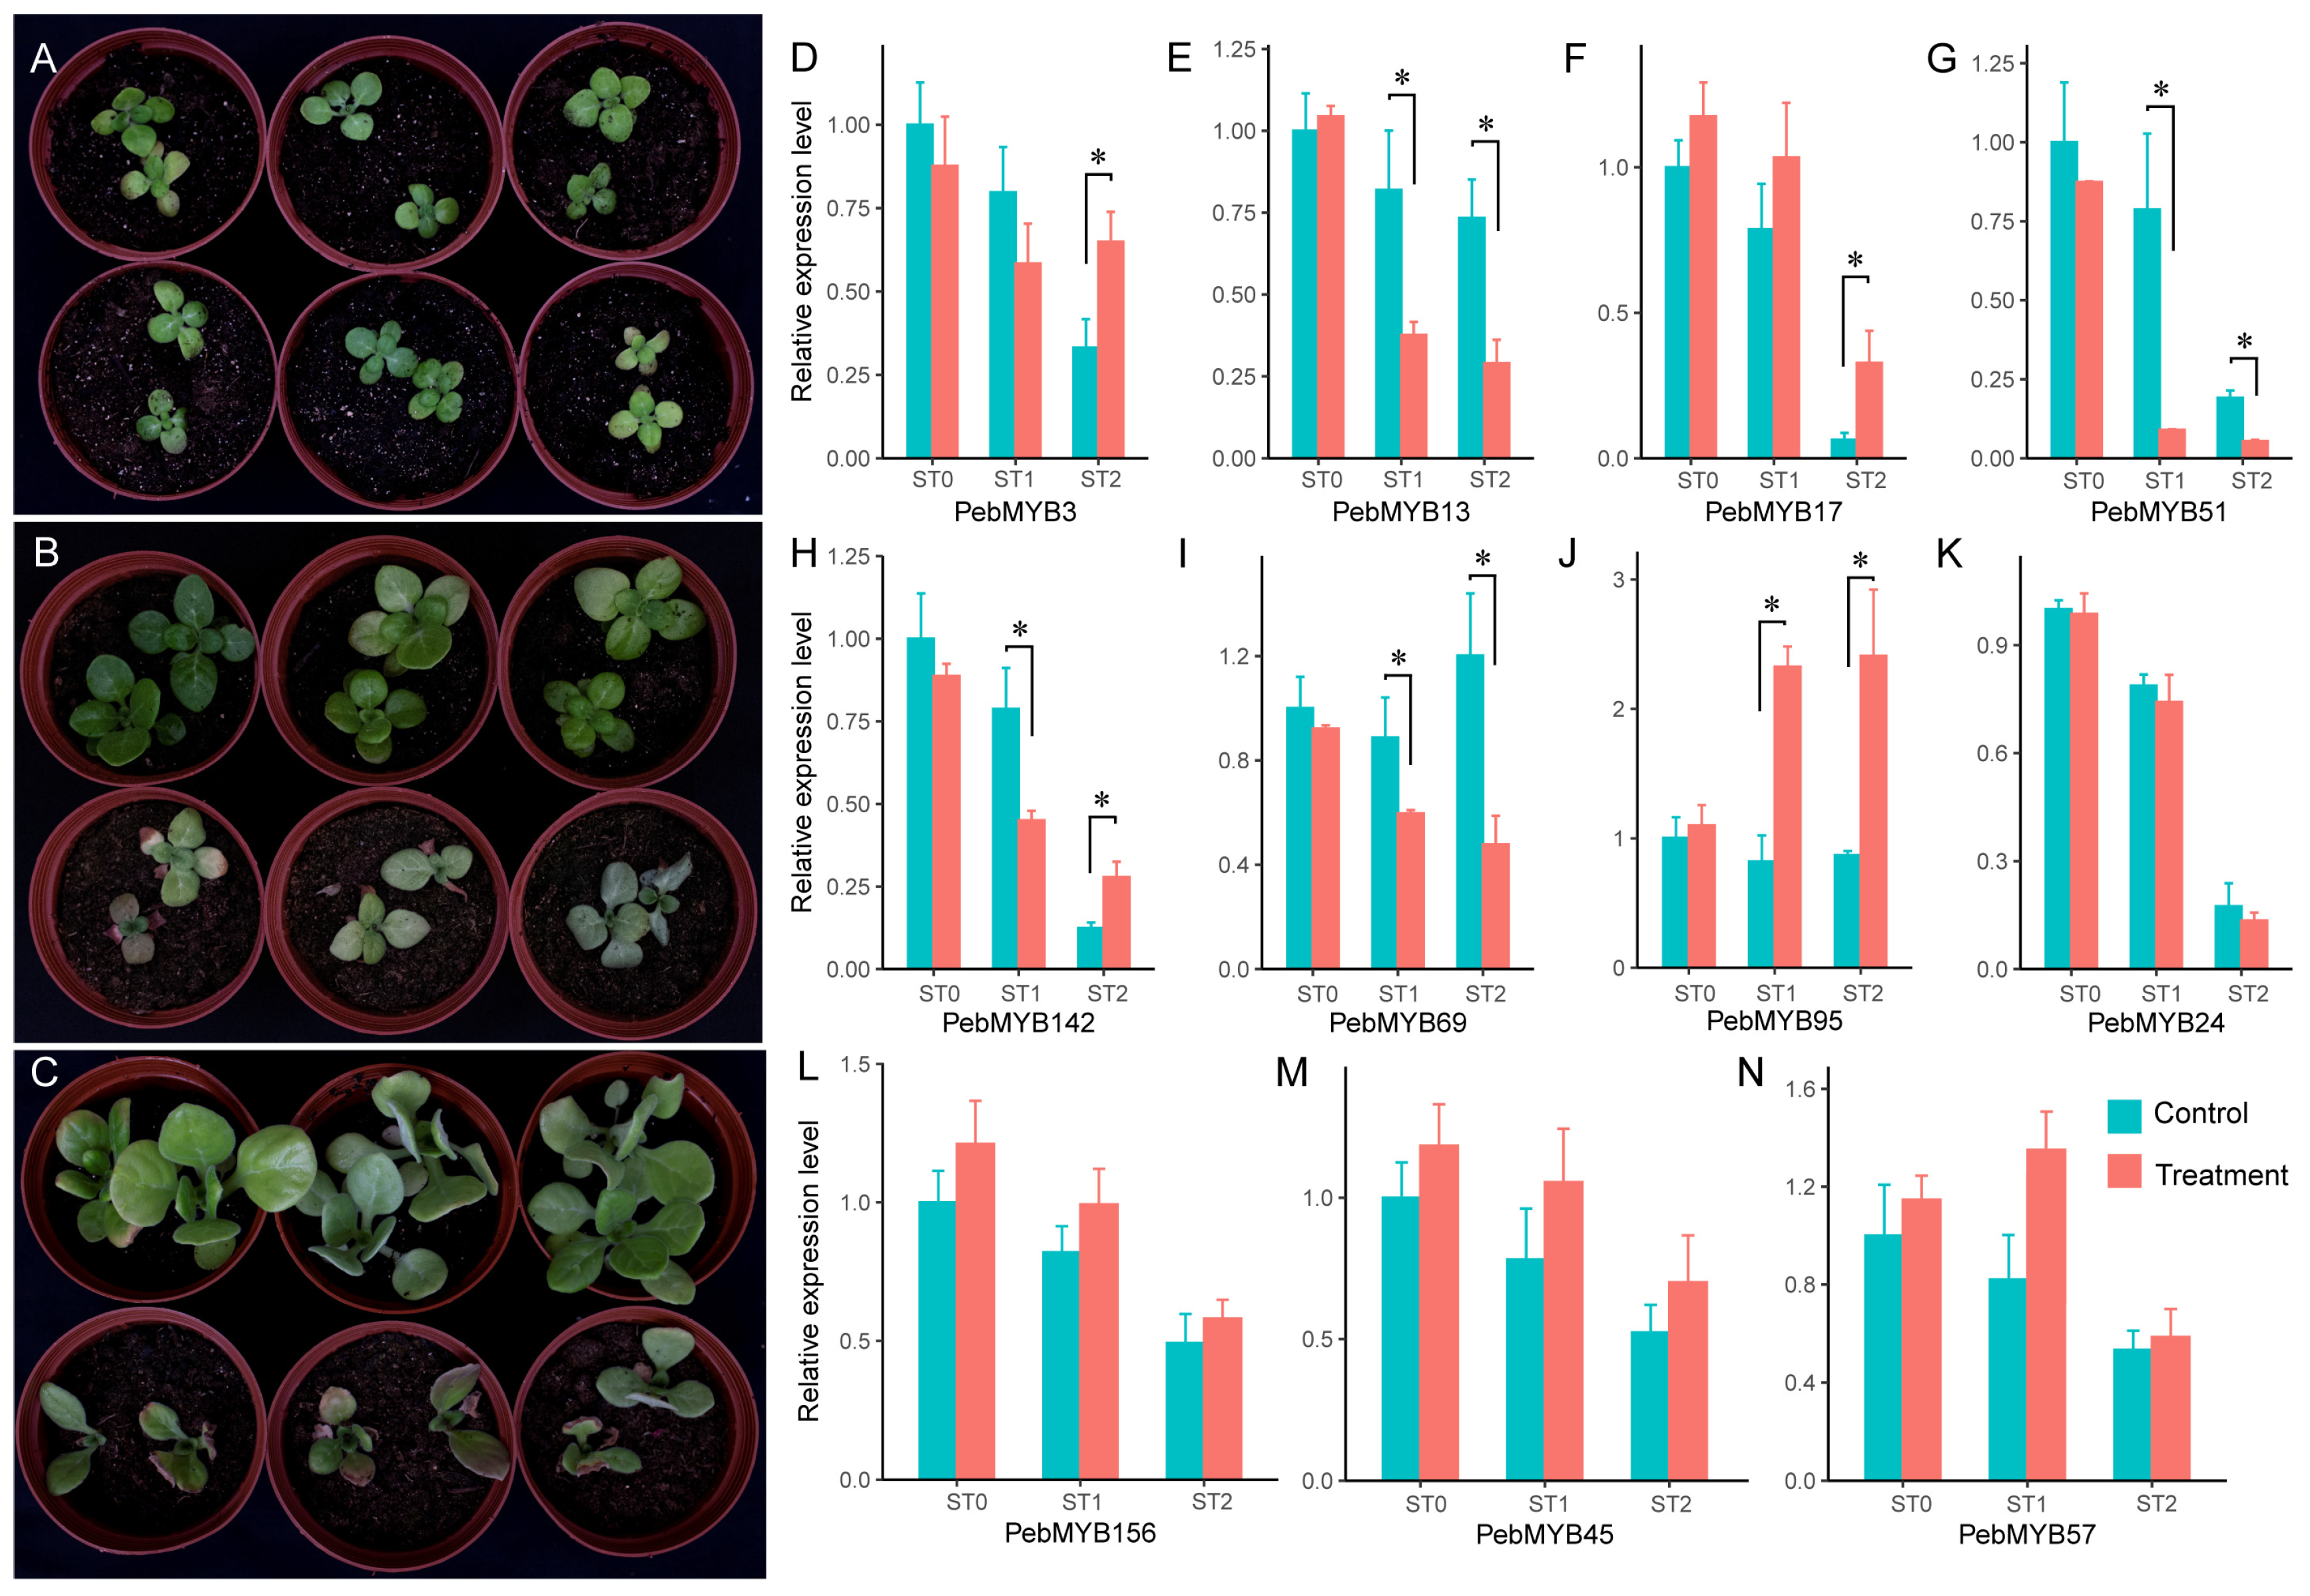
2.6. Expression Analysis of PebMYB in Drought Stress

MYB genes play a variety of roles, including anthocyanin biosynthesis, drought stress response, and many other functions. This notion was supported by the results of the promoter analysis, which highlighted numerous PebMYB genes associated with the stress response (Figure 6B). To investigate the role of PebMYB genes in the drought stress response, an experiment involving drought stress treatment was carried out. We conducted a homology search with the genome of A. thaliana using the protein sequences of 230 PebMYB genes. Based on functional annotation of the homologous genes in A. thaliana and their phylogenetic relationships, 11 PebMYB genes were selected for further investigation. The relative expression levels of the selected genes were determined by qRT-PCR at different developmental stages (ST0, ST1, and ST2).
Among these selected genes, PebMYB3 exhibited homology to AtMYB44 (AT5G67300) and AtMYB77 (AT3G50060), which is recognized for their involvement in mediating crosstalk between different signaling pathways in response to drought stress. Notably, these pathways included the ABA, auxin, salicylic acid (SA), and methyl jasmonate (MeJA) regulatory pathways, ultimately activating genes to prevent reactive oxygen species (ROS) accumulation [36,37,38]. Differential expression was observed between the control and treatment groups after treatment for 2 months (ST2 in Figure 7D). PebMYB13, along with its homologous gene AT1G09540 (AtMYB61), was selected due to its role in processes such as stoma movement, root development, and seed germination. Interestingly, we noticed that the expression levels were significantly decreased in the treatment group compared to the control group in ST1 and ST2 (Figure 7E). In A. thaliana, a high expression level of AtMYB61 could reduce stomatal aperture and stomatal conductance [39]. Likewise, PebMYB17, a homologous gene of AT4G28110 (AtMYB41, function in suberin synthesis and assembly), was expressed significantly differential expression in ST2 (Figure 7F) [40,41]. AT2G47190 (AtMYB2) and AT3G06490 (AtMYB108) are homologous genes of PebMYB51 that play crucial roles in response to drought and salt stress and regulate filament elongation and anther dehiscence through the jasmonic acid (JA) and gibberellic acid (GA) regulatory pathways [42,43]. The expression of PebMYB51 displayed a rapid decline in the treatment group (Figure 7G). As the homologous gene of PebMYB142, AT2G02820 (AtMYB88) is responsible for limiting cell division in the stomatal lineage and promoting stomatal closure in response to abiotic stress through the ABA regulatory pathway [44]. Furthermore, AT3G23250 (AtMYB15, homologous to PebMYB69) was involved in responding to various stresses via ABA biosynthesis and signaling in A. thaliana. PebMYB95 was homologous to AT1G17950 (AtMYB52), which played crucial roles in cell wall architecture formation and affected ABA biosynthesis and response in A. thaliana [45]. In P. eburnea, the relative expression of PebMYB142, PebMYB69, and PebMYB95 significantly differed between the treatment and control groups in ST1 and ST2 (Figure 7H–J and Figure S5).
PebMYB45 and PebMYB57 shared homology with AT1G08810 (AtMYB60), a gene known for its involvement in the drought stress response, and were specifically expressed in guard cells and promoted stomatal opening when highly expressed [46,47]. However, the relative expression levels of PebMYB45 and PebMYB57 showed no significant difference between the control and treatment groups in P. eburnea (Figure 7M,N). Similarly, no significant differences were observed for PebMYB156, which is a homologous gene of AT5G56840 with functions related to dehydration stress memory and sugar metabolism (Figure 7L) [48,49]. The homologous genes of PebMYB24, AT3G47600 (AtMYB94), and AT5G62470 (AtMYB96) played important roles in cuticular wax biosynthesis and accumulation in response to drought stress. However, no significant differences in expression were found between the control and treatment groups (Figure 7K) [50,51].
These results suggest that seven PebMYB genes (PebMYB3, PebMYB13, PebMYB17, PebMYB51, PebMYB142, PebMYB69, and PebMYB95) likely play important roles in the drought stress response in P. eburnea. However, it appears that PebMYB45, PebMYB57, PebMYB24, and PebMYB156 do not respond to drought stress, as observed in A. thaliana. Further studies are needed to validate these findings and to elucidate the specific functions of these genes in the molecular mechanisms underlying drought stress adaptation in P. eburnea.

2.7. The Potential Co-Expression Network between PebMYBs and Other TFs

MYB genes could cooperate with other TFs to regulate their expression. To investigate the cooperative interactions, we calculated the PCC between PebMYB genes and other TFs across four tissues (Supplementary Table S8). A total of 2359 TFs from 48 families were predicted in this study using a cutoff PCC value greater than 0.95. These TFs were used to construct an interaction network (Figure S6). Among the interacting TFs, members from the AP2/ERF, C2H2, and WRKY families displayed prominent TFs that interact with PebMYB genes (Figure S6A). Further investigation revealed interesting patterns of interaction clustering in the network. For example, a notable cluster comprised more than 30 R2R3-type PebMYB genes, forming a complex network (Figure S6B). This observation suggested that developmental processes may be regulated by an intriguing network of multiple interacting partners. The interaction network of PebMYB genes and other TFs provided useful information for further investigation of the interactions between PebMYB genes and other TFs.

3. Discussion

P. eburnea is a promising candidate for development into ornamental plants, primarily due to its unique flower shape and colors [27,45]. Unlike the other species in the genus Primulina, which have limited endemic distributions, P. eburnea is widespread across several provinces in southern China, including diverse landscapes such as the Danxia and karst landforms. In addition, the natural soil conditions of its habitat do not retain water for extended periods, resulting in aperiodic drought stress. However, little is known about how P. eburnea adapts and responds to unpredictable drought stress. Unraveling the mechanisms by which P. eburnea adapts to the challenges of drought stress has important implications. Not only does it enrich our knowledge of how this species responds to drought conditions, but it also lays a foundation for advancing its conservation.
The MYB gene family is involved in regulating various biological activities, such as signal transduction, anthocyanin biosynthesis, and abiotic stress response [9,11,52]. However, comprehensive studies on the MYB gene family in P. eburnea have yet to be conducted. Here, we identified 230 PebMYB genes in P. eburnea. This number was greater than those found in A. thaliana (196) and Populus trichocarpa (197) but less than those in Primulina swinglei (264) and Brassica rapa (293) [9,53]. The reason may be the differential rates of gene family contraction or expansion among different lineages [54].
In the majority of subgroups, the number of PebMYB genes closely followed that of AtMYB genes, with a few exceptions. For instance, there was only one AtMYB gene in subgroup S4 while harboring four PebMYB genes. Similarly, S10 exhibited a comparable pattern with 11 AtMYB genes and 17 PebMYB genes. This gene expansion may be responsible for the gene duplication and differentiation of gene function [55]. For instance, AtMYB91 in S4 is known to be involved in the specification of the leaf proximodistal axis [56]. Similar observations were found in S10, where members (AtMYB103, AtMYB26, etc.) contribute to lignin biosynthesis and stamen development [57,58]. Conversely, gene contraction was also found in certain groups. For instance, nine AtMYB genes in S5 coexisted with four PebMYB genes, while S15 consisted of 16 AtMYB genes and nine PebMYB genes (Figure 1). The majority of members in S5 (AtMYB115, AtMYB119, etc.) were involved in the regulation of glucosinolate biosynthesis. These natural chemicals likely enhance plant defenses against pests and confer the characteristic bitter flavor property in cruciferous vegetables [59]. Members of S15 (AtMYB15, AtMYB17, AtMYB28, etc.) play roles in lignin biosynthesis and stress resistance [60,61,62]. The expansion or contraction of PebMYB genes may result from asymmetric gene duplication events in different subgroups [63].
Furthermore, certain PebMYB genes (PebMYB45, PebMYB57, PebMYB47, PebMYB13, etc.) may also be involved in the response to drought stress based on gene homology analysis and functional characterization. This finding was also confirmed by qRT-PCR analysis, showing that seven PebMYB genes were associated with the drought stress response (Figure 7D–J). Notably, the similar functions of the PebMYB genes and their homologous genes in A. thaliana were found in other species as well. For example, AtMYB60 and its ortholog in grape (Vitis vinifera), VvMYB60, also respond to drought stress, salt stress, and ABA treatment [64]. The homologous gene of AtMYB15 in Chrysanthemum morifolium (CmMYB15) was associated with biotic stress resistance [65].
Gene duplication events, such as whole-genome duplication, tandem duplication, and segmental duplication, are major sources of new gene formation and functional diversity, playing a crucial role in evolution [66]. In this study, we screened duplication events and found that 176 PebMYB genes were derived from segmental duplication. Remarkably, these genes accounted for 76.5% of the total PebMYB genes and a mere 1.03% of the total duplicated genes (17,026 genes). This finding suggested that segmental duplications likely contributed to the diversification and expansion of PebMYB genes under purifying selection, which was also observed in the study of pearl millet [67]. Interestingly, we found that only three PebMYB genes were derived from tandem duplication, suggesting a relatively limited role of tandem duplication in the expansion of MYB genes in P. eburnea that was also observed in soybean and tobacco [68,69].

4. Materials and Methods

4.1. Identification of MYB Members

The whole genome sequences and protein sequences of P. eburnea were retrieved from a previous study [70]. A total of 198 sequences of Arabidopsis MYB genes (including 126 2R-MYB, 64 1R-MYB, five 3R-MYB, and three 4R-MYB) were downloaded from TAIR (www.arabidopsis.org, accessed on 25 May 2023) according to a previous study [16]. The Arabidopsis protein sequences were used as queries in BLAST v2.13.0 to identify P. eburnea MYB candidates with an e-value ≤ 1 × 10⁻⁵ and a bit score ≥ 100 [10,71]. The conserved domains of each candidate were confirmed in the InterPro database (www.ebi.ac.uk/interpro, accessed on 5 June 2023), while members lacking MYB domains were eliminated [72]. The Mw and pI of the proteins were determined by the TBtools program and the Expasy online program (https://web.expasy.org/compute_pi, accessed on 15 June 2023) [73,74]. The locations of PebMYB genes were obtained from the annotation file and visualized in TBtools.

4.2. Sequence Alignment and Phylogenetic Analysis

The protein sequences of PebMYB genes and 198 AtMYB genes were divided into two distinct categories based on their types (R2R3-MYB genes and the remaining types) and then used for multiple sequence alignment by MAFFT v7.505 software with default parameters [75,76]. To reveal the relationship between the PebMYB and AtMYB genes, phylogenetic analysis using the maximum-likelihood (ML) method was performed by IQ-TREE v1.6.12 software with parameters of 1000 ultrafast bootstraps and automatic model selection [77]. The phylogenetic results were then visualized in the iTOL (http://itol.embl.de, accessed on 10 July 2023) online program [78].

4.3. Analysis of Gene Structure, Motif and Cis-Acting Elements

The online MEME program (https://meme-suite.org/meme/tools/meme, accessed on 25 July 2023) was used to investigate the conserved motifs in the MYB genes of P. eburnea with the following parameters: maximum number of motifs detected = 20 and number of repeats = any [79]. The annotation file of the P. eburnea genome was used to define the gene structure, and the PebMYB protein sequences were used to construct an ML tree with the aforementioned method.
The promoter sequences of PebMYB genes (2000 bp upstream of the start codon) were extracted from the genome sequences according to the annotation file. The sequences were used to search for potential cis-acting elements in the PlantCARE online program (http://bioinformatics.psb.ugent.be/webtools/plantcare/html/, accessed on 5 September 2023). These elements were grouped into four groups based on their functions.

4.4. Gene Duplication and Synteny Analysis of PebMYB Genes

A BLASTp search was performed using 230 PebMYB protein sequences as queries against all protein sequences of P. eburnea with an e-value cutoff of 1 × 10⁻⁵. The collinearity relationship of the genome was calculated using MCScanX software according to the BLAST results and the genome annotation results [80]. The segmentally duplicated genes, gene density, and location information in the given annotated file were then visualized in Circos v0.69.9, while genes situated on unanchored scaffolds were omitted [81]. The Ka/Ks were calculated in TBtools based on the collinearity results of MCScanX analysis. The collinearity results between P. eburnea and other species were analyzed in MCScanX and visualized with TBtools.

4.5. RNA-seq Data Analysis and Network Construction

The RNA-seq data of four tissues (bud leaf, mature leaf, root, and stem) in P. eburnea were retrieved from a previous study [70]. After mapping reads to the genome of P. eburnea in HISAT2, the FPKM values of each gene were generated [82]. The FPKM values were normalized with the Z score method and visualized by the pheatmap package of R v4.2.2 to generate a heatmap.
For interacting network analysis, all the TFs with an FPKM greater than 1 in any of the tissues were selected for calculating the Pearson correlation coefficient (PCC). Only the absolute value of PCC greater than 0.95 was considered a potential interaction. The interacting network was constructed by Cytoscape v3.10.0 [83].

4.6. Drought Stress Treatment and qRT-PCR

For drought stress treatment, the seeds of P. eburnea were germinated in plastic pots with soil in a chamber at 25 °C and relative humidity at 70%. To ensure the uniformity of seedlings, every two uniform seedlings were transplanted to a pot filled with the same amount of soil and grown at Lushan Botanical Garden, Chinese Academy of Sciences, Nanchang, Jiangxi Province, China (115.8382° E; 28.9112° N). Six pots were divided into two groups (control and treatment). All plants were irrigated equally before treatment until they reached the 4-leaf stage. Drought stress was induced by ceasing irrigation for the treatment group, while seedlings in the control group were irrigated normally. Seedling leaves were sampled at three specific time points: before the initiation of drought stress treatment (stage 0, ST0) and after one month (stage 1, ST1) and two months (stage 2, ST2) of exposure to drought stress treatment.
For qRT-PCR analysis, total RNA was extracted from samples using an EASYspin Plus Complex Plant RNA kit (Aidlab Biotech, Beijing, China) according to the manufacturer’s instructions. First-strand cDNA was synthesized from 1 µg RNA with One-Step gDNA Removal and cDNA Synthesis SuperMix (TransGen, Beijing, China). qRTC-PCR was performed with PerfectStart Green qPCR SuperMix (TransGen, Beijing, China) on a CFX Connect Real-Time System (Bio-Rad, Hercules, CA, USA). The expression levels of the selected PebMYB genes were determined according to the comparative CT (2−ΔΔCt) method [84]. The P. eburnea glyceraldehyde-3-phosphate dehydrogenase (PebGAPDH1) was used as the internal reference gene. All qRT-PCRs were performed with three biological and three technical replicates. All primer sequences were designed by Primer Premier 5.0 and are listed in Supplementary Table S9.

5. Conclusions

In this study, a total of 230 PebMYB genes were identified in P. eburnea, including 67 1R-MYB, 155 R2R3-MYB, six 3R-MYB, and two 4R-MYB genes. A comprehensive analysis was performed to investigate phylogenetic relationships, motifs, gene structure, and synteny in P. eburnea. The prevalent purifying selection observed in the evolution of the PebMYB genes highlights their functional conservation based on the Ka/Ks results. Further analysis of the expression of the PebMYB genes in four different tissues revealed that they could be divided into five groups based on their expression characteristics. The expression profiles were verified by qRT-PCR analysis. Importantly, the identification of PebMYB genes that were homologous to drought-responsive genes in A. thaliana, as well as the characterization of their expression under drought stress, broadened our understanding of their potential roles in drought adaptation. The seven genes (PebMYB3, PebMYB13, PebMYB17, PebMYB51, PebMYB142, PebMYB69, and PebMYB95) showed significant differences between the control and drought treatments, suggesting that they are likely involved in the drought stress response in P. eburnea.
Our findings shed a basis on understanding MYB genes in P. eburnea and provide valuable insights for future studies investigating the molecular mechanisms underlying drought stress. Moreover, these results serve as a valuable resource for future genetic engineering and breeding programs aimed at improving the drought tolerance of P. eburnea and related species.

Supplementary Materials

The following supporting information can be downloaded at: https://www.mdpi.com/article/10.3390/ijms25010465/s1.

Author Contributions

C.F. designed and conceived the study. J.Z. and Y.Z. performed the bioinformatic analysis and wet experiments. J.Z. wrote the paper with contributions from all authors. All authors have read and agreed to the published version of the manuscript.

Funding

This work was supported by the Biological Resources Program, Chinese Academy of Sciences (KFJ-BRP-007-013), Innovation Leading Talent Program in Jiangxi Province (JXSQ2023101107), and the Plant Special Project of Lushan Botanical Garden, Chinese Academic of Science (2022ZWZX05).

Institutional Review Board Statement

Not applicable.

Informed Consent Statement

Not applicable.

Data Availability Statement

The transcriptomic sequencing data can be downloaded in the NCBI Sequence Read Archive under accession number PRJNA934730.

Acknowledgments

We would like to thank Nanchang Botanical Garden for providing the greenhouse for seedling cultivation.

Conflicts of Interest

The authors declare no conflicts of interest.

References

  1. Farooq, M.; Wahid, A.; Kobayashi, N.S.M.A.; Fujita, D.B.S.M.A.; Basra, S.M.A. Plant drought stress: Effects, mechanisms and management. Agron. Sustain. Dev. 2009, 29, 185–212. [Google Scholar] [CrossRef]
  2. Zhang, H.; Zhu, J.; Gong, Z.; Zhu, J.K. Abiotic stress responses in plants. Nat. Rev. Genet. 2022, 23, 104–119. [Google Scholar] [CrossRef]
  3. Shinozaki, K.; Yamaguchi-Shinozaki, K. Gene networks involved in drought stress response and tolerance. J. Exp. Bot. 2006, 58, 221–227. [Google Scholar] [CrossRef] [PubMed]
  4. Zhu, J.K. Salt and drought stress signal transduction in plants. Annu. Rev. Plant Biol. 2002, 53, 247–273. [Google Scholar] [CrossRef] [PubMed]
  5. Xiong, H.; Yu, J.; Miao, J.; Li, J.; Zhang, H.; Wang, X.; Liu, P.; Zhao, Y.; Jiang, C.; Yin, Z.; et al. Natural Variation in OsLG3 Increases Drought Tolerance in Rice by Inducing ROS Scavenging. Plant Physiol. 2018, 178, 451–467. [Google Scholar] [CrossRef] [PubMed]
  6. Wang, X.; Wang, H.; Liu, S.; Ferjani, A.; Li, J.; Yan, J.; Yang, X.; Qin, F. Genetic variation in ZmVPP1 contributes to drought tolerance in maize seedlings. Nat. Genet. 2016, 48, 1233–1241. [Google Scholar] [CrossRef] [PubMed]
  7. Zhang, L.; Zhao, G.; Xia, C.; Jia, J.; Liu, X.; Kong, X. A wheat R2R3-MYB gene, TaMYB30-B, improves drought stress tolerance in transgenic Arabidopsis. J. Exp. Bot. 2012, 63, 5873–5885. [Google Scholar] [CrossRef]
  8. Du, H.; Zhang, L.; Liu, L.; Tang, X.-F.; Yang, W.-J.; Wu, Y.-M.; Huang, Y.-B.; Tang, Y.-X. Biochemical and molecular characterization of plant MYB transcription factor family. Biochemistry 2009, 74, 1–11. [Google Scholar] [CrossRef]
  9. Dubos, C.; Stracke, R.; Grotewold, E.; Weisshaar, B.; Martin, C.; Lepiniec, L. MYB transcription factors in Arabidopsis. Trends Plant Sci. 2010, 15, 573–581. [Google Scholar] [CrossRef]
  10. Stracke, R.; Werber, M.; Weisshaar, B. The R2R3-MYB gene family in Arabidopsis thaliana. Curr. Opin. Plant Biol. 2001, 4, 447–456. [Google Scholar] [CrossRef]
  11. Jin, H.; Martin, C. Multifunctionality and diversity within the plant MYB-gene family. Plant Mol. Biol. 1999, 41, 577–585. [Google Scholar] [CrossRef] [PubMed]
  12. Zhou, L.; Yarra, R.; Jin, L.; Cao, H. Genome-wide identification and expression analysis of MYB gene family in oil palm (Elaeis guineensis Jacq.) under abiotic stress conditions. Environ. Exp. Bot. 2020, 180, 104245. [Google Scholar] [CrossRef]
  13. Li, Y.; Liang, J.; Zeng, X.; Guo, H.; Luo, Y.; Kear, P.; Zhang, S.; Zhu, G. Genome-wide Analysis of MYB Gene Family in Potato Provides Insights into Tissue-specific Regulation of Anthocyanin Biosynthesis. Hortic. Plant J. 2021, 7, 129–141. [Google Scholar] [CrossRef]
  14. Du, H.; Feng, B.-R.; Yang, S.-S.; Huang, Y.-B.; Tang, Y.-X. The R2R3-MYB transcription factor gene family in maize. PLoS ONE 2012, 7, e37463. [Google Scholar] [CrossRef] [PubMed]
  15. Matus, J.T.; Aquea, F.; Arce-Johnson, P. Analysis of the grape MYB R2R3 subfamily reveals expanded wine quality-related clades and conserved gene structure organization across Vitis and Arabidopsis genomes. BMC Plant Biol. 2008, 8, 83. [Google Scholar] [CrossRef] [PubMed]
  16. Chen, Y.; Yang, X.; He, K.; Liu, M.; Li, J.; Gao, Z.; Lin, Z.; Zhang, Y.; Wang, X.; Qiu, X.; et al. The MYB transcription factor superfamily of Arabidopsis: Expression analysis and phylogenetic comparison with the rice MYB family. Plant Mol. Biol. 2006, 60, 107–124. [Google Scholar] [CrossRef]
  17. Baldoni, E.; Genga, A.; Cominelli, E. Plant MYB Transcription Factors: Their Role in Drought Response Mechanisms. Int. J. Mol. Sci. 2015, 16, 15811–15851. [Google Scholar] [CrossRef]
  18. Park, M.Y.; Kang, J.-y.; Kim, S.Y. Overexpression of AtMYB52 confers ABA hypersensitivity and drought tolerance. Mol. Cells 2011, 31, 447–454. [Google Scholar] [CrossRef]
  19. Wu, J.; Jiang, Y.; Liang, Y.; Chen, L.; Chen, W.; Cheng, B. Expression of the maize MYB transcription factor ZmMYB3R enhances drought and salt stress tolerance in transgenic plants. Plant Physiol. Biochem. 2019, 137, 179–188. [Google Scholar] [CrossRef]
  20. Li, S.; Xin, Z.-B.; Chou, W.-C.; Huang, Y.; Pan, B.; Maciejewski, S.; Wen, F. Five new species of the genus Primulina (Gesneriaceae) from Limestone Areas of Guangxi Zhuangzu Autonomous Region, China. PhytoKeys 2019, 127, 77–91. [Google Scholar] [CrossRef]
  21. Weber, A.; Middleton, D.J.; Forrest, A.; Kiew, R.; Lim, C.L.; Rafidah, A.; Sontag, S.; Triboun, P.; Wei, Y.-G.; Yao, T.L. Molecular systematics and remodelling of Chirita and associated genera (Gesneriaceae). Taxon 2011, 60, 767–790. [Google Scholar] [CrossRef]
  22. Wang, Y.; MAO, R.; Liu, Y.; LI, J.M.; Dong, Y.; LI, Z.Y.; Smith, J.F. Phylogenetic reconstruction of Chirita and allies (Gesneriaceae) with taxonomic treatments. J. Syst. Evol. 2011, 49, 50–64. [Google Scholar] [CrossRef]
  23. Hao, Z.; Kuang, Y.; Kang, M.; Niu, S. Untangling the influence of phylogeny, soil and climate on leaf element concentrations in a biodiversity hotspot. Funct. Ecol. 2015, 29, 165–176. [Google Scholar] [CrossRef]
  24. Valente, L.; Phillimore, A.B.; Melo, M.; Warren, B.H.; Clegg, S.M.; Havenstein, K.; Tiedemann, R.; Illera, J.C.; Thébaud, C.; Aschenbach, T.; et al. A simple dynamic model explains the diversity of island birds worldwide. Nature 2020, 579, 92–96. [Google Scholar] [CrossRef]
  25. Martín-Queller, E.; Albert, C.; Dumas, P.-J.; Saatkamp, A. Islands, mainland, and terrestrial fragments: How isolation shapes plant diversity. Ecol. Evol. 2017, 7, 6904–6917. [Google Scholar] [CrossRef] [PubMed]
  26. Wang, Z.; Huang, S.; Hong, X.; Wen, F. Pollination biology of Primulina eburnea. Guihaia 2021, 41, 671–683. [Google Scholar]
  27. Feng, C.; Feng, C.; Kang, M. The first genetic linkage map of Primulina eburnea (Gesneriaceae) based on EST-derived SNP markers. J. Genet. 2016, 95, 377–382. [Google Scholar] [CrossRef] [PubMed]
  28. Yue, A.W.; Fang, W.; Qi-xiang, Z. Evaluation on Ornamental Characterstics and Selection for Promising Species and Varieties of Chirita and Chiritopsis Plants in Guangxi. Acta Hortic. Sin. 2008, 35, 239–250. [Google Scholar]
  29. Wang, W.; Ryu, K.H.; Bruex, A.; Barron, C.; Schiefelbein, J. Molecular Basis for a Cell Fate Switch in Response to Impaired Ribosome Biogenesis in the Arabidopsis Root Epidermis. Plant Cell 2020, 32, 2402–2423. [Google Scholar] [CrossRef]
  30. Liang, T.; Shi, C.; Peng, Y.; Tan, H.; Xin, P.; Yang, Y.; Wang, F.; Li, X.; Chu, J.; Huang, J.; et al. Brassinosteroid-Activated BRI1-EMS-SUPPRESSOR 1 Inhibits Flavonoid Biosynthesis and Coordinates Growth and UV-B Stress Responses in Plants. Plant Cell 2020, 32, 3224–3239. [Google Scholar] [CrossRef]
  31. Maier, A.; Schrader, A.; Kokkelink, L.; Falke, C.; Welter, B.; Iniesto, E.; Rubio, V.; Uhrig, J.F.; Hülskamp, M.; Hoecker, U. Light and the E3 ubiquitin ligase COP1/SPA control the protein stability of the MYB transcription factors PAP1 and PAP2 involved in anthocyanin accumulation in Arabidopsis. Plant J. 2013, 74, 638–651. [Google Scholar] [CrossRef] [PubMed]
  32. Wilkins, O.; Nahal, H.; Foong, J.; Provart, N.J.; Campbell, M.M. Expansion and diversification of the Populus R2R3-MYB family of transcription factors. Plant Physiol. 2009, 149, 981–993. [Google Scholar] [CrossRef] [PubMed]
  33. Zhang, Z.; Zhang, L.; Liu, Y.; Shang, X.; Fang, S. Identification and Expression Analysis of R2R3-MYB Family Genes Associated with Salt Tolerance in Cyclocarya paliurus. Int. J. Mol. Sci. 2022, 23, 3429. [Google Scholar] [CrossRef] [PubMed]
  34. Qing, J.; Dawei, W.; Jun, Z.; Yulan, X.; Bingqi, S.; Fan, Z. Genome-wide characterization and expression analyses of the MYB superfamily genes during developmental stages in Chinese jujube. PeerJ 2019, 7, e6353. [Google Scholar] [CrossRef] [PubMed]
  35. Jia, T.; Ge, Q.; Zhang, S.; Zhang, Z.; Liu, A.; Fan, S.; Jiang, X.; Feng, Y.; Zhang, L.; Niu, D.; et al. UDP-Glucose Dehydrogenases: Identification, Expression, and Function Analyses in Upland Cotton (Gossypium hirsutum). Front. Genet. 2021, 11, 597890. [Google Scholar] [CrossRef] [PubMed]
  36. Persak, H.; Pitzschke, A. Dominant repression by Arabidopsis transcription factor MYB44 causes oxidative damage and hypersensitivity to abiotic stress. Int. J. Mol. Sci. 2014, 15, 2517–2537. [Google Scholar] [CrossRef] [PubMed]
  37. Lü, B.B.; Li, X.J.; Sun, W.W.; Li, L.; Gao, R.; Zhu, Q.; Tian, S.M.; Fu, M.Q.; Yu, H.L.; Tang, X.M.; et al. AtMYB44 regulates resistance to the green peach aphid and diamondback moth by activating EIN2-affected defences in Arabidopsis. Plant Biol. 2013, 15, 841–850. [Google Scholar] [CrossRef]
  38. Shin, R.; Burch, A.Y.; Huppert, K.A.; Tiwari, S.B.; Murphy, A.S.; Guilfoyle, T.J.; Schachtman, D.P. The Arabidopsis transcription factor MYB77 modulates auxin signal transduction. Plant Cell 2007, 19, 2440–2453. [Google Scholar] [CrossRef]
  39. Liang, Y.-K.; Dubos, C.; Dodd, I.C.; Holroyd, G.H.; Hetherington, A.M.; Campbell, M.M. AtMYB61, an R2R3-MYB Transcription Factor Controlling Stomatal Aperture in Arabidopsis thaliana. Curr. Biol. 2005, 15, 1201–1206. [Google Scholar] [CrossRef]
  40. Kosma, D.K.; Murmu, J.; Razeq, F.M.; Santos, P.; Bourgault, R.; Molina, I.; Rowland, O. AtMYB41 activates ectopic suberin synthesis and assembly in multiple plant species and cell types. Plant J. 2014, 80, 216–229. [Google Scholar] [CrossRef]
  41. Cominelli, E.; Sala, T.; Calvi, D.; Gusmaroli, G.; Tonelli, C. Over-expression of the Arabidopsis AtMYB41 gene alters cell expansion and leaf surface permeability. Plant J. 2008, 53, 53–64. [Google Scholar] [CrossRef] [PubMed]
  42. Mandaokar, A.; Thines, B.; Shin, B.; Lange, B.M.; Choi, G.; Koo, Y.J.; Yoo, Y.J.; Choi, Y.D.; Choi, G.; Browse, J. Transcriptional regulators of stamen development in Arabidopsis identified by transcriptional profiling. Plant J. 2006, 46, 984–1008. [Google Scholar] [CrossRef] [PubMed]
  43. Urao, T.; Yamaguchi-Shinozaki, K.; Urao, S.; Shinozaki, K. An Arabidopsis myb homolog is induced by dehydration stress and its gene product binds to the conserved MYB recognition sequence. Plant Cell 1993, 5, 1529–1539. [Google Scholar] [CrossRef] [PubMed]
  44. Xie, Z.; Li, D.; Wang, L.; Sack, F.D.; Grotewold, E. Role of the stomatal development regulators FLP/MYB88 in abiotic stress responses. Plant J. 2010, 64, 731–739. [Google Scholar] [CrossRef] [PubMed]
  45. Zhong, R.; Ye, Z.H. Secondary cell walls: Biosynthesis, patterned deposition and transcriptional regulation. Plant Cell Physiol. 2015, 56, 195–214. [Google Scholar] [CrossRef] [PubMed]
  46. Rusconi, F.; Simeoni, F.; Francia, P.; Cominelli, E.; Conti, L.; Riboni, M.; Simoni, L.; Martin, C.R.; Tonelli, C.; Galbiati, M. The Arabidopsis thaliana MYB60 promoter provides a tool for the spatio-temporal control of gene expression in stomatal guard cells. J. Exp. Bot. 2013, 64, 3361–3371. [Google Scholar] [CrossRef] [PubMed]
  47. Negi, J.; Moriwaki, K.; Konishi, M.; Yokoyama, R.; Nakano, T.; Kusumi, K.; Hashimoto-Sugimoto, M.; Schroeder, J.I.; Nishitani, K.; Yanagisawa, S.; et al. A Dof Transcription Factor, SCAP1, Is Essential for the Development of Functional Stomata in Arabidopsis. Curr. Biol. 2013, 23, 479–484. [Google Scholar] [CrossRef] [PubMed]
  48. Ding, Y.; Liu, N.; Virlouvet, L.; Riethoven, J.-J.; Fromm, M.; Avramova, Z. Four distinct types of dehydration stress memory genes in Arabidopsis thaliana. BMC Plant Biol. 2013, 13, 229. [Google Scholar] [CrossRef]
  49. Muller, R.; Morant, M.; Jarmer, H.; Nilsson, L.; Nielsen, T.H. Genome-Wide Analysis of the Arabidopsis Leaf Transcriptome Reveals Interaction of Phosphate and Sugar Metabolism. Plant Physiol. 2006, 143, 156–171. [Google Scholar] [CrossRef]
  50. Lee, S.B.; Suh, M.C. Cuticular wax biosynthesis is up-regulated by the MYB94 transcription factor in Arabidopsis. Plant Cell Physiol. 2015, 56, 48–60. [Google Scholar] [CrossRef]
  51. Seo, P.J.; Lee, S.B.; Suh, M.C.; Park, M.J.; Go, Y.S.; Park, C.M. The MYB96 transcription factor regulates cuticular wax biosynthesis under drought conditions in Arabidopsis. Plant Cell 2011, 23, 1138–1152. [Google Scholar] [CrossRef] [PubMed]
  52. Zhang, T.; Zhao, Y.; Wang, Y.; Liu, Z.; Gao, C. Comprehensive Analysis of MYB Gene Family and Their Expressions Under Abiotic Stresses and Hormone Treatments in Tamarix hispida. Front. Plant Sci. 2018, 9, 1303. [Google Scholar] [CrossRef] [PubMed]
  53. Jin, J.; Tian, F.; Yang, D.-C.; Meng, Y.-Q.; Kong, L.; Luo, J.; Gao, G. PlantTFDB 4.0: Toward a central hub for transcription factors and regulatory interactions in plants. Nucleic Acids Res. 2016, 45, D1040–D1045. [Google Scholar] [CrossRef] [PubMed]
  54. Guo, Y.-L. Gene family evolution in green plants with emphasis on the origination and evolution of Arabidopsis thaliana genes. Plant J. 2013, 73, 941–951. [Google Scholar] [CrossRef] [PubMed]
  55. Chen, Q.; Zhang, X.; Fang, Y.; Wang, B.; Xu, S.; Zhao, K.; Zhang, J.; Fang, J. Genome-Wide Identification and Expression Analysis of the R2R3-MYB Transcription Factor Family Revealed Their Potential Roles in the Flowering Process in Longan (Dimocarpus longan). Front. Plant Sci. 2022, 13, 820439. [Google Scholar] [CrossRef] [PubMed]
  56. Luo, L.; Ando, S.; Sakamoto, Y.; Suzuki, T.; Takahashi, H.; Ishibashi, N.; Kojima, S.; Kurihara, D.; Higashiyama, T.; Yamamoto, K.T.; et al. The formation of perinucleolar bodies is important for normal leaf development and requires the zinc-finger DNA-binding motif in Arabidopsis ASYMMETRIC LEAVES2. Plant J. 2020, 101, 1118–1134. [Google Scholar] [CrossRef]
  57. Öhman, D.; Demedts, B.; Kumar, M.; Gerber, L.; Gorzsás, A.; Goeminne, G.; Hedenström, M.; Ellis, B.; Boerjan, W.; Sundberg, B. MYB103 is required for FERULATE-5-HYDROXYLASE expression and syringyl lignin biosynthesis in Arabidopsis stems. Plant J. 2013, 73, 63–76. [Google Scholar] [CrossRef]
  58. Nelson, M.R.; Band, L.R.; Dyson, R.J.; Lessinnes, T.; Wells, D.M.; Yang, C.; Everitt, N.M.; Jensen, O.E.; Wilson, Z.A. A biomechanical model of anther opening reveals the roles of dehydration and secondary thickening. New Phytol. 2012, 196, 1030–1037. [Google Scholar] [CrossRef]
  59. Zhang, Y.; Li, B.; Huai, D.; Zhou, Y.; Kliebenstein, D.J. The conserved transcription factors, MYB115 and MYB118, control expression of the newly evolved benzoyloxy glucosinolate pathway in Arabidopsis thaliana. Front. Plant Sci. 2015, 6, 343. [Google Scholar] [CrossRef]
  60. Ma, K.W.; Niu, Y.; Jia, Y.; Ordon, J.; Copeland, C.; Emonet, A.; Geldner, N.; Guan, R.; Stolze, S.C.; Nakagami, H.; et al. Coordination of microbe-host homeostasis by crosstalk with plant innate immunity. Nat. Plants 2021, 7, 814–825. [Google Scholar] [CrossRef]
  61. Coleto, I.; Bejarano, I.; Marín-Peña, A.J.; Medina, J.; Rioja, C.; Burow, M.; Marino, D. Arabidopsis thaliana transcription factors MYB28 and MYB29 shape ammonium stress responses by regulating Fe homeostasis. New Phytol. 2021, 229, 1021–1035. [Google Scholar] [CrossRef] [PubMed]
  62. Curci, P.L.; Zhang, J.; Mähler, N.; Seyfferth, C.; Mannapperuma, C.; Diels, T.; Van Hautegem, T.; Jonsen, D.; Street, N.; Hvidsten, T.R.; et al. Identification of growth regulators using cross-species network analysis in plants. Plant Physiol. 2022, 190, 2350–2365. [Google Scholar] [CrossRef] [PubMed]
  63. Jiang, C.K.; Rao, G.Y. Insights into the Diversification and Evolution of R2R3-MYB Transcription Factors in Plants. Plant Physiol. 2020, 183, 637–655. [Google Scholar] [CrossRef] [PubMed]
  64. Galbiati, M.; Matus, J.T.; Francia, P.; Rusconi, F.; Cañón, P.; Medina, C.; Conti, L.; Cominelli, E.; Tonelli, C.; Arce-Johnson, P. The grapevine guard cell-related VvMYB60 transcription factor is involved in the regulation of stomatal activity and is differentially expressed in response to ABA and osmotic stress. BMC Plant Biol. 2011, 11, 142. [Google Scholar] [CrossRef] [PubMed]
  65. An, C.; Sheng, L.; Du, X.; Wang, Y.; Zhang, Y.; Song, A.; Jiang, J.; Guan, Z.; Fang, W.; Chen, F.; et al. Overexpression of CmMYB15 provides chrysanthemum resistance to aphids by regulating the biosynthesis of lignin. Hortic. Res. 2019, 6, 84. [Google Scholar] [CrossRef] [PubMed]
  66. Zhang, X.; Wang, H.; Chen, Y.; Huang, M.; Zhu, S. Comprehensive Genome-Wide Analyses of Poplar R2R3-MYB Transcription Factors and Tissue-Specific Expression Patterns under Drought Stress. Int. J. Mol. Sci. 2023, 24, 5389. [Google Scholar] [CrossRef] [PubMed]
  67. Lin, M.; Dong, Z.; Zhou, H.; Wu, G.; Xu, L.; Ying, S.; Chen, M. Genome-Wide Identification and Transcriptional Analysis of the MYB Gene Family in Pearl Millet (Pennisetum glaucum). Int. J. Mol. Sci. 2023, 24, 2484. [Google Scholar] [CrossRef]
  68. Zhu, Y.; Wu, N.; Song, W.; Yin, G.; Qin, Y.; Yan, Y.; Hu, Y. Soybean (Glycine max) expansin gene superfamily origins: Segmental and tandem duplication events followed by divergent selection among subfamilies. BMC Plant Biol. 2014, 14, 93. [Google Scholar] [CrossRef]
  69. Yang, J.; Zhang, B.; Gu, G.; Yuan, J.; Shen, S.; Jin, L.; Lin, Z.; Lin, J.; Xie, X. Genome-wide identification and expression analysis of the R2R3-MYB gene family in tobacco (Nicotiana tabacum L.). BMC Genom. 2022, 23, 432. [Google Scholar] [CrossRef]
  70. Zhang, Y.; Zhang, J.; Zou, S.; Liu, Z.; Huang, H.; Feng, C. Genome-wide analysis of the cellulose toolbox of Primulina eburnea, a calcium-rich vegetable. BMC Plant Biol. 2023, 23, 259. [Google Scholar] [CrossRef]
  71. Camacho, C.; Coulouris, G.; Avagyan, V.; Ma, N.; Papadopoulos, J.; Bealer, K.; Madden, T.L. BLAST+: Architecture and applications. BMC Bioinform. 2009, 10, 421. [Google Scholar] [CrossRef] [PubMed]
  72. Paysan-Lafosse, T.; Blum, M.; Chuguransky, S.; Grego, T.; Pinto, B.L.; Salazar, G.A.; Bileschi, M.L.; Bork, P.; Bridge, A.; Colwell, L.; et al. InterPro in 2022. Nucleic Acids Res. 2022, 51, D418–D427. [Google Scholar] [CrossRef] [PubMed]
  73. Chen, C.; Chen, H.; Zhang, Y.; Thomas, H.R.; Frank, M.H.; He, Y.; Xia, R. TBtools: An Integrative Toolkit Developed for Interactive Analyses of Big Biological Data. Mol. Plant 2020, 13, 1194–1202. [Google Scholar] [CrossRef] [PubMed]
  74. Bjellqvist, B.; Basse, B.; Olsen, E.; Celis, J.E. Reference points for comparisons of two-dimensional maps of proteins from different human cell types defined in a pH scale where isoelectric points correlate with polypeptide compositions. Electrophoresis 1994, 15, 529–539. [Google Scholar] [CrossRef] [PubMed]
  75. Edgar, R.C. MUSCLE: A multiple sequence alignment method with reduced time and space complexity. BMC Bioinform. 2004, 5, 113. [Google Scholar] [CrossRef] [PubMed]
  76. Tamura, K.; Stecher, G.; Kumar, S. MEGA11: Molecular Evolutionary Genetics Analysis Version 11. Mol. Biol. Evol. 2021, 38, 3022–3027. [Google Scholar] [CrossRef]
  77. Minh, B.Q.; Schmidt, H.A.; Chernomor, O.; Schrempf, D.; Woodhams, M.D.; von Haeseler, A.; Lanfear, R. IQ-TREE 2: New Models and Efficient Methods for Phylogenetic Inference in the Genomic Era. Mol. Biol. Evol. 2020, 37, 1530–1534. [Google Scholar] [CrossRef]
  78. Letunic, I.; Bork, P. Interactive Tree Of Life (iTOL) v5: An online tool for phylogenetic tree display and annotation. Nucleic Acids Res. 2021, 49, W293–W296. [Google Scholar] [CrossRef]
  79. Bailey, T.L.; Elkan, C. Fitting a mixture model by expectation maximization to discover motifs in biopolymers. Proc. Int. Conf. Intell. Syst. Mol. Biol. 1994, 2, 28–36. [Google Scholar]
  80. Wang, Y.; Tang, H.; Debarry, J.D.; Tan, X.; Li, J.; Wang, X.; Lee, T.H.; Jin, H.; Marler, B.; Guo, H.; et al. MCScanX: A toolkit for detection and evolutionary analysis of gene synteny and collinearity. Nucleic Acids Res. 2012, 40, e49. [Google Scholar] [CrossRef]
  81. Krzywinski, M.I.; Schein, J.E.; Birol, I.; Connors, J.; Gascoyne, R.; Horsman, D.; Jones, S.J.; Marra, M.A. Circos: An information aesthetic for comparative genomics. Genome Res. 2009, 19, 1639–1645. [Google Scholar] [CrossRef] [PubMed]
  82. Kim, D.; Paggi, J.M.; Park, C.; Bennett, C.; Salzberg, S.L. Graph-based genome alignment and genotyping with HISAT2 and HISAT-genotype. Nat. Biotechnol. 2019, 37, 907–915. [Google Scholar] [CrossRef] [PubMed]
  83. Shannon, P.; Markiel, A.; Ozier, O.; Baliga, N.S.; Wang, J.T.; Ramage, D.; Amin, N.; Schwikowski, B.; Ideker, T. Cytoscape: A software environment for integrated models of biomolecular interaction networks. Genome Res. 2003, 13, 2498–2504. [Google Scholar] [CrossRef] [PubMed]
  84. Livak, K.J.; Schmittgen, T.D. Analysis of relative gene expression data using real-time quantitative PCR and the 2(-Delta Delta C(T)) Method. Methods 2001, 25, 402–408. [Google Scholar] [CrossRef]
Figure 1. The phylogenetic relationship among R2R3-MYB genes in Arabidopsis thaliana and Primulina eburnea. The MYB genes were classified into 16 subgroups named S1 to S16 with different colors.
Ijms 25 00465 g001
Figure 2. The phylogenetic tree of 1R-MYB, 3R-MYB, and 4R-MYB genes in A. thaliana and P. eburnea. The MYB genes were classified into 10 subgroups named C1 to C10 with different colors.
Ijms 25 00465 g002
Figure 3. The phylogenetic tree, conserved motifs, and gene structure of R2R3-MYB genes in P. eburnea. (A) The ML phylogenetic tree of PebMYB genes grouped into 16 subgroups designated S1 to S16. (B) The conserved motif structure of PebMYB genes. (C) The gene structure of PebMYB genes. The grey bar indicates the untranslated region (UTR), whereas the cyan bar indicates the CDS. The x-axis in (B,C) indicates the lengths of proteins and genes, respectively.
Ijms 25 00465 g003
Figure 4. The phylogenetic tree, conserved protein motifs, and gene structure of 1R-MYB, 3R-MYB, and 4R-MYB genes of P. eburnea. (A) The ML phylogenetic tree of PebMYB genes grouped into 13 subgroups designated C1 to C13. (B,C) Conserved motifs and gene structure of PebMYB genes.
Ijms 25 00465 g004
Figure 5. Duplication analysis of PebMYB genes. The heatmap indicates gene density. Grey lines indicate duplications of all genes, while duplications of PebMYB genes are highlighted by red lines. The black and grey scales on chromosomes indicate 10 Mb and 5 Mb, respectively. The 1R-MYB, 2R-MYB, 3R-MYB, and 4R-MYB genes are listed on chromosomes with black, salmon, blue, and purple colors.
Ijms 25 00465 g005
Figure 6. Expression pattern and promoter analysis of PebMYB genes. (A) The expression pattern of PebMYB genes in four different tissues (B, L, R, and S indicate bud, leaf, root, and stem, respectively) based on the RNA-seq data. (B) Cis-elements in the 2000 bp promoter region of PebMYB genes.
Ijms 25 00465 g006
Figure 7. Expression analysis of selected PebMYB genes between the control and drought stress treatments. (AC) The top three pots in (AC) represent the control group, while the bottom three pots are the treatment group. The seedlings of P. eburnea before (A) and after drought stress treatment for one (B) and two months (C), respectively. (DN) The relative expression levels of 11 selected PebMYB genes. ST0, ST1, and ST2 on the x-axis represent the seedling stages in (AC), respectively. Asterisks above the columns show statistically significant differences at p < 0.05.
Ijms 25 00465 g007
Disclaimer/Publisher’s Note: The statements, opinions and data contained in all publications are solely those of the individual author(s) and contributor(s) and not of MDPI and/or the editor(s). MDPI and/or the editor(s) disclaim responsibility for any injury to people or property resulting from any ideas, methods, instructions or products referred to in the content.

