Article

Analysis of Codon Usage Bias in Xyloglucan Endotransglycosylase (XET) Genes

1
College of Horticulture, Sichuan Agricultural University, Chengdu 611130, China
2
Institute of Pomology and Olericulture, Sichuan Agricultural University, Chengdu 611130, China
*
Authors to whom correspondence should be addressed.
These authors contributed equally to this work.
Int. J. Mol. Sci. 2023, 24(7), 6108; https://doi.org/10.3390/ijms24076108
Submission received: 28 December 2022 / Revised: 17 March 2023 / Accepted: 21 March 2023 / Published: 24 March 2023
(This article belongs to the Section Molecular Genetics and Genomics)

Abstract

:
Xyloglucan endotransglycosylase (XET) genes are widely distributed in most plants, but the codon usage bias of XET genes has remained uncharacterized. Thus, we analyzed the codon usage bias using 4500 codons of 20 XET genes to elucidate the genetic and evolutionary patterns. Phylogenetic and hierarchical cluster analyses revealed that the 20 XET genes belonged to two groups. The closer the genetic distance, the more similar the codon usage preference. The codon usage bias of most XET genes was weak, but there was also some codon usage bias. AGA, AGG, AUC, and GUG were the top four codons (RSCU > 1.5) in the 20 XET genes. CitXET had a stronger codon usage bias, and there were eight optimal codons of CitXET (i.e., AGA, AUU, UCU, CUU, CCA, GCU, GUU, and AAA). The RSCU values underwent a correspondence analysis. The two main factors affecting codon usage bias (i.e., Axes 1 and 2) accounted for 54.8% and 17.6% of the total variation, respectively. Multiple correspondence analysis revealed that XET genes were widely distributed, with Group 1 genes being closer to Axis 1 than Group 2 genes, which were closer to Axis 2. Codons with A/U at the third codon position were distributed closer to Axis 1 than codons with G/C at the third codon position. PgXET, ZmXET, VlXET, VrXET, and PcXET were biased toward codons ending with G/C. In contrast, CitXET, DpXET, and BrpXET were strongly biased toward codons ending with A/U, indicating that these XET genes have a strong codon usage bias. Translational selection and base composition (especially A and U at the third codon position), followed by mutation pressure and natural selection, may be the most important factors affecting codon usage of 20 XET genes. These results may be useful in clarifying the codon usage bias of XET genes and the relevant evolutionary characteristics.

1. Introduction

Codon usage bias, which is usually the result of adaptive evolution, refers to the unequal frequency of codons during translation [1]. Codon usage bias is of great importance in the chemical distances between amino acids, as the occurrence of the errors also relies on the frequency of different codons [2]. Even within a genome, different codon usage preferences are observed among genes [3]. Recent studies have revealed that specific synonymous codon usage biases affect protein folding [4,5]. When the gene expression level was higher, the evolutionary rates and selective pressure were lower, but the codon usage bias was strong [6]. Except for tryptophan (Trp) and methionine (Met), all amino acids are encoded by at least two synonymous codons [7]. However, the synonymous codons do not occur with equal frequency, and a specific codon usage pattern is referred to as codon usage bias [8]. Mutation, natural selection, and random drift are the three major factors contributing to codon usage bias [9,10]. There are some additional factors, including gene length and expression level, tRNA abundance, RNA stability, protein structure, and GC content [3,7,11]. Codon usage bias is believed to be a result of a balance between translation selection and mutation pressure [12]. Molecular evolution studies have shown that codon usage bias exists in a wide range of species, from prokaryotes to eukaryotes, and may have profound implications for genome evolution [2].
The synonymous codon selection of amino acids in different plant genomes is not random. There is a synonym codon usage (SCU) bias. Previous research has shown that SCU bias is related to genome size [13], gene length [14], gene translation initiation signal [15], and GC compositions [16]. Therefore, the investigation of codon bias patterns is important in gene biology studies.
Xyloglucan endotransglucosylase/hydrolase (XTH) is a key xyloglucan modifying enzyme belonging to the glycoside hydrolase 16 (GH16) family, which catalyzes the cleavage and polymerization of xyloglucan molecules to modify the celluline–xyloglucan complex structure of seed germination [17,18], and cell walls [19] and elongation [20,21]. XTHs, which are directly involved in the initial assembly and subsequent restructuring of primary cell walls [22,23], exhibit two diverse catalytic activities: xyloglucan endohydrolase (XEH) and xyloglucan endotransglycosylase (XET) [24]. XTH proteins are essential for plant growth and differentiation [25]. Unique members of the XTH gene family are involved in many abiotic stress responses [26].
XET (EC 2.4.1.207) was found in all land plants [27]. Previous studies have found that the XET expression levels are correlated with cell expansion [28,29], and cell growth is promoted by XTHs [30,31]. XETs release a smaller xyloglucan from the reducing end of a donor xyloglucan, then another xyloglucan chain is added to the newly generated free end [2]. XET is one of the most important parts of ancient machinery regulating cell wall modifications [32]. In different species, the XET gene is involved in seed germination [18], cell wall construction [33], and abiotic stress response [21,26], indicating that the function of the XET gene is significantly different.
In recent years, many XET genes have been cloned. There is limited information on the codon usage bias of XET genes. Here, we analyzed the codon usage bias of 20 different XET genes and explored factors that may be related to this codon usage bias. A comprehensive analysis of XET gene codon usage bias will be important for understanding its biological significance and providing theoretical advice for optimizing the codons of XET genes.

2. Results

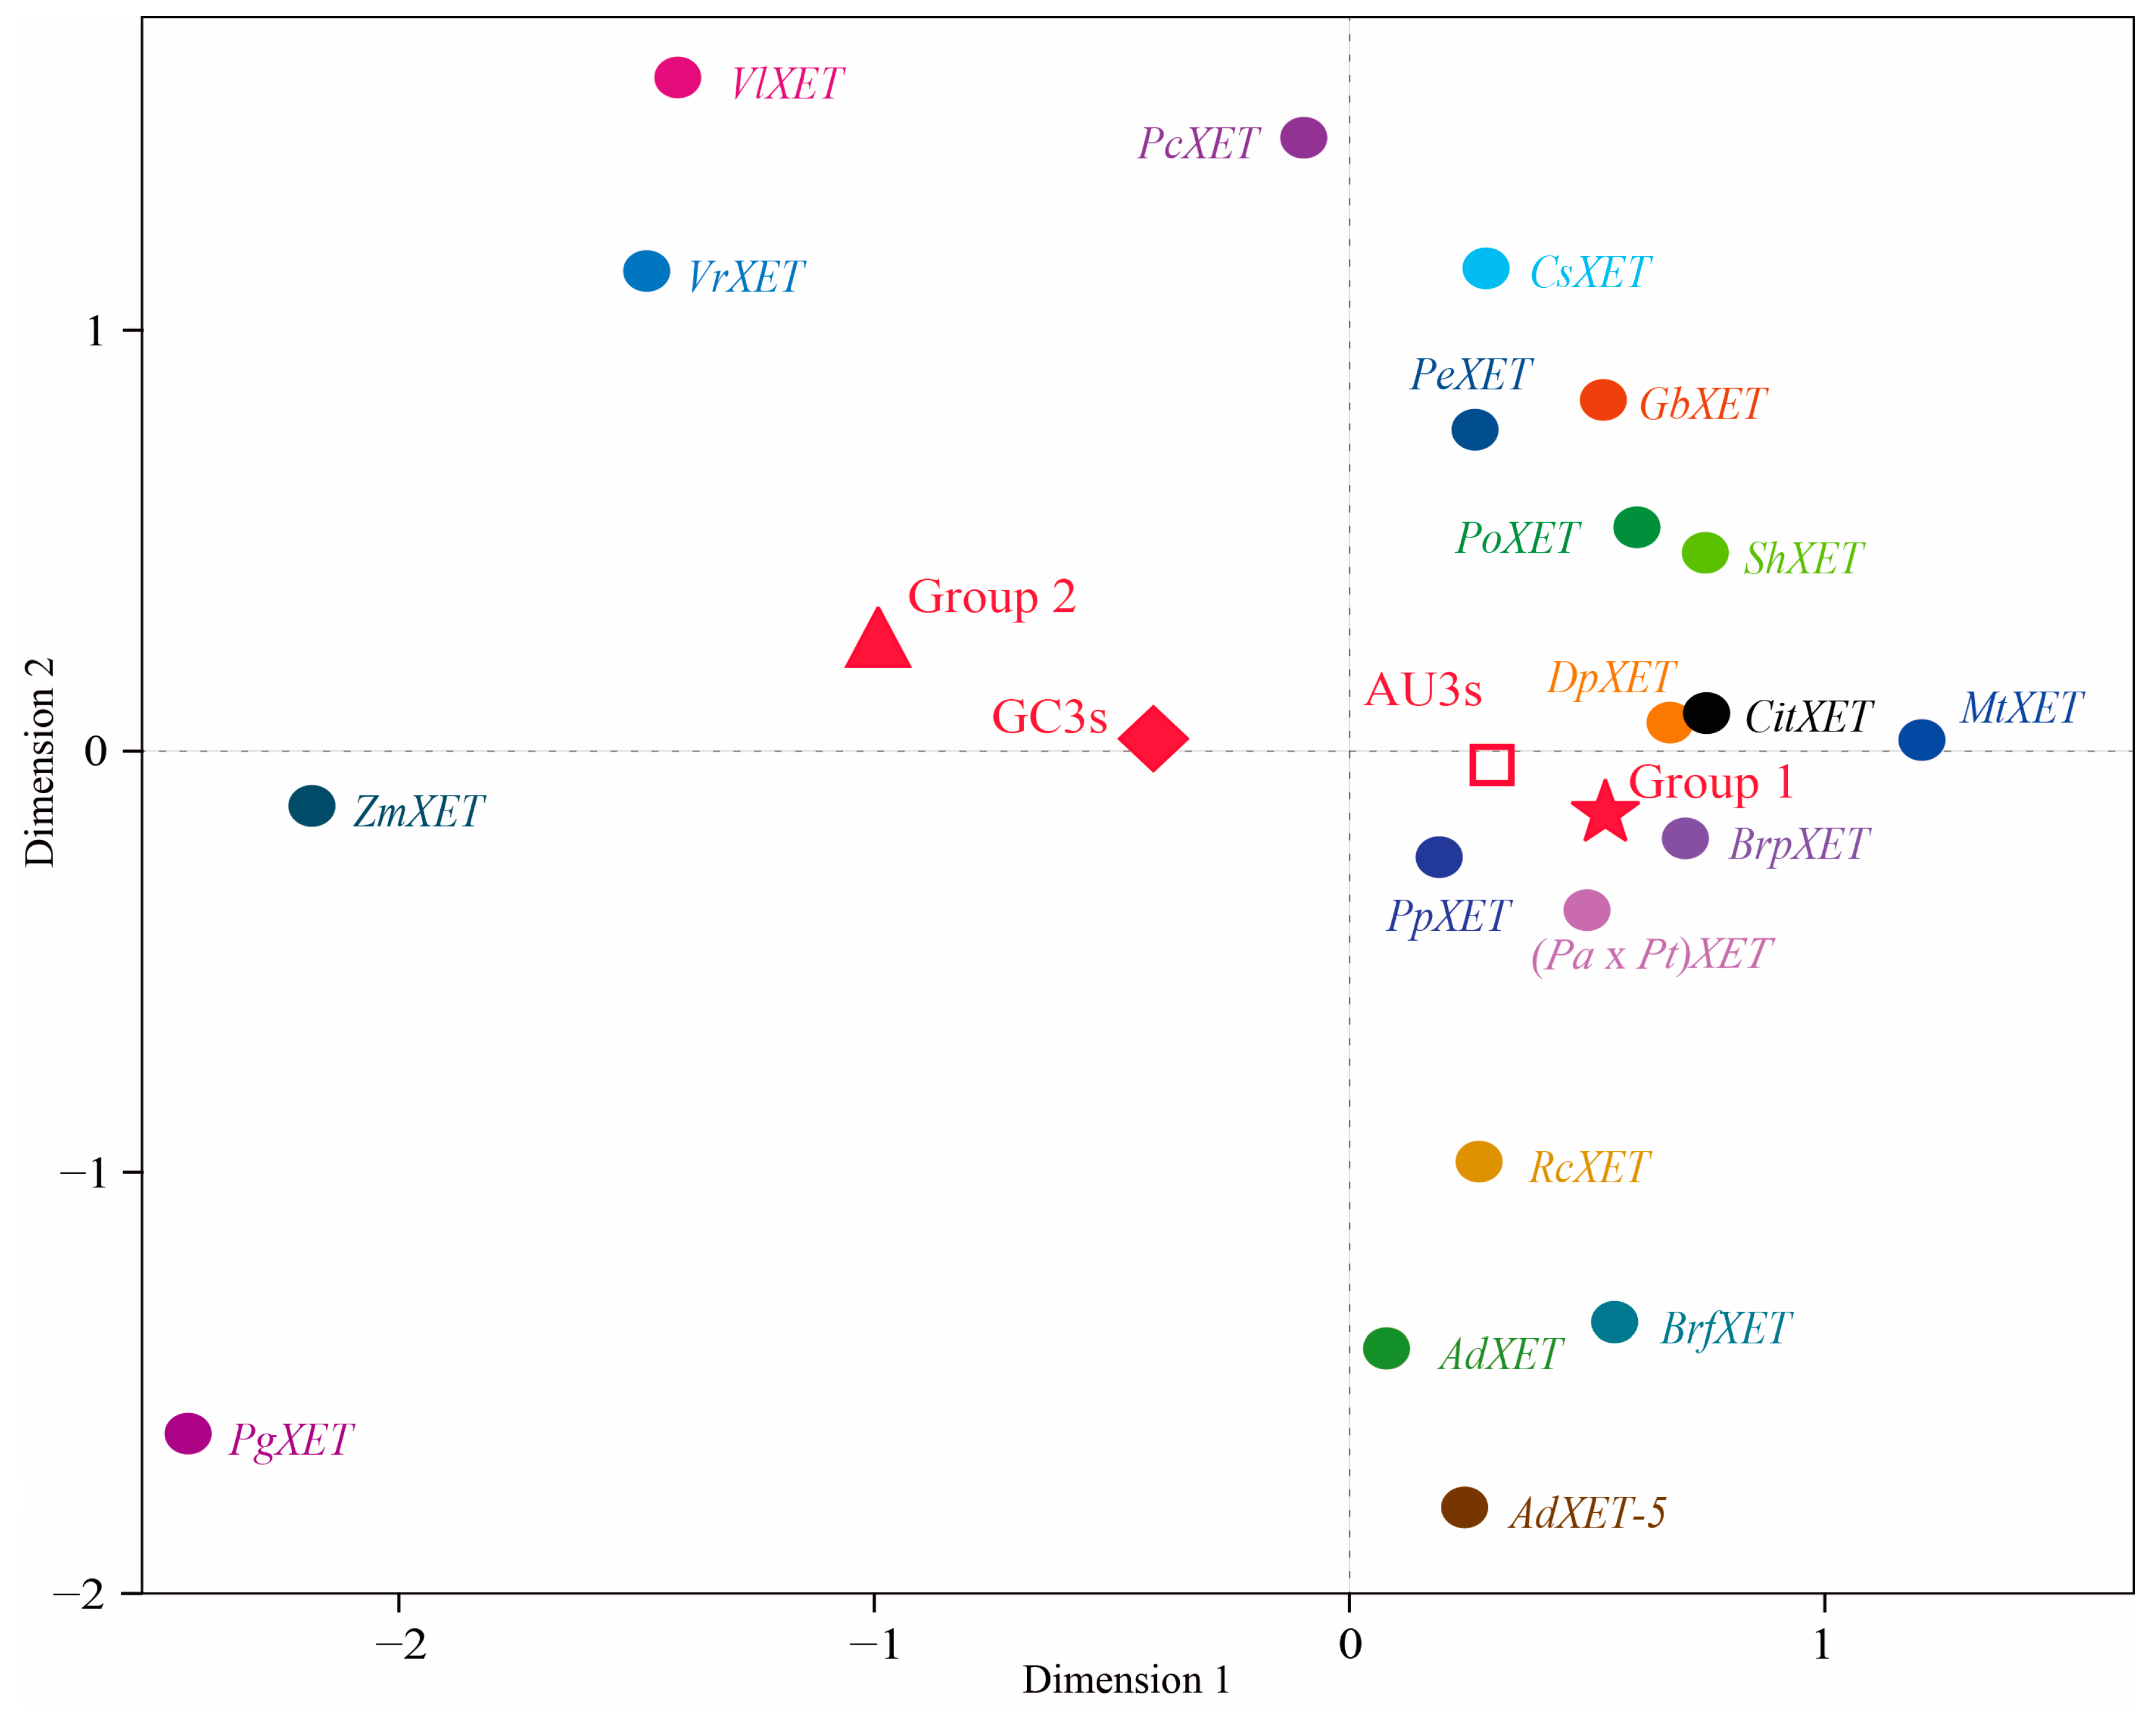
2.1. Clustering Analysis

The coding sequences of 20 different XET genes were analyzed using the neighbor-joining method to construct a phylogenetic tree. The following genes were observed to belong to Group 1: Populus euphratica XET (PeXET), Paeonia ostii var. lishizhenii XET (PoXET), Dahlia pinnata XET (DpXET), Citrus cultivar Huangguogan XET (CitXET), Medicago truncatula XET (MtXET), Actinidia deliciosa XET-5 (AdXET-5), Sinopodophyllum hexandrum XET (ShXET), Camellia sinensis XET (CsXET), Brassica rapa subsp. pekinensis XET (BrpXET), Brassica rapa (field mustard) XET (BrfXET), Pyrus pyrifolia XET (PpXET), Rosa chinensis XET (RcXET), and Populus alba × Populus tremula var XET (Pa × Pt XET) (Figure 1). The ranges in the effective number of codons (ENc) values and GC3 contents were relatively narrow (i.e., 47.0–60.7 and 27.4–61.2, respectively) (Table 1). These results suggest that the similarity in codon usage increases with increasing evolutionary relatedness of genes. Group 2 consisted of seven XET genes, including Pyrus communis XET (PcXET), Gossypium barbadense XET (GbXET), Zea mays XET (ZmXET), Actinidia deliciosa XET (AdXET), Vigna radiata cultivar T44 XET (VrXET), Vigna luteola XET (VlXET), and Pennisetum glaucum XET (PgXET) (Figure 1). In contrast to the corresponding Group 1 data, the ranges of the ENc values and GC3 contents were relatively wide (i.e., 31.1–56.5 and 43.2–97.9, respectively) (Table 1). These observations indicated that the codon usage was different among these evolutionarily related genes.
The relative synonymous codon usage (RSCU) values of the 20 XET genes underwent hierarchical cluster analysis (Figure 2). The VlXET, VrXET, PgXET, ZmXET, and PcXET genes always clustered together and had high RSCU values for the following codons: CUG, GGC, CGG, CCG, AAC, ACG, UUC, CAG, AUC, CAC, GCC, AAG, ACC, UCC, GUC, GGG, UAC, GUG, CUC, GAC, GAG, CCC, AGC, and CGC. Another cluster comprised CitXET, MtXET, DpXET, BrpXET, and BrfXET. CitXET and DpXET genes were relatively closely related (Figure 1) and exhibited similar codon usage (Figure 2). These results suggested that different XET genes had diverse codon usage patterns, but there was also some codon usage bias.

2.2. Analysis of Codon Usage Bias in 20 XET Genes

The average GC content of the 20 analyzed XET genes was 50.9% (range: 38.8–69.5%). The GC content was highest in the third codon position (i.e., 58.2%). Additionally, the mean ENc value was 48.60 (range: 31.14–60.71). With ENc values <35, a strong codon bias was associated with PgXET, VlXET, VrXET, and ZmXET. These data suggested that some XET genes exhibited a directional codon usage, reflecting the codon usage bias of a few XET genes (Table 1).
The top four codons (RSCU > 1.5) of the 20 XET genes were AGA and AGG (encoding arginine), AUC (encoding isoleucine), and GUG (encoding valine) (Table 2). Some codons were associated with high usage bias (RSCU > 1.0), including AGA, AGG, AUC, GUG, UAC, UCC, GCU, UUC, CUC, GCC, AAC, GAG, CUG, AAG, UCU, ACU, CCA, CAG, CAC, ACC, GGA, GAC, UUG, UGC, GGC, CUU, CCC, and ACA. UAU, AUA, CGU, CUA, and CGA (RSCU < 1.0) were the five least frequent codons. For the 20 XET genes, more than 60% of AGA codons had RSCU greater than 1.5, and the AGA codon of CitXET had the highest RSCU value (3.90) (Table 2 and Table 3). There were 21 codons that had ΔRSCU values > 0.08, which were defined as preferred codons in the 20 XET genes, including UUU, UUA, UUG, CUU, AUU, AUA, GUU, GUA, UCU, AGU, CCU, CCA, ACU, ACA, GCU, GCA, GCG, UAU, CAU, CAA, AAU, AAA, GAU, GAA, UGU, CGU, CGA, AGA, AGG, GGU, and GGA (Table 2). Additionally, AGA, GCU, CUU, UCU, CCA, UCA, GUU, UAC, AAA, and AUU were the most common codons in CitXET (RSCU > 1.5) (Table 3). Based on a comparison and screening, eight optimal codons of CitXET were identified (i.e., AGA, AUU, UCU, CUU, CCA, GCU, GUU, and AAA). Thus, CitXET is biased toward synonymous codons with A/U at the third codon position.
The RSCU values underwent a correspondence analysis. The two main factors influencing codon usage bias were represented by Axis 1 and Axis 2 (Figure 3) and contributed 54.8% and 17.6% of the total variation, respectively. A principal component analysis was used to examine the relationship between amino acid composition and codon usage bias. There was a distinct positive correlation between Axis 1 and C3s (r = 0.966, p < 0.01), G3s (r = 0.866, p < 0.01), and GC3s (r = 0.963, p < 0.01). In contrast, Axis 1 was negatively correlated with A3s (r = −0.935, p < 0.01) and T3s (r = −0.861, p < 0.01). There was also a negative correlation between GC3s and ENc (r = −0.837, p < 0.01). All correlation coefficients were greater than 0.83 (Figure 4). The multiple correspondence analysis revealed that the XET genes were widely distributed, with Group 1 genes closer to Axis 1 than the Group 2 genes, which were closer to Axis 2 (Figure 5). The codons with A/U at the third codon position were distributed closer to Axis 1 than the codons with G/C at the third codon position (Figure 6). These results suggested that the base composition, especially for codons with A/U at the third codon position, had some effect on codon usage bias. Thus, many factors might influence codon usage bias. Axis 1 represented the main factor affecting codon usage bias, but the base composition was another very important factor.

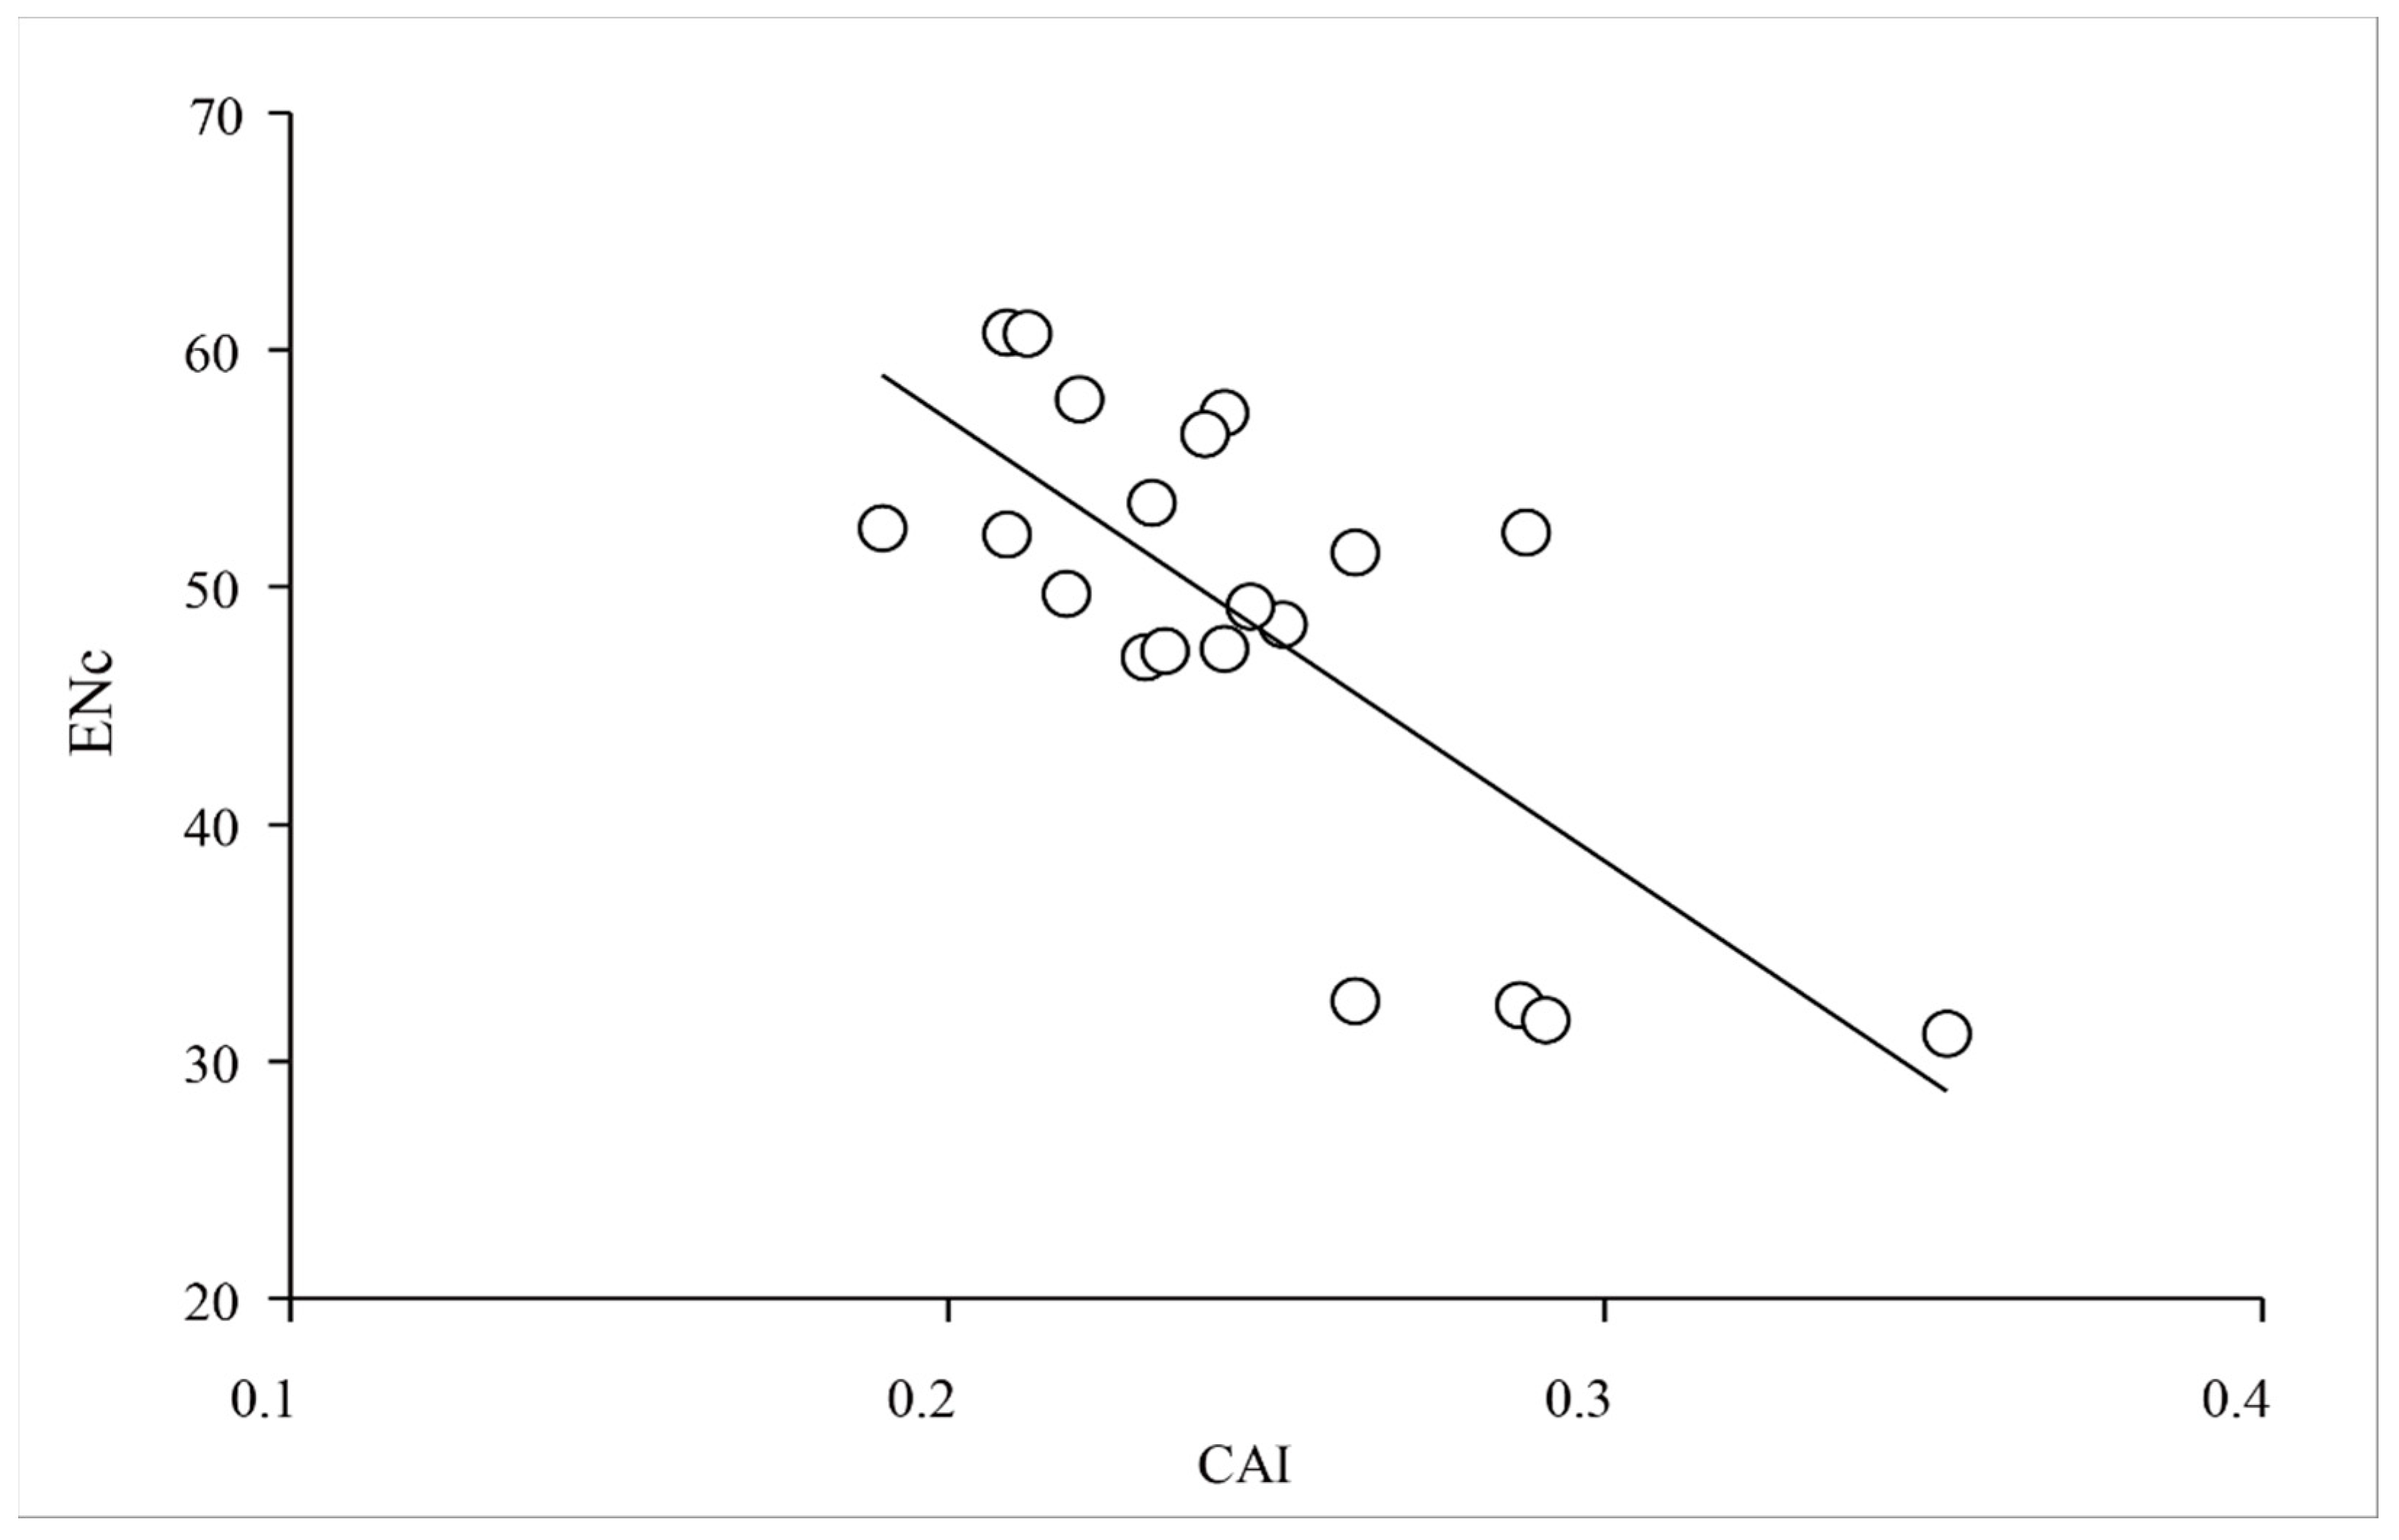
2.3. Base Composition Affects the Formation of Codon Usage Bias

To clarify the relationships among the two groups of XET genes regarding the third codon positions of synonymous codons, the RSCU value for each codon underwent a multidimensional preference analysis. The Group 1 and Group 2 genes were closely associated with codons ending with A/U and G/C, respectively. The relatively short distance between PgXET, ZmXET, VlXET, VrXET, and PcXET and GC3s suggested that the codon usage might be biased toward G/C. However, CitXET, DpXET, and BrpXET were very close to AU3s, suggesting a strong codon usage bias toward codons ending with A/U (Figure 5 and Figure 6). Correlation analysis between CAI and ENc was used to determine the effects of translation selection and mutation pressure on codon usage bias of XET genes. The results showed that CAI was significantly negatively correlated with ENc (r = −0.737, p < 0.01) (Figure 7), reflecting that translational selection contributed more to codon usage patterns of the 20 XET genes than mutations.

3. Discussion

The biological process of genetic information from mRNA to protein depends on codon coding [34]. Codon is an important part of the output of nucleic acid information [35,36]. Previous research has found that codon usage bias is mainly influenced by mutation pressure and natural selection [37]. The codon usage bias exists widely in different species [38,39]. However, there are significant differences among different species in the main factors that guide densification code usage bias.
The GC composition has been shown to drive amino acids and codon usage that are closely related to the usage pattern of the third codon base (GC3) [40]. There was a wide range of the GC3s values of GC content in XET codons (27.4–97.9%). The GC3 content of PgXET, VlXET, VrXET, and ZmXET was more than 93%, indicating that these XET genes preferred significantly to end with G/C base, while CitXET, BrfXET, BrpXET, and MtXET preferred the codons ending with A/T(U) base. These results suggested that mutation pressure was the main factor affecting codon usage of 20 XET genes.
In this study, phylogenetic and hierarchical cluster analyses produced similar results. Compared to the corresponding Group 1 data, the ranges of ENc values and GC3 contents were relatively wide (i.e., 31.1–56.5 and 43.2–97.9, respectively) (Table 1). These observations indicated that codon usage was different, and different XET genes had different codon usage patterns, but there was also some codon usage bias.
ENc and CAI are two parameters related to gene expression level. A subsequent series of analyses confirmed that most XET genes have an ENc value > 35, suggesting these genes exhibit a general codon usage pattern. The exceptions were ZmXET, VlXET, VrXET, and PgXET. The ENc is one of the most important factors affecting codon usage preferences. An ENc value approaching 20 indicates a strong codon usage bias. In contrast, an ENc value close to 61 implies that the codons are used relatively equally [3]. Many factors contribute to biased synonymous codon usage in the 20 XET genes. For example, base composition influences codon usage bias (e.g., CitXET, DpXET, and BrpXET), especially regarding codons with A/U at the third codon position.
In order to evaluate the synonymous codon usage pattern with amino acids of different XET genes, the codon usage bias of various codons was detected by RSCU, which reflected the frequency of a specific codon relative to that of the synonymous codons. A relatively strong codon usage bias is indicated by an RSCU value > 1. In contrast, an RSCU value < 1 indicates that a particular codon is used less frequently than the other synonymous codons [41]. In this study, AGA, AGG, AUC, and GUG were the top four codons (RSCU > 1.5) in the 20 XET genes. A comparison of the RSCU values of the other 19 XET genes revealed a similar codon usage bias, while CitXET had a stronger codon usage bias. There were eight optimal codons of CitXET (i.e., AGA, AUU, UCU, CUU, CCA, GCU, GUU, and AAA), suggesting CitXET was biased toward the synonymous codons with A or U at the third codon position. We found that XET activity was specific to the elongation of root cells during citrus seedling etiolation in previous research [42]. Consequently, the codon usage bias may be very closely related to the functionality of CitXET. In order to confirm this assumption, further research is needed.
The correlation between the first two spindles (Axis 1 and Axis 2) and the nucleotide content of 20 XET genes was analyzed. The results showed that there were various significant correlations between the two spindle axes and nucleotide content. In addition, there was a significant negative correlation between Gravy values with Axis 1 and a significant positive correlation between Gravy with Axis 2. In contrast, there was a positive correlation between Aromo and Axis 1 and a significant negative correlation between Aromo and Axis 2 (Figure 4). These results suggested that Axis 1 and Axis 2 had important roles in shaping EXT codon usage patterns.
The CAI, with values ranging from 0 to 1, is another effective measure of codon usage bias. The higher the CAI value, the better the adaptability of the sequence [6]. CAI value approaching 1 indicates a strong codon bias [3]. In the present study, with the exception of PgXET and ShXET, the analyzed genes had CAI values between 0.2 and 0.3. These results indicated that the expression levels of the XET genes were not randomly variable. In previous studies, the correlation between CAI and ENc values was used to demonstrate the effects of translational selection and mutation pressure on codon usage bias [43,44,45]. A correlation coefficient approaching −1 suggests that the translation selection effect is greater than that of mutations on codon usage bias [7]. Our correlation analysis showed that CAI was significantly negatively correlated with ENc (r = −0.737, p < 0.01) (Figure 7), reflecting that translational selection contributed more to codon usage patterns of the 20 XET genes than mutations. Similar results were reported by Qiu et al. [46], but these observations were inconsistent with the findings of other studies, which suggested that mutations had a stronger effect on codon usage bias than translation selection in some viruses [47,48]. This inconsistency may be because the virus genes are more extensively mutated than the plant XET genes. In other words, XET genes may be relatively conserved.

4. Materials and Methods

4.1. Sequence Data

We downloaded all the available XET gene sequences from the NCBI GenBank database (http://www.ncbi.nlm.nih.gov/, accessed on 1 January 2023) and analyzed their codon usage bias. The details of the available 20 available XETs are provided in Table 1.

4.2. Analysis of Codon Usage in XET Coding Sequences

We used several indicators to analyze the XET coding sequence codon usage. The codon adaptation index (CAI), relative synonymous codon usage (RSCU), the effective number of codons (ENc), codon bias index, frequency of optimal codon usage, hydrophobicity, aromaticity, as well as the T3s, C3s, A3s, G3s, GC, and GC3s contents were calculated using the CodonW 1.4.4 program (http://codonw.sourceforge.net/, accessed on 1 January 2023). The CAI analysis of XET genes was performed using the CAIcal server [49]. CAI, which is the geometric mean of the relative use of codons in genes, is used to measure the adaptability of genes to the codon usage of high-expression genes [38].
The correlation between nucleotide content was calculated using SPSS 20.0 statistical software. A Pearson correlation coefficient was calculated. ENc value was calculated to measure the degree of deviation from equal use of synonymous codons of the ORF of the XET genes. The ENc value, reflecting the degree of codon usage bias, ranges from 20 (when only one synonymous codon is selected for the corresponding amino acid) to 61 (when all synonymous codons are used identically) [50]. When the ENc value is greater than 35, the codon usage deviation is considered to be low [2].

4.3. Phylogenetic and Hierarchical Cluster Analyses

The default parameters of MEGA 7.0.12 were used to construct the phylogenetic tree based on the 20 XET coding sequences, and the neighbor-join (NJ) method was used with a bootstrap value of 1000 replicates [51]. Specific parameters were as follows: test of phylogeny was the bootstrap method, substitutions type was amino acid, substitution model was the Poisson model, rates among sites were uniform rates, pattern among lineages was the same (homogeneous), and gaps/missing data treatment was complete deletion. The RSCU values underwent a hierarchical cluster analysis.

4.4. Comparison of the XET Codon Usage Patterns

RSCU represents the ratio between the observed usage frequency of a codon in a gene sample and the expected usage frequency in the synonymous codon family, assuming that all codons of a particular amino acid are used equally. The RSCU (i.e., ratio of the observed codon usage to the expected usage [52]) was used to investigate the overall synonymous codon usage bias among the 20 XET genes. In a comparison of the XET codon usage pattern, if the RSCU value for the polyprotein-coding region of XET and that of the same codon were both <1.0, >1.5 or between 1.0 and 1.5, their codon usage patterns were judged to be similar. In addition, synonymous codons with RSCU values >1.5 and <1.0 are treated as high-frequency codons and low-frequency codons, respectively [43]. The preferred codons, which were defined as those whose ΔRSCU > 0.08, were analyzed as described by Zhang et al. [53].
The RSCU index was calculated as follows (Gij is the observed number of the ith codon for the jth amino acid, which has Ni kinds of synonymous codons).
RSCU = G i j j N i G i j N i

4.5. Correspondence and Multidimensional Preference Analyses

The mathematical procedure of correspondence analysis converts the RSCU values into a series of dimensional factors, and the results can be used to analyze major trends in codon usage patterns among different samples. Each gene is represented by a 59-dimensional variable, and each dimension matches the RSCU value of a codon, excluding AUG, UGG, and stop codon. Correspondence analysis was performed using the CodonW 1.4.4 program (http://codonw.sourceforge.net/, accessed on 1 January 2023), and correlation analysis was performed for the first two axes (Axis 1 and Axis 2) of correspondence analysis [7]. Principal component analysis of the codon usage frequencies and multiple correspondences and multidimensional preference analyses of the RSCU value for each codon of the 20 XET genes were conducted using SPSS 20.0 program.

5. Conclusions

In conclusion, codon usage was different, and different XET genes had different codon usage patterns. The codon usage bias of most XET genes is weak, but there was also some codon usage bias. AGA, AGG, AUC, and GUG were the top four codons (RSCU > 1.5) in the 20 XET genes. CitXET had a stronger codon usage bias, and there were eight optimal codons of CitXET (i.e., AGA, AUU, UCU, CUU, CCA, GCU, GUU, and AAA). PgXET, VlXET, VrXET, ZmXET, CitXET, BrfXET, BrpXET, and MtXET have strong codon biases. Translational selection and base composition, followed by mutation pressure and natural selection, may be the most important factors affecting codon usage of 20 XET genes. Although codon usage bias is not necessarily considered in traditional phylogenetic analyses, the data presented here clarify the codon usage patterns for 20 XET genes. Our findings may be useful for comprehensively characterizing the factors mediating genetic evolution.

Author Contributions

Conceptualization, B.X., M.Z. and Z.W.; Methodology, T.W.; Software, T.W., S.H. (Shengjia Huang), M.Z. and J.H.; Validation, B.X., L.L. and X.W.; Formal analysis, T.W. and S.H. (Shengjia Huang); Investigation, L.L. and S.H. (Siya He); Resources, T.W., S.H. (Shengjia Huang), X.W., H.D. and G.S.; Data curation, B.X., S.H. (Shengjia Huang), M.Z., J.H., G.S. and S.H. (Siya He); Writing—original draft, B.X.; Writing—review & editing, X.W., H.D. and Z.W.; Project administration, Z.W.; Funding acquisition, B.X. and Z.W. All authors have read and agreed to the published version of the manuscript.

Funding

This study was funded by the National Key R&D Program of China (2021YFD1600802-02) and the Science and Technology Department of Sichuan Province, China (2021ZHCG0084).

Institutional Review Board Statement

Not applicable.

Informed Consent Statement

Not applicable.

Data Availability Statement

Not applicable.

Conflicts of Interest

The authors declare no conflict of interest.

References

  1. Ingvarsson, P.K. Molecular evolution of synonymous codon usage in Populus. BMC Evol. Biol. 2008, 8, 307. [Google Scholar] [CrossRef] [Green Version]
  2. Gao, Y.; Lu, Y.; Song, Y.; Jing, L. Analysis of codon usage bias of WRKY transcription factors in Helianthus annuus. BMC Genom. Data 2022, 23, 46. [Google Scholar] [CrossRef] [PubMed]
  3. Zhao, Y.; Zheng, H.; Xu, A.; Yan, D.; Jiang, Z.; Qi, Q.; Sun, J. Analysis of codon usage bias of envelope glycoprotein genes in nuclear polyhedrosis virus (NPV) and its relation to evolution. BMC Genom. 2016, 17, 677. [Google Scholar] [CrossRef] [Green Version]
  4. Tsai, C.J.; Sauna, Z.E.; Kimchi-Sarfaty, C.; Ambudkar, S.V.; Gottesman, M.M.; Nussinov, R. Synonymous mutations and ribosome stalling can lead to altered folding pathways and distinct minima. J. Mol. Biol. 2008, 383, 281–291. [Google Scholar] [CrossRef] [PubMed] [Green Version]
  5. Marin, M. Folding at the rhythm of the rare codon beat. Biotechnol. J. 2008, 3, 1047–1057. [Google Scholar] [CrossRef] [PubMed]
  6. Hao, J.; Liang, Y.; Ping, J.; Li, J.; Shi, W.; Su, Y.; Wang, T. Chloroplast gene expression level is negatively correlated with evolutionary rates and selective pressure while positively with codon usage bias in Ophioglossum vulgatum L. BMC Plant Biol. 2022, 22, 580. [Google Scholar] [CrossRef] [PubMed]
  7. Wang, H.; Liu, S.; Zhang, B.; Wei, W. Analysis of Synonymous Codon Usage Bias of Zika Virus and Its Adaption to the Hosts. PLoS ONE 2016, 11, e0166260. [Google Scholar] [CrossRef] [Green Version]
  8. Babbitt, G.A.; Alawad, M.A.; Schulze, K.V.; Hudson, A.O. Synonymous codon bias and functional constraint on GC3-related DNA backbone dynamics in the prokaryotic nucleoid. Nucleic Acids Res. 2014, 42, 10915–10926. [Google Scholar] [CrossRef] [Green Version]
  9. Shah, P.; Gilchrist, M.A. Explaining complex codon usage patterns with selection for translational efficiency, mutation bias, and genetic drift. Proc. Natl. Acad. Sci. USA 2011, 108, 10231–10236. [Google Scholar] [CrossRef] [Green Version]
  10. Supek, F.; Skunca, N.; Repar, J.; Vlahovicek, K.; Smuc, T. Translational selection is ubiquitous in prokaryotes. PLoS Genet. 2010, 6, e1001004. [Google Scholar] [CrossRef] [Green Version]
  11. Plotkin, J.B.; Dushoff, J.; Desai, M.M.; Fraser, H.B. Codon usage and selection on proteins. J. Mol. Evol. 2006, 63, 635–653. [Google Scholar] [CrossRef]
  12. Bulmer, M. The selection-mutation-drift theory of synonymous codon usage. Genetics 1991, 129, 897–907. [Google Scholar] [CrossRef] [PubMed]
  13. Dos Reis, M.; Savva, R.; Wernisch, L. Solving the riddle of codon usage preferences: A test for translational selection. Nucleic Acids Res. 2004, 32, 5036–5044. [Google Scholar] [CrossRef] [PubMed] [Green Version]
  14. Stoletzki, N. The surprising negative correlation of gene length and optimal codon use—Disentangling translational selection from GC-biased gene conversion in yeast. BMC Evol. Biol. 2011, 11, 93. [Google Scholar] [CrossRef] [PubMed] [Green Version]
  15. Qin, H.; Wu, W.B.; Comeron, J.M.; Kreitman, M.; Li, W.H. Intragenic spatial patterns of codon usage bias in prokaryotic and eukaryotic genomes. Genetics 2004, 168, 2245–2260. [Google Scholar] [CrossRef] [PubMed] [Green Version]
  16. Kanaya, S.; Kinouchi, M.; Abe, T.; Kudo, Y.; Yamada, Y.; Nishi, T.; Mori, H.; Ikemura, T. Analysis of codon usage diversity of bacterial genes with a self-organizing map (SOM): Characterization of horizontally transferred genes with emphasis on the E. coli O157 genome. Gene 2001, 276, 89–99. [Google Scholar] [CrossRef] [PubMed]
  17. Van Sandt, V.S.; Suslov, D.; Verbelen, J.P.; Vissenberg, K. Xyloglucan endotransglucosylase activity loosens a plant cell wall. Ann. Bot. 2007, 100, 1467–1473. [Google Scholar] [CrossRef] [Green Version]
  18. Dogra, V.; Sharma, R.; Yelam, S. Xyloglucan endo-transglycosylase/hydrolase (XET/H) gene is expressed during the seed germination in Podophyllum hexandrum: A high altitude Himalayan plant. Planta 2016, 244, 505–515. [Google Scholar] [CrossRef]
  19. Baumann, M.J.; Eklof, J.M.; Michel, G.; Kallas, A.M.; Teeri, T.T.; Czjzek, M.; Brumer, H., 3rd. Structural evidence for the evolution of xyloglucanase activity from xyloglucan endo-transglycosylases: Biological implications for cell wall metabolism. Plant Cell 2007, 19, 1947–1963. [Google Scholar] [CrossRef] [Green Version]
  20. Becnel, J.; Natarajan, M.; Kipp, A.; Braam, J. Developmental expression patterns of Arabidopsis XTH genes reported by transgenes and Genevestigator. Plant Mol. Biol. 2006, 61, 451–467. [Google Scholar] [CrossRef]
  21. Ma, Y.S.; Jie, H.D.; Zhao, L.; Lv, X.Y.; Liu, X.C.; Tang, Y.Y.; Zhang, Y.; He, P.L.; Xing, H.C.; Jie, Y.C. Identification of the Xyloglucan Endotransglycosylase/Hydrolase (XTH) Gene Family Members Expressed in Boehmeria nivea in Response to Cadmium Stress. Int. J. Mol. Sci. 2022, 23, 16104. [Google Scholar] [CrossRef] [PubMed]
  22. Thompson, J.E.; Fry, S.C. Restructuring of wall-bound xyloglucan by transglycosylation in living plant cells. Plant J. 2001, 26, 23–34. [Google Scholar] [CrossRef]
  23. Fry, S.C. Primary cell wall metabolism: Tracking the careers of wall polymers in living plant cells. New Phytol. 2004, 161, 641–675. [Google Scholar] [CrossRef] [PubMed]
  24. Li, Q.; Li, H.; Yin, C.; Wang, X.; Jiang, Q.; Zhang, R.; Ge, F.; Chen, Y.; Yang, L. Genome-Wide Identification and Characterization of Xyloglucan Endotransglycosylase/Hydrolase in Ananas comosus during Development. Genes 2019, 10, 537. [Google Scholar] [CrossRef] [Green Version]
  25. Frankova, L.; Fry, S.C. Biochemistry and physiological roles of enzymes that ‘cut and paste’ plant cell-wall polysaccharides. J. Exp. Bot. 2013, 64, 3519–3550. [Google Scholar] [CrossRef] [PubMed] [Green Version]
  26. Iurlaro, A.; De Caroli, M.; Sabella, E.; De Pascali, M.; Rampino, P.; De Bellis, L.; Perrotta, C.; Dalessandro, G.; Piro, G.; Fry, S.C.; et al. Drought and Heat Differentially Affect XTH Expression and XET Activity and Action in 3-Day-Old Seedlings of Durum Wheat Cultivars with Different Stress Susceptibility. Front. Plant Sci. 2016, 7, 1686. [Google Scholar] [CrossRef] [PubMed] [Green Version]
  27. Holland, C.; Simmons, T.J.; Meulewaeter, F.; Hudson, A.; Fry, S.C. Three highly acidic Equisetum XTHs differ from hetero-trans-beta-glucanase in donor substrate specificity and are predominantly xyloglucan homo-transglucosylases. J. Plant Physiol. 2020, 251, 153210. [Google Scholar] [CrossRef]
  28. Van Sandt, V.S.; Stieperaere, H.; Guisez, Y.; Verbelen, J.P.; Vissenberg, K. XET activity is found near sites of growth and cell elongation in bryophytes and some green algae: New insights into the evolution of primary cell wall elongation. Ann. Bot. 2007, 99, 39–51. [Google Scholar] [CrossRef] [Green Version]
  29. Vissenberg, K.; Oyama, M.; Osato, Y.; Yokoyama, R.; Verbelen, J.P.; Nishitani, K. Differential expression of AtXTH17, AtXTH18, AtXTH19 and AtXTH20 genes in Arabidopsis roots. Physiological roles in specification in cell wall construction. Plant Cell Physiol. 2005, 46, 192–200. [Google Scholar] [CrossRef]
  30. Zhu, X.F.; Shi, Y.Z.; Lei, G.J.; Fry, S.C.; Zhang, B.C.; Zhou, Y.H.; Braam, J.; Jiang, T.; Xu, X.Y.; Mao, C.Z.; et al. XTH31, encoding an in vitro XEH/XET-active enzyme, regulates aluminum sensitivity by modulating in vivo XET action, cell wall xyloglucan content, and aluminum binding capacity in Arabidopsis. Plant Cell 2012, 24, 4731–4747. [Google Scholar] [CrossRef] [Green Version]
  31. Hara, Y.; Yokoyama, R.; Osakabe, K.; Toki, S.; Nishitani, K. Function of xyloglucan endotransglucosylase/hydrolases in rice. Ann. Bot. 2014, 114, 1309–1318. [Google Scholar] [CrossRef] [Green Version]
  32. Vissenberg, K.; Van Sandt, V.; Fry, S.C.; Verbelen, J.P. Xyloglucan endotransglucosylase action is high in the root elongation zone and in the trichoblasts of all vascular plants from Selaginella to Zea mays. J. Exp. Bot. 2003, 54, 335–344. [Google Scholar] [CrossRef]
  33. Park, Y.B.; Cosgrove, D.J. Xyloglucan and its interactions with other components of the growing cell wall. Plant Cell Physiol. 2015, 56, 180–194. [Google Scholar] [CrossRef] [PubMed] [Green Version]
  34. Chakraborty, S.; Nag, D.; Mazumder, T.H.; Uddin, A. Codon usage pattern and prediction of gene expression level in Bungarus species. Gene 2017, 604, 48–60. [Google Scholar] [CrossRef] [PubMed]
  35. Wang, L.; Xing, H.; Yuan, Y.; Wang, X.; Saeed, M.; Tao, J.; Feng, W.; Zhang, G.; Song, X.; Sun, X. Genome-wide analysis of codon usage bias in four sequenced cotton species. PLoS ONE 2018, 13, e0194372. [Google Scholar] [CrossRef] [PubMed] [Green Version]
  36. Fages-Lartaud, M.; Hundvin, K.; Hohmann-Marriott, M.F. Mechanisms governing codon usage bias and the implications for protein expression in the chloroplast of Chlamydomonas reinhardtii. Plant J. 2022, 112, 919–945. [Google Scholar] [CrossRef]
  37. Rao, Y.S.; Wu, G.Z.; Wang, Z.F.; Chai, X.W.; Nie, Q.H.; Zhang, X.Q. Mutation Bias is the Driving Force of Codon Usage in the Gallus gallus genome. DNA Res. 2011, 18, 499–512. [Google Scholar] [CrossRef] [PubMed] [Green Version]
  38. Wang, H.; Meng, T.; Wei, W. Analysis of synonymous codon usage bias in helicase gene from Autographa californica multiple nucleopolyhedrovirus. Genes Genom. 2018, 40, 767–780. [Google Scholar] [CrossRef] [PubMed]
  39. Stratilova, B.; Stratilova, E.; Hrmova, M.; Kozmon, S. Definition of the Acceptor Substrate Binding Specificity in Plant Xyloglucan Endotransglycosylases Using Computational Chemistry. Int. J. Mol. Sci. 2022, 23, 11838. [Google Scholar] [CrossRef] [PubMed]
  40. Chen, L.; Liu, T.F.; Yang, D.Y.; Nong, X.; Xie, Y.; Fu, Y.; Wu, X.H.; Huang, X.; Gu, X.B.; Wang, S.X.; et al. Analysis of codon usage patterns in Taenia pisiformis through annotated transcriptome data. Biochem. Biophys. Res. Commun. 2013, 430, 1344–1348. [Google Scholar] [CrossRef]
  41. Kawabe, A.; Miyashita, N.T. Patterns of codon usage bias in three dicot and four monocot plant species. Genes Genet. Syst. 2003, 78, 343–352. [Google Scholar] [CrossRef] [PubMed] [Green Version]
  42. Xiong, B.; Gu, X.; Qiu, X.; Dong, Z.; Ye, S.; Sun, G.; Huang, S.; Liu, X.; Xi, L.; Wang, Z. Variability in CitXET expression and XET activity in Citrus cultivar Huangguogan seedlings with differed degrees of etiolation. PLoS ONE 2017, 12, e0178973. [Google Scholar] [CrossRef] [Green Version]
  43. Nasrullah, I.; Butt, A.M.; Tahir, S.; Idrees, M.; Tong, Y. Genomic analysis of codon usage shows influence of mutation pressure, natural selection, and host features on Marburg virus evolution. BMC Evol. Biol. 2015, 15, 174. [Google Scholar] [CrossRef] [PubMed] [Green Version]
  44. Vicario, S.; Moriyama, E.N.; Powell, J.R. Codon usage in twelve species of Drosophila. BMC Evol. Biol. 2007, 7, 226. [Google Scholar] [CrossRef] [Green Version]
  45. Tao, P.; Dai, L.; Luo, M.; Tang, F.; Tien, P.; Pan, Z. Analysis of synonymous codon usage in classical swine fever virus. Virus Genes 2009, 38, 104–112. [Google Scholar] [CrossRef] [PubMed]
  46. Qiu, S.; Bergero, R.; Zeng, K.; Charlesworth, D. Patterns of codon usage bias in Silene latifolia. Mol. Biol. Evol. 2011, 28, 771–780. [Google Scholar] [CrossRef] [Green Version]
  47. Auewarakul, P. Composition bias and genome polarity of RNA viruses. Virus Res. 2005, 109, 33–37. [Google Scholar] [CrossRef]
  48. Shackelton, L.A.; Parrish, C.R.; Holmes, E.C. Evolutionary basis of codon usage and nucleotide composition bias in vertebrate DNA viruses. J. Mol. Evol. 2006, 62, 551–563. [Google Scholar] [CrossRef]
  49. Puigbo, P.; Bravo, I.G.; Garcia-Vallve, S. CAIcal: A combined set of tools to assess codon usage adaptation. Biol. Direct. 2008, 3, 38. [Google Scholar] [CrossRef] [Green Version]
  50. Lu, H.; Zhao, W.M.; Zheng, Y.; Wang, H.; Qi, M.; Yu, X.P. Analysis of synonymous codon usage bias in Chlamydia. Acta Biochim. Biophys. Sin. (Shanghai) 2005, 37, 1–10. [Google Scholar] [CrossRef]
  51. Kumar, S.; Stecher, G.; Tamura, K. MEGA7: Molecular Evolutionary Genetics Analysis Version 7.0 for Bigger Datasets. Mol. Biol. Evol. 2016, 33, 1870–1874. [Google Scholar] [CrossRef] [PubMed] [Green Version]
  52. Sharp, P.-M.; Li, W.-H. Codon usage in regulatory genes in Escherichia coli does not reflect selection for ‘rare’ codons. Nucleic Acids Res. 1986, 14, 7737–7749. [Google Scholar] [CrossRef] [PubMed] [Green Version]
  53. Zhang, W.J.; Zhou, J.; Li, Z.F.; Wang, L.; Gu, X.; Zhong, Y. Comparative Analysis of Codon Usage Patterns Among Mitochondrion, Chloroplast and Nuclear Genes in Triticum aestivum L. J. Integr. Plant Biol. 2007, 49, 246–254. [Google Scholar] [CrossRef]
Figure 1. Phylogenetic tree based on the XET coding sequences. The tree was generated by the neighbor-joining (NJ) method using the MEGA 7.0.12 program. The bootstraps values were calculated with 1000 replicates.
Ijms 24 06108 g001
Figure 2. Hierarchical cluster analysis of 59 synonymous codons in 20 XET genes.
Ijms 24 06108 g002
Figure 3. Correspondence analysis of the codon usage frequencies in 20 XET genes.
Ijms 24 06108 g003
Figure 4. Correlations (r) between gene positions along the first two major axes of XET codon usage indices and synonymous codon usage bias. * means significant, ** means extremely significant.
Ijms 24 06108 g004
Figure 5. Multiple correspondence analysis of relative synonymous codon usage in the XET genes. Multiple correspondence analysis of Group 1 and 2 in the results of Figure 1 (a), multiple correspondence analysis of GC3S and AU3S (b).
Ijms 24 06108 g005
Figure 6. Multidimensional preference analysis of the relative synonymous codon usage for each codon of the 20 XET genes.
Ijms 24 06108 g006
Figure 7. Correlation between codon adaptation index (CAI) and the effective number of codons (ENc).
Ijms 24 06108 g007
Table 1. Accession numbers and characteristics of the analyzed XET coding sequences.
No.Accession NumberGenesU3s/%C3s/%A3s/%G3s /%GC3s/%GC/%CAICBIFopENcGravyAromo
1KY576851Citrus cultivar (Huangguogan) XET43.7027.5636.5422.5137.741.70.2420.0460.4647.39−0.390.18
2KU705236.1Populus euphratica XET36.3641.9621.2426.2153.446.20.2510.1400.5248.40−0.520.18
3AF052194.1Actinidia deliciosa XET26.5443.6022.2938.0461.851.00.2390.0710.4756.46−0.420.17
4L46792.1Actinidia deliciosa XET-528.9941.1822.2836.6759.450.40.2310.0830.4853.56−0.500.17
5XM_009140285.2Brassica rapa (field mustard) XET39.3425.8237.8824.0438.544.90.208−0.0580.3960.70−0.370.15
6EU579461.1Brassica rapa subsp. pekinensis XET39.3425.8238.3823.5038.144.90.209−0.0580.3960.71−0.380.15
7KU530158.1Camellia sinensis XET39.7840.8622.6723.8850.044.80.2420.0540.4657.34−0.410.17
8HM053613.1Dahlia pinnata XET38.2729.6335.5322.1640.946.80.220−0.0190.4157.91−0.350.14
9DQ912942.1Gossypium barbadense XET39.6830.9533.0026.6743.245.50.2880.0920.4852.30−0.570.16
10DQ855285.2Medicago truncatula XET48.7220.9444.8515.0827.438.80.230−0.0670.3947.04−0.530.16
11KT890352.1Paeonia ostii var. lishizhenii XET32.8637.1439.2522.1145.343.90.2090.0200.4552.22−0.680.18
12HQ416697.2Pennisetum glaucum XET5.5367.662.4347.5093.467.50.3520.3570.6431.14−0.440.14
13JX431932.1Populus alba x Populus tremula var XET29.0038.1030.0033.5254.448.00.2180.0380.4649.73−0.450.17
14AJ811689.1Pyrus communis XET22.3549.4122.6736.1165.454.30.2460.0850.4949.18−0.900.16
15EU432411.1Pyrus pyrifolia XET28.1442.4223.2037.3660.149.70.2620.1480.5151.44−0.450.16
16GU320707.1Rosa chinensis XET26.8145.1122.6134.2261.250.30.2330.1260.5047.28−0.530.16
17KM034907.1Sinopodophyllum hexandrum XET35.1129.7940.8826.0042.044.40.190−0.1460.3652.47−0.600.16
18FJ896376.1Vigna luteola XET2.3868.250.0053.8597.967.80.2910.3090.6131.75−0.450.14
19FJ896377.1Vigna radiata cultivar T44 XET2.4068.000.9353.9297.267.10.2870.3010.6032.36−0.480.14
20FJ940680.1Zea mays XET1.6859.662.8858.9196.369.50.2620.3130.6132.54−0.410.12
U3s: frequency of the nucleotide U at the third codon position; C3s: frequency of the nucleotide C at the third codon position; A3s: frequency of the nucleotide A at the third codon position; G3s: frequency of the nucleotide G at the third codon position; GC3s: frequency of the nucleotides G + C at the third codon position; GC: G + C content; CAI: codon adaptation index; CBI: codon bias index; ENc: effective number of codons; Gravy: protein hydrophobicity.
Table 2. Relative synonymous codon usage values and number of codons for the 20 XET genes (4500 codons).
Amino AcidCodonNumberRSCUAmino AcidCodonNumberRSCU
PheUUU *1050.58AlaGCU *1061.42
UUC2211.42GCC1041.40
LeuUUA *280.63GCA *500.64
UUG *571.14GCG *480.54
CUU *471.03TyrUAU *730.54
CUC681.42UAC1821.46
CUA210.43HisCAU *440.83
CUG671.36CAC581.18
IleAUU *760.94GlnCAA *850.82
AUC891.55CAG1321.18
AUA *420.51AsnAAU *660.62
ValGUU *670.96AAC1321.38
GUC600.94LysAAA *990.71
GUA *380.60AAG1461.29
GUG1131.50AspGAU *1530.86
SerUCU *731.24GAC1831.14
UCC681.44GluGAA *590.62
UCA490.87GAG1151.38
UCG420.72CysUGU *320.64
AGU *390.77UGC471.06
AGC510.96ArgCGU *250.45
ProCCU *560.85CGC510.92
CCC581.03CGA *220.39
CCA *761.19CGG300.61
CCG490.93ArgAGA *861.89
ThrACU *841.24AGG *841.74
ACC741.17GlyGGU *770.97
ACA *691.02GGC1121.06
ACG360.57GGA *991.15
GGG770.82
* Putatively identified as preferred codons. Underlined values indicate high-frequency codons (RSCU > 1.5).
Table 3. Relative synonymous codon usage values and number of codons for CitXET genes (300 codons).
Amino AcidCodonNumberRSCUAmino AcidCodonNumberRSCU
PheUUU *130.90AlaGCU *102.67
UUC161.10GCC30.80
LeuUUA *00.00GCA *10.27
UUG *51.50GCG *10.27
CUU *82.40TyrUAU *30.35
CUC20.60UAC141.65
CUA00.00HisCAU *41.33
CUG51.50CAC20.67
IleAUU *91.59GlnCAA *60.86
AUC30.53CAG81.14
AUA *50.88AsnAAU *81.33
ValGUU *71.65AAC40.67
GUC30.71LysAAA *171.62
GUA *10.24AAG40.38
GUG61.41AspGAU *161.45
SerUCU *72.10GAC60.55
UCC20.60GluGAA *61.09
UCA61.80GAG50.91
UCG10.30CysUGU *41.30
AGU *41.20UGC20.70
AGC00.00ArgCGU *30.90
ProCCU *51.33CGC20.60
CCC10.27CGA *10.30
CCA *71.87CGG00.00
CCG20.53ArgAGA *133.90
ThrACU *61.50AGG *10.30
ACC20.50GlyGGU *40.70
ACA *61.50GGC81.50
ACG20.50GGA *71.30
GGG30.60
* Putatively identified as preferred codons. Underlined values indicate high-frequency codons (RSCU > 1.5). Fraction: proportion of all codons represented by a specific codon for a particular amino acid.
Disclaimer/Publisher’s Note: The statements, opinions and data contained in all publications are solely those of the individual author(s) and contributor(s) and not of MDPI and/or the editor(s). MDPI and/or the editor(s) disclaim responsibility for any injury to people or property resulting from any ideas, methods, instructions or products referred to in the content.

