
SAV-Pred: A Freely Available Web Application for the Prediction of Pathogenic Amino Acid Substitutions for Monogenic Hereditary Diseases Studied in Newborn Screening


Abstract
1. Introduction
2. Results
2.1. SAV-Pred Contents and Comparison with Other Bioinformatic Tools
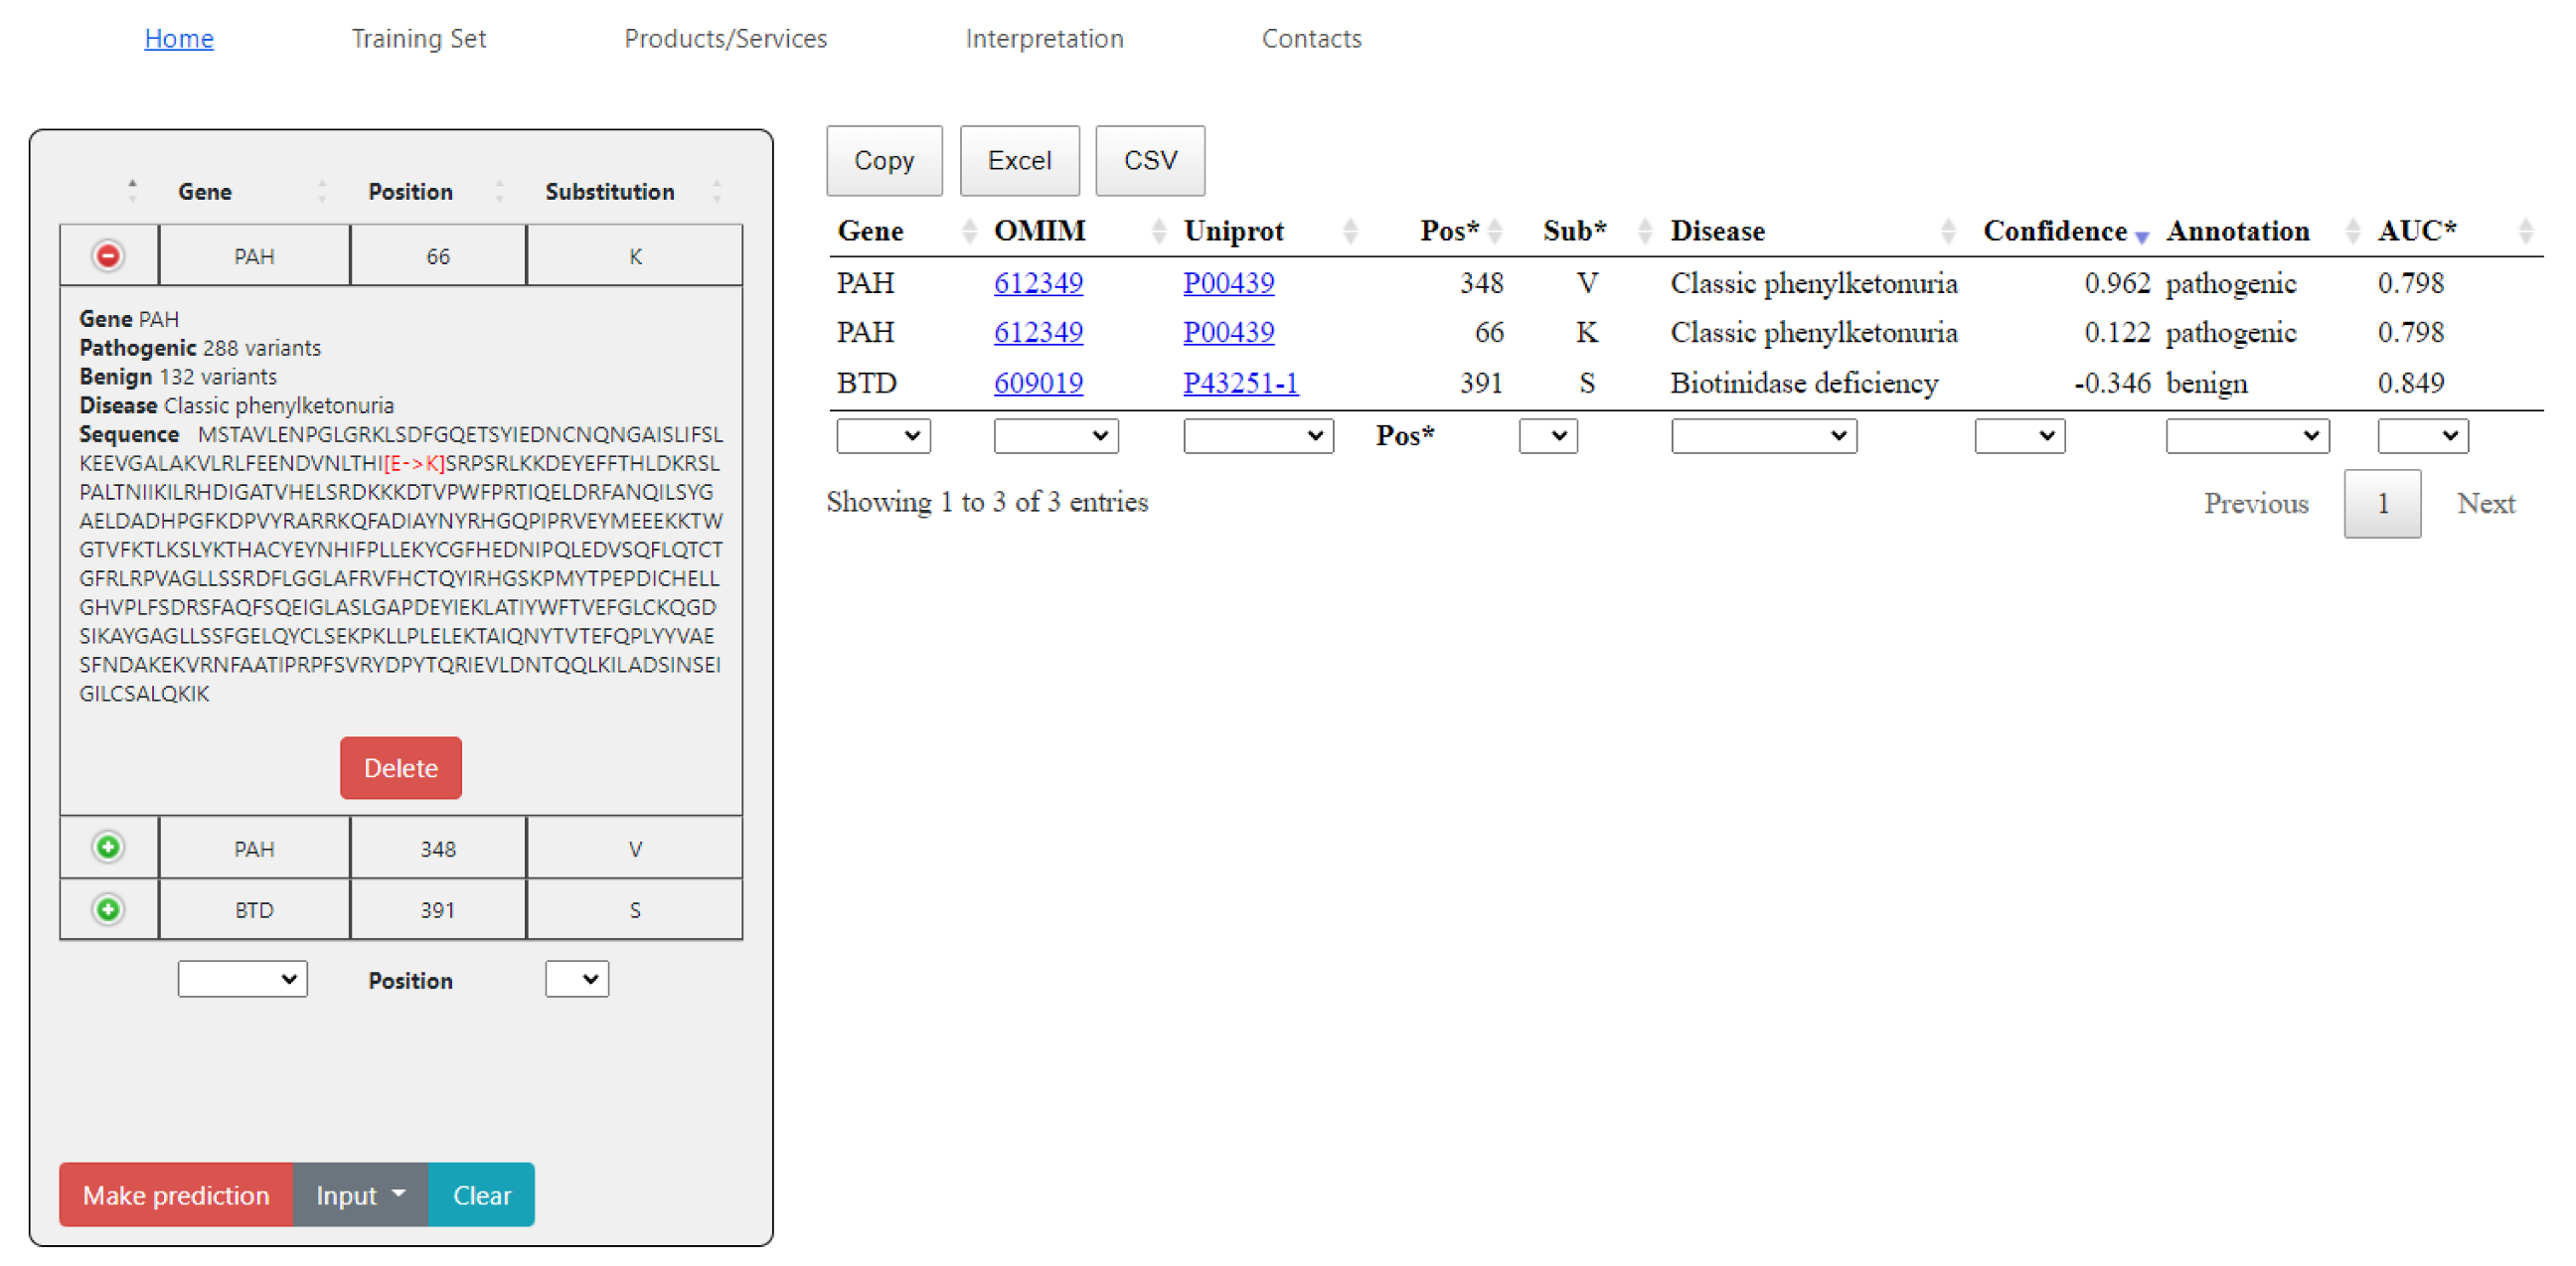
2.2. SAV-Pred Web Application
<gene name> <position> <a.a. substitution>The prediction results can be saved as a file in the CSV or XLS formats, or simply copied. The data on composition, the datasets, and AUC values are also provided.
3. Discussion
4. Materials and Methods
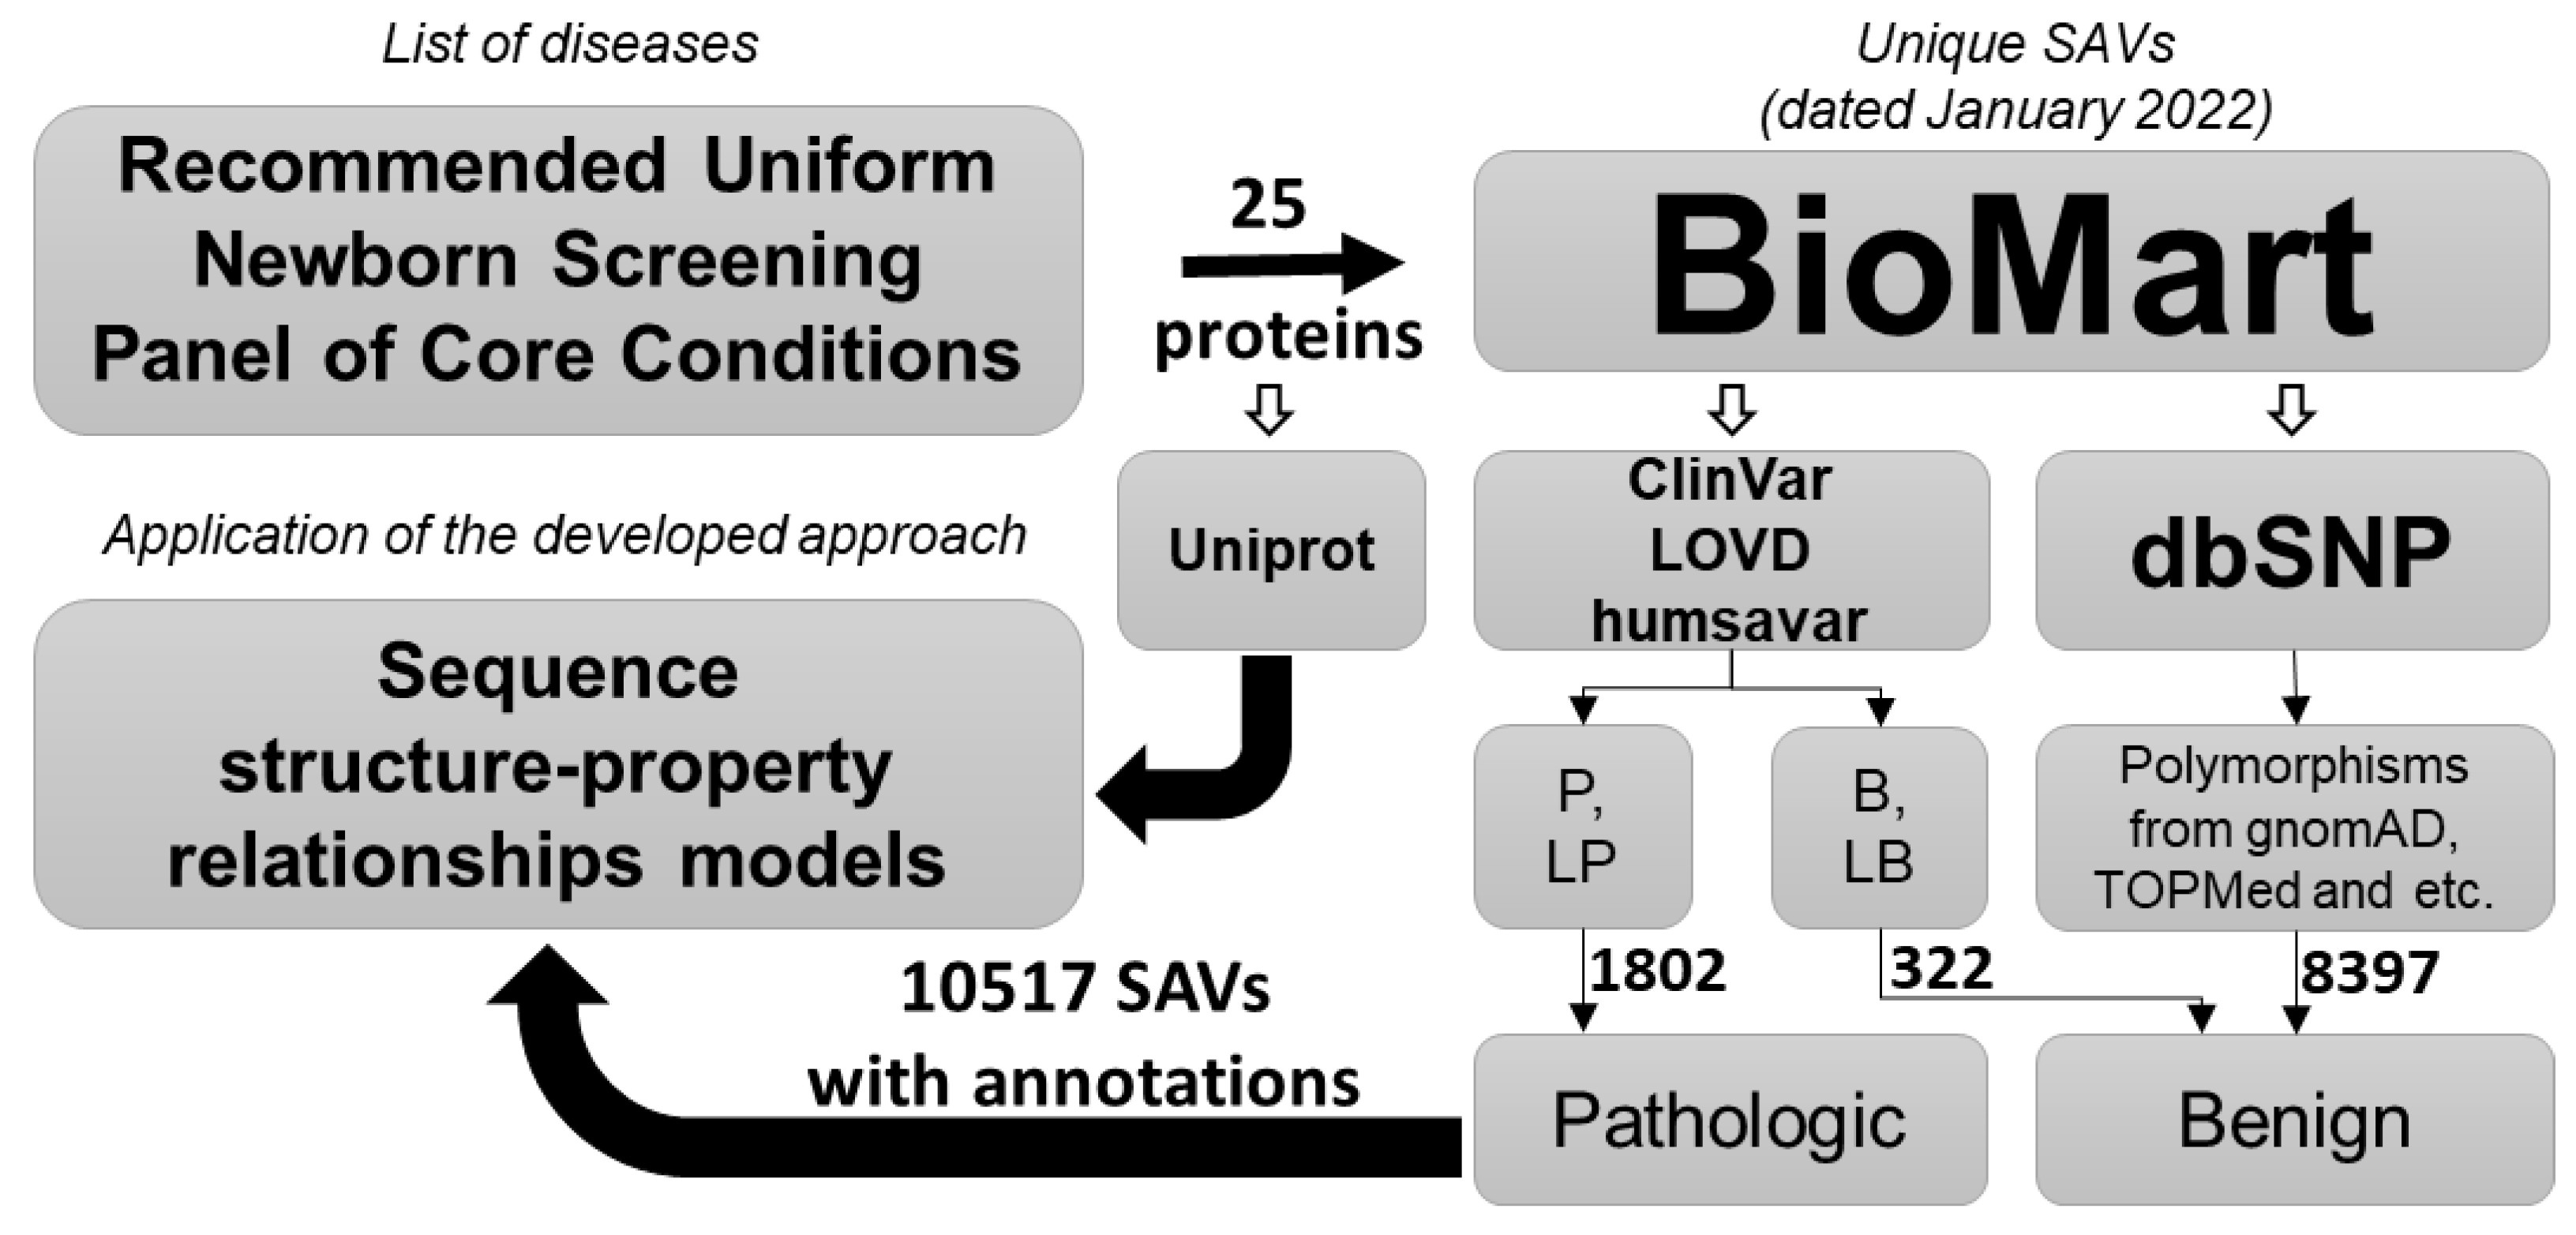
4.1. Datasets Collection
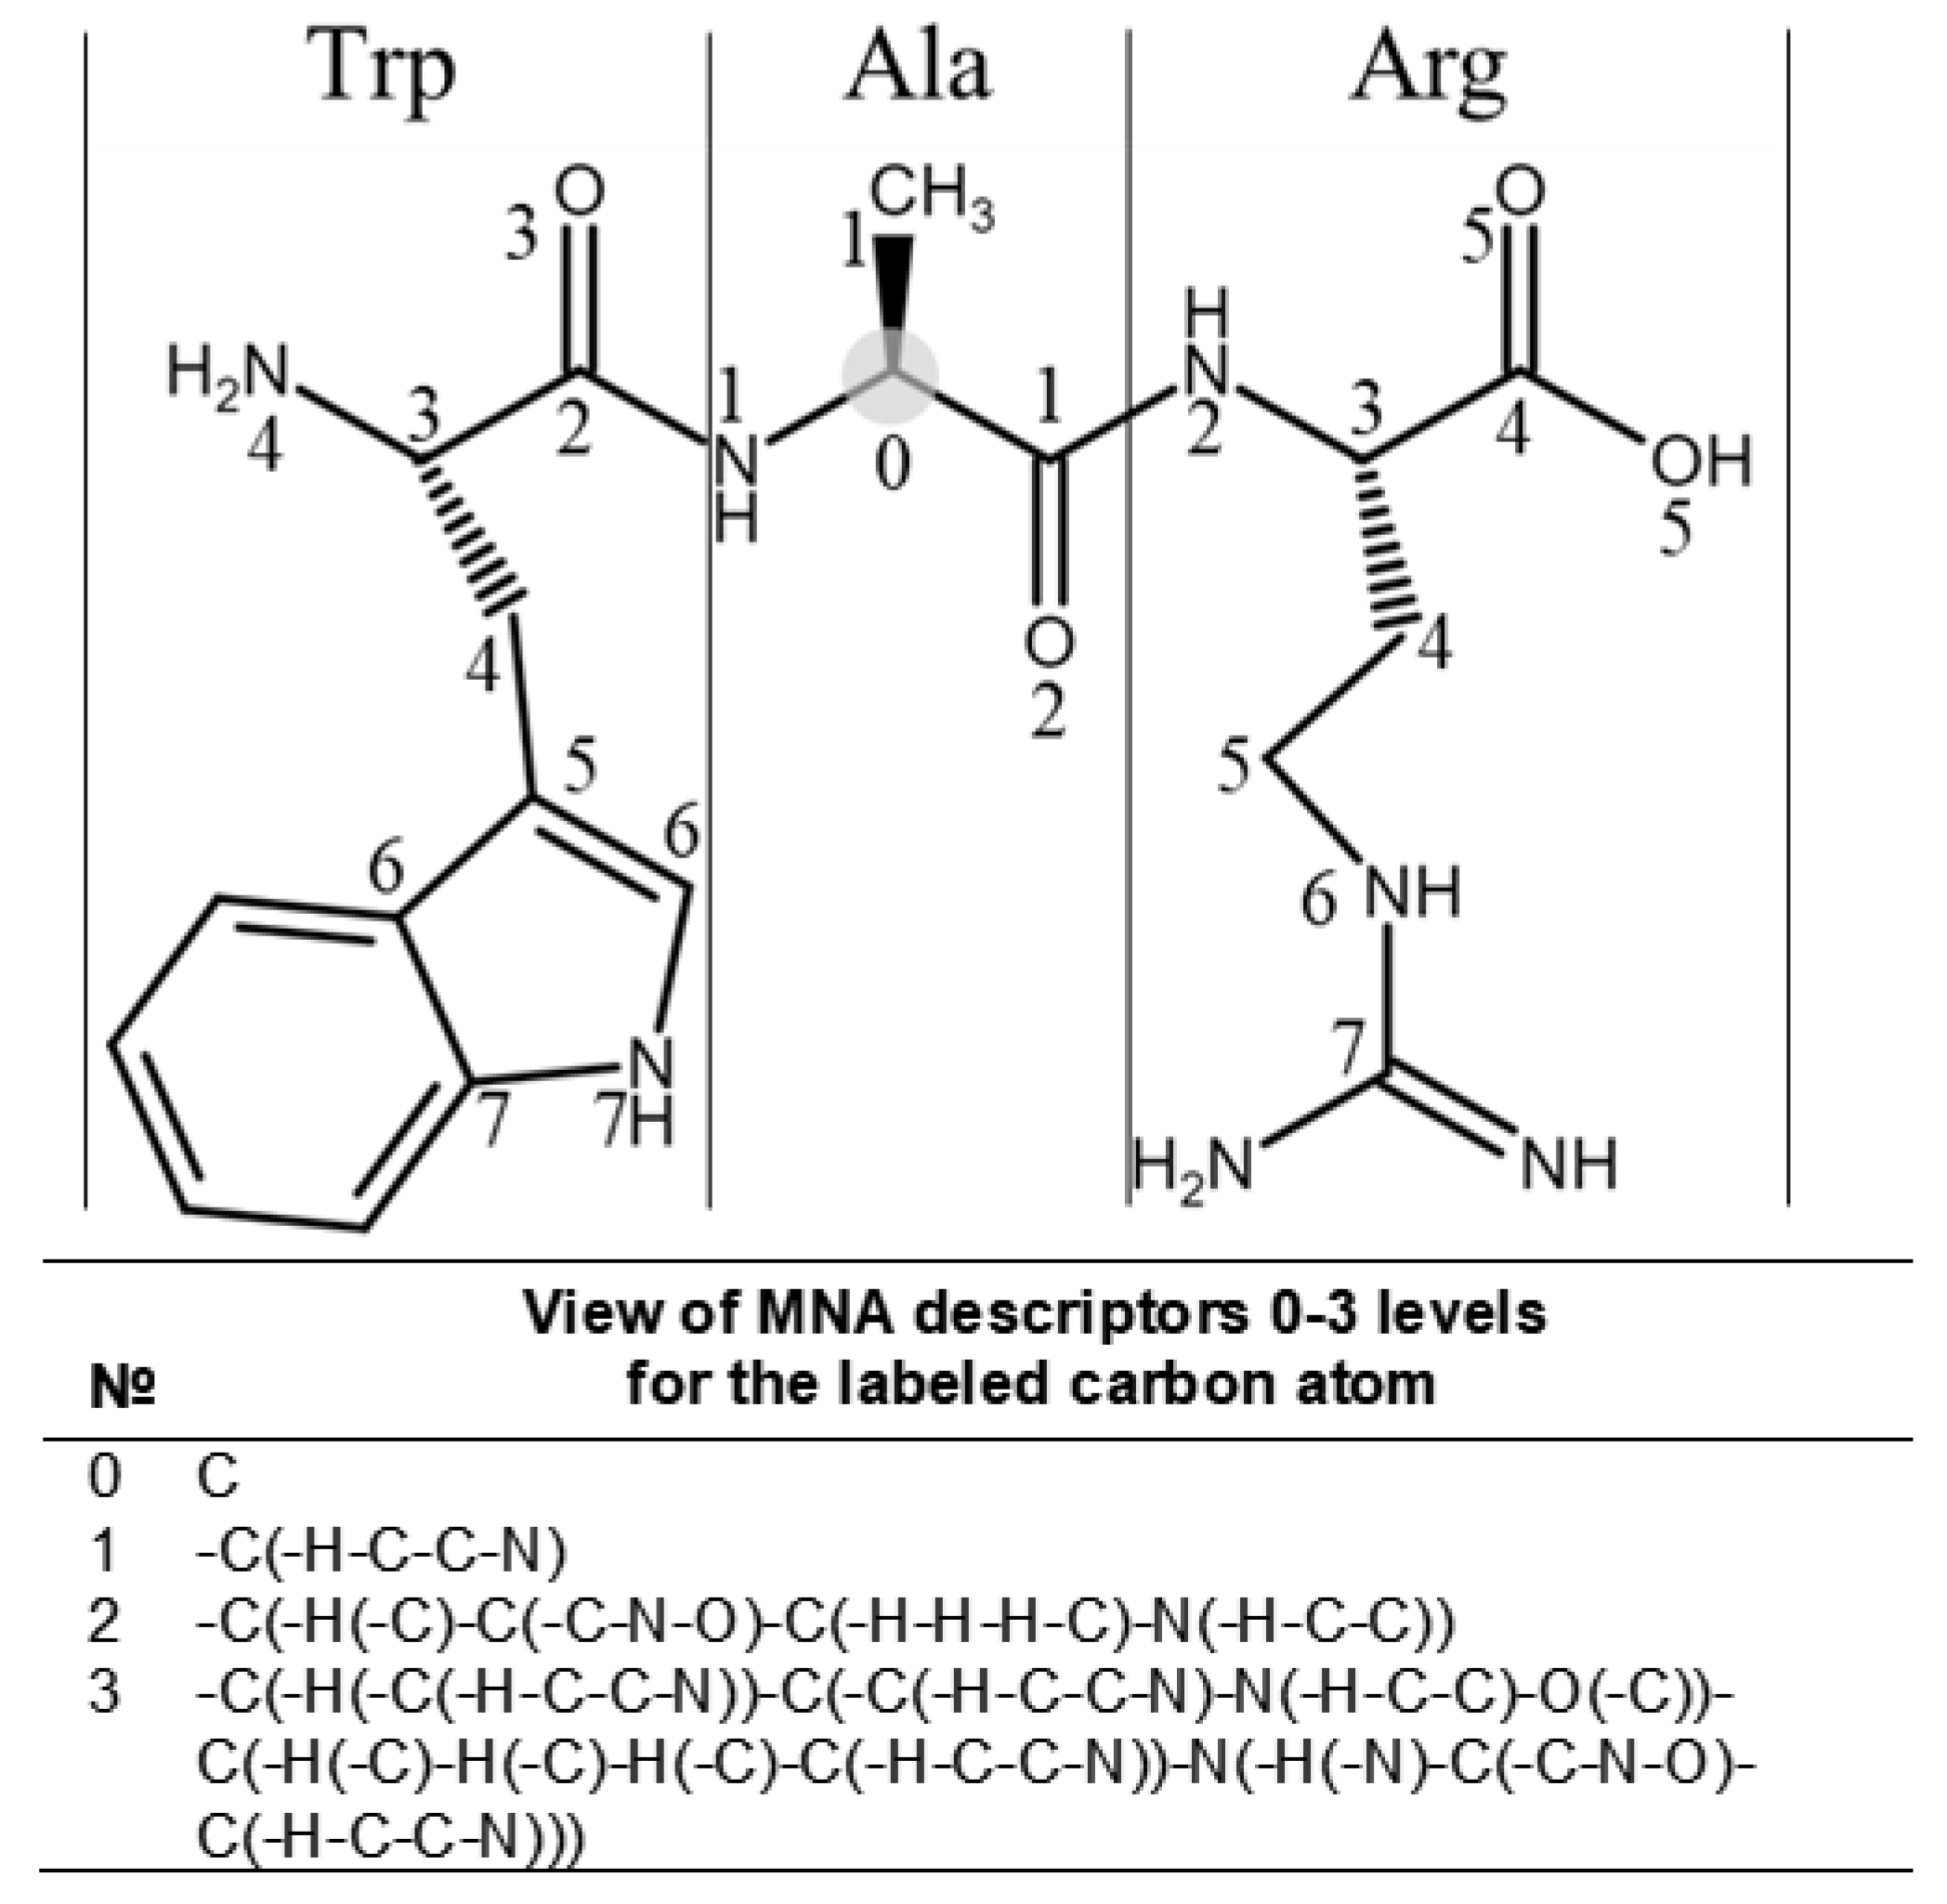
4.2. Building the SSPR Models
4.3. Validation and Performance Assessment
Author Contributions
Funding
Data Availability Statement
Acknowledgments
Conflicts of Interest
Abbreviation
| NGS | Next Generation Sequencing |
| SNP | Single Nucleotide Polymorphism |
| SAV | Single Amino acid Variant |
| VUS | Variant of Uncertain Significance |
| SAR | Structure-Activity Relationships |
| SSPR | Sequence-Structure-Property Relationships |
| MNA | Multi-level Neighborhoods of Atoms |
| MultiPASS | Modified command line version of Prediction of Activity Spectra for Substances |
| SAV-Pred | Single Amino acid Variants Predictor |
| SIFT | Sorting Intolerant From Tolerant |
| Polyphen-2 | Polymorphism Phenotyping v2 |
| PROVEAN | Protein Variation Effect Analyzer |
| Mutation Assessor | Functional impact of protein mutations |
| FATHMM | Functional Analysis through Hidden Markov Models |
| NBS | Newborn Screening |
| ACOG | American College of Obstetricians and Gynecologists |
| db | Data Base |
| OMIM | Online Mendelian Inheritance in Man |
| ClinVar | Public archive of reports of the relationships among human variations and phenotypes |
| LOVD | Leiden Open Variation Database |
| UniProt | Leading high-quality resource of protein sequence and functional information |
| humsavar | All missense variants annotated in UniProtKB/Swiss-Prot human entries |
| gnomAD | The Genome Aggregation Database |
| TOPMed | The Trans-Omics for Precision Medicine program |
| dbNSFP | Functional prediction and annotation of all potential missense variants in humans |
| SDF | Structured Data File |
| AUC | Area under the receiver operating characteristic curve |
| LOO-CV | Leave-One-Out Cross-Validation |
| 20F-CV | 20-Fold Cross-Validation |
| ABCD1 | ATP binding cassette subfamily D member 1 |
| ACADM | Acyl-CoA dehydrogenase medium chain |
| ACADVL | Acyl-CoA dehydrogenase very long chain |
| ASL | Argininosuccinate lyase |
| ASS1 | Argininosuccinate synthase 1 |
| BTD | Biotinidase |
| CFTR | Cystic Fibrosis transmembrane conductance regulator |
| FAH | Fumarylacetoacetate hydrolase |
| GAA | Alpha glucosidase |
| GALT | Galactose-1-phosphate uridylyltransferase |
| GCDH | Glutaryl-CoA dehydrogenase |
| HADHA | Hydroxyacyl-CoA dehydrogenase trifunctional multienzyme complex subunit alpha |
| HADHB | Hydroxyacyl-CoA dehydrogenase trifunctional multienzyme complex subunit beta |
| HBB | Hemoglobin subunit beta |
| HLCS | Holocarboxylase synthetase |
| HMGCL | 3-hydroxy-3-methylglutaryl-CoA lyase |
| IDUA | Alpha-L-iduronidase |
| IVD | Isovaleryl-CoA dehydrogenase |
| MCCC1 | Methylcrotonyl-CoA carboxylase subunit 1 |
| MCCC2 | Methylcrotonyl-CoA carboxylase subunit 2 |
| MMUT | Methylmalonyl-CoA mutase |
| PAH | Phenylalanine hydroxylase |
| PCCB | Propionyl-CoA carboxylase subunit beta |
| SLC22A5 | Solute carrier family 22 member 5 |
| TSHR | Thyroid stimulating hormone receptor |
References
- Feuchtbaum, L.; Carter, J.; Dowray, S.; Currier, R.J.; Lorey, F. Birth prevalence of disorders detectable through newborn screening by race/ethnicity. Genet Med. 2012, 14, 937–945. [Google Scholar] [CrossRef] [PubMed]
- Newborn screening and the role of the obstetrician–gynecologist. ACOG Committee Opinion No. 778. American College of Obstetricians and Gynecologists. Obstet. Gynecol. 2019, 133, e357–e361. [CrossRef] [PubMed]
- Olszowiec-Chlebna, M.; Mospinek, E.; Jerzynska, J. Impact of newborn screening for cystic fibrosis on clinical outcomes of pediatric patients: 10 years’ experience in Lodz Voivodship. Ital. J. Pediatr. 2021, 47, 87. [Google Scholar] [CrossRef] [PubMed]
- McInnes, G.; Sharo, A.G.; Koleske, M.L.; Brown, J.E.H.; Norstad, M.; Adhikari, A.N.; Wang, S.; Brenner, S.E.; Halpern, J.; Koenig, B.A.; et al. Opportunities and challenges for the computational interpretation of rare variation in clinically important genes. Am. J. Hum. Genet. 2021, 108, 535–548. [Google Scholar] [CrossRef] [PubMed]
- Adzhubei, I.; Jordan, D.M.; Sunyaev, S.R. Predicting functional effect of human missense mutations using PolyPhen-2. Curr. Protoc. Hum. Genet. 2013, Chapter 7, Unit 7.20. [Google Scholar] [CrossRef] [PubMed]
- Vaser, R.; Adusumalli, S.; Leng, S. SIFT missense predictions for genomes. Nat. Protoc. 2016, 11, 1–9. [Google Scholar] [CrossRef]
- Reva, B.; Antipin, Y.; Sander, C. Predicting the functional impact of protein mutations: Application to cancer genomics. Nucleic Acids Res. 2011, 39, e118. [Google Scholar] [CrossRef]
- López-Ferrando, V.; Gazzo, A.; de la Cruz, X.; Orozco, M.; Gelpí, J.L. PMut: A web-based tool for the annotation of pathological variants on proteins, 2017 update. Nucleic Acids Res. 2017, 45, W222–W228. [Google Scholar] [CrossRef]
- Grimm, D.G.; Azencott, C.A.; Aicheler, F.; Gieraths, U.; MacArthur, D.G.; Samocha, K.E.; Cooper, D.N.; Stenson, P.D.; Daly, M.J.; Smoller, J.W.; et al. The evaluation of tools used to predict the impact of missense variants is hindered by two types of circularity. Hum. Mutat. 2015, 36, 513–523. [Google Scholar] [CrossRef]
- Choi, Y.; Sims, G.E.; Murphy, S.; Miller, J.R.; Chan, A.P. Predicting the functional effect of amino acid substitutions and indels. PLoS ONE 2012, 7, e46688. [Google Scholar] [CrossRef]
- Shihab, H.A.; Gough, J.; Cooper, D.N.; Day, I.N.; Gaunt, T.R. Predicting the functional consequences of cancer-associated amino acid substitutions. Bioinformatics 2013, 29, 1504–1510. [Google Scholar] [CrossRef] [PubMed]
- Zadorozhnyy, A.; Smirnov, A.; Filimonov, D.; Lagunin, A. Prediction of pathogenic single amino acid substitutions using molecular fragment descriptors. Bioinformatics 2022, unpublished data. [Google Scholar]
- Liu, X.; Li, C.; Mou, C.; Dong, Y.; Tu, Y. dbNSFP v4: A comprehensive database of transcript-specific functional predictions and annotations for human nonsynonymous and splice-site SNVs. Genome Med. 2020, 12, 103. [Google Scholar] [CrossRef]
- Landrum, M.J.; Lee, J.M.; Benson, M.; Brown, G.R.; Chao, C.; Chitipiralla, S.; Gu, B.; Hart, J.; Hoffman, D.; Jang, W.; et al. ClinVar: Improving access to variant interpretations and supporting evidence. Nucleic Acids Res. 2018, 46, 1062–1067. [Google Scholar] [CrossRef] [PubMed]
- The UniProt Consortium UniProt: The universal protein knowledgebase in 2021. Nucleic Acids Res. 2021, 49, 480–489. [CrossRef]
- Riera, C.; Padilla, N.; de la Cruz, X. The Complementarity Between Protein-Specific and General Pathogenicity Predictors for Amino Acid Substitutions. Hum. Mutat. 2016, 37, 1013–1024. [Google Scholar] [CrossRef]
- Crockett, D.K.; Lyon, E.; Williams, M.S.; Narus, S.P.; Facelli, J.C.; Mitchell, J.A. Utility of gene-specific algorithms for predicting pathogenicity of uncertain gene variants. J. Am. Med. Inform. Assoc. 2012, 19, 207–211. [Google Scholar] [CrossRef]
- Fokkema, I.F.; Taschner, P.E.; Schaafsma, G.C.; Celli, J.; Laros, J.F.; den Dunnen, J.T. LOVD v.2.0: The next generation in gene variant databases. Hum. Mutat. 2011, 32, 557–563. [Google Scholar] [CrossRef]
- Sherry, S.T.; Ward, M.H.; Kholodov, M.; Baker, J.; Phan, L.; Smigielski, E.M.; Sirotkin, K. dbSNP: The NCBI database of genetic variation. Nucleic Acids Res. 2001, 29, 308–311. [Google Scholar] [CrossRef]
- Kinsella, R.J.; Kähäri, A.; Haider, S.; Zamora, J.; Proctor, G.; Spudich, G.; Almeida-King, J.; Staines, D.; Derwent, P.; Kerhornou, A.; et al. Ensembl BioMarts: A hub for data retrieval across taxonomic space. Database (Oxford) 2011. Published online July 23. [Google Scholar] [CrossRef]
- Karasev, D.A.; Savosina, P.I.; Sobolev, B.N.; Filimonov, D.A.; Lagunin, A.A. Application of molecular descriptors for recognition of phosphorylation sites in amino acid sequences. Biomed. Khim. 2017, 63, 423–427. [Google Scholar] [CrossRef] [PubMed]
- Filimonov, D.A.; Lagunin, A.A.; Gloriozova, T.A.; Rudik, A.V.; Druzhilovskii, D.S.; Pogodin, P.V.; Poroikov, V.V. Prediction of the Biological Activity Spectra of Organic Compounds Using the Pass Online Web Resource. Chem. Heterocycl. Comp. 2014, 50, 444–457. [Google Scholar] [CrossRef]
- Lagunin, A.; Stepanchikova, A.; Filimonov, D.; Poroikov, V. PASS: Prediction of activity spectra for biologically active substances. Bioinformatics 2000, 16, 747–748. [Google Scholar] [CrossRef] [PubMed]
- Pedregosa, F.; Varoquaux, G.; Gramfort, A.; Michel, V.; Thirion, B.; Grisel, O.; Blondel, M.; Prettenhofer, P.; Weiss, R.; Dubourg, V.; et al. Scikit-learn: Machine Learning in Python. JMLR 2011, 12, 2825–2830. [Google Scholar]


| Gene | Disease | OMIM | UniProt | B | P | B+ | Total | PL | MNA | AUCLOO-CV | AUC20F-CV |
|---|---|---|---|---|---|---|---|---|---|---|---|
| ABCD1 | X-linked adrenoleukodystrophy | 300371 | P33897 | 31 | 58 | 306 | 395 | 19 | 9 | 0.849 | 0.839 |
| ACADM | Medium-chain acyl-CoA dehydrogenase deficiency | 607008 | P11310-1 | 3 | 63 | 253 | 319 | 9 | 7 | 0.792 | 0.793 |
| ACADVL | Very long-chain acyl-CoA dehydrogenase deficiency | 609575 | P49748-1 | 9 | 91 | 382 | 482 | 19 | 10 | 0.800 | 0.801 |
| ASL | Argininosuccinic aciduria | 608310 | P04424-1 | 9 | 29 | 288 | 326 | 7 | 9 | 0.850 | 0.853 |
| ASS1 | Homocystinuria Citrullinemia, type I | 603470 | P00966 | 10 | 25 | 162 | 197 | 13 | 6 | 0.787 | 0.792 |
| BTD | Biotinidase deficiency | 609019 | P43251-1 | 5 | 133 | 317 | 455 | 17 | 15 | 0.849 | 0.830 |
| CFTR | Cystic fibrosis | 219700 | P13569-1 | 56 | 350 | 697 | 1103 | 17 | 11 | 0.781 | 0.787 |
| FAH | Tyrosinemia, type I | 613871 | P10253-1 | 4 | 15 | 248 | 267 | 29 | 3 | 0.843 | 0.837 |
| GAA | Glycogen Storage Disease Type II (Pompe) | 606800 | P10253-1 | 53 | 72 | 353 | 478 | 13 | 11 | 0.742 | 0.733 |
| GALT | Classic galactosemia | 606999 | P07902-1 | 5 | 119 | 120 | 244 | 23 | 4 | 0.695 | 0.686 |
| GCDH | Glutaric acidemia type I | 608801 | Q92947-1 | 5 | 58 | 208 | 271 | 21 | 15 | 0.703 | 0.707 |
| HADHA | Long-chain L-3 hydroxyacyl-CoA dehydrogenase deficiency | 600890 | Q96RQ3 | 12 | 9 | 476 | 497 | 9 | 11 | 0.813 | 0.808 |
| HADHB | Trifunctional protein deficiency | 143450 | P50747-1 | 2 | 14 | 309 | 325 | 17 | 5 | 0.961 | 0.961 |
| HBB | Hemoglobinopathies | 141900 | P68871 | 27 | 149 | 79 | 255 | 7 | 7 | 0.912 | 0.903 |
| HLCS | Holocarboxylase synthase deficiency | 609018 | P40939-1 | 17 | 12 | 463 | 492 | 7 | 8 | 0.776 | 0.776 |
| HMGCL | 3-Hydroxy-3-methylglutaric aciduria | 613898 | P35914-1 | 2 | 6 | 188 | 196 | 9 | 8 | 0.740 | 0.714 |
| IDUA | Mucopolysaccharidosis type 1 | 252800 | P35475-1 | 19 | 46 | 556 | 621 | 29 | 15 | 0.890 | 0.853 |
| IVD | Isovaleric acidemia | 607036 | P26440 | 6 | 30 | 326 | 362 | 13 | 11 | 0.908 | 0.906 |
| MCCC1 | 3-Methylcrotonyl-CoA carboxylase deficiency | 609010 | P16930-1 | 12 | 16 | 449 | 477 | 7 | 12 | 0.764 | 0.754 |
| MCCC2 | 3-Methylcrotonyl-CoA carboxylase deficiency | 609014 | Q9HCC0-1 | 5 | 25 | 411 | 441 | 23 | 15 | 0.814 | 0.797 |
| MMUT | Methylmalonic acidemia | 609058 | P22033-1 | 8 | 70 | 355 | 433 | 29 | 9 | 0.712 | 0.712 |
| PAH | Classic phenylketonuria | 612349 | P00439 | 1 | 288 | 131 | 420 | 11 | 7 | 0.798 | 0.798 |
| PCCB | Propionic acidemia β-ketothiolase deficiency | 232050 | P05166-1 | 4 | 26 | 490 | 520 | 17 | 12 | 0.794 | 0.796 |
| SLC22A5 | Carnitine uptake defect/transport defect | 603377 | O76082-1 | 9 | 68 | 319 | 396 | 9 | 6 | 0.870 | 0.875 |
| TSHR | Primary congenital hypothyroidism | 603372 | P16473-1 | 8 | 30 | 511 | 549 | 19 | 3 | 0.803 | 0.764 |
| Protein | SAV-Pred | SIFT 4G | PolyPhen-2 HDIV | Mutation Assessor | PROVEAN | FATHMM | ||||||
|---|---|---|---|---|---|---|---|---|---|---|---|---|
| AUCF20-CV | % | AUC | % | AUC | % | AUC | % | AUC | % | AUC | % | |
| ABCD1 | 0.839 | 100 | 0.886 | 99 | 0.868 | 99 | 0.878 | 99 | 0.872 | 99 | 0.734 | 99 |
| ACADM | 0.793 | 100 | 0.585 | 95 | 0.657 | 95 | 0.619 | 95 | 0.664 | 95 | 0.549 | 95 |
| ACADVL | 0.801 | 100 | 0.734 | 97 | 0.761 | 97 | 0.693 | 97 | 0.652 | 97 | 0.609 | 97 |
| ASL | 0.853 | 100 | 0.783 | 98 | 0.841 | 98 | 0.738 | 98 | 0.795 | 98 | 0.659 | 98 |
| ASS1 | 0.792 | 100 | 0.711 | 100 | 0.721 | 100 | 0.815 | 100 | 0.754 | 100 | 0.635 | 100 |
| BTD | 0.830 | 100 | - | 0 | 0.792 | 96 | 0.797 | 96 | - | 0 | - | 0 |
| CFTR | 0.787 | 100 | 0.678 | 100 | 0.727 | 100 | 0.702 | 100 | 0.706 | 100 | 0.516 | 100 |
| FAH | 0.837 | 100 | 0.848 | 99 | 0.863 | 99 | 0.850 | 99 | 0.838 | 99 | 0.651 | 99 |
| GAA | 0.733 | 100 | 0.762 | 99 | 0.821 | 100 | 0.824 | 100 | 0.802 | 99 | 0.690 | 100 |
| GALT | 0.686 | 100 | 0.711 | 100 | 0.736 | 100 | 0.724 | 97 | 0.721 | 100 | 0.534 | 100 |
| GCDH | 0.707 | 100 | 0.751 | 100 | 0.758 | 100 | 0.751 | 100 | 0.687 | 100 | 0.519 | 100 |
| HADHA | 0.808 | 100 | 0.856 | 99 | 0.790 | 99 | 0.873 | 97 | 0.774 | 99 | 0.572 | 99 |
| HADHB | 0.961 | 100 | 0.596 | 98 | 0.635 | 98 | 0.569 | 98 | 0.739 | 98 | 0.603 | 98 |
| HBB | 0.903 | 100 | 0.707 | 99 | 0.796 | 99 | 0.725 | 99 | 0.686 | 99 | 0.635 | 99 |
| HLCS | 0.776 | 100 | 0.766 | 98 | 0.751 | 98 | 0.699 | 98 | 0.716 | 98 | 0.645 | 98 |
| HMGCL | 0.714 | 100 | 0.877 | 99 | 0.877 | 99 | 0.872 | 99 | 0.829 | 99 | 0.796 | 99 |
| IDUA | 0.853 | 100 | 0.745 | 100 | 0.722 | 100 | 0.733 | 100 | 0.744 | 100 | 0.609 | 100 |
| IVD | 0.906 | 100 | 0.695 | 96 | - | 0 | - | 0 | 0.751 | 96 | 0.555 | 96 |
| MCCC1 | 0.754 | 100 | 0.697 | 98 | 0.695 | 98 | 0.734 | 90 | 0.632 | 98 | 0.500 | 98 |
| MCCC2 | 0.797 | 100 | 0.637 | 95 | 0.601 | 95 | 0.611 | 95 | 0.574 | 95 | 0.581 | 95 |
| MMUT | 0.712 | 100 | 0.768 | 100 | - | 0 | - | 0 | 0.762 | 100 | 0.680 | 100 |
| PAH | 0.798 | 100 | 0.769 | 98 | 0.766 | 98 | 0.796 | 98 | 0.762 | 98 | 0.728 | 98 |
| PCCB | 0.796 | 100 | 0.790 | 96 | 0.773 | 96 | 0.831 | 96 | 0.725 | 96 | 0.540 | 96 |
| SLC22A5 | 0.875 | 100 | 0.725 | 97 | 0.776 | 97 | 0.780 | 97 | 0.786 | 97 | 0.624 | 97 |
| TSHR | 0.764 | 100 | 0.659 | 99 | - | 0 | - | 0 | 0.697 | 99 | 0.491 | 99 |
| Mean | 0.803 | 100 | 0.739 | 94 | 0.760 | 86 | 0.755 | 85 | 0.736 | 94 | 0.611 | 94 |
Disclaimer/Publisher’s Note: The statements, opinions and data contained in all publications are solely those of the individual author(s) and contributor(s) and not of MDPI and/or the editor(s). MDPI and/or the editor(s) disclaim responsibility for any injury to people or property resulting from any ideas, methods, instructions or products referred to in the content. |
© 2023 by the authors. Licensee MDPI, Basel, Switzerland. This article is an open access article distributed under the terms and conditions of the Creative Commons Attribution (CC BY) license (https://creativecommons.org/licenses/by/4.0/).
Share and Cite
Zadorozhny, A.D.; Rudik, A.V.; Filimonov, D.A.; Lagunin, A.A. SAV-Pred: A Freely Available Web Application for the Prediction of Pathogenic Amino Acid Substitutions for Monogenic Hereditary Diseases Studied in Newborn Screening. Int. J. Mol. Sci. 2023, 24, 2463. https://doi.org/10.3390/ijms24032463
Zadorozhny AD, Rudik AV, Filimonov DA, Lagunin AA. SAV-Pred: A Freely Available Web Application for the Prediction of Pathogenic Amino Acid Substitutions for Monogenic Hereditary Diseases Studied in Newborn Screening. International Journal of Molecular Sciences. 2023; 24(3):2463. https://doi.org/10.3390/ijms24032463
Chicago/Turabian StyleZadorozhny, Anton D., Anastasia V. Rudik, Dmitry A. Filimonov, and Alexey A. Lagunin. 2023. "SAV-Pred: A Freely Available Web Application for the Prediction of Pathogenic Amino Acid Substitutions for Monogenic Hereditary Diseases Studied in Newborn Screening" International Journal of Molecular Sciences 24, no. 3: 2463. https://doi.org/10.3390/ijms24032463
APA StyleZadorozhny, A. D., Rudik, A. V., Filimonov, D. A., & Lagunin, A. A. (2023). SAV-Pred: A Freely Available Web Application for the Prediction of Pathogenic Amino Acid Substitutions for Monogenic Hereditary Diseases Studied in Newborn Screening. International Journal of Molecular Sciences, 24(3), 2463. https://doi.org/10.3390/ijms24032463